How Can Remote Sensing Help in Detecting the Threats to Archaeological Sites in Upper Egypt?

1
Antiquity of Southeastern Europe Research Centre, University of Warsaw, Warsaw 00-927, Poland
2
Institute of Archaeology, University of Warsaw, Warsaw 00-927, Poland
Geosciences 2017, 7(4), 97; https://doi.org/10.3390/geosciences7040097
Submission received: 27 July 2017
/
Revised: 12 September 2017
/
Accepted: 28 September 2017
/
Published: 2 October 2017
(This article belongs to the Special Issue Remote Sensing and Geosciences for Archaeology)
Abstract
:The analysis of contemporary and archival satellite images and archaeological documentations presents the possibility of monitoring the state of archaeological sites in the Near East (for example, Palmyra in Syria). As it will be demonstrated in the case of Upper Egyptian sites, the rapid growth of agricultural lands and settlements can pose a great threat to sites localized on the border of fields and the desert. As a case study, the Qena district was chosen, a region of significance for the history of ancient Egypt. To trace the expansion of agriculture and the development of modern settlements, a synthesis of archival maps (from the last 200 years), and archival and contemporary satellite images was created. By applying map algebra to these documents, it was possible to determine areas which may be marked as “Archaeological Hazard Zones”. The analysis helped to trace the expansion of agricultural areas during the last 200 years and the influence of both—ancient Egyptians and the Nile—on the local landscape.
1. Introduction
During the Predynastic Period (c. 3150 BC–c. 2686 BC), Upper Egypt was one of the main areas for the development of early civilizations. Archaeological sites important for this period are located in the Qena Bend of the Nile valley, but also to the south and to the north of it, in the Qena district. It includes sites like: Abydos, Huw, Dendera, Naqada, Armant, and Gebelein, the most important places of the Predynastic Period. One of the models of the predynastic settlement pattern [1] suggests that necropoli and settlements were located on the border of the floodplain and the lower desert.
Nowadays, the development of urbanism and agriculture in Upper Egypt poses a great threat to fragile archeological areas located on that former border and can lead to the complete destruction of these unique historical landscapes [2,3]. The spread of agriculture can be traced back to the building of the Aswan High Dam, but also to the period of introducing diesel pumps for the improvement of irrigation systems [4], and to the unstable period after the countrywide unrest in 2011.
A comparison of agricultural lands visible on archival maps, of P. Jacotin’s map from Napoleon’s expedition in Egypt in 1798–1801 [5], and the Survey of Egypt from 1944 [6], with agricultural lands visible on contemporary satellites, shows how rapid and tremendous the spread of agricultural lands in this area is (Figure 1).A process similar to this was also confirmed through the image interpretation of archival satellite images from the CORONA mission (from 8 November 1968 (Fore) and 29 June 1969 (Aft)) [7]) and historical images from Google Earth [8].
The goal of this article is to present how remote sensing can help to measure the possible threats posed by the agricultural expansion of archaeological sites and consequently to help in their protection. The detection of temporal changes in land use is “the process of identifying differences in the state of an object or phenomena by observing it at different times. Essentially, it involves the ability to quantify temporal effects using multitemporal data sets” [9]. Such an approach is often used in urban growth detection, and with the help of analyzes, LANDSAT archival images, e.g., [10,11].
A study of croplands mapping and their change with time for the whole Nile Valley and Nile Delta was conducted by Xu et al. [12]. A total of 961 LANDSAT images (TM/ETM+/OLI) images 1984–2015) were used to conduct an annual frequency detection of agricultural land expansion. In their results, the authors noted a gradually increasing tendency in the “distribution of cropland dynamics from the Nile Valley towards desert”. However, the article does not show in a detailed way how this dynamic looks like at the Qena bend of the Nile.
Recently, a number of papers describing change detection in the regions of the Nile Delta and Dakhla Oasis were published [13,14,15,16,17]. Their main focus was to present land degradation, urbanization, and the status of water resources. But the Nile Delta and Dakhla Oasis landscapes, both ancient and contemporary, are completely different from Upper Egypt’s.
A similar analysis was also used to monitor urban and agricultural changes on the eastern side of the Qena Bend in Upper Egypt [18]. Abd El-Aziz processed 5 LANDSAT images (MSS-TM-ETM-OLI) from 1972, 1984, 1998, 2006, and 2013, and as an outcome, the area was split into three groups: an urban area, cultivation area, and water surfaces, with a sub pixel classification method. The result compares categorized images from different periods and highlights some areas where towns and agricultural lands have spread. However, the above described approaches do not include the possible influence of land use changes on archaeological sites, nor do they highlight areas were sites could be under threat. On the other hand, a paper published by Ahmed and Fogg [19] describes the possible impact of groundwater and the expansion of agricultural land on the archaeological sites in Luxor. One of the many methods used for creating recommendations in order to mitigate the deterioration of the archaeological sites is the supervised classification of 3 LANDSAT images (MSS-TM-ETM+) from 1982 to 2011. However, this paper does not mark which sites and how they are threatened by agricultural expansion.
Additionally, when satellite imagery analysis is used in archaeological research, it often focuses on the detection of new sites or features, e.g., [20,21,22], instead of a threat assessment. Just recently, a new approach of visualizing changes and their effects on archaeological sites has become a focus for research, especially for areas heavily influenced by war and looting such as the Near East, e.g., [23,24]. Still, there is a need to develop a low-budget and fast method for quantifying changes causing the destruction of archaeological sites. Such methods have the potential to support Cultural Management authorities.
2. Materials and Methods
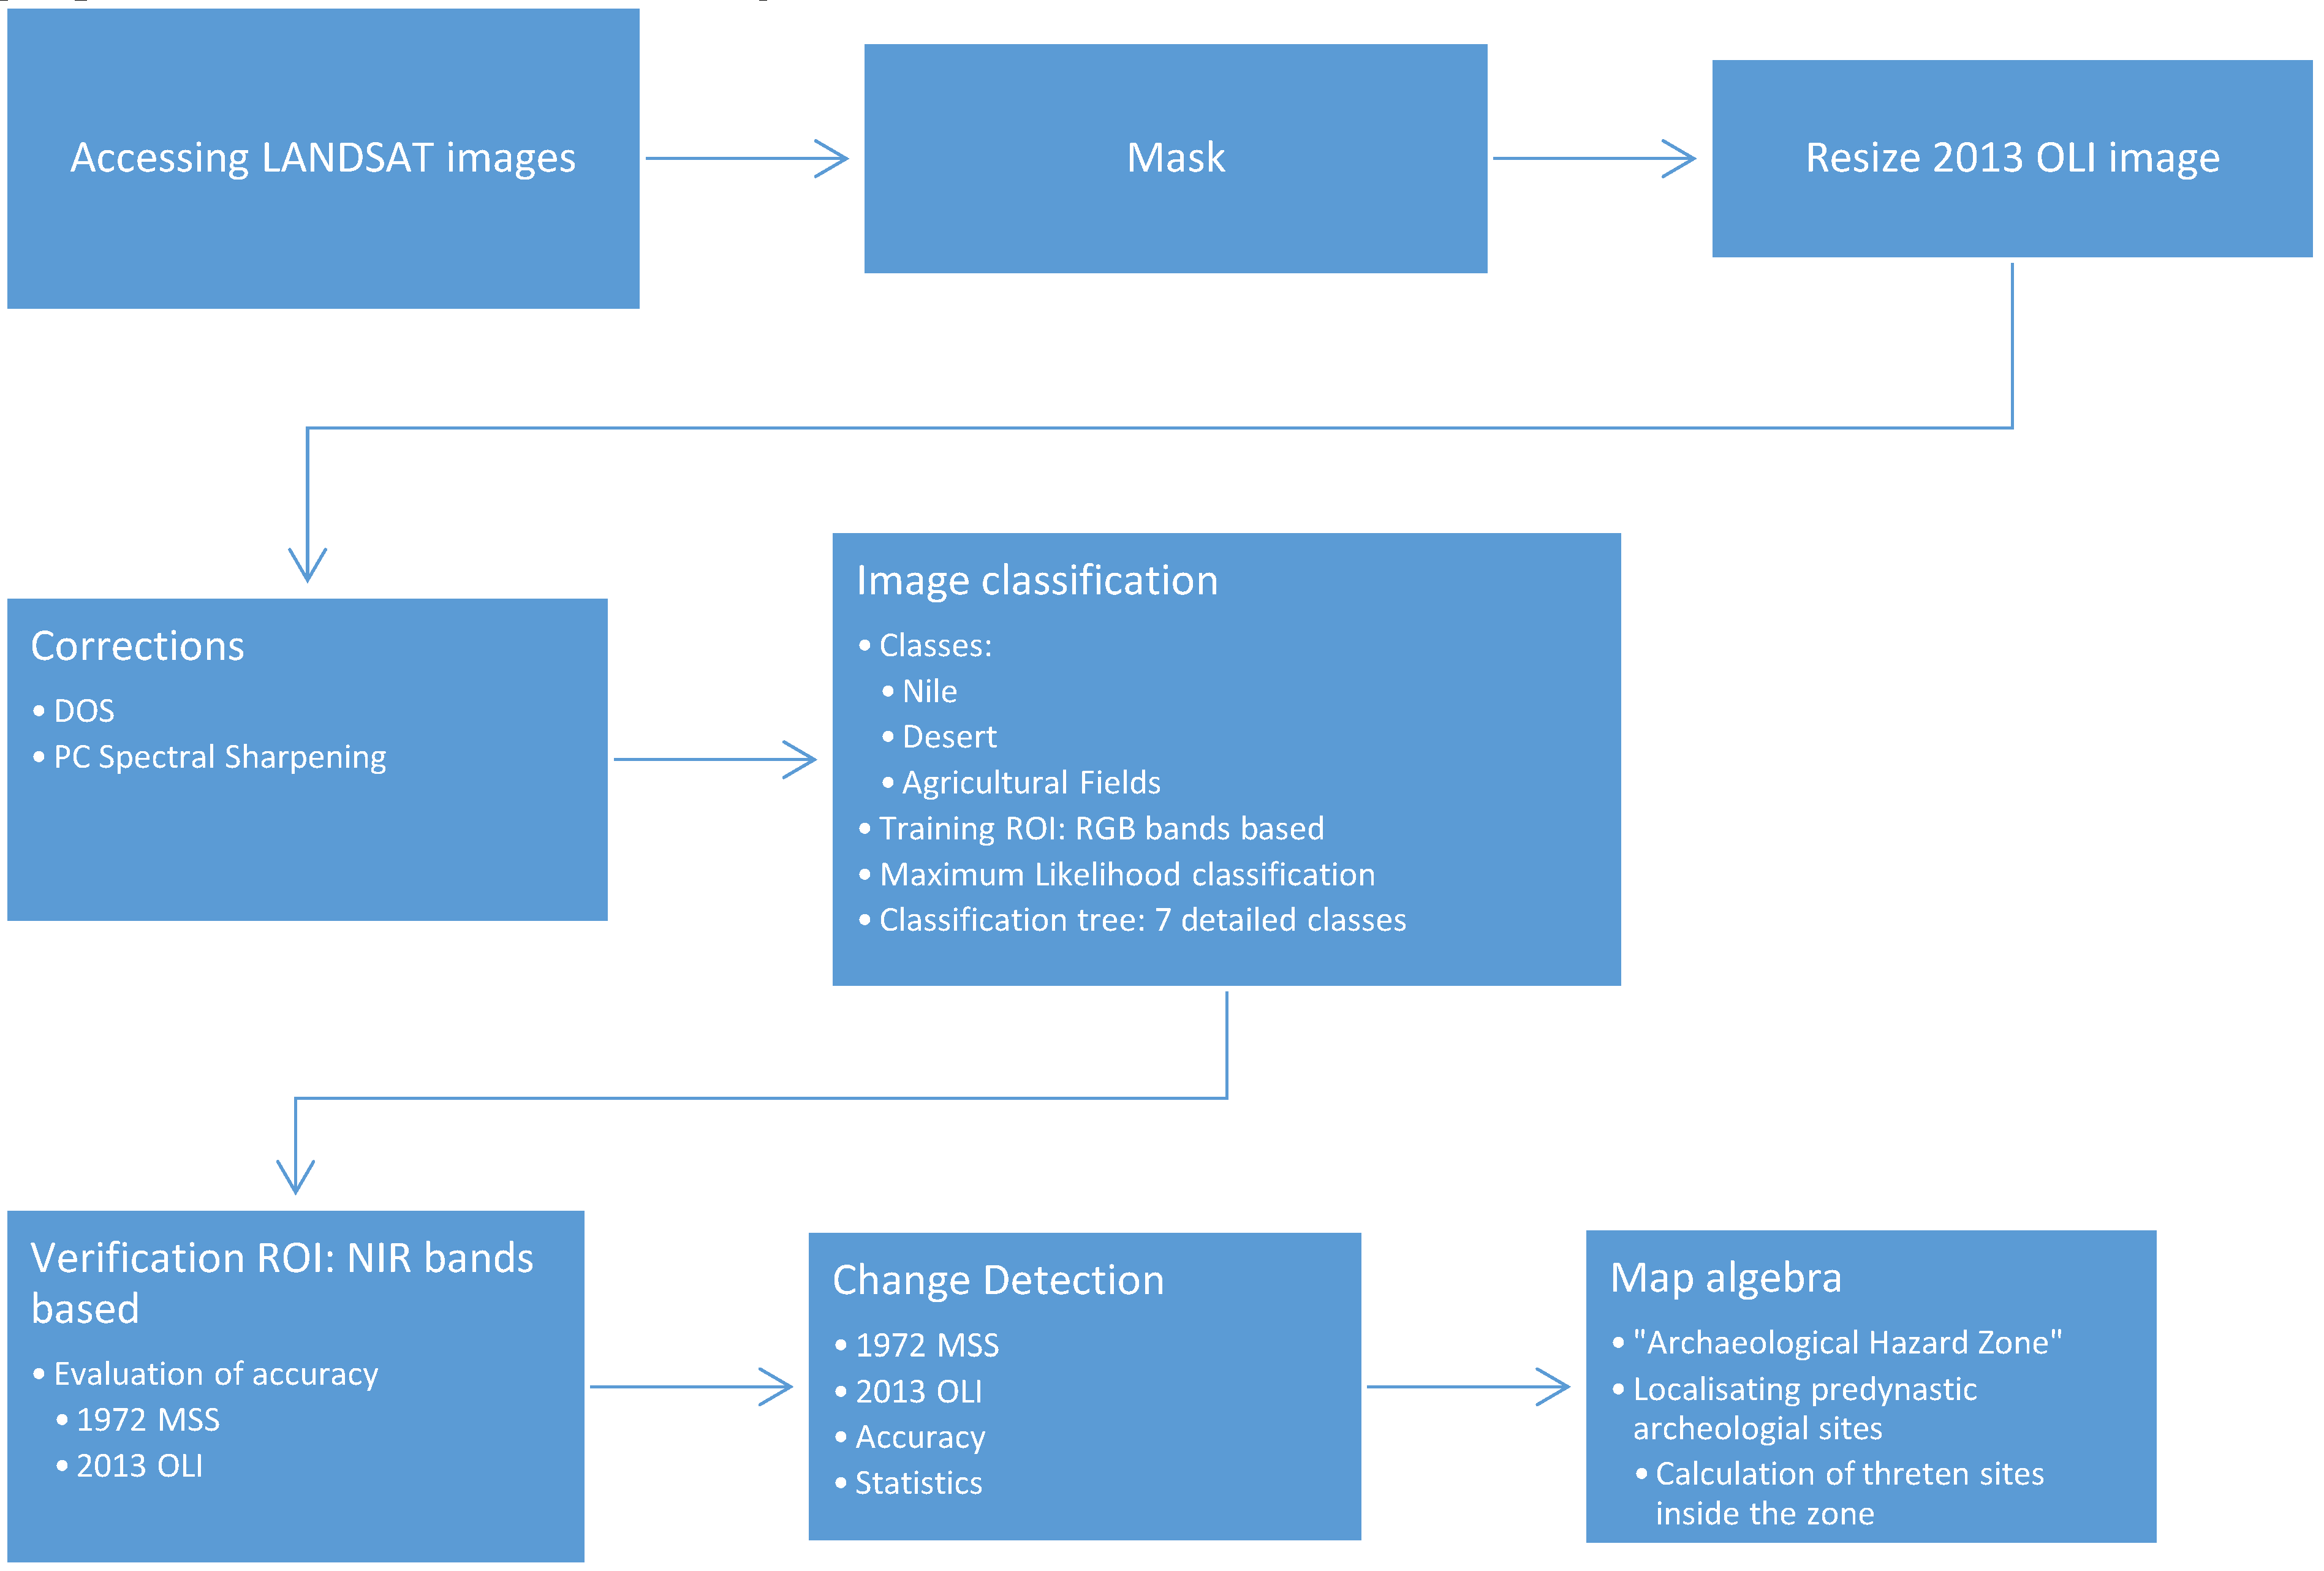
As mentioned above, it was noted that a key threat to archaeological sites in the Upper Egypt area is the development of cultivated lands. The detection of agricultural areas’ changes followed the proposed workflow below (see Figure 2).
The first step was to access two LANDSAT images from the United States Geological Survey (USGS) website [25]. The goal was to compare two images from the widest possible time span, which could show the landscape before and after the construction of the Aswan High Dam, but also, which could take the unstable period after the countrywide troubles in 2011 into consideration. Additionally, two images were chosen for classification because of the final goal of the analysis, which was to deduct two images and to highlight one area which in 1972 was a desert and in 2013 was covered in fields (described in the Results and Conclusion section).
Therefore, it was decided that images for one scene (path 175/row 04) would be used from Multispectral Scanners (MSS): LANDSAT 1 made on 4 October 1972 (during construction of Aswan High Dam) and from the Operational Land Imager (OLI), LANDSAT 8, from 22 April 2013, both of which were cloud free. The difference in time between the two images was 41 years.
The MSS sensor had a spectral resolution of 0.5–1.1 µm (bands from 4 to 7) and a spatial resolution of 60 m [26]. OLI had a spectral resolution of 0.43–12.5 µm (bands from 1 to 7) and a spatial resolution of 30 m [27]. The next step was to create a mask excluding high desert areas unnecessary for the current purposes of analysis. Subsequently, the image from 2013 was resized to the resolution of the image from 1972. This was necessary for the future analysis’ compatibility. The next step was to process the images without the use of Radiometric Correction. Dark Object Subtraction was used for atmospheric correction. Principal Components (PC) spectra sharpening was also used to receive a better-quality image.
The following step was the classification of images. Firstly, an unsupervised, k-means classification was created, which allowed for the grouping of pixels into seven classes: Nile, fields with crops, fields without crops, high desert, desert, wadi, and infrastructure. However, the resulting image (Figure 3) contained too much information for the purposes of further analysis.
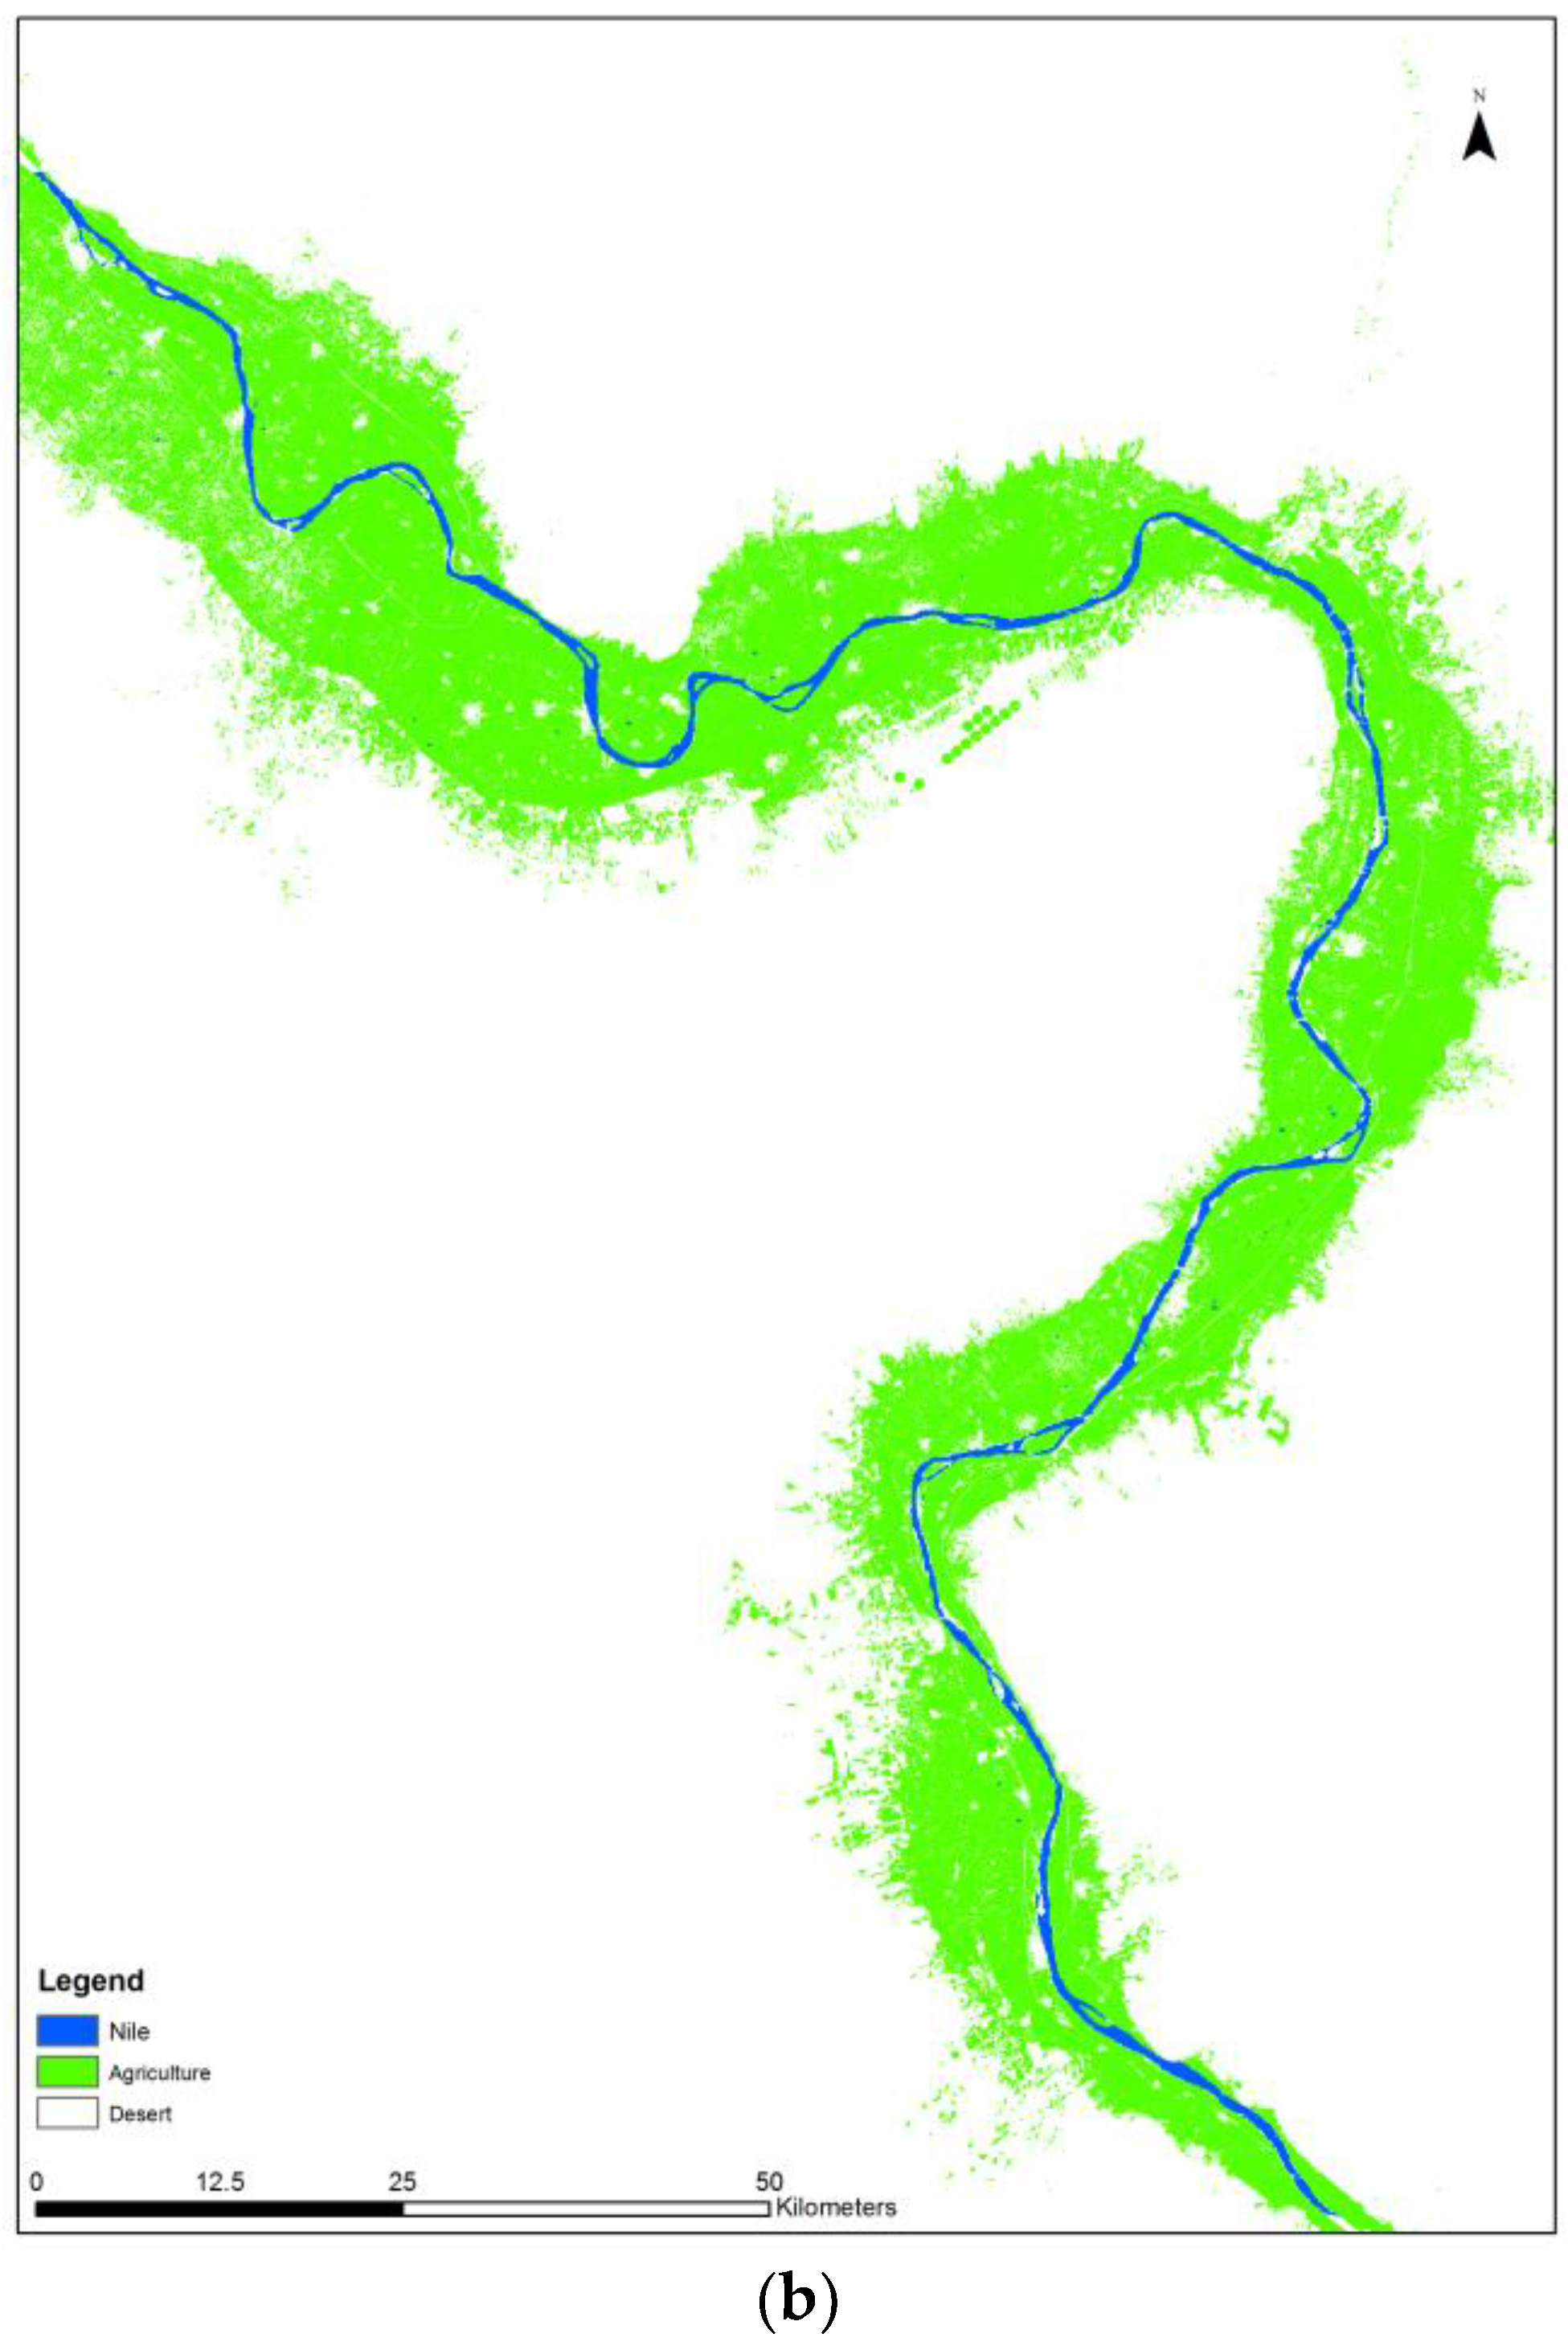
Therefore, a new classification was created consisting of only three classes: Nile, desert, and agricultural lands. This classification focuses on detecting changes at predynastic archaeological sites located at the border of previous floodplains and the desert, marked earlier due to the threat of destruction. Training and verification of “Regions Of Interest” (ROI) were created for each image: the former with the use of Red-Green-Blue (RGB) bands, the latter with the use of Near Infra-Red (NIR) bands. First, ROI were chosen based on experience from field work in Egypt, and were supplemented with a photo interpretation of Google Earth images. Second, ROI were generated randomly as pixel-based validation samples to calculate the accuracy. Supervised Maximum Likelihood Classification (MLC) was chosen as a classification method [11]. The final step was to assess the accuracy of the classified images. Two sources of information were used: pixels classified on satellite images and verification pixels prepared earlier from NIR bands. This step resulted in the creation of two matrices describing the overall accuracy—the proportion of correctly classified pixels to general number of pixels [28]. Further steps contain analyses of the classification results and an interpretation of the detected changes.
3. Results
The results of the work flow were two classified images showing cultivation areas in 1972 and in 2013 (Figure 4). The overall accuracy of the image from 2013 is 93%, which is a good result in comparison with other works [11,12]. However, it is not possible to compare the overall accuracy for the same study area as neither of the previously mentioned papers [18,19] describe it. The chosen classification method differs from the method used by Abd-Aziz [18] for the same area and from the one used by Xu et al. [12] for the whole Nile Valley, but all of them were supervised classifications. Nevertheless, MLC is good and often used as a classification method [11] and its results were satisfactory concerning monitoring the state of archeological sites.
But a problem did appear concerning the LANDSAT MSS 1972 image: the chosen image contained noise, which can be classified as Transient Detector Failure or Band Striping [29]. The noise is visible on bands 5,6, and partly 7. It appears visually as a set of parallel lines crossing the image diagonally (Figure 5). During several consultations, some methods of removing the noise were considered, like destriping or Unstandardized Principal Components Analysis (PCA) [30], but none of them seemed to be a satisfying method for removing the noise visible on the MSS image. However, for the purposes of an analysis aimed at archaeological sites threatened by agriculture, it seems that the noise is only a minor problem.
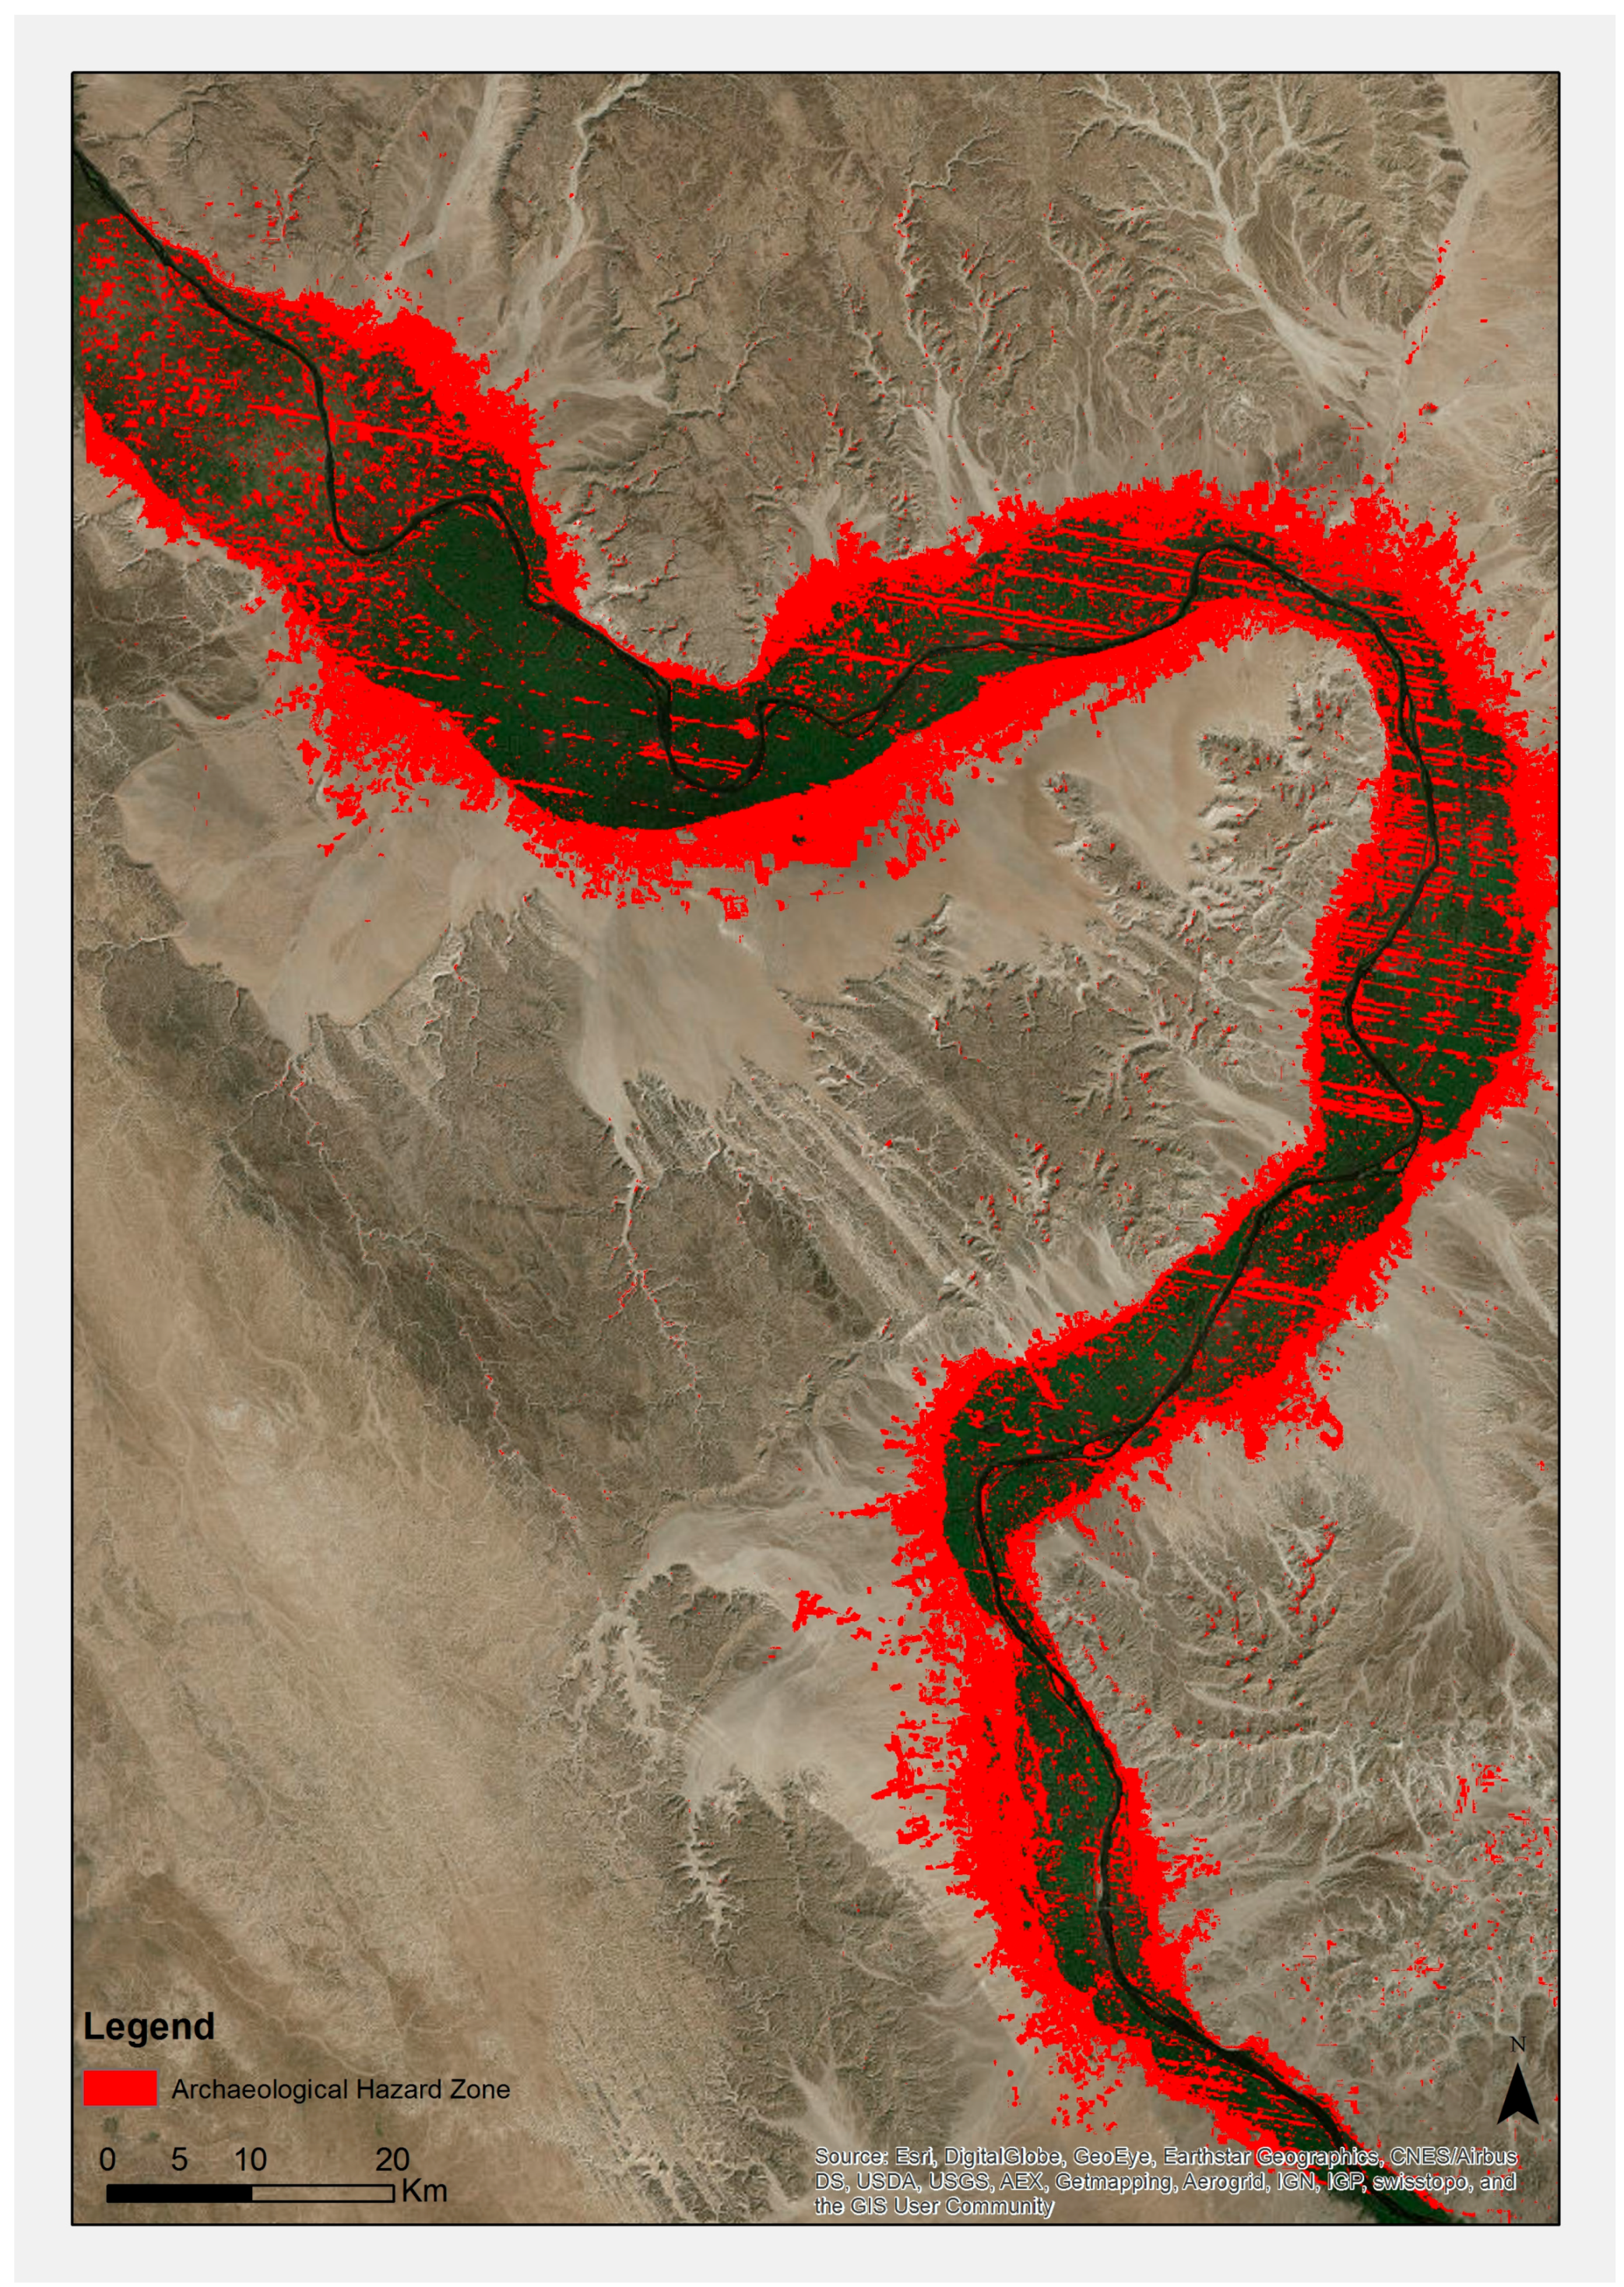
For abetter visualization of the threats, a map algebra of two classified images was generated in GIS. From the 2013 agricultural class, a 1972 agricultural class was deducted. This approach, a simple deduction of two images, gave a clear visualization of areas, in Upper Egypt, under threat by agricultural development. A so-called “Archaeological Hazard Zone” highlights the area which in 1972 was part of the desert, and in the 2013 was covered by fields (Figure 6). It appeared that, during last the 41 years, the field area has increased by 2052.65 m2, which is an increase of 109.11%. The fragile border of the desert and agricultural lands, which have existed for a millennia, was shifted and therefore the sites located above the floodplain might be threatened. None of the papers mentioned above used map algebra and a deduction process to highlight the areas that had changed from desert to fields, nor any of them detailed, described, or analysed which sites could be threatened by those changes in the future.
4. Discussion
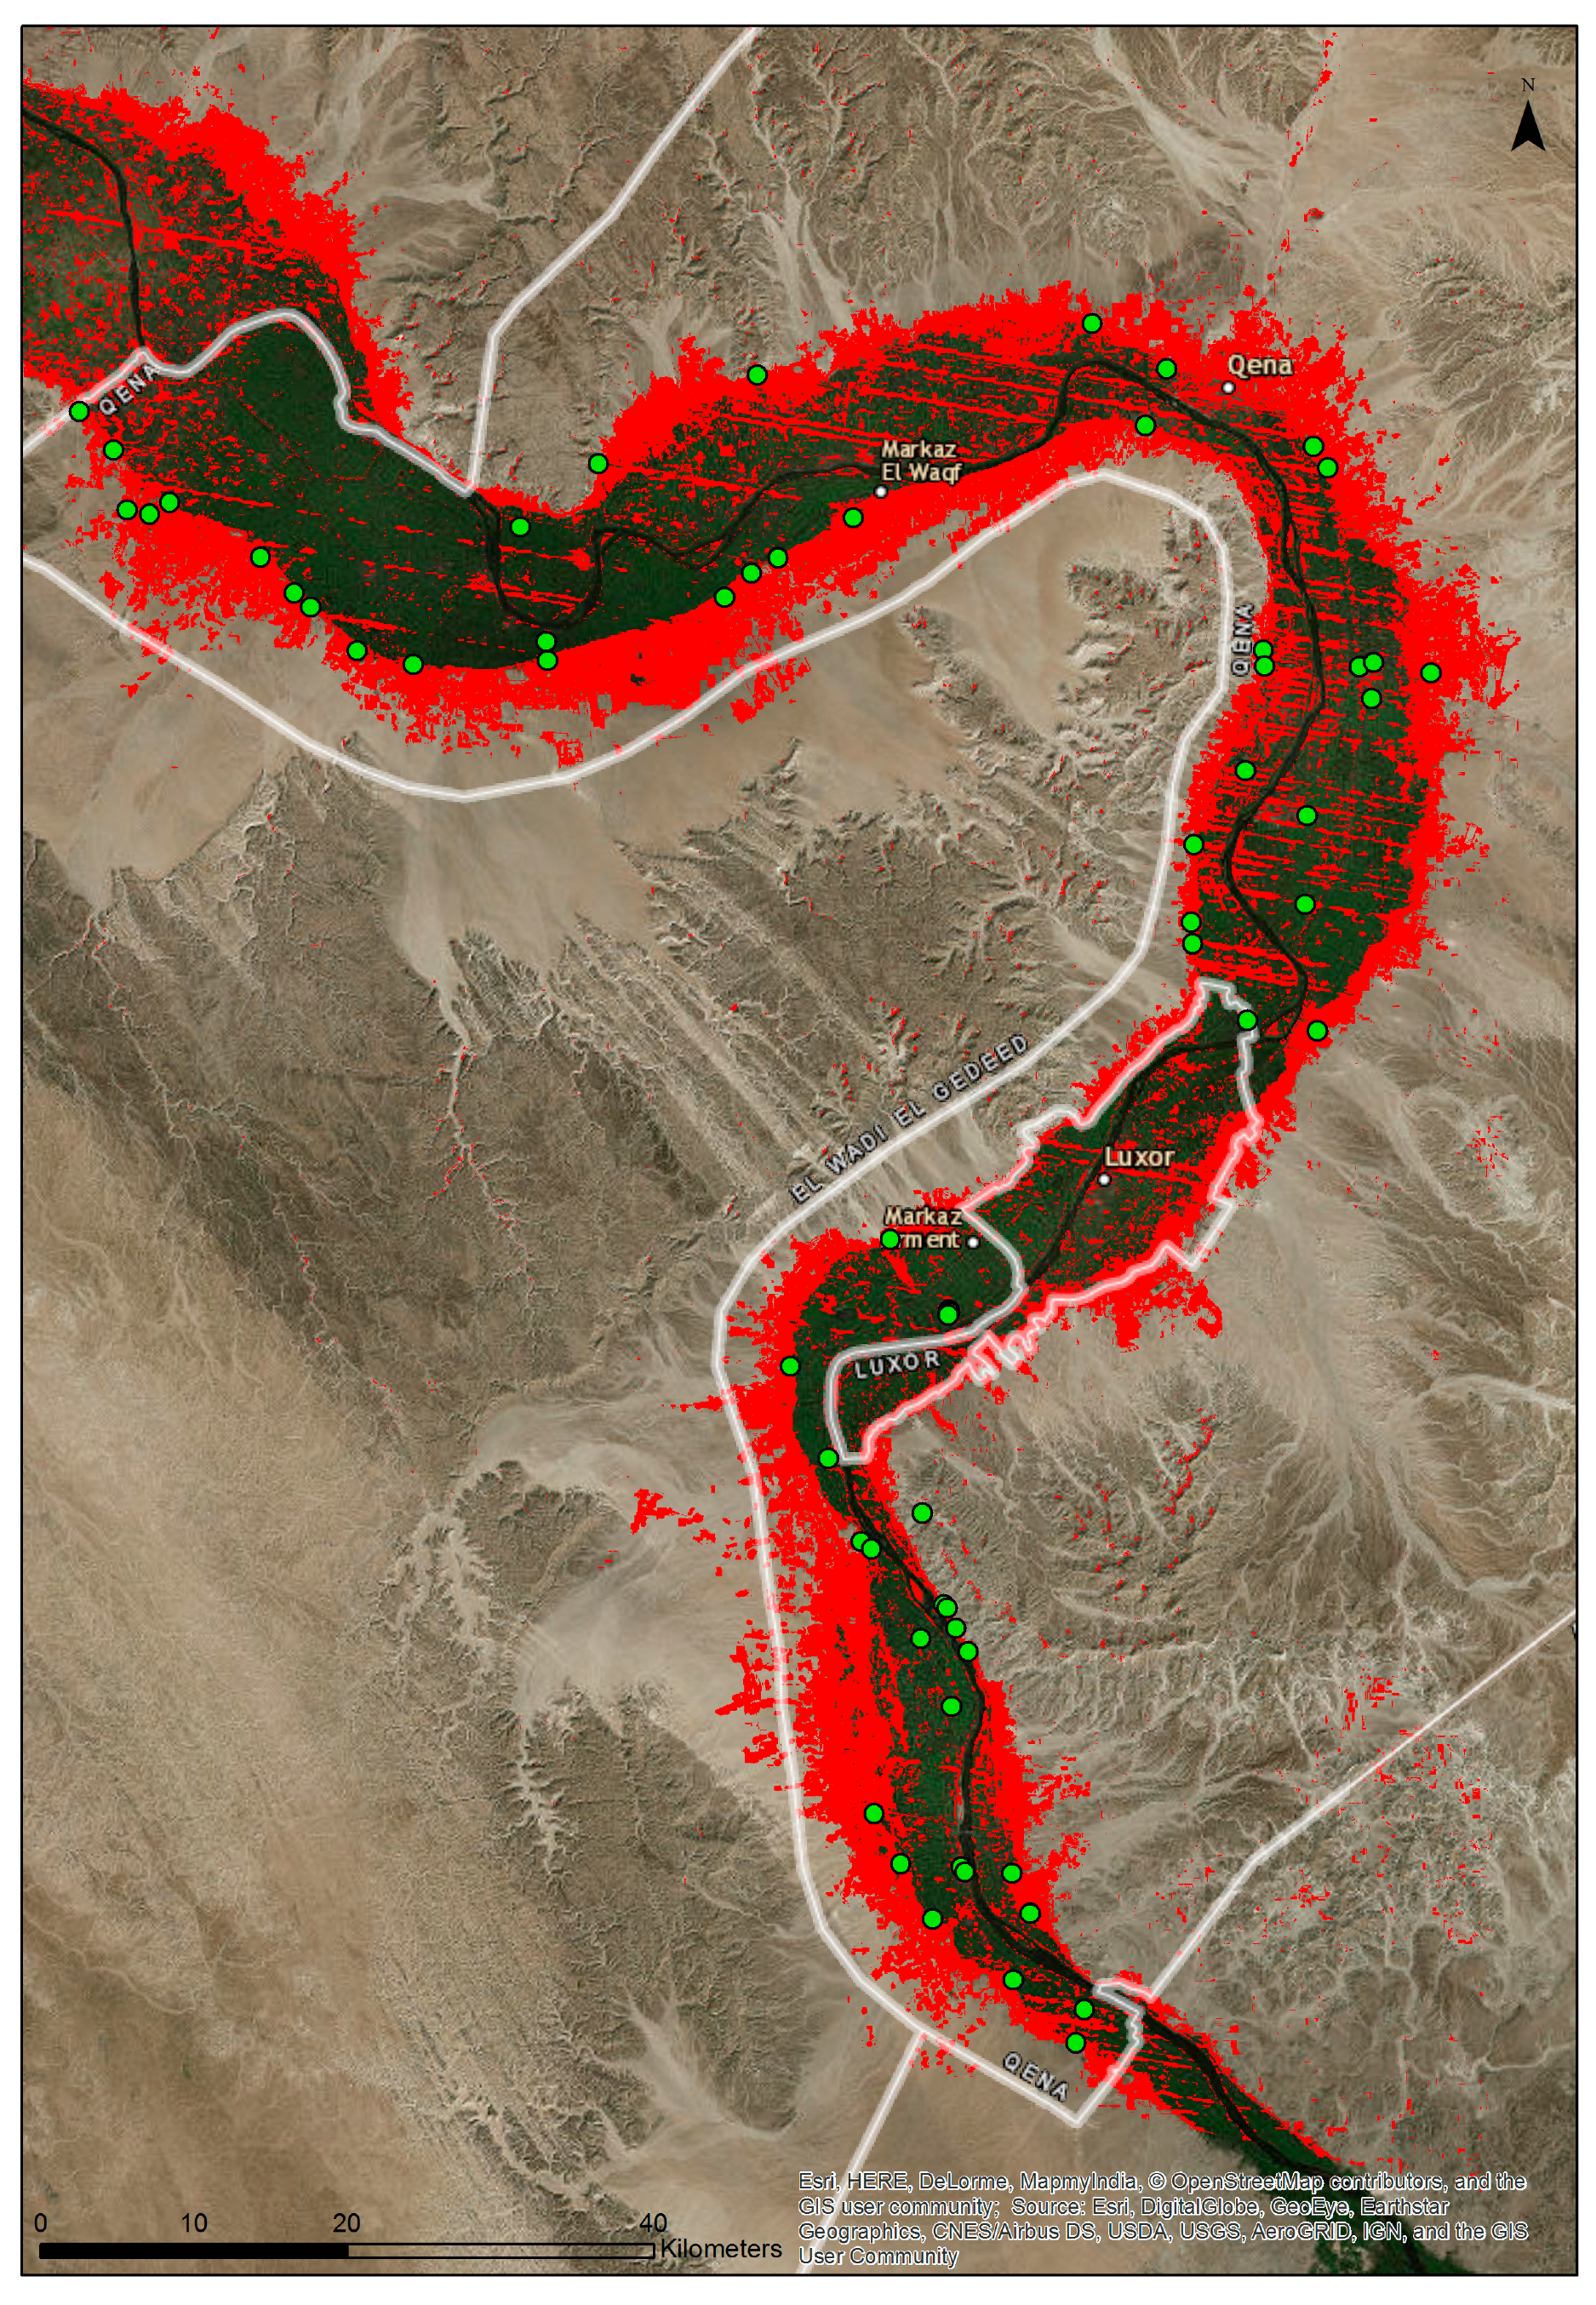
To fully measure how the development of agriculture in Upper Egypt threatens archaeological sites, it is necessary to locate the sites on the map. Sites were identified on Google Earth on the basis of maps and descriptions from several publications [31,32], including maps published by William Matthew Flinders Petrie [33]. A total number of 63 known sites were marked as points, and, if possible, as polygons, and saved in a *.kmz format. Subsequently, the Google Earth format was converted into a shape format, which allowed the addition of a descriptive data base. The data base includes information about the sites such as: name; Supreme Council of Antiquities inventory number; coordinates; legal status of the site; approximate size of the site (if possible); photo interpretation of the features observed through satellite images; if the site is located in the “Archaeological Hazard Zone”; field observations (to fill during survey); threats visible on the sites (to fill during survey); other comments.
The last step was to use a selection tool in GIS and to see how many and which of the sites are in the “Archaeological Hazard Zone”: 35 sites might be threatened by landscape change which occurred between 1972 and 2013, which is 55% of all known sites located in the discussed area (Figure 7).
Table S1 presents all known archeological sites and their status inside the “Archeological Hazard Zone”, with a verification of possible destruction through nowadays high-resolution satellite images (like Google Earth, Bing or ESRI’s base maps. The oldest accessible images were from 2003). Additionally, a result of the analysis of the surroundings (not land use on the sites themselves, but around them) from a different time scope are presented, from the 1800s (based on P. Jactin’s maps [5]), 1940s (based on Survey of Egypt maps [6]), 1968–1969 (based on archival images from Corona Mission [7]), and 1972 and 2013 (based on chosen LANDSAT images).
Forty-four (70%) sites’ surroundings have changed from desert to agriculture, urban, or from agriculture to urban since the 1800s. Sixteen sites’ (25%) landscape changed between the 1800s and 1940s and three sites (5%) between the 1940s and 1968–1969. In the case of 37 sites (59%), the change of surroundings happened between 1972 and 2013. However, in most of the cases of the sites which remain outside of the “Archaeological Hazard Zone” in both 1972 and 2013, they are located in the same surroundings: agricultural or urban. For 24 (38%) sites, a photointerpretation of high resolution images confirmed changes on the sites themselves [3] (in the case of 18 sites, the changes on the sites were not possible to estimate because they were already located in an agricultural or urban context).
An analysis of the comparison of the close surroundings of archaeological sites in Qena’s bend during last 200 years shows that the landscape was already changing in the past, but was never as rapid as during last forty years.
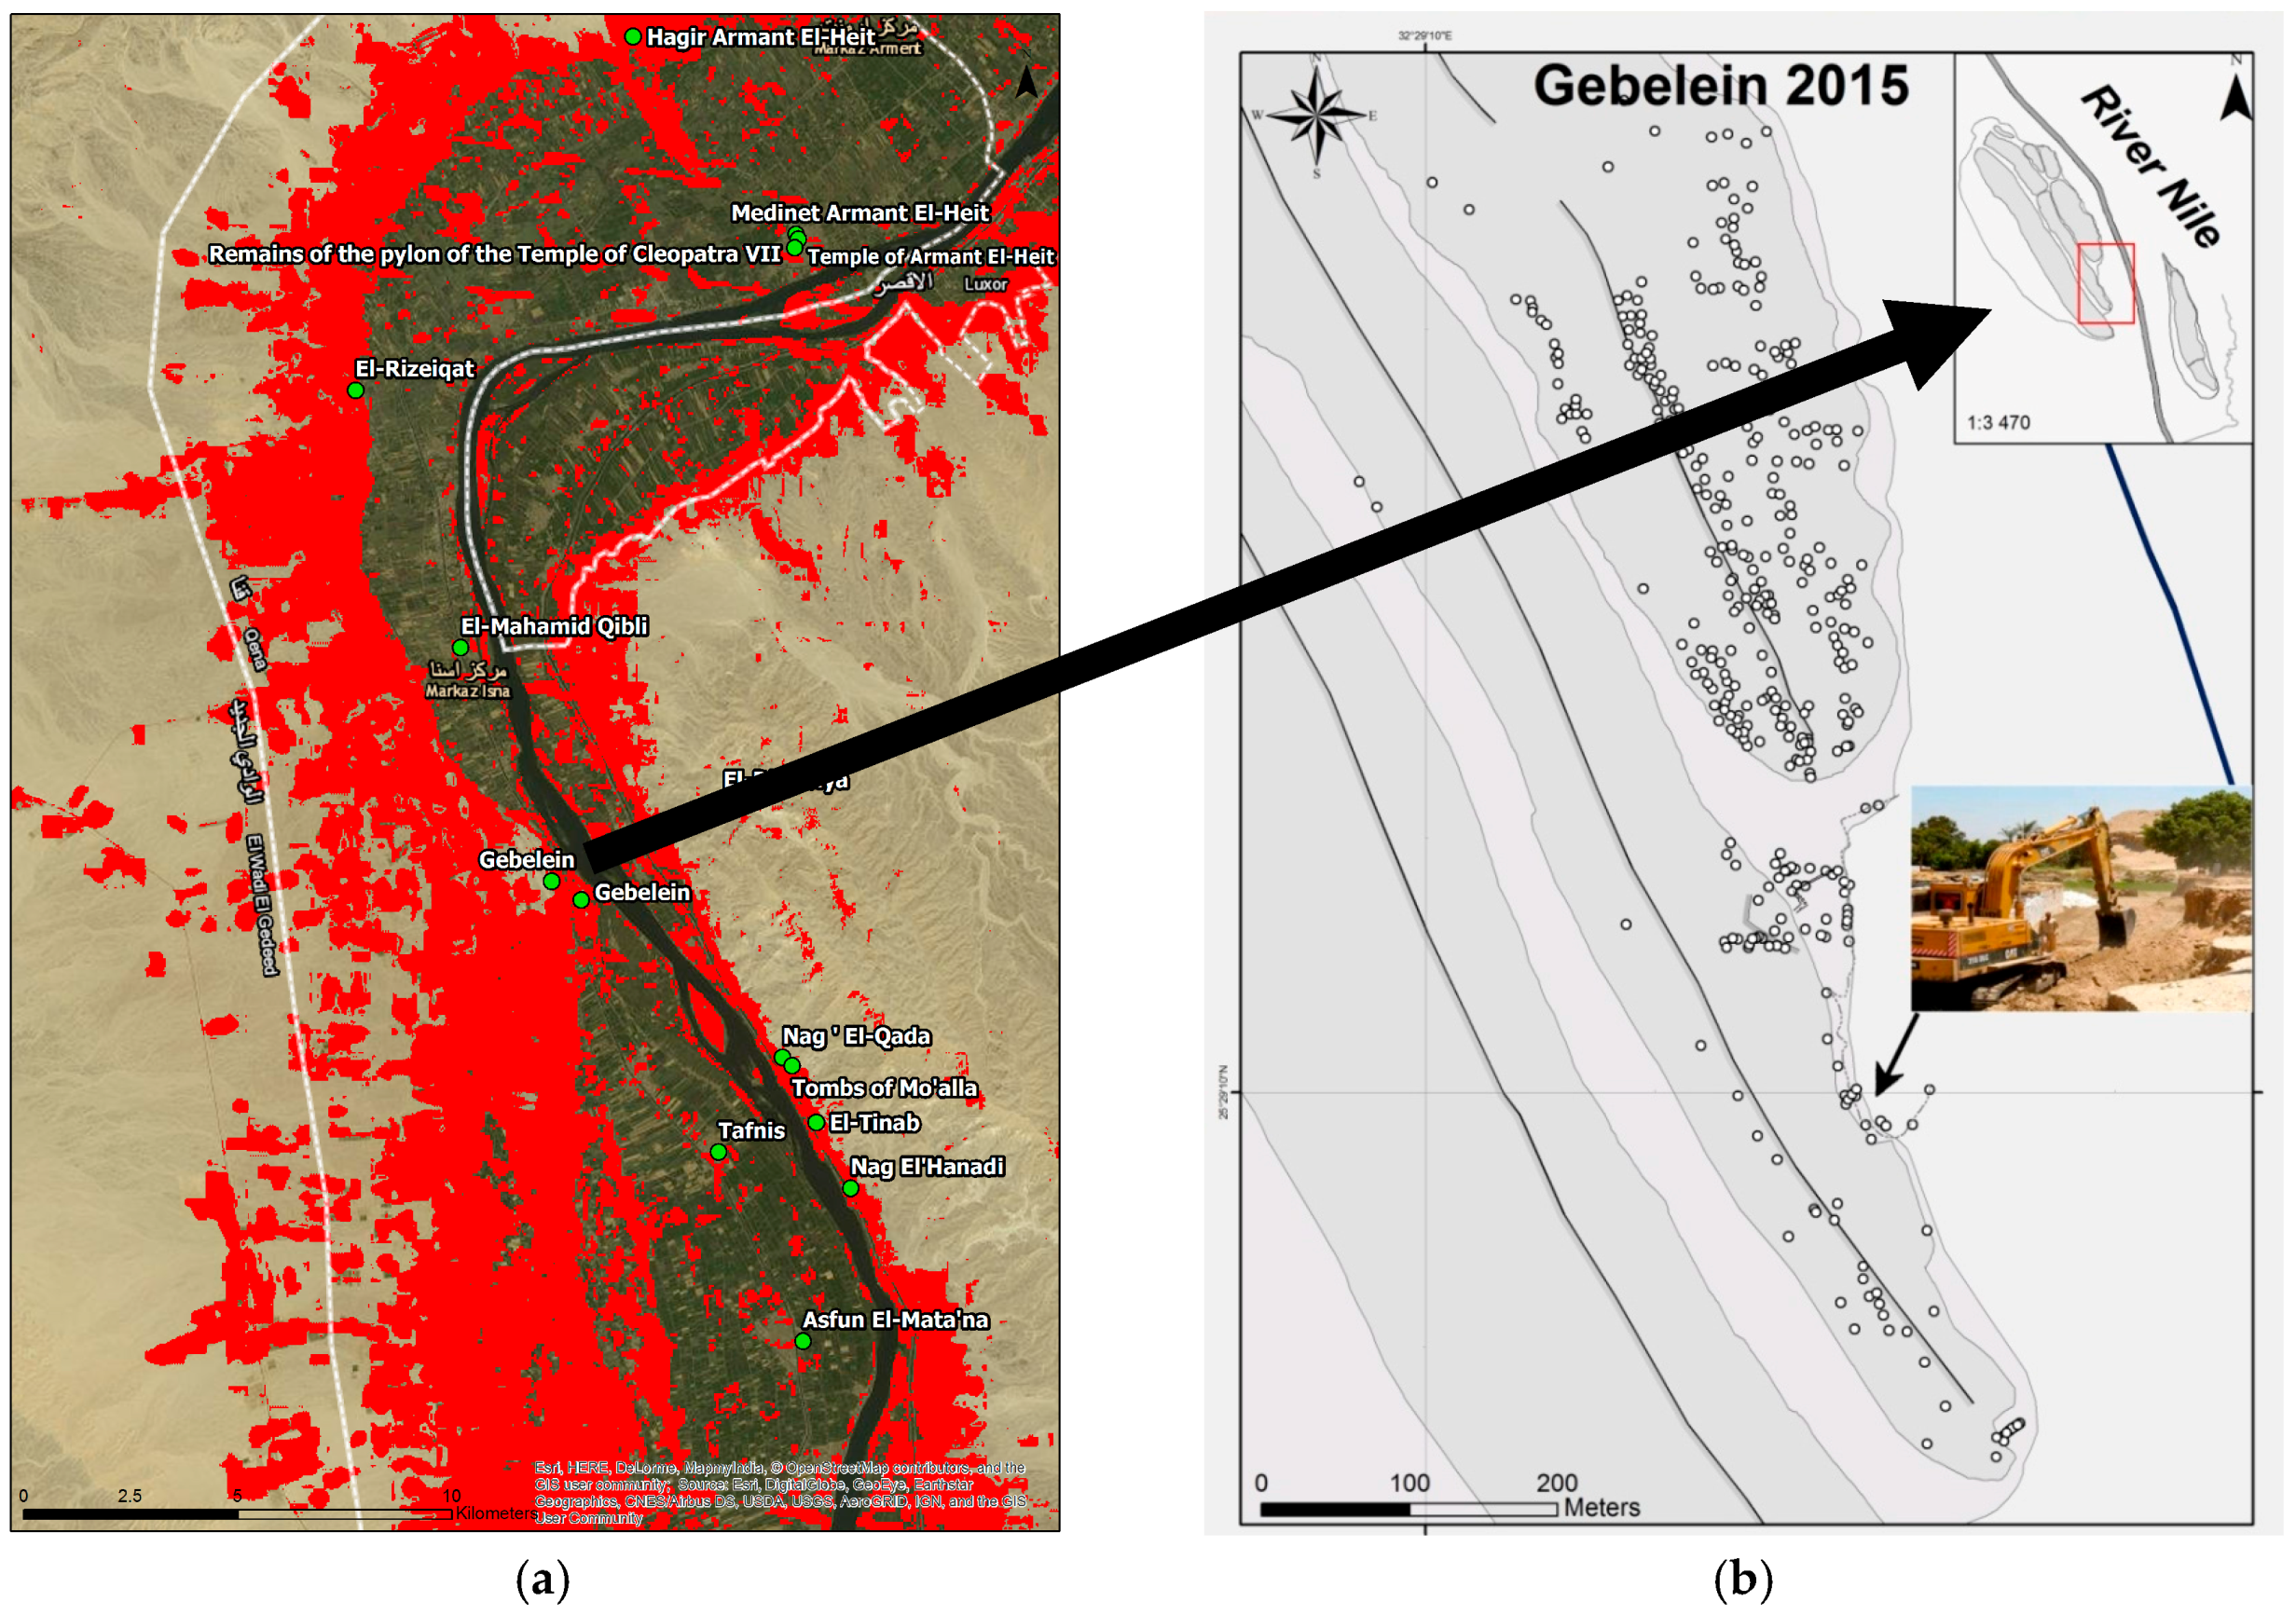
The data described above should be verified in the field, every possibly threatened site should be visited, and the possible destruction of the sites should be examined. The “Archaeological Hazard Zone” and the location of the sites can be imported onto a GNSS (Global Navigation Satellite System) tool with a mobile GIS application with a chosen part ofthe detailed satellite image saved as geoTIFF, and it can be used during field prospection, helping to locate not only the site itself, but also zones of destruction. A similar process took place at the beginning of the Gebelein Archaeological Project. The goal of the research at the Gebelein area (Figure 8) [2,34] is to document archaeological resources and the level of threat caused by modern urbanism and agriculutre, visible on the site complex. Gebelein’s (No. 45 in Table S1) surroundings have changed quite drasticly since the 1800s, from desert to urban and agricultural areas. The site is inside the “Archaeological Hazard Zone” and through the contemporary satellite images it is visiable how agricultural lands spread on the site. A photo-interpretation of archival images from Google Earth dates the biggest change to the period between 2009 and 2013 [2].
5. Conclusions
The goal of the article was to describe a practical remote sensing method that can help in detecting whether archaeological sites are threatened by the expansion of agriculture. Additionally, the analysis presented the comparison archaeological sites’ surroundings during the last 200 years. The result showed that the landscape in Upper Egypt changed in the past; however, during the last forty years, the change become more rapid and covering more lands. Land use around known archeological sites advanced from desert to agricultural and urban land.
This method might help Cultural Management authorities in protecting local heritage. The result of the method shows not only the sites which might be endangered, but also allows for the identification of recently threatened sites and evaluation of any threats to these sites.
The result of field prospection in Gebelein allowed not only to confirm the location of the sites inside the “Archaeological Hazard Zone”, but also allowed us to determine which areas of the Gebelein site complex are the most threatened by modern development and hence which should be documented first. In the case of Gebelein, the project confirmed some recent destructions oflarge parts of the central necropolis, made by bulldozers, and the spread of the fields in valleys between the hills of Gebelein. As a result of the project, specialized maps were made, which clearly showed the scale of the destructions and the threats at Gebelein. This helped the local Inspectorate of Antiquities in Esna to take necessary steps in order to prevent further spreading of the agricultural fields and contemporary settlements. This illustrates both the threats facing sites in the area, and how targeted investigation based on the results of analyses can support and empower local authorities to take remedial action.
The method described in the article could be applied on any comparable area before archaeological field prospections and help in planning and prioritizing the archeological interventions, before sites are completely destroyed. It also allows to not only visualize the magnitude of changes in the landscape during the last 50 years, but also to quantify the number of sites which are currently under threat.
Supplementary Materials
The following are available online at www.mdpi.com/2076-3263/7/4/97/s1, Table S1: The list of known archeological sites in Qena district and time change of their surroundings.
Acknowledgments
Research for this article is part of the Gebelein Archaeological Project and was possible thanks to a scholarship of the Polish Centre of Mediterranean Archaeology, of the University of Warsaw, and the finical support of the Consultative Council for Students’ Scientific Movement at the University of Warsaw, and the University of Warsaw Foundation. The author would like to express gratitude for the help of Krzysztof Misiewicz, Wojciech Ejsmond and Cezary Baka, Anastazja Stupko-Lubczyńska, Marta Grzegorek, and Daniel V. Takacs.
Conflicts of Interest
The authors declare no conflict of interest.
References
- Kemp, B.J. Ancient Egypt Anatomy of a Civilization, 2nd ed.; Routledge: New York, NY, USA; Oxon, UK, 2006; pp. 31–35. [Google Scholar]
- Ejsmond, W.; Chyla, J.M.; Baka, C. Report from field reconnaissance AT Gebelein, Khozam and El-Rizeiqat. Pol. Archaeol. Mediterr. 2015, 25, 265–274. [Google Scholar]
- Chyla, J.M.; Ejmond, W. Wyniki Rekonesansu na Stanowiskach Archeologicznych El-Amra i Hu. In Medjat: Egyptological Studies; Word Press: San Francisco, CA, USA, 2016; Volume 4, pp. 13–32. [Google Scholar]
- Hopkins, N.S. Irrigation in contemporary Egypt. In Agriculture in Egypt: From Pharaonic to Modern Times Proceedings of the British Academy, 1st ed.; Bowman, A.K., Rogan, E., Eds.; Oxford University Press: Oxford, UK, 1999; Volume 96, pp. 367–385. ISBN 978-0-19-726183-5. [Google Scholar]
- Jacotin, P. Carte Topographique de l'Égypte et de Plusieurs Parties des Pays Limitrophes, Levée Pendant L'expédition de L'armée Française, par les Ingénieurs-Géographes, les Officiers du Génie Militaire et les Ingénieurs des Ponts et ChaussesAssujettie aux Observations des Astronomes, Construite par M. Jacotin, Colonel au Corps Royal des Ingénieurs-Géographes Militaires, Gravée au Dépôt Général de la Guerre à L'echelle de 1 Millimètre pour 100 Mètres. Publiée par Ordre du Gouvernement [Document Cartographique], 1st ed.; C.L.F. Panckoucke: Paris, France, 1818. [Google Scholar]
- Survey of Egypt. Qus; Khuzam; El Shaghab; Kiman el-Matana, 1st ed.; Department of Survey and Mines: Cairo, Egypt, 1944. [Google Scholar]
- CORONA Atlas of the Middle East. Centre for Advanced Spatial Technologies, University of Arkansas. US Geological Survey. Available online: http://corona.cast.uark.edu/ (accessed on 20 July 2017).
- Chyla, J. Egipt na napoleońskich mapach i z satelity. AD REM 2012, 3–4, 7–10. [Google Scholar]
- Singh, A. Digital change detection techniques using remotely-sensed data. Int. J. Remote Sens. 1989, 10, 989–1003. [Google Scholar] [CrossRef]
- Lu, D.; Mausel, P.; Brondizio, E.; Moran, E. Change detection techniques. Int. J. Remote Sens. 2004, 25, 2364–2407. [Google Scholar] [CrossRef]
- Golenia, M.; Gurdak, R.; Jarocińska, A.; Mierczyk, M.; Ochtyra, A.; Zagajewski, B. Application of LANDSAT images in Urban change detection. In Forum GIS UW, 1st ed.; Buławka, N., Chyla, J.M., Lechnio, L., Misiewicz, K., Stępień, M., Eds.; Zakład Graficzny Uniwersytetu Warszawskiego: Warsaw, Poland, 2016; Volume III, pp. 91–101. ISBN 978-83-61376-74-3. [Google Scholar]
- Xu, Y.; Yu, L.; Zhao, Y.; Feng, D.; Cheng, Y.; Cai, X.; Gong, P. Monitoring cropland changes along the Nile River in Egypt over past three decades (1984–2015) using remote sensing. Int. J. Remote Sens. 2017, 38, 4459–4480. [Google Scholar] [CrossRef]
- Abd El-Kawy, O.R.; Rød, J.K.; Ismail, H.A.; Suliman, A.S. Land Use and Land Cover Change Detection in the Western Nile Delta of Egypt Using Remote Sensing Data. Appl. Geogr. 2011, 31, 483–494. [Google Scholar] [CrossRef]
- Aboel Ghar, M.; Shalaby, A.; Tateishi, R. Agricultural Land Monitoring in the Egyptian Nile Delta Using Landsat Data. Int.J. Environ. Stud. 2007, 61, 651–657. [Google Scholar] [CrossRef]
- El-Gammal, M.I.; Ali, R.R.; Eissa, R. Land Use Assessment of Barren Areas in Damietta Governorate, Egypt Using Remote Sensing. Egypt. J. Basic Appl. Sci. 2014, 1, 151–160. [Google Scholar] [CrossRef]
- Hegazy, I.R.; Kaloop, M.R. Monitoring Urban Growth and Land Use Change Detection with GIS and Remote Sensing Techniques in Daqahlia Governorate Egypt. Int. J. Sustain. Built Environ. 2014, 4, 117–124. [Google Scholar] [CrossRef]
- Kato, H.; Kimura, R.; Elbeih, S.F.; Iwasaki, E.; Zaghloul, E.A. Land Use Change and Crop Rotation Analysis of a Government Well District in Rashda Village—Dakhla Oasis, Egypt Based on Satellite Data. Egypt. J. Remote Sens. Space Sci. 2012, 15, 185–195. [Google Scholar] [CrossRef]
- Abd El-Aziz, A.O. Monitoring and change detection along the Eastern Side of Qena Bend, Nile Valley, Egypt Using GIS and Remote Sensing. Adv. Remote Sens. 2013, 2, 276–281. [Google Scholar] [CrossRef]
- Ahmed, A.A.; Fogg, G.E. The Impact of Groundwater and Agricultural Expansion on the Archaeological Sites at Luxor, Egypt. J. Afr. Earth Sci. 2014, 95, 93–104. [Google Scholar] [CrossRef]
- Villa, O. Remote Sensing Applications in Archaeology. Archeol. Calcolatori 2011, 22, 147–168. [Google Scholar]
- Campana, S. Archaeological Site Detection and Mapping: Some thoughts on differing scales of detail and archaeological ‘non-visibility’. In Seeing the Unseen—Geophysics and Landscape Archaeology, 1st ed.; Campana, S., Piro, S., Eds.; Taylor & Francis: London, UK, 2009; pp. 5–26. ISBN 978-0-203-88955-8. [Google Scholar]
- Lambers, K.; Zingman, I. Towards detection of archaeological objects in high-resolution remotely sensed images: The Silvretta case study. In Archaeology in the Digital Era, 1st ed.; Sly, T., Chrysanthi, A., Murrieta-Flores, P., Papadopoulos, C., Romanowska, I., Wheatley, D., Eds.; Amsterdam University Press: Amsterdam, The Netherlands, 2012; Volume II, pp. 781–791. ISBN 10: 9089646639. [Google Scholar]
- Bewley, R.; Wilson, A.I.; Kennedy, D.; Mattingly, D.; Banks, R.; Bishop, M.; Bradbury, J.; Cunliffe, E.; Fradley, M.; Jennings, R.; et al. Endangered Archaeology in the Middle East and North Africa: Introducing the EAMENA Project. In CAA 2015. Keep the Revolution Going, 1st ed.; Campana, S., Scopigno, R., Carpentiero, G., Cirillo, M., Eds.; Archeopress Archaeology: Oxford, UK, 2016; pp. 919–932. ISBN 9781784913373. [Google Scholar]
- Brodie, N.; Contreras, D.A. The economics of the looted archaeological site of Bab edh-Dhra: A view from Google Earth. In All the King’s Horses. Essays on the Impact of Looting and the Illicit Antiquities Trade on Our Knowledge of the Past, 1st ed.; Lazrus, P.K., Barker, A.W., Eds.; Society for American Archaeology: Washington, DC, USA, 2012; pp. 9–24. ISBN 9780932839442. [Google Scholar]
- NASA Global Land Cover Facility. Available online: glcf.umd.edu/data/landsat (accessed on 13 April 2013).
- Landsat 1 History. USGS. Available online: https://landsat.usgs.gov/landsat-1-history (accessed on 20 July 2017).
- Landsat 8 History. USGS. Available online: https://landsat.usgs.gov/landsat-8-history (accessed on 20 July 2017).
- LANDSAT Catalogue of Known Issues. USGS. Available online: https://landsat.usgs.gov/known-issues (accessed on 20 July 2017).
- Zagajewski, B. Ocena przydatności sieci neuronowych i danych do klasyfikacji Tatr Wysokich. Teledetekcja Środowiska 2010, 43, 57. [Google Scholar]
- Estman, J.R. Guide to GIS and Image Processing, 2nd ed.; Clark University: Worcester, MA, USA, 2001; Volume 2, pp. 41–46. [Google Scholar]
- CULTNAT. General Map of Quena Archaeological Sites, 1st ed.; Supreme Council of Antiquities, Library of Alexandria: Alexandria, Egypt, 2007; Volume 9–10. [Google Scholar]
- Hendrickx, S.; van den Brink, E.C.M. Inventory of Predynastic and Early Dynastic Cemetery and Settlement Sites in the Egyptian Nile Valley. In Egypt and the Levant: Interrelations from the 4th through the Early 3rdMillennium BCE, 1st ed.; van den Brink, E.C.M., Levy, E., Eds.; Leicester University Press: Leicester, UK, 2000; pp. 346–393. ISBN 9780718502621. [Google Scholar]
- Petrie, W.M.F. Diospolis Parva: The cemeteries of Abadiyeh and Hu, 1898–1899, 1st ed.; Offices of the Egypt Exploration Found: London, UK, 1901. [Google Scholar]
- Ejsmond, W.; Chyla, J.M.; Witkowski, P.; Wieczorek, D.F.; Takacs, D.; Ożarek-Szilke, M.; Ordutowski, J. Comprehensive field survey at Gebelein: Preliminary results of a new method in processing data for archaeological site analysis. Archaeol. Pol. 2015, 53, 617–621. [Google Scholar]
Figure 1.
The spread of agricultural lands based on the comparison of P. Jacotin’s map and contemporary satellite images.
Figure 1.
The spread of agricultural lands based on the comparison of P. Jacotin’s map and contemporary satellite images.
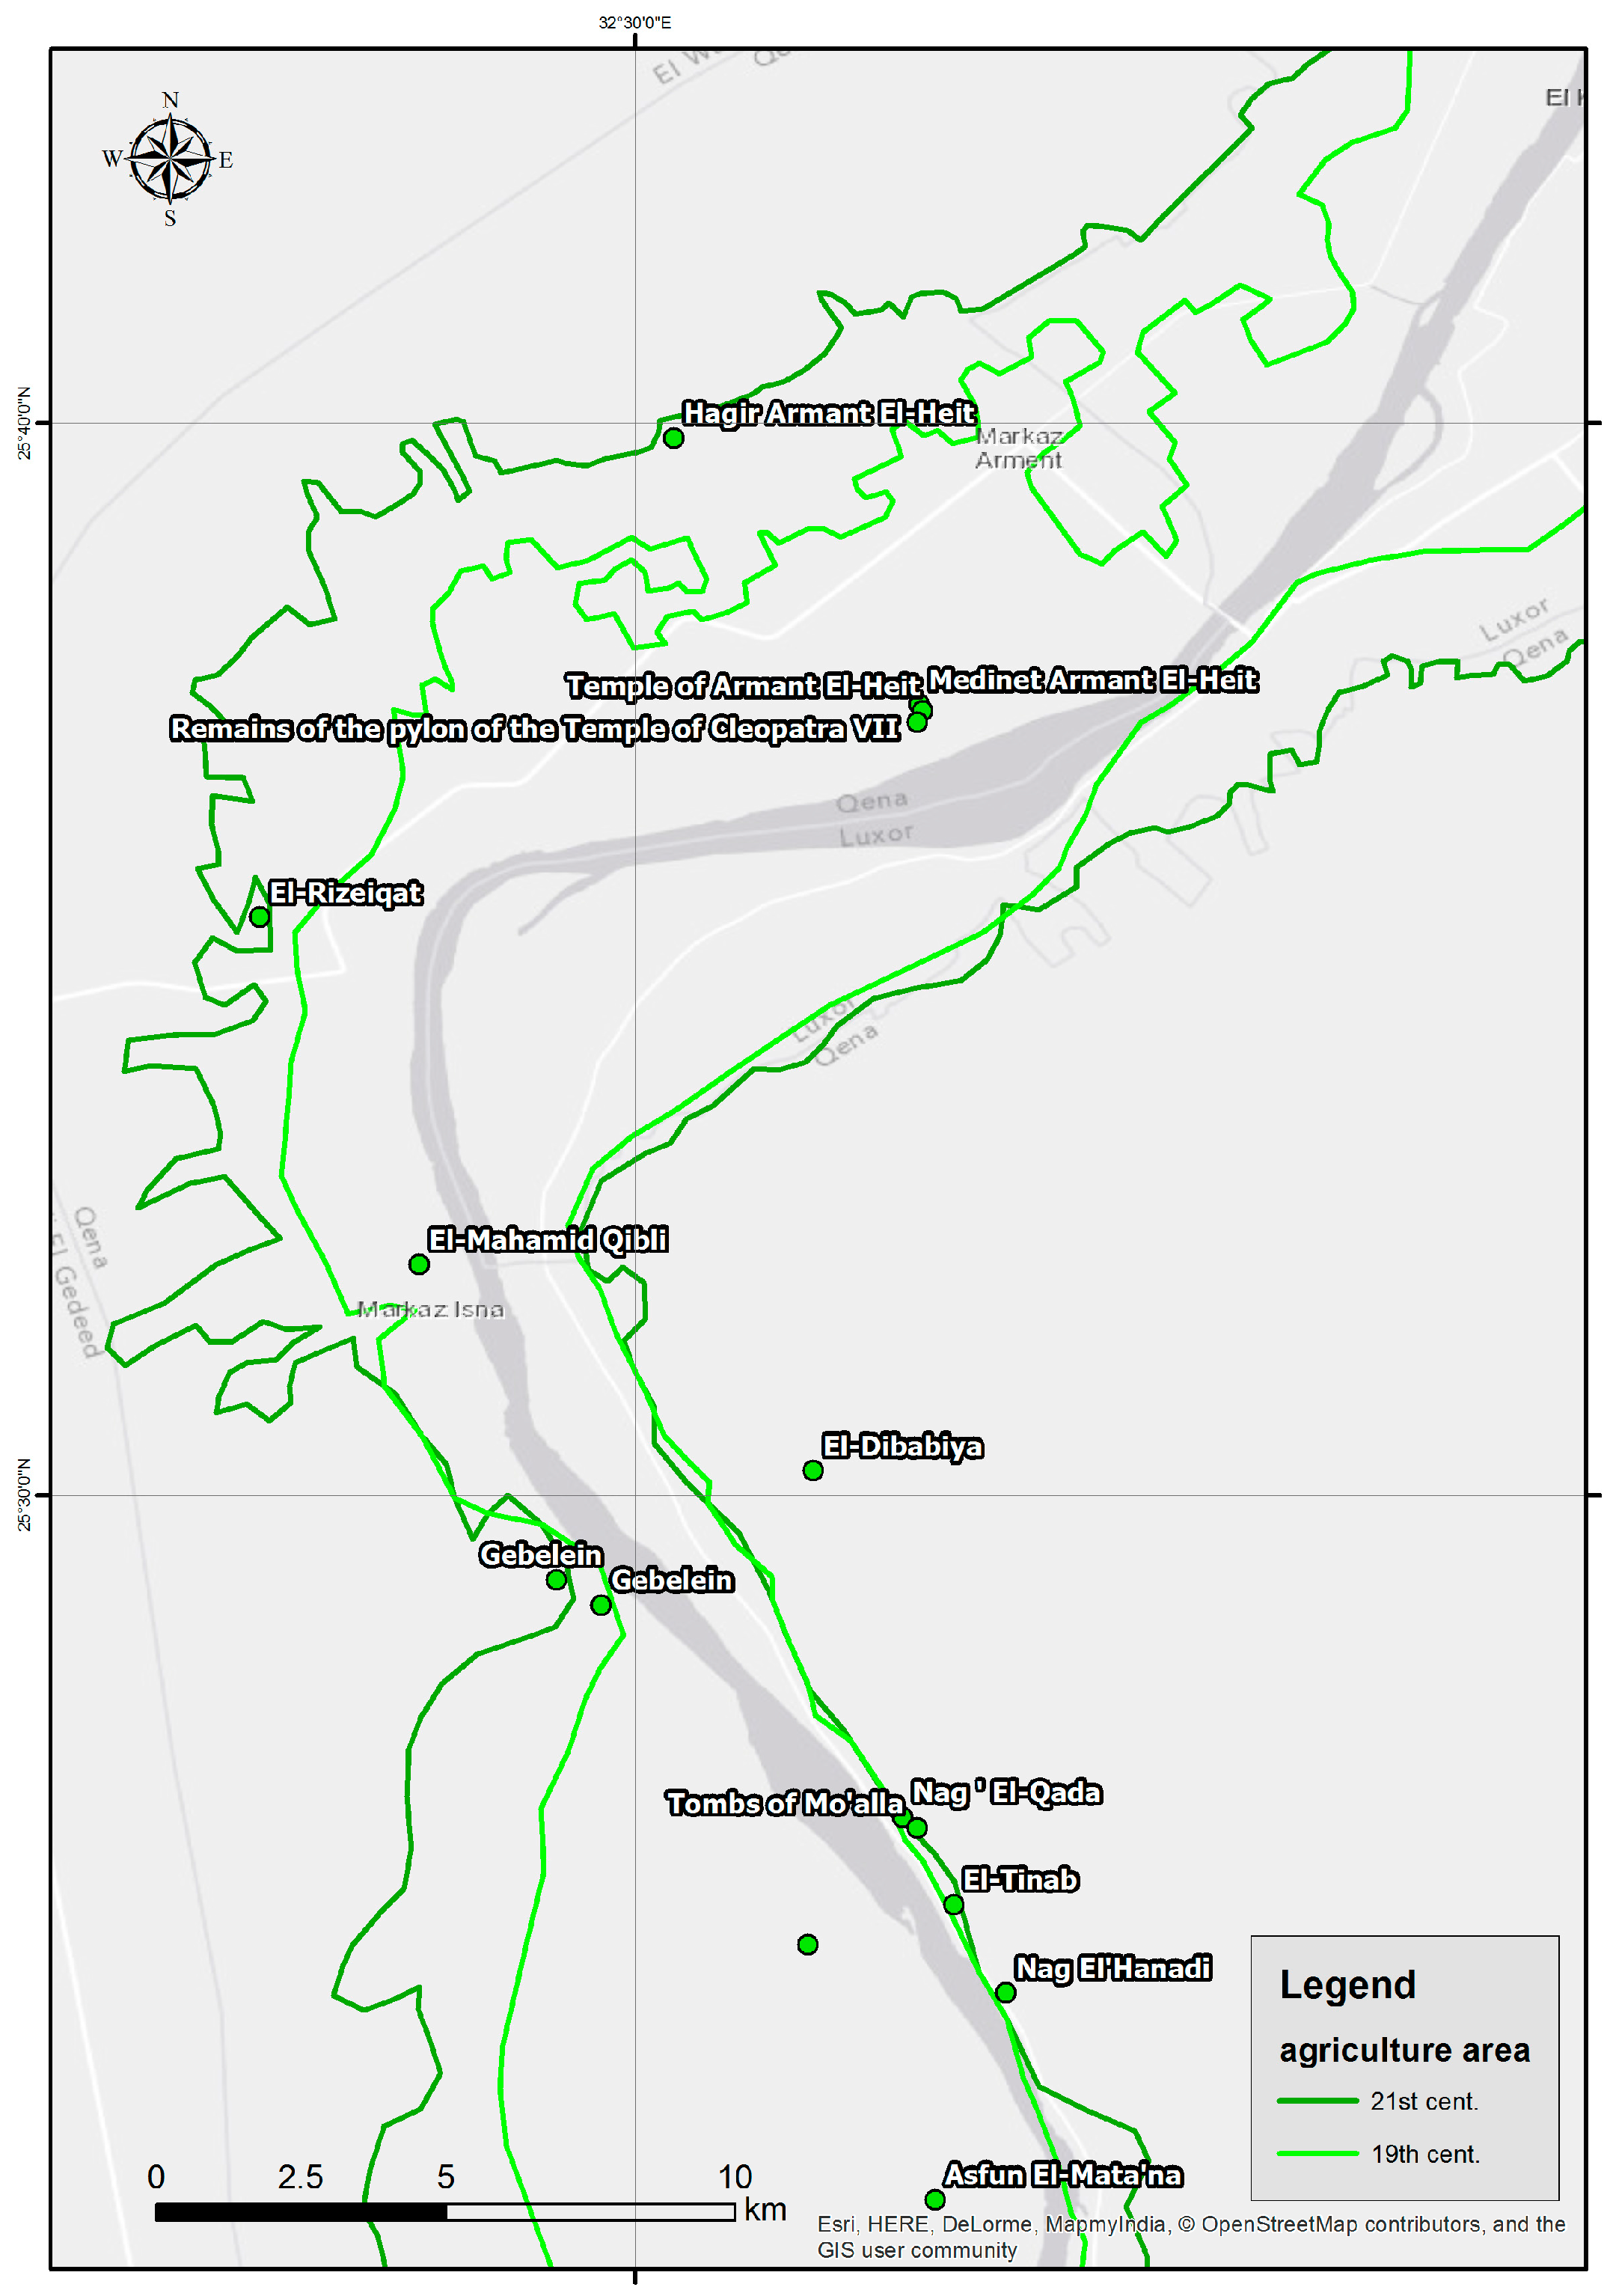
Figure 2.
Analysis workflow.

Figure 3.
Result of the classification tree method, with seven classes.
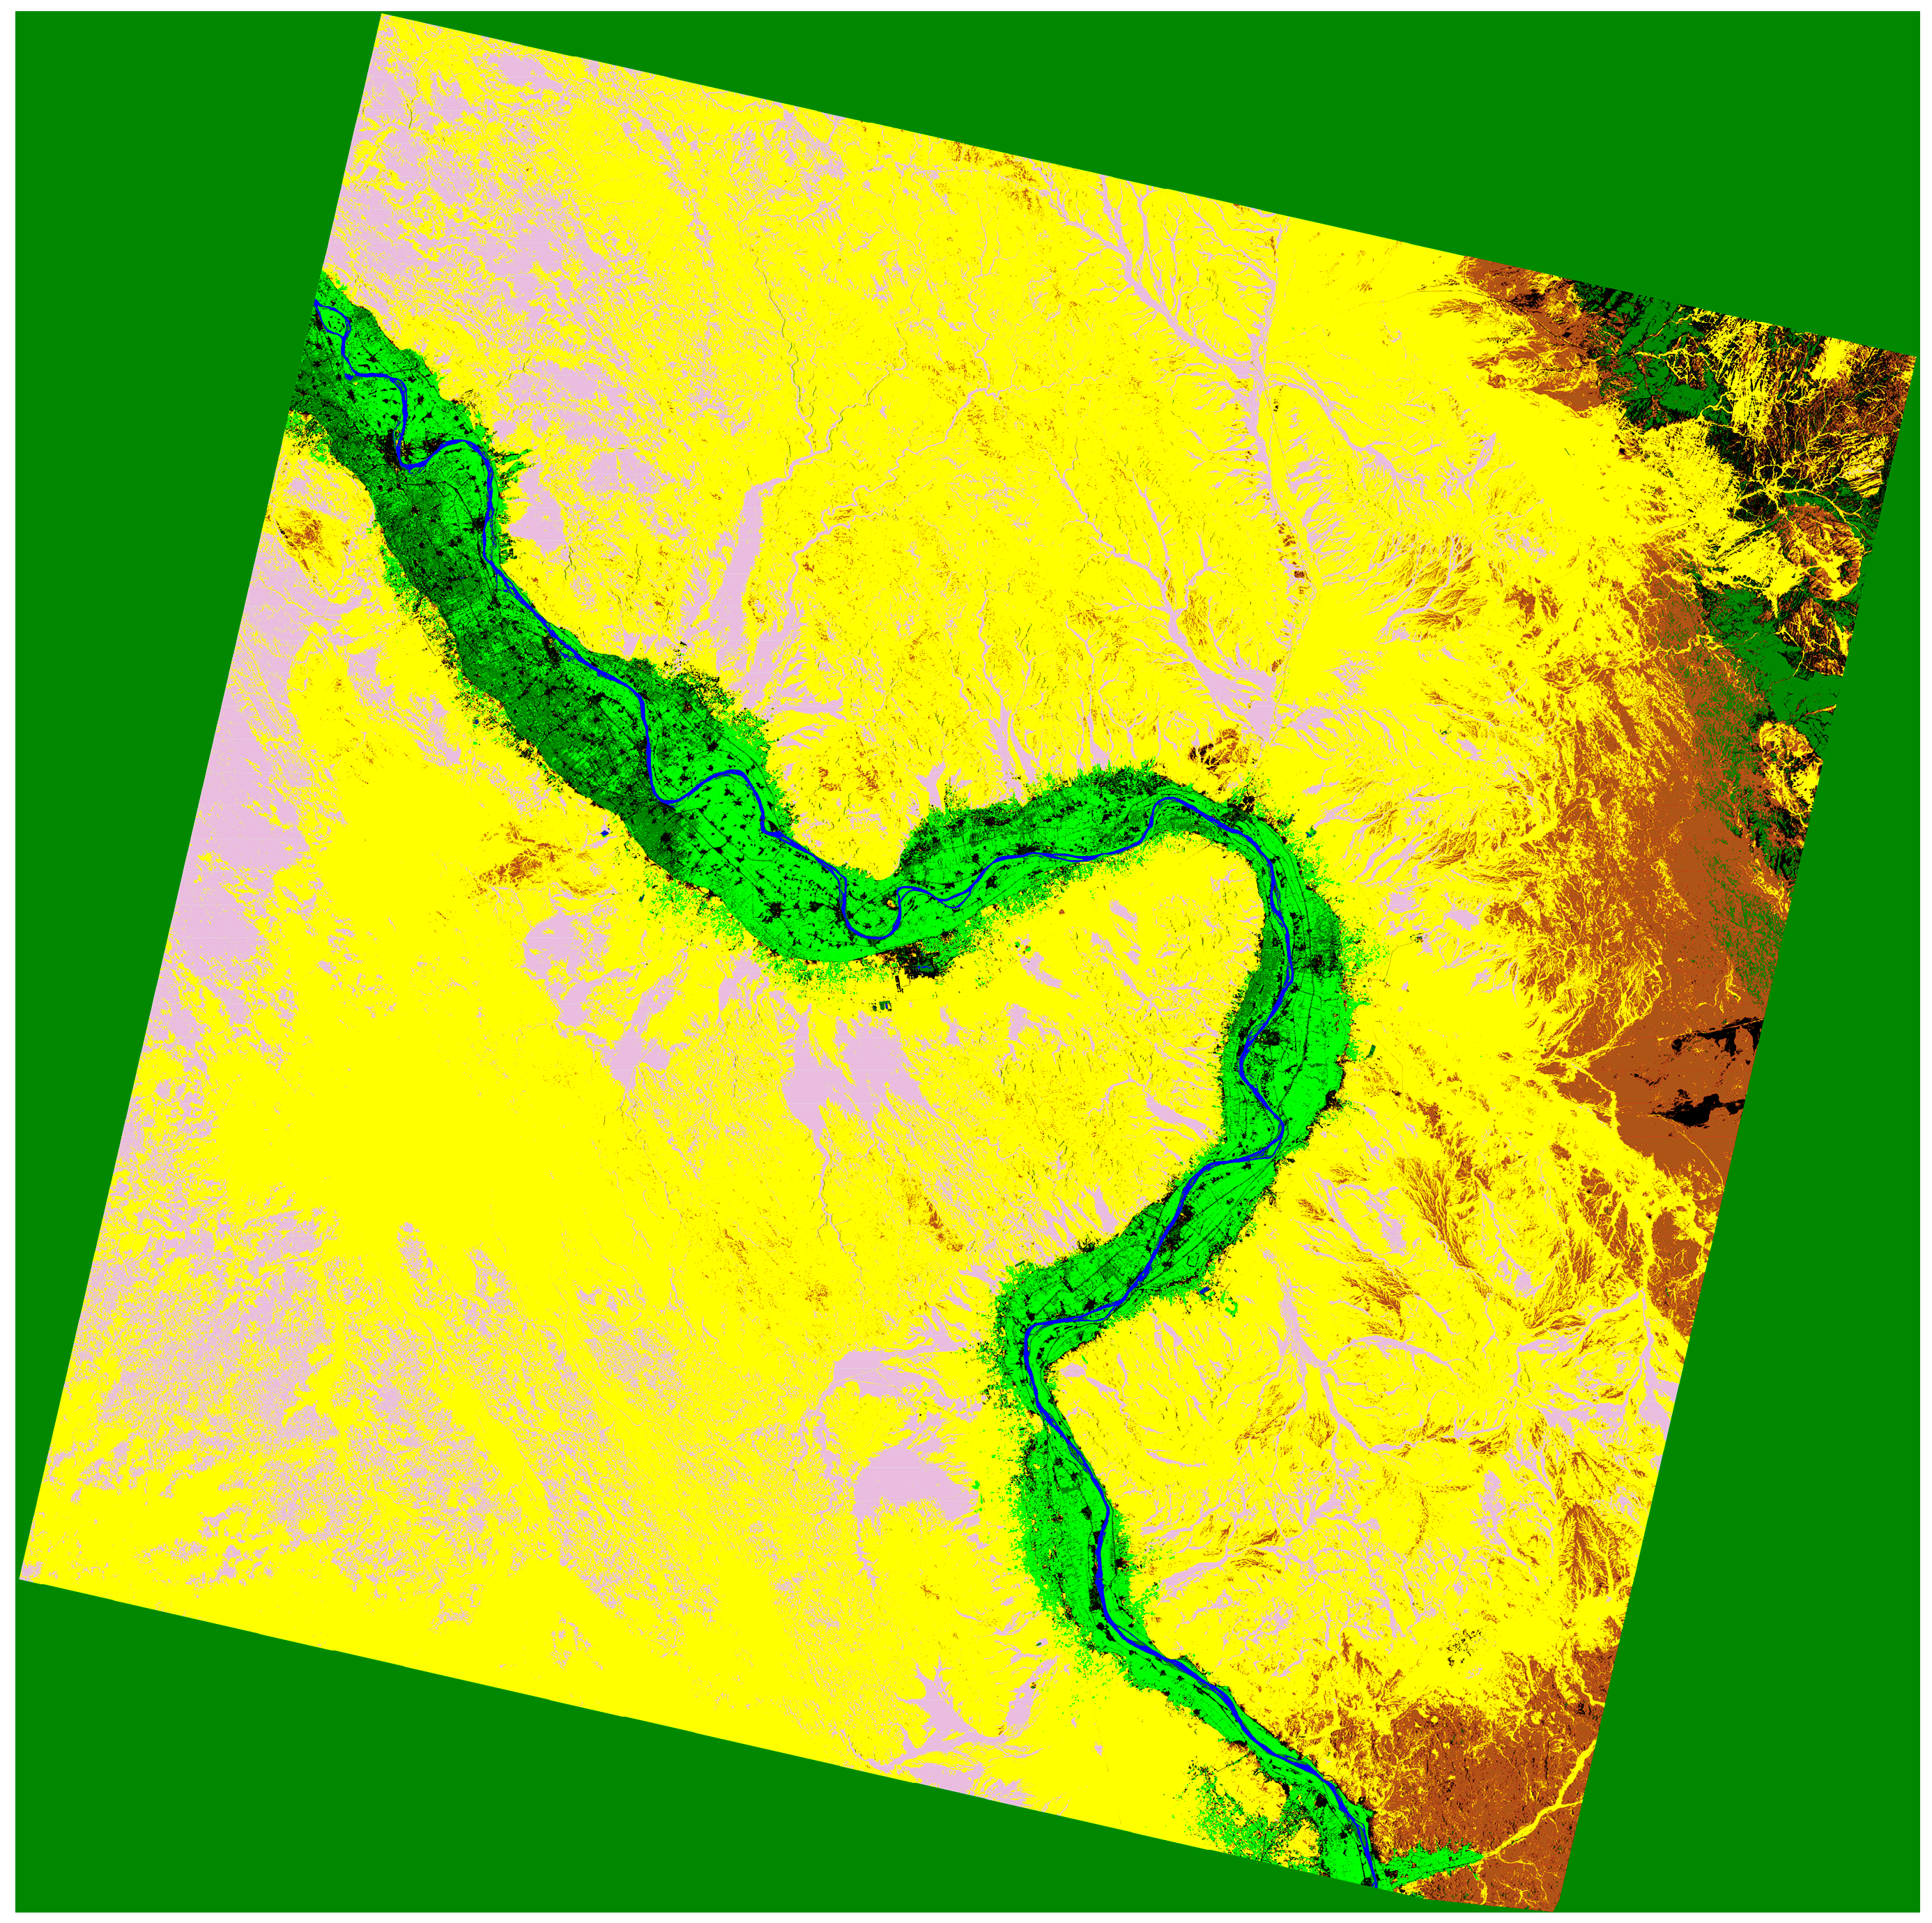
Figure 4.
The result of the classification of the LANDSAT images from (a) 1972 and (b) 2013.
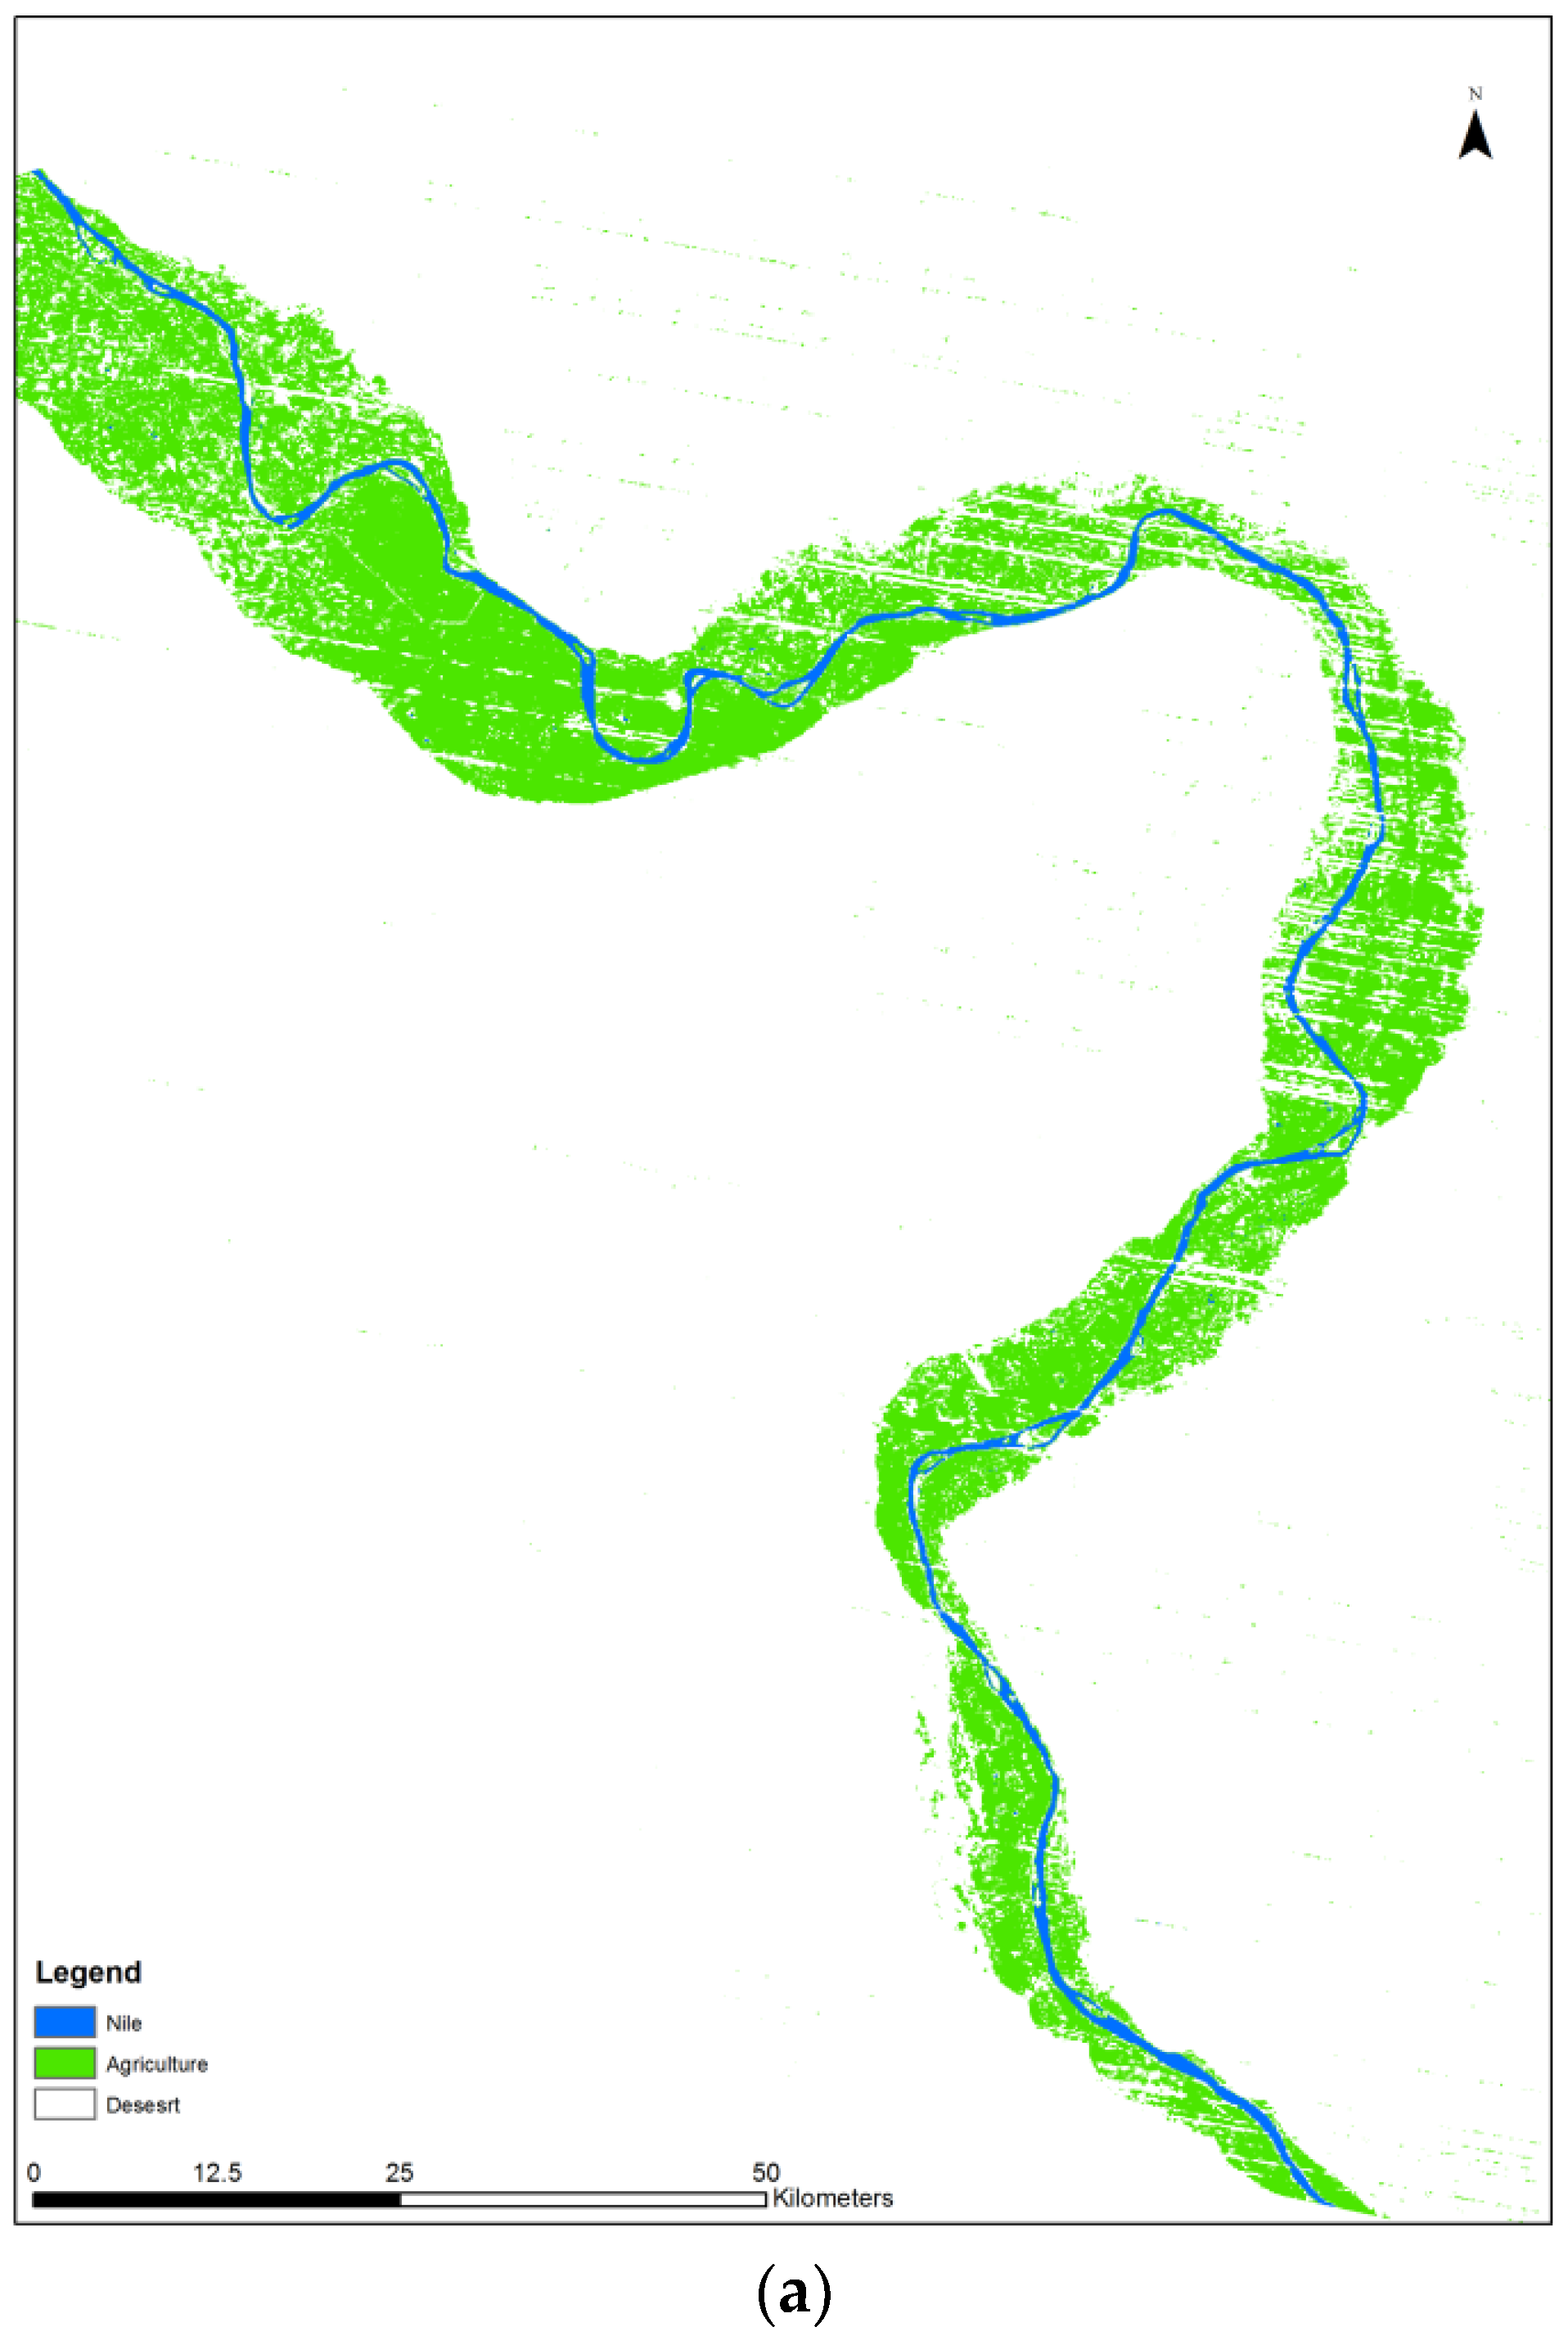

Figure 5.
Noise visible on the image from 1972.
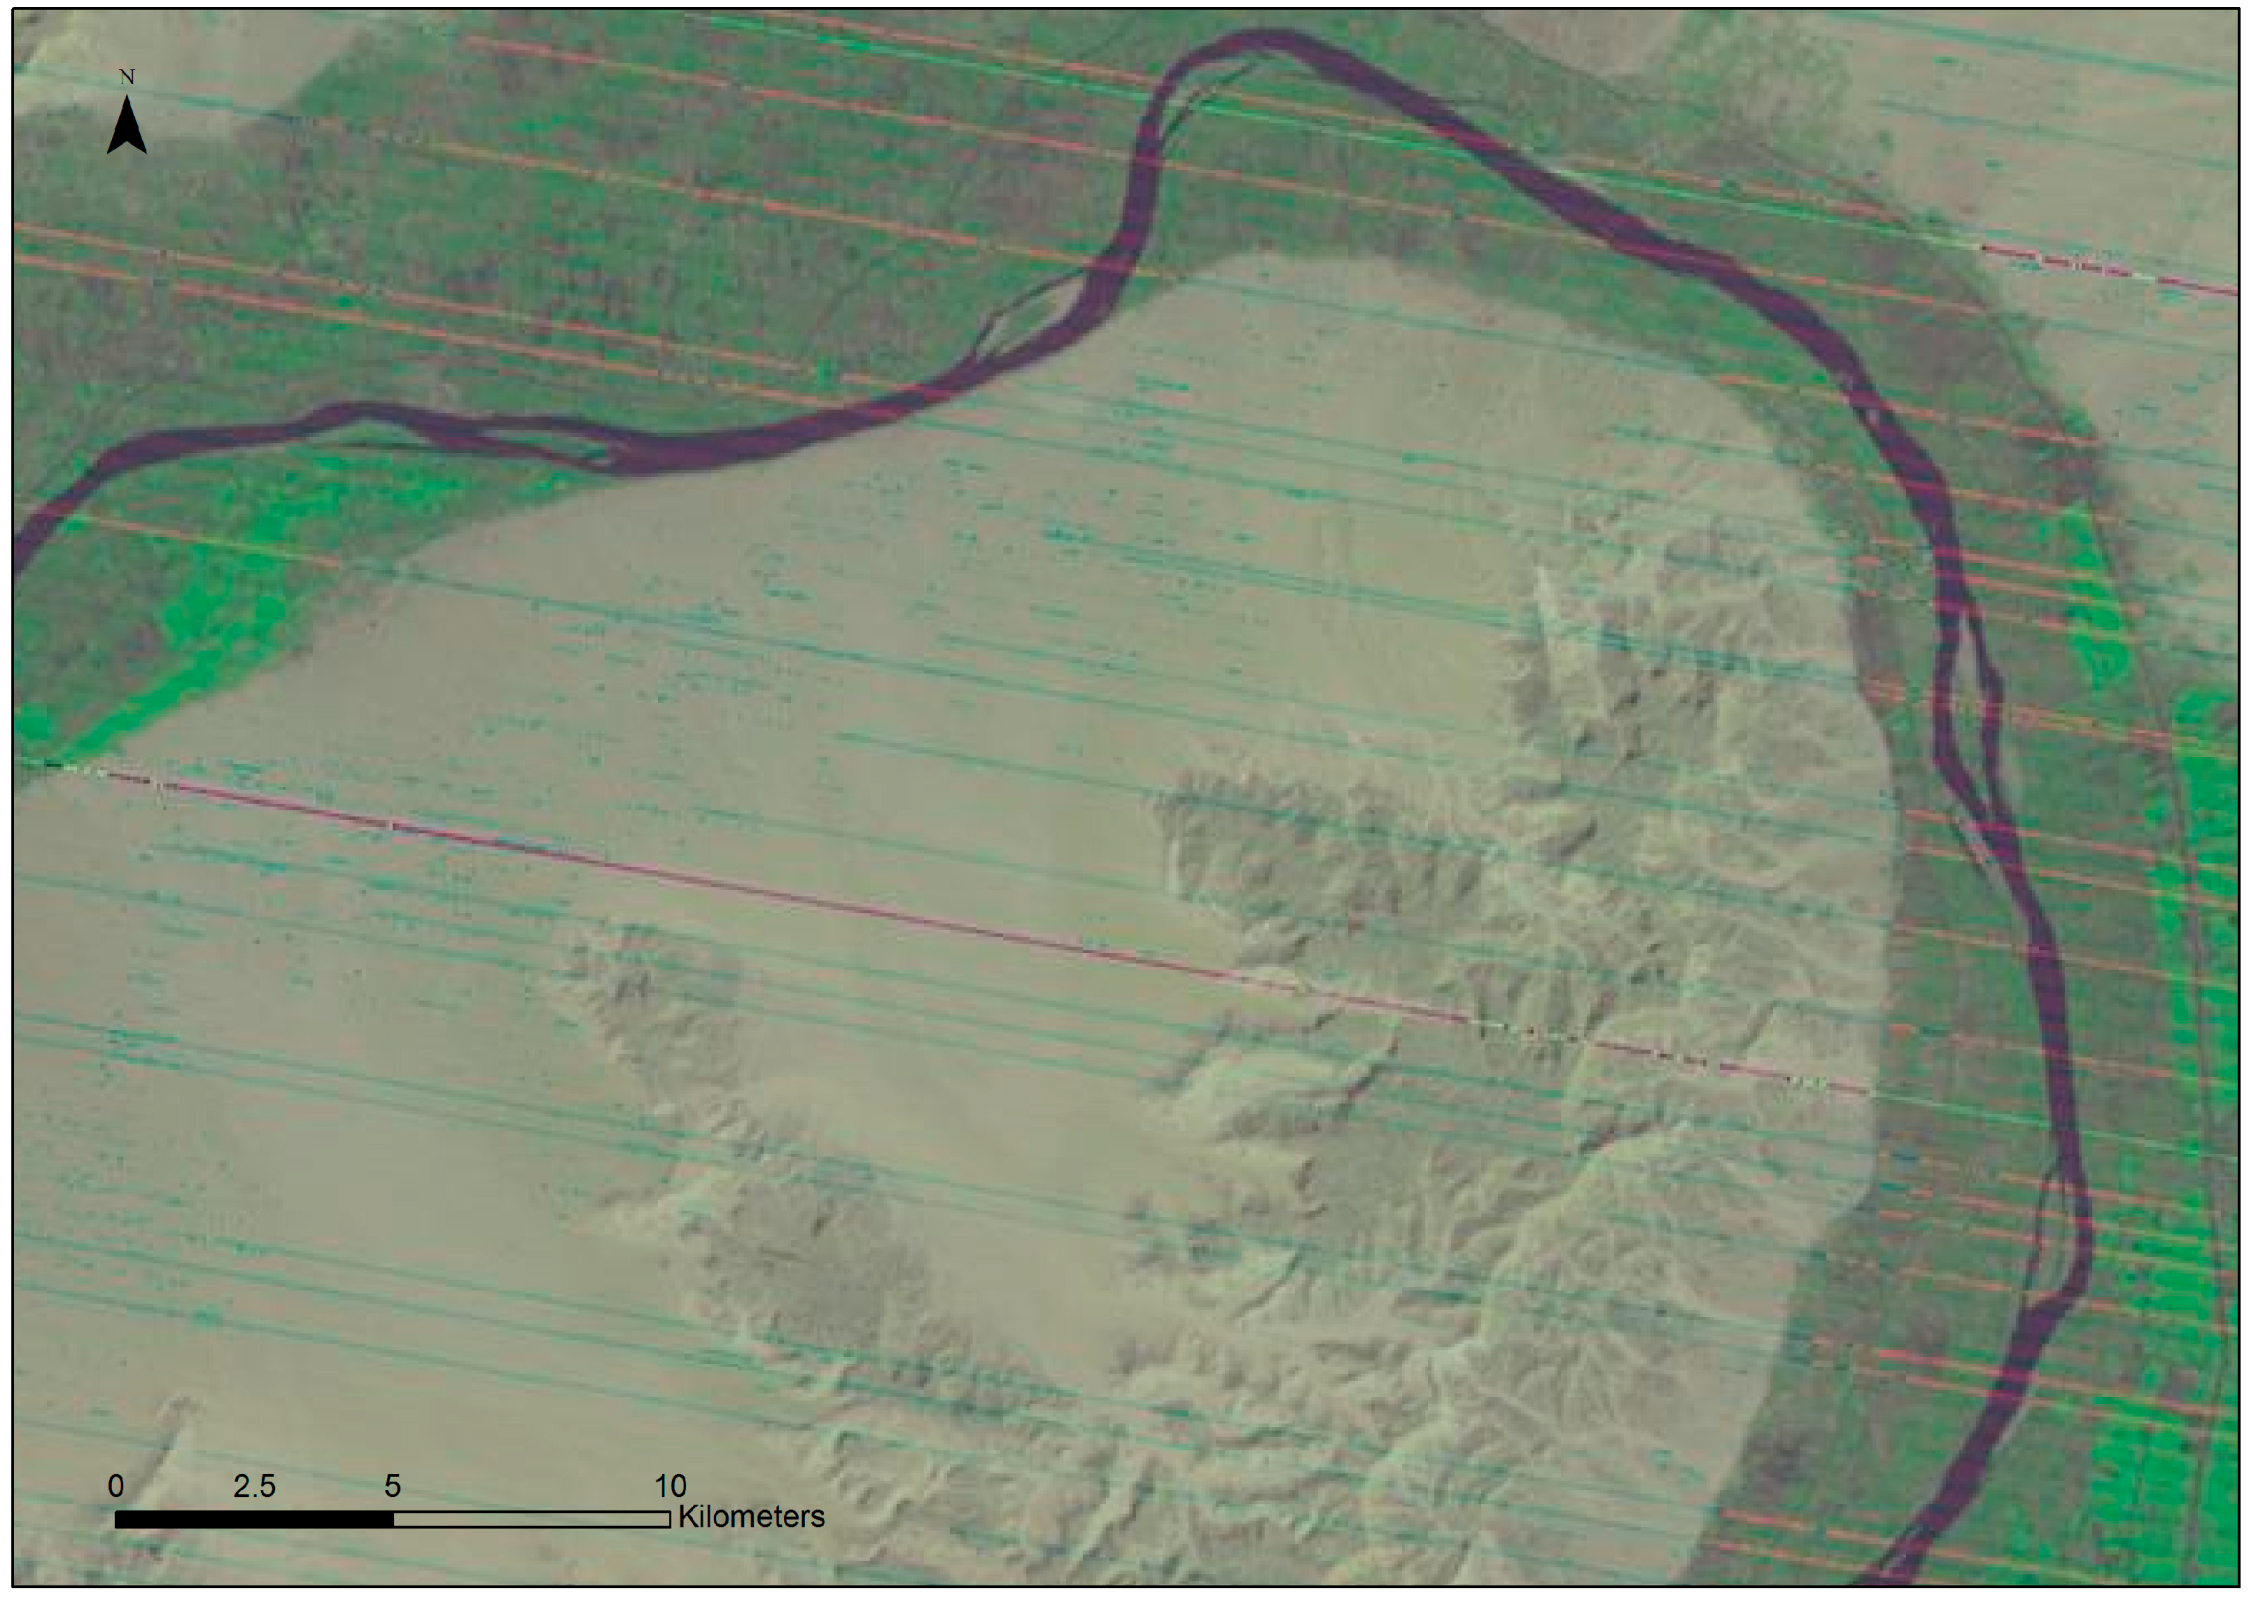
Figure 6.
Archaeological Hazard Zone for Upper Egypt.

Figure 7.
Archeological sites in Upper Egypt threatened by the development of agriculture.

Figure 8.
(a) Archaeological sites threatened by the development of agriculture in the Gebelein Region; (b)Reaserch at Gebelein has focused on the most threatened areas of the site.
Figure 8.
(a) Archaeological sites threatened by the development of agriculture in the Gebelein Region; (b)Reaserch at Gebelein has focused on the most threatened areas of the site.
© 2017 by the author. Licensee MDPI, Basel, Switzerland. This article is an open access article distributed under the terms and conditions of the Creative Commons Attribution (CC BY) license (http://creativecommons.org/licenses/by/4.0/).
Share and Cite
MDPI and ACS Style
Chyla, J.M. How Can Remote Sensing Help in Detecting the Threats to Archaeological Sites in Upper Egypt? Geosciences 2017, 7, 97. https://doi.org/10.3390/geosciences7040097
AMA Style
Chyla JM. How Can Remote Sensing Help in Detecting the Threats to Archaeological Sites in Upper Egypt? Geosciences. 2017; 7(4):97. https://doi.org/10.3390/geosciences7040097
Chicago/Turabian StyleChyla, Julia M. 2017. "How Can Remote Sensing Help in Detecting the Threats to Archaeological Sites in Upper Egypt?" Geosciences 7, no. 4: 97. https://doi.org/10.3390/geosciences7040097
Note that from the first issue of 2016, this journal uses article numbers instead of page numbers. See further details here.