Subsidence Trends of Volturno River Coastal Plain (Northern Campania, Southern Italy) Inferred by SAR Interferometry Data


1
Istituto per l’Ambiente Marino Costiero (IAMC), Consiglio Nazionale delle Ricerche (CNR), 80133 Naples, Italy
2
Department of Civil Engineering, Design, Building and Environment (DICDEA), University of Campania “L. Vanvitelli”, 81103 Aversa (Caserta), Italy
*
Author to whom correspondence should be addressed.
Geosciences 2018, 8(1), 8; https://doi.org/10.3390/geosciences8010008
Submission received: 3 September 2017
/
Revised: 14 December 2017
/
Accepted: 27 December 2017
/
Published: 2 January 2018
(This article belongs to the Special Issue Observing Geohazards from Space)
Abstract
:The Volturno Plain is one of the largest alluvial plains of peninsular Italy, which is one of the most susceptible plains to coastal hazards. This area is characterized by both natural and human-induced subsidence. This present study is based on the post-processing, analysis and mapping of the available Persistent Scatterer interferometry datasets. The latter were derived from the combination of both ascending and descending orbits of three different radar satellite systems during an observation period of almost two decades (June 1992–September 2010). The main output of this study is a map of vertical deformation, which provides new insights into the areal variability of the ground deformation processes (subsidence/uplift) of Volturno plain over the last few decades. The vertical displacement values obtained by the post-processing of the interferometric data show that the Volturno river plain is characterized by significant subsidence in the central axial sectors and in the river mouth area. Moderate uplift is detected in the eastern part of the plain, whereas other sectors of the study area are characterized by moderate subsidence and/or stability. On the basis of the analyzed subsoil stratigraphy, we inferred that the subsidence recorded in the Volturno plain is mainly a consequence of a natural process related to the compaction of the fluvial and palustrine deposits that form the alluvial plain. The anthropic influences (e.g., water exploitation, urbanization) are substantially considered to be an additional factor that may enhance subsidence only locally. The uplift mapped in the eastern sector of the plain is related to the tectonic activity. The study of the subsidence in the Volturno plain is a valuable tool for river flood analyses and the assessment of the coastal inundation hazards and related risk mitigation.
1. Introduction
Most Quaternary alluvial coastal plains of the Mediterranean are affected by significant subsidence due to simultaneous ground sinking caused by natural and human causes [1,2,3,4] and acceleration of the global sea level rise [5]. The main potential drivers of subsidence include tectonics [6], compaction of alluvial/coastal plain deposits [7] and fluid extraction [8,9]. The major consequences of subsidence include inundation of low lands, coastal erosion and aquifer salinization, increased vulnerability to flooding and storm surges as well as structural damage to infrastructures.
In the last few decades, several techniques based on the satellite-based Synthetic Aperture Radar (SAR) Interferometry (InSAR) have been used to assess ground-surface deformation related to several dynamic processes, such as subsidence, volcanism, seismicity and tectonics [10,11,12,13,14,15,16]. Two main different approaches have been developed to extract relevant information from the phase values of SAR images: Differential SAR Interferometry (DInSAR) and multi-interferograms SAR Interferometry (Persistent Scatterer Interferometry, PSI) techniques [17]. The DInSAR technique depends on the processing of two SAR images of the same target area acquired at different times [18] to detect phase shifts related to surface deformations (i.e., after an earthquake) that occur between the two reference acquisitions. This approach also requires an external digital elevation model of the analyzed morphological surfaces, from which the topographic phase contribution is estimated and removed from the interferogram. The PSI approach is based on the use of a long series of co-registered, multi-temporal SAR imagery, for which a larger number of images allows for more precise and robust results [17,19]. The PSI techniques allow for the production of maps of displacement velocity, which are measured along the straight line between target and radar sensor (Line Of Sight) and follow the temporal evolution of the displacement at each SAR acquisition epoch.
An overall, retrospective view on the spatial and temporal distribution of ground deformation can be derived for the area of the Campania Region by space-borne multi-temporal DInSAR techniques, based on the analysis of the C-band sensors onboard ERS-1/2, ENVISAT and RADARSAT satellites. A number of Italian national and regional remote sensing projects have recently reported several PSI-processed datasets related to Campania territory [20,21,22,23,24,25,26]. These various datasets have been acquired as the result of implementation of different processing techniques, such as Permanent Scatterers (PS-InSAR) [27], Persistent Scatterers Pairs (PSP) [19,28,29] and Small BAseline Subset (SBAS) [30,31,32]. Integrated results from these techniques provide very accurate displacement measurements along the SAR Line of Sight (LOS), which yield accuracy in the order of millimeters [27,28,29,30,31,32,33].
The use of SAR interferometry measurements to accurately analyze ground subsidence and/or uplift processes of different origins has already been tested and validated in several sectors of Campania Region [16,33,34,35,36,37,38]. In this research, we use the PS-InSAR and PSP datasets, which rely on the analysis of pixels that remain coherent over a sequence of interferograms (PSI techniques). These datasets are available for the entire study area over a relatively long time period (1992–2010).
The aim of the present study is the quantitative analysis of the ground deformation trends across a span of about two decades (1992–2010), which characterize the alluvial plain of the Volturno River located in the northern sector of Campania (Italy) (Figure 1).
This research was based on the post-processing, mapping and interpretation of the available ground deformation datasets [13,20,21,22,23,24], which was obtained from interferometric processing of ERS-1/2 (1992–2001), RADARSAT (2003–2007) and ENVISAT (2003–2010) radar satellite scenes, the latter provided by European Space Agency (ESA), using PS-InSAR and PSP techniques.
The Volturno plain has been largely investigated in recent years as a representative case of main land-use and hydro-geomorphological changes characterizing the urbanized coastal plains of the Mediterranean Sea during the last 50 years. Environmental changes documented for the Volturno coastal plain include the dramatic alteration of alluvial channels, floodplains and the deltaic environment as well as coastline retreat [37,39,40,41,42]. Previous studies have suggested that the considerable subsidence affecting the Volturno plain area may be interpreted as the result of a negative balance between the groundwater recharge of the Volturno alluvial plain and the water drainage by the channel system created for industrial and intense agricultural activities [16,43]. Based on the GIS overlay, Riccio [44] has pointed out that there is no spatial correlation in the Volturno plain between subsidence rates and the agricultural land use and/or livestock farming and cattle breeding areas. Aucelli et al. [37] elaborated the risk inundation maps for the coastal area of the plain by comparing sea level rise forecasts and local subsidence trends.
Our study presents a new quantitative scenario for the ground deformation in the whole Volturno plain following the method developed by Vilardo et al. [16]. Previous studies [16,37] have referred only to ERS-1/2 dataset for the time interval of 1992–2000. The main purpose of this research was to obtain a map of cumulated ground deformation for the study area over the period of 1992–2010, relying on three different SAR datasets provided by various satellites. The outcomes of our analysis are also discussed on the basis of the geological setting of Volturno Plain and subsurface stratigraphic data.
2. Geological, Geomorphological and Land Use Framework
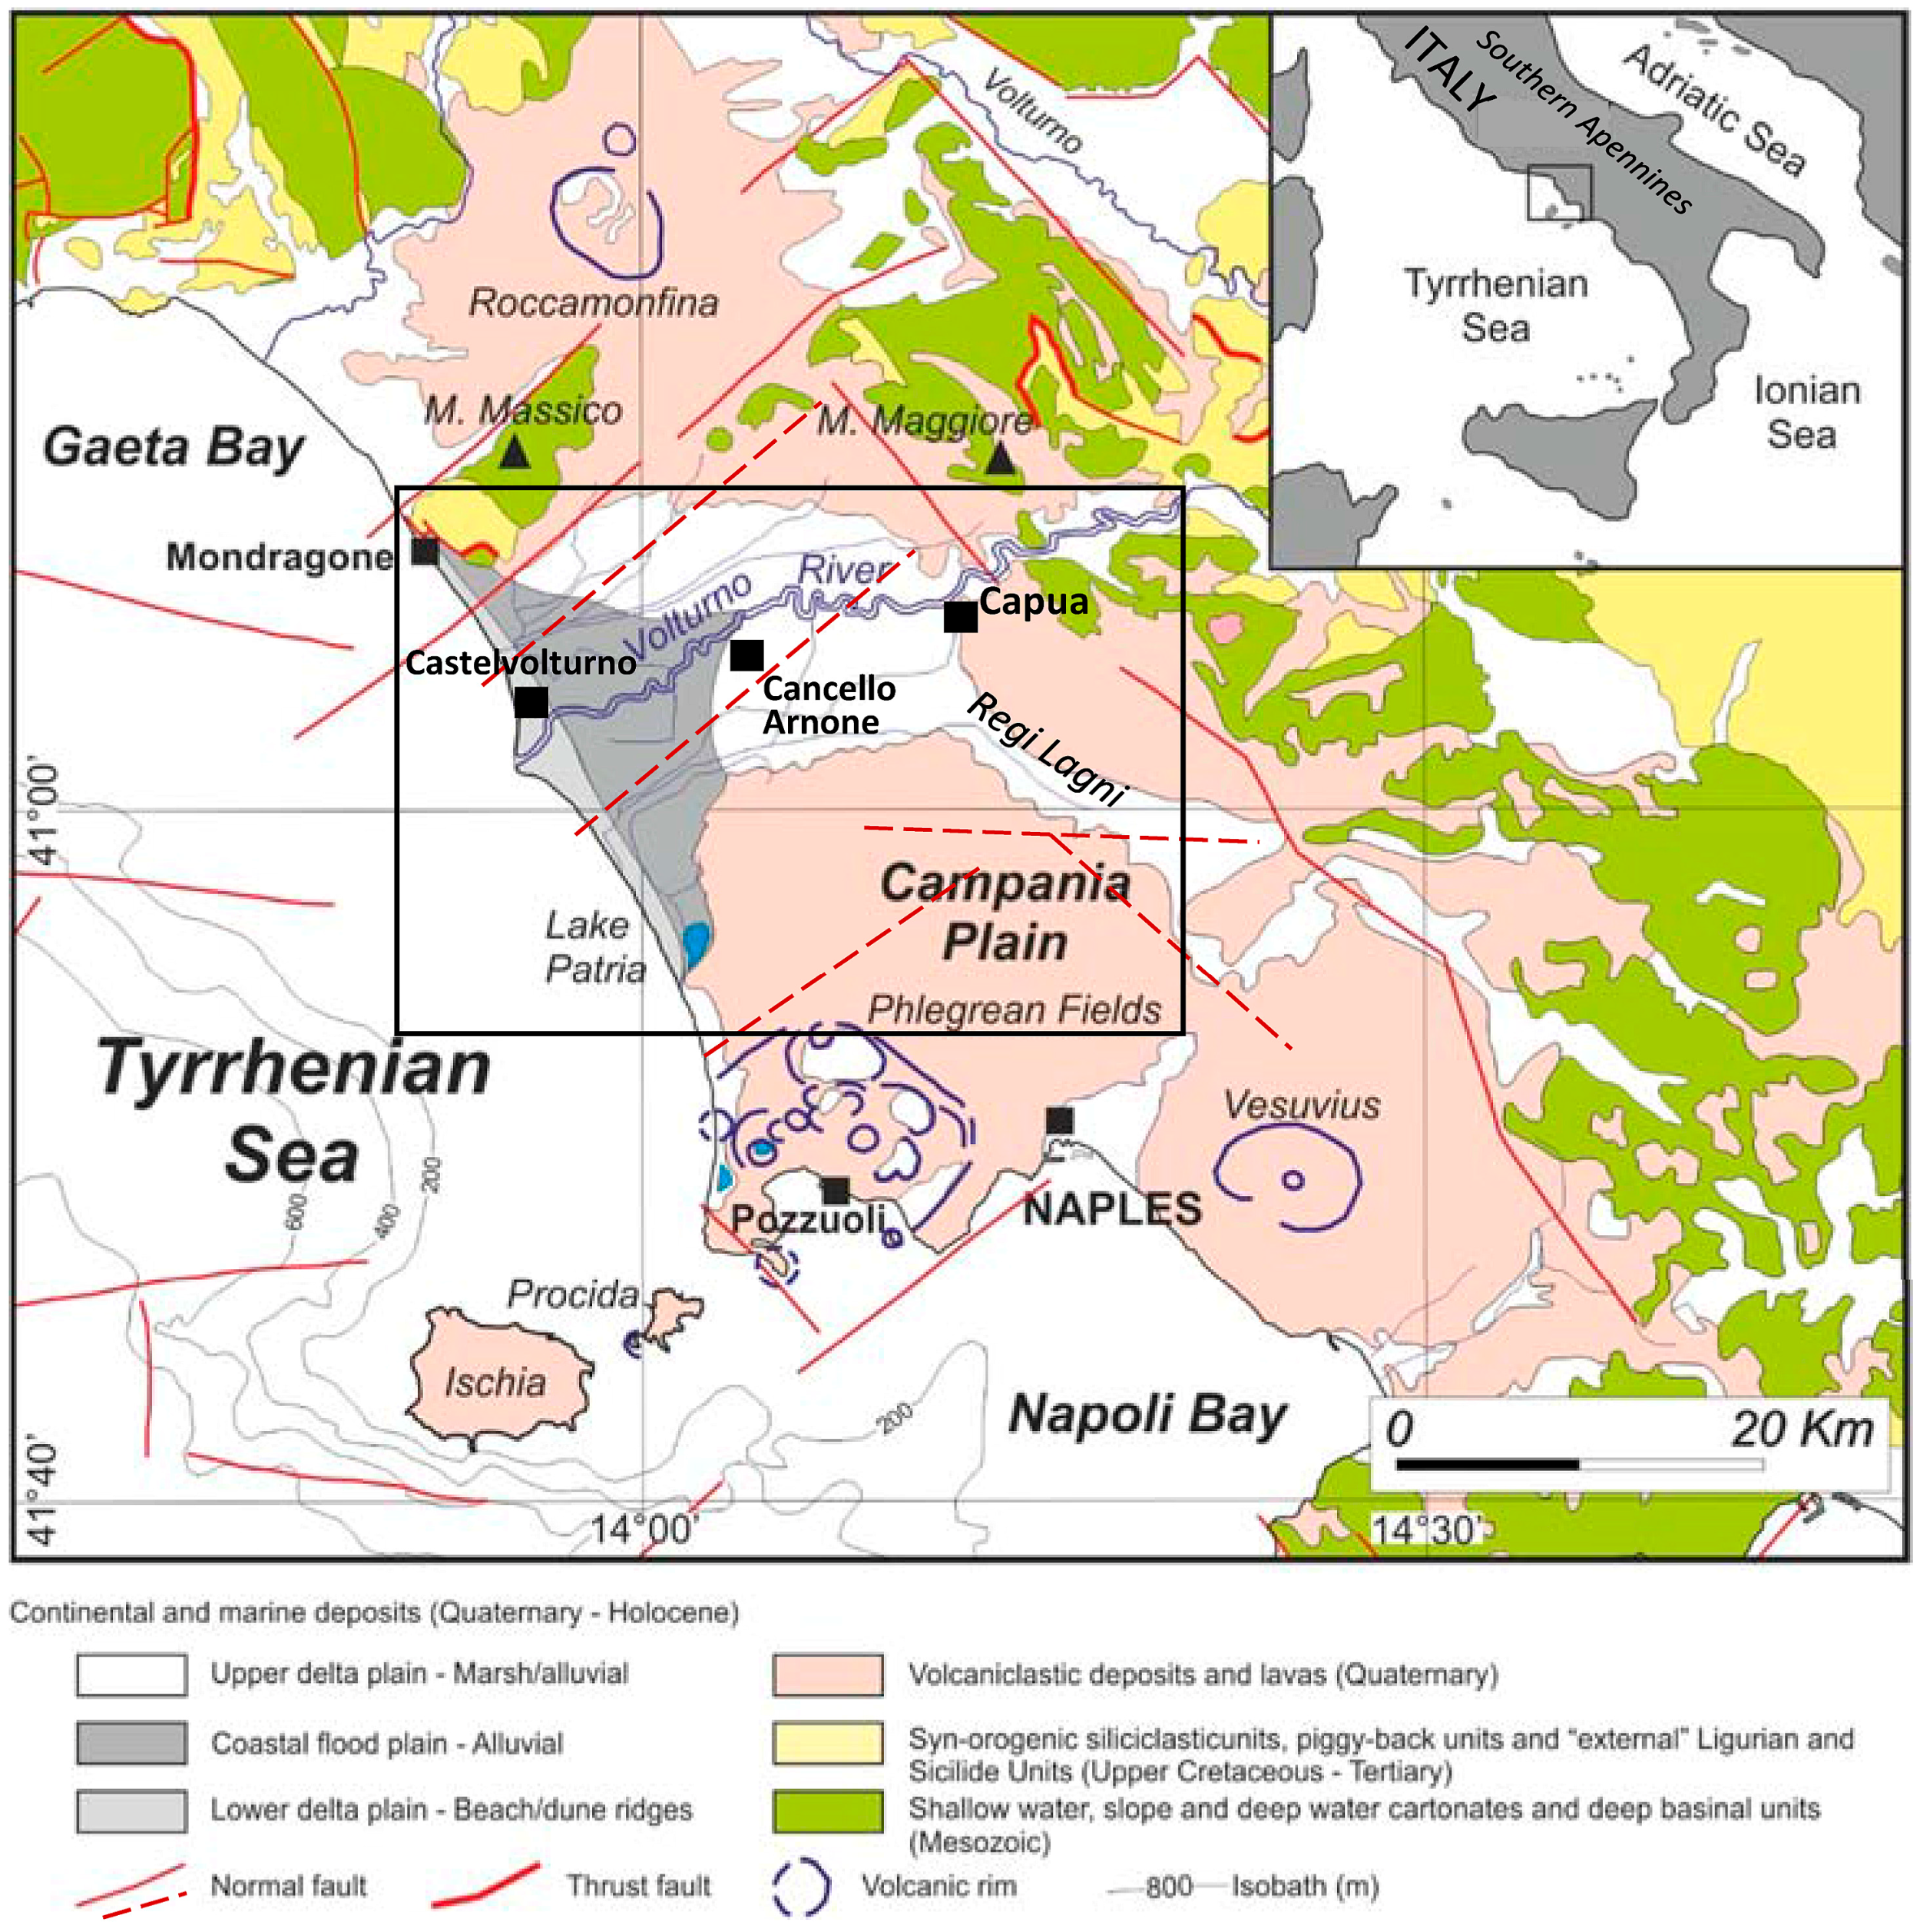
The Campania Plain is part of a large extensional sedimentary basin, which mostly formed during the Quaternary between the western flank of the southern Apennines and the eastern Tyrrhenian Sea margin [45,46,47,48,49,50]. The plain is surrounded by calcareous—dolomitic mountain ridges (Figure 1), which is delimited by NW–SE trending regional normal faults, whereas its carbonatic and volcanic substratum is affected by extensional tectonics with NE–SW, NW–SE and E–W trending faults [51,52,53,54,55]. Some of these lineaments correspond to normal faults that have been active since the Late Pleistocene and display a vertical slip rate in the order of 0.2–2.5 mm/year [51].
The area was largely submerged by the sea water since mid-late Pleistocene, when extensional tectonics locally developed across the continental margin and accompanied the onset of an intense volcanic activity [56]. At approximately 39 ky BP, a highly explosive eruption covered the entire Campania Plain with an ignimbrite deposit, up to 55 m thick, which is known as Campanian Ignimbrite or Grey Tuff (CGT) [57,58,59,60]. This unit represents the substrate for the uppermost Pleistocene–Holocene and recent sedimentation. A subsequent eruption, dated at approximately 15 ky BP [61], led to deposition of another ignimbrite deposit, the Neapolitan Yellow Tuff (NYT), which is primarily exposed in the urban area of Naples and at the Campi Flegrei (or Phlegrean Fields area). Tuff units (CGT and NYT) and related ash deposits include most of the Quaternary volcaniclastic products cropping out in the Campania Plain (Figure 1).
The latest Pleistocene-early Holocene (approximately 16.0–6.0 ky BP) sea-level rise caused a rapid flooding of the lower paleo-Volturno incised valley, which was accompanied by the formation of a pronounced embayment at the mouth of paleo Volturno estuary and a landward widening of the continental shelf. Since approximately 6.5 ky BP, a coastal progradational phase was established, allowing for the onset of the present-day alluvial plain. The coastal area evolved as a wave-dominated delta system, with flanking strand plains forming beach-dune ridges partially enclosing lagoon-marsh areas [62,63] (Figure 1 and Figure 2). Beach and lagoon environments persisted up until 2.0 ky BP. Since then, the crevasse splay and overbank deposits filled most of the swamp areas. Evidence for a persisting progradational trend of the shoreline has been documented since the 3rd century BC [39,64]. During the last century, a significant shoreline retreat affected the Volturno River mouth, particularly at the delta cusp, which was related to the decrease in river sediment load [39,41,65].
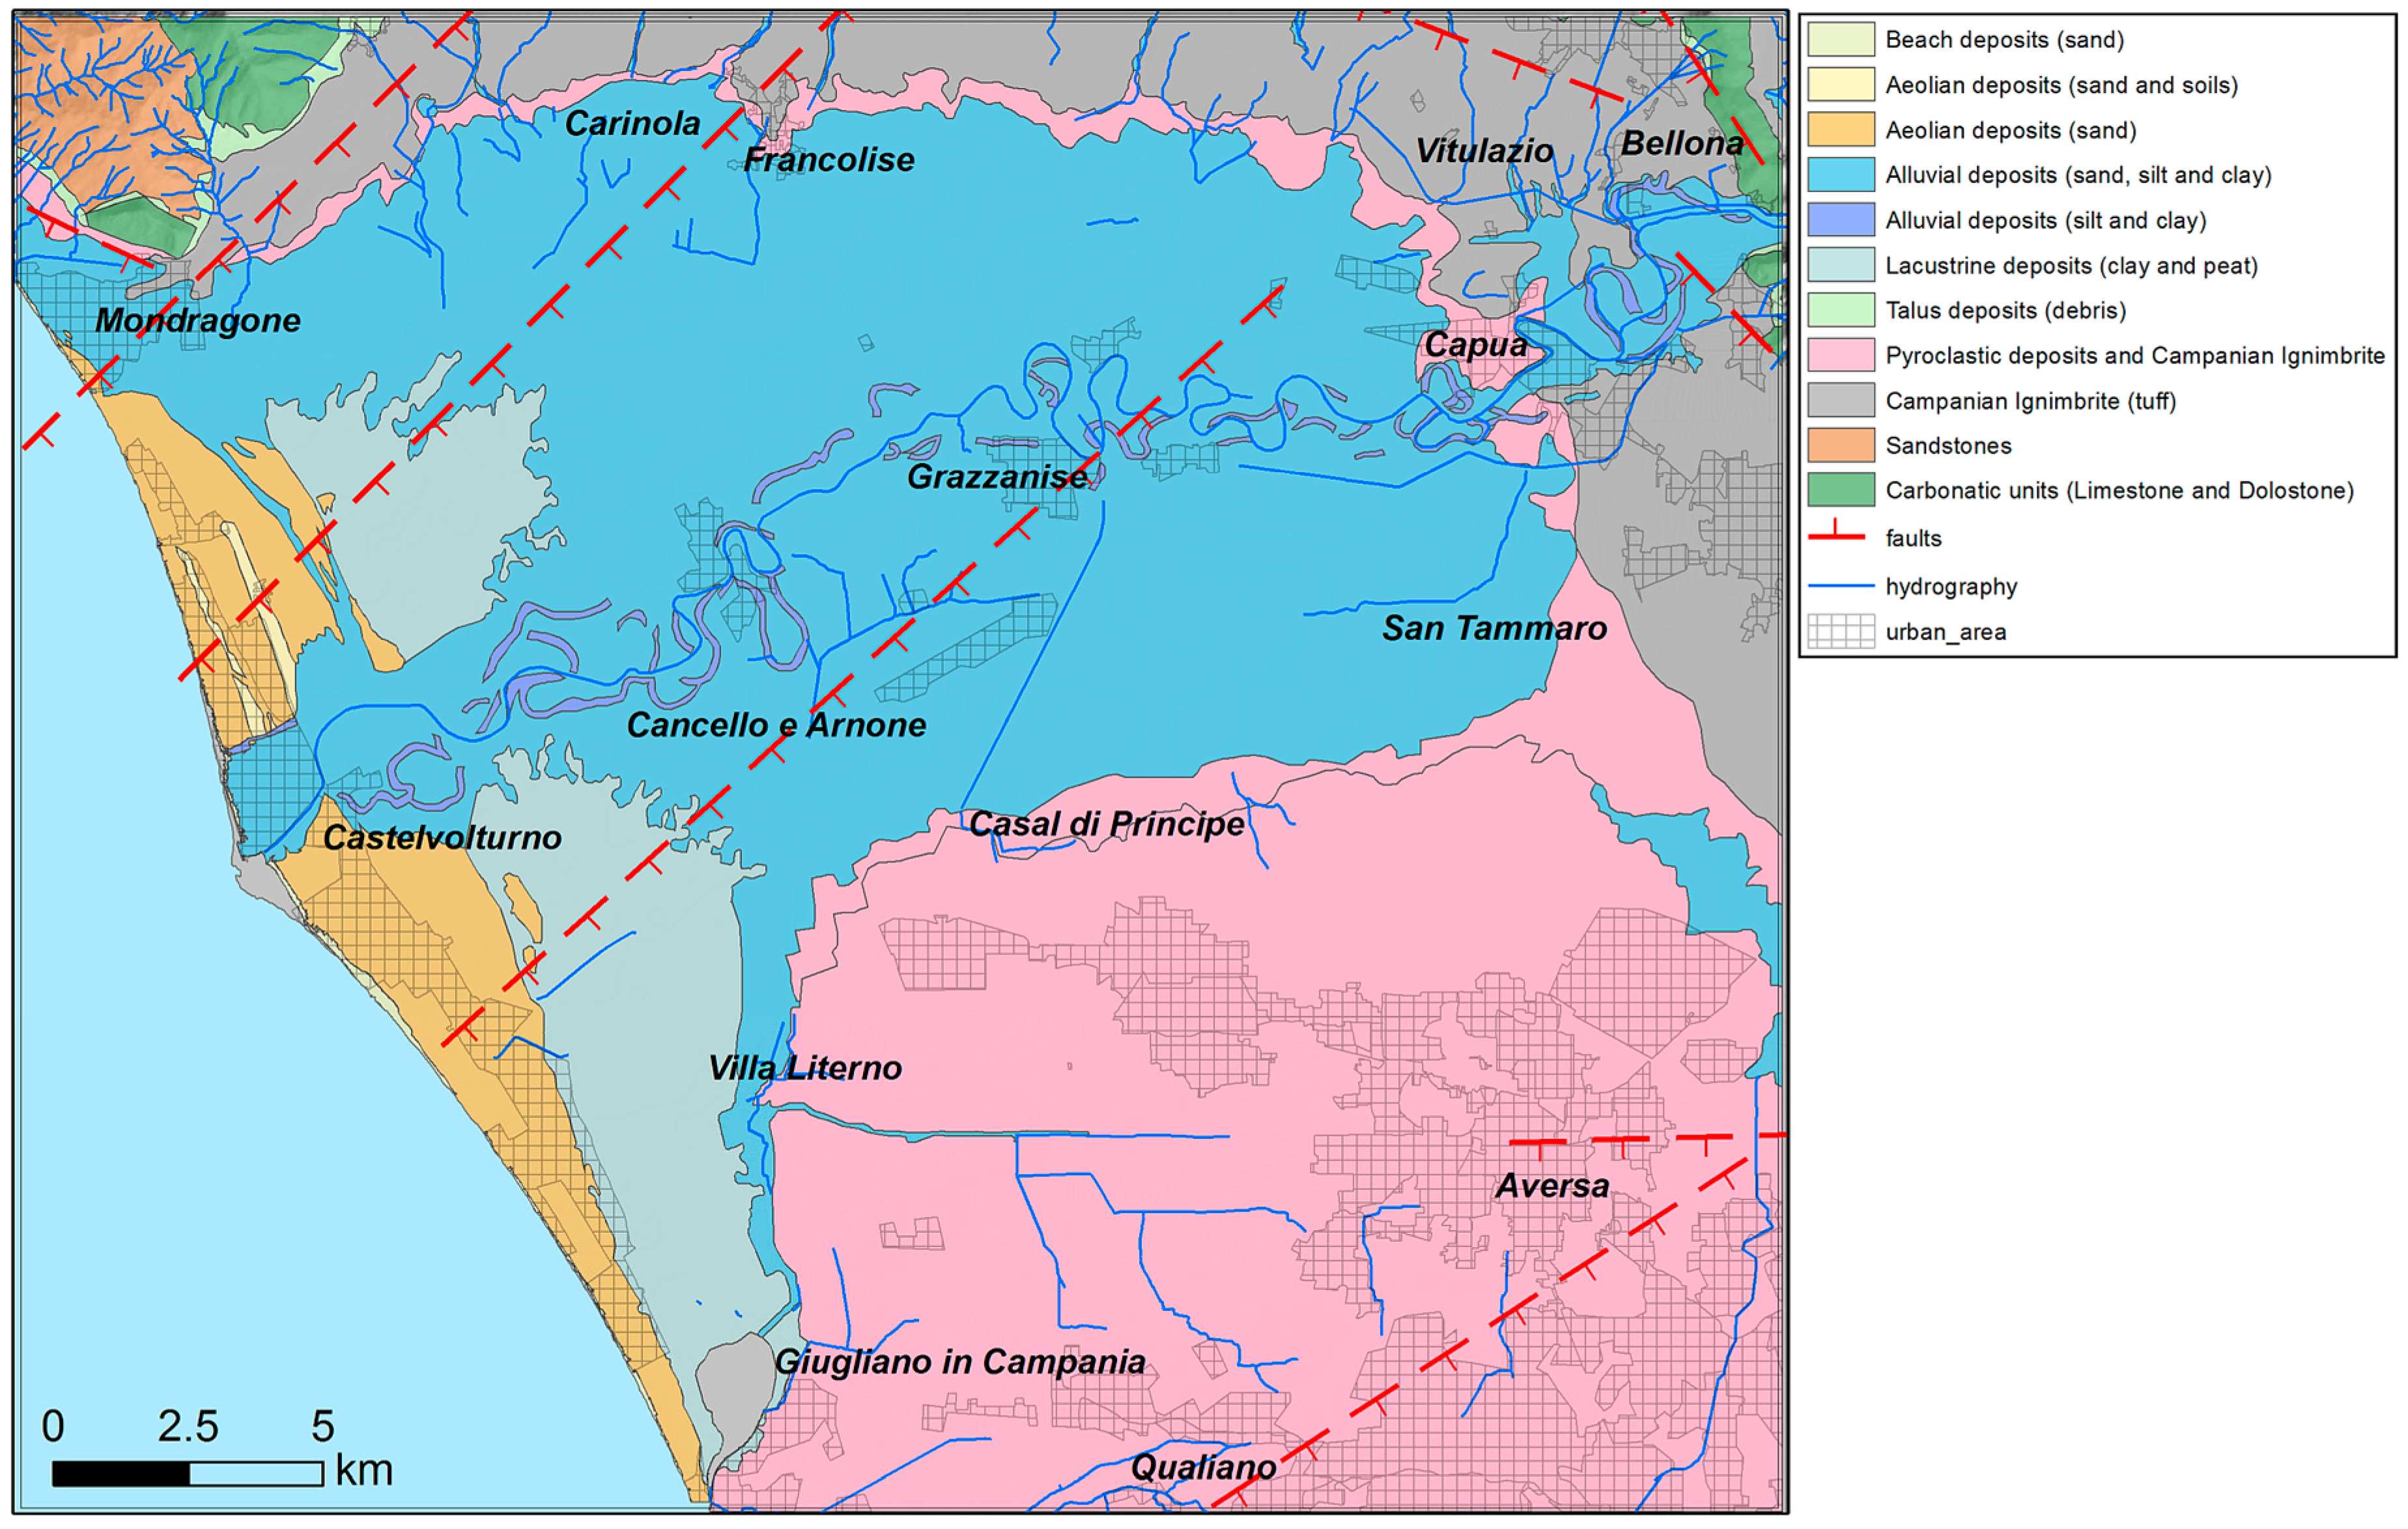
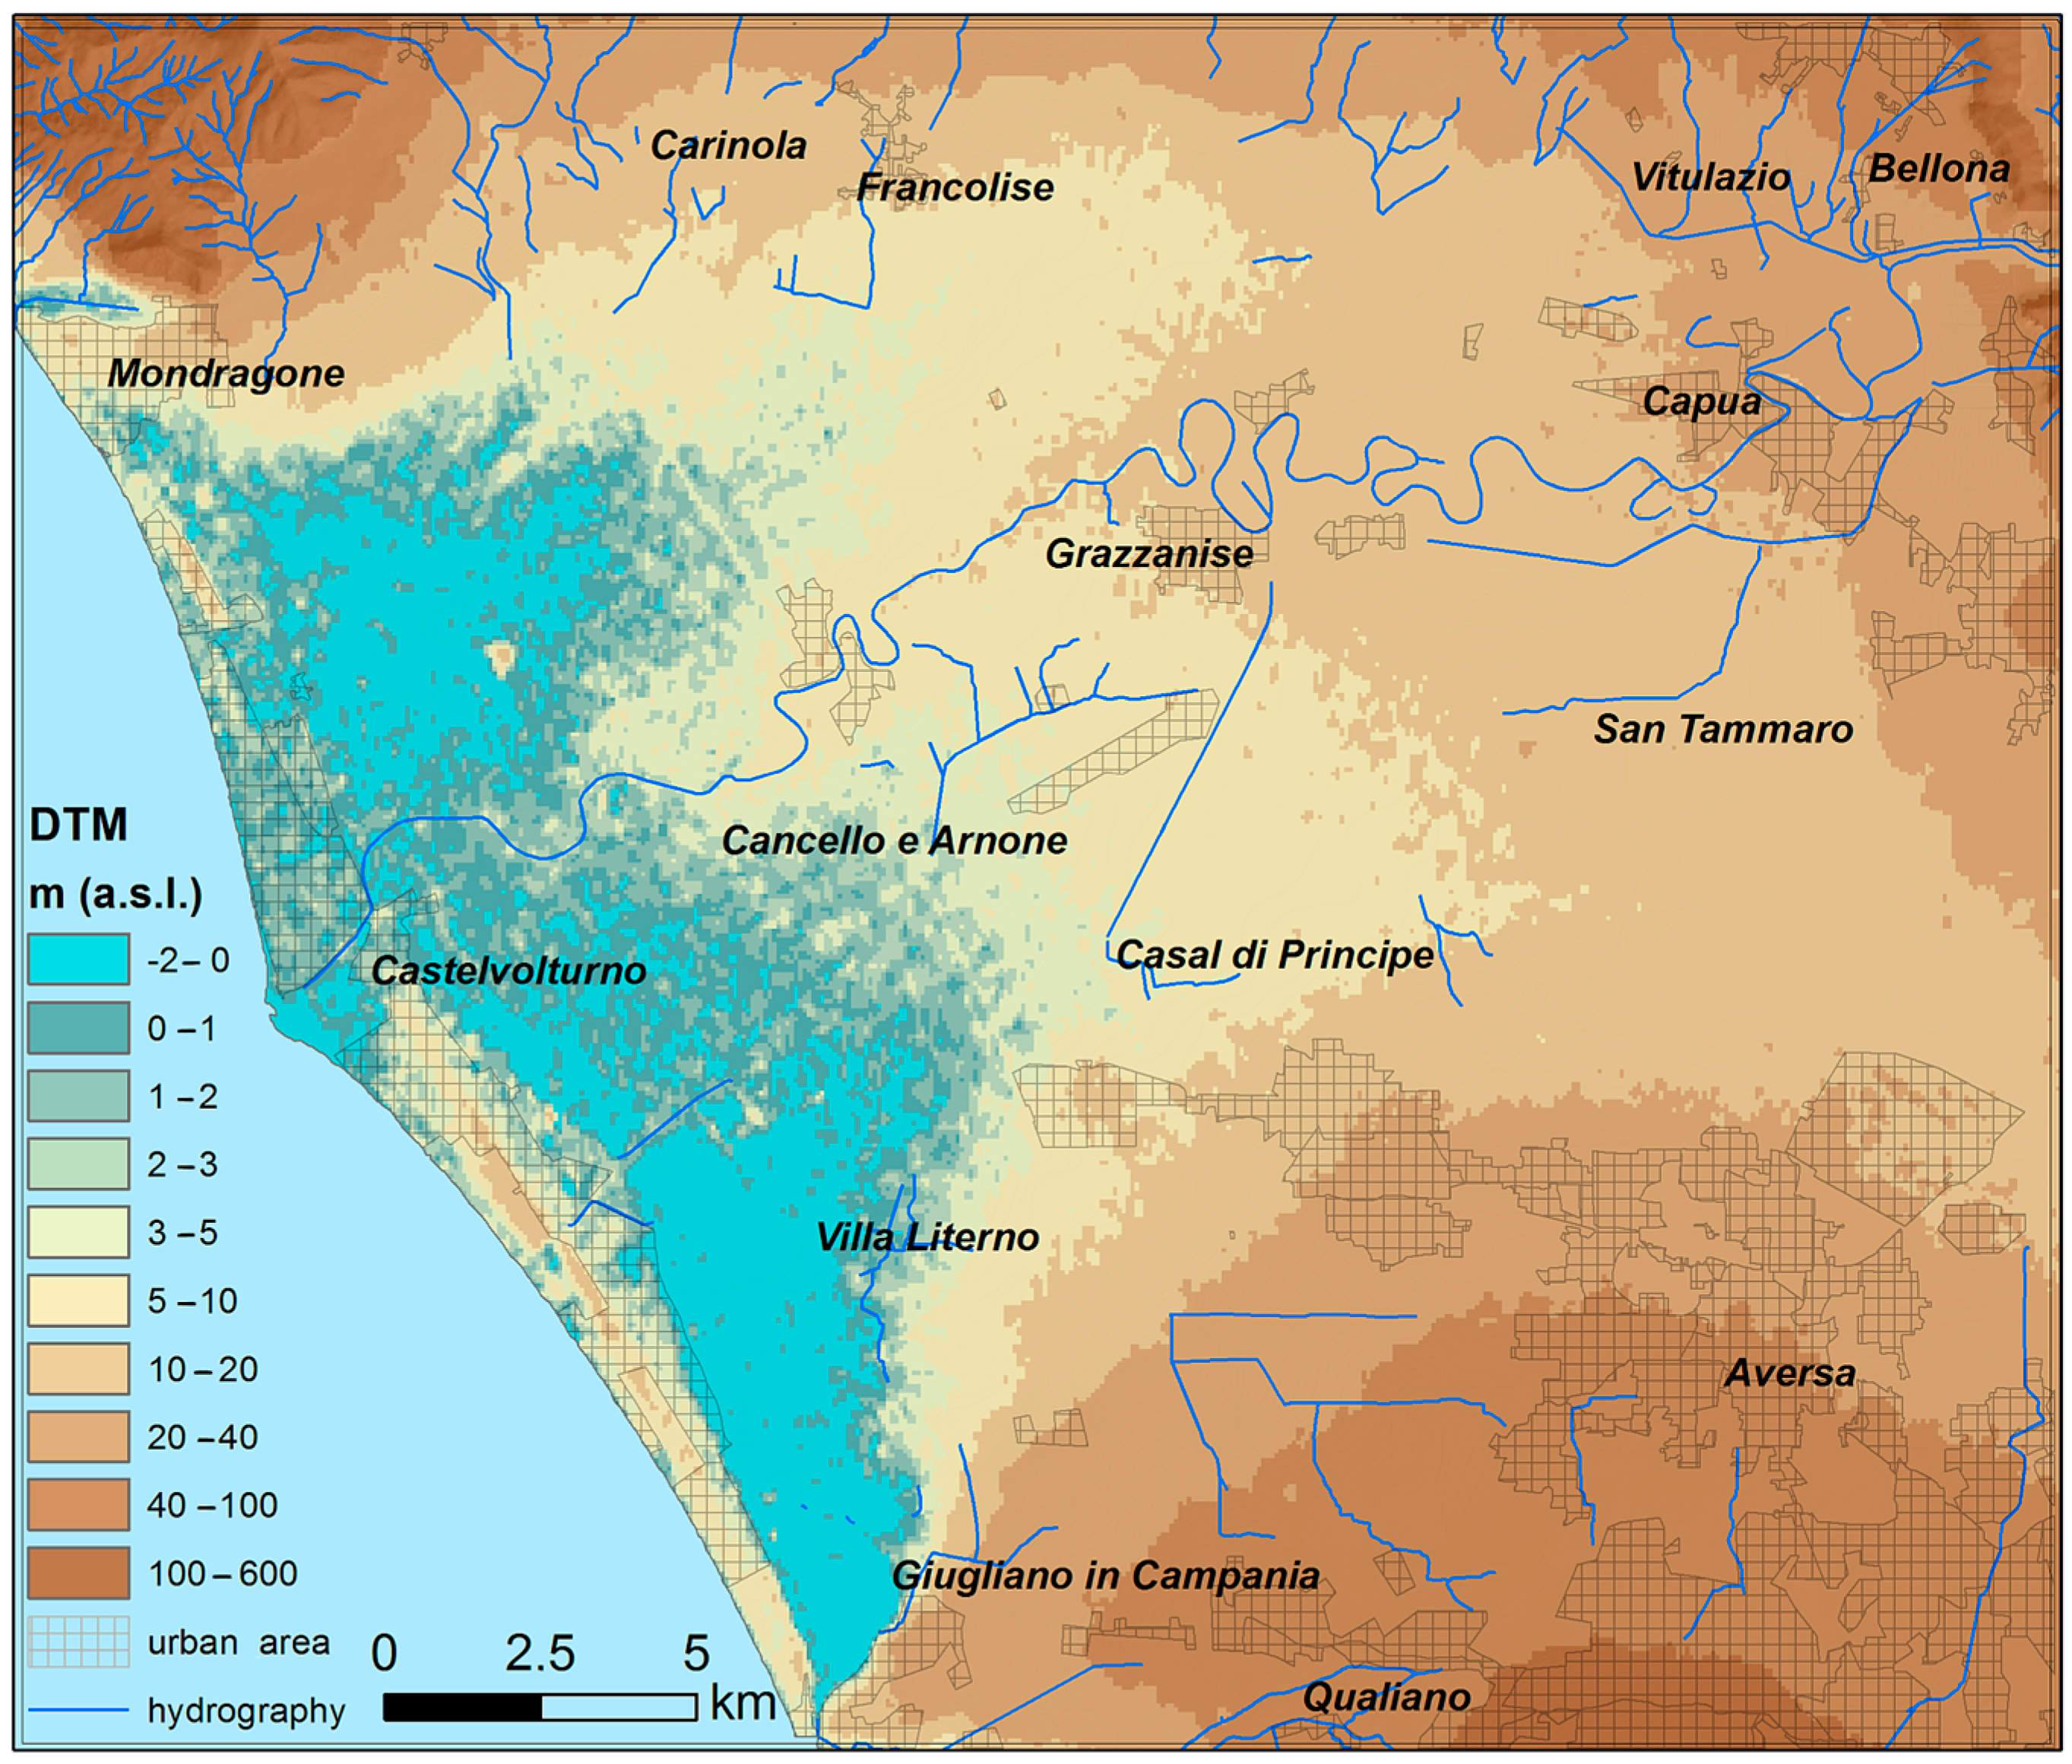
The studied sector of the Volturno plain is characterized by a flat morphology (Figure 3), with a slope <5° and an elevation of 0–40 m above sea level (a.s.l.) from the coastline to the north of Capua. The plain is bordered seaward by a 40-km long sandy beach, behind which there is a wide lowland area with an elevation between 0–2 m a.s.l. (Figure 3). This area is regarded as the remnant of an ancient barrier lagoon system [62,66,67,68,69], which is characterized by clayey and silty alluvial deposits (Figure 2) locally interbedded with peat layers [42].
Most of the coastal plain marshy areas were reclaimed starting in the XVI century, which allowed for the development of agriculture and farming as well as severe urbanization along the coastal zone at the expense of the beach-dune system and along the river course since the mid-1900s [42]. Human activity often resulted in dramatic changes of the landscape, loss of coastal wetland and accelerated coastal erosion [39,40,41,65]. The effects of the above anthropic impacts are currently adding complexity to a scenario characterized by long-term land subsidence and predicted sea-level rise [69].
The study area is incised by a network of natural and artificial streams belonging to two major hydrographic catchments, which are namely the Volturno River and Regi Lagni channel. The relatively flat morphology of the coastal plain is characterized by the occurrence of a topographic high (up to 8–10 m a.s.l.) formed by Holocene dune ridge, which develops in NW–SE direction at approximately 4 km inland with respect to the present-day current shoreline. The ridge is locally interrupted by the linear erosion processes associated with the course of the Volturno River, Regi Lagni channel and Patria Lake emissary [37].
The Volturno plain is characterized by a locally high concentration of infrastructure (roads, railways, etc.) and inhabited areas both in coastal sectors (Castelvolturno and Mondragone towns) and in inland areas (Capua, Cancello Arnone), where several farming, agricultural and cheese production activities are located.
Land use shows a strong agricultural activity in the Volturno plain, which indicates that fields are almost completely farmed (81.1%) all year round. The urbanized environment represents a relevant percentage of the area (7.4%), and extends mainly along the coast. Grain cereals and grass cultivations prevail, mostly in association to the numerous zootechnical activities of the area. Most of these are produced by buffalo farming companies. Both cattle breeding and agricultural activities require high amounts of water.
3. Materials and Methods
Several interferometrically-processed (PSI approach) datasets, derived by some Italian national [23,24,25] and Campania regional [13,20,21,22] remote-sensing projects, are available for research activity and territorial planning and monitoring.
Recent trends in ground deformations of the Italian territory have been established and have been made available by processed sets of archive SAR images of ERS-1/2, RADARSAT 1 and ENVISAT satellites. The interferometric processing was performed both at the national scale, within the frame of the Not-Ordinary Plan of Environmental Remote Sensing [23,24] by means of the Persistent Scatterer Pair (PSP) technique [19,28,29], and at a regional scale, within the activities of the TELLUS Project [13,20,21,22] by means of the Permanent Scatterers (PS-InSAR) standard technique [27].
The PS-InSAR processing allows for detection of the displacements through the time of man-made or natural reflectors (Permanent Scatterers, PS) along the radar LOS. This is obtained by separating time-dependent surface motions, atmospheric delays and elevation-error components of the measurement [27,71,72,73]. The main results for each PS consist of a time series of the variation in the sensor-target distance along the LOS (ground deformation) over the entire acquisition period, which includes the annual average velocity of the displacement calculated by linear fitting. This technique requires a master scene and a stable reference point, assumed motionless, to which the zero in the time series and the relative measurements of deformation are respectively referred [27].
The PSP technique [19,28,29] overcomes some limitations of other PS standard methods. Due to the pair-of-point approach, the PSP outputs are not affected by artifacts that are slowly variable in space, similar to those depending on atmosphere or orbits. This approach guarantees very dense and accurate displacement measurements both for anthropic structures and natural terrains [19].
The ERS-1/2, RADARSAT and ENVISAT satellites provided a comprehensive archive of imagery, which is currently used as a retrospective tool for historical interferometric monitoring of ground deformations. With reference to the Volturno plain study area, which extends for about 770 km2, 354 images of ERS-1/2, RADARSAT 1 and ENVISAT satellite were used for PSI interferometric processing in the source projects (Table 1).
The average incidence angles of LOS are in the range of 22–34°, with a relevant difference between ERS-1/2, ENVISAT (22–25°) and RADARSAT (32–34°) angles (Table 1). The ERS-1/2 reference time range is from June 1992 to December 2001, whereas ENVISAT and RADARSAT acquisition periods range from November 2002 to July 2010 with overlapping datasets between March 2003 and September 2007 (Table 1).
For the study area, we have collected and post-processed six PS datasets (Table 2): (a) ENVISAT ascending orbit; (b) ENVISAT descending orbit; (c) RADARSAT ascending orbit; (d) RADARSAT descending orbit; (e) ERS-1/2 ascending orbit and (f) ERS-1/2 descending orbit. The PS datasets include about 506.000 PSs, which were identified within the study area with a coherence higher than 0.65. The selected datasets are characterized by negative mean values of displacement velocities in both ascending and descending orbits (Table 2). Specific PSI techniques used for each dataset are also listed (Table 2).
PS datasets have been georeferenced to the projection WGS-84 UTM Zone 33N and spatially processed using GIS software. Each point of the four PS shapefile datasets is identified by coordinates (North, East) and a set of attributes, including: (a) identifier code; (b) average velocity of entire acquisition time period, expressed in mm year−1; (c) standard deviation of the average velocity; (d) coherence; and (e) a subset of measurements (expressed in mm) of the displacement along the LOS of each PS. The PS coherence is a normalized index of the local signal-to-noise ratio of the interferometric phase and reflects the accuracy of PS measurements [14,74,75,76]. PSI processing allows us to obtain very accurate measurements within 1.0 mm/year for the PS average velocity along the LOS by assuming a threshold value of 0.65 for coherence [33,71,75,77,78] thanks to the large number of SAR images used for the processing (Table 1).
Due to the side-looking view of SAR satellite sensors, PS displacements are measured along the LOS, which is in the range of 22–34° in the study area (Table 1). The availability of both ascending and descending datasets allows for the evaluation of the vertical components of the deformation for those areas common to both acquisition geometries, based on simple trigonometric calculations [16,33]. We could extract only two spatial components of ground deformation (vertical and E–W horizontal components), as the N–S horizontal component cannot be valued by the SAR satellite acquisition system [16].
The mean displacement rates have been used to derive the annual average ground deformation LOS velocity maps for ascending and descending orbits of ERS-1/2, RADARSAT and ENVISAT PS data by the Inverse Distance Interpolation Weighted (IDW) method. The IDW approach is commonly used to interpolate scattered points, thus allowing preservation of local variability of the data and reliable results [37,79,80]. An interpolation method, consisting of a quadratic weighting power of 2 within a 500-m radius neighborhood [16,33], was used to obtain 50-m regularly spaced grids. The vertical components of the mean annual velocity of the ground deformation have been computed using the ascending and descending LOS velocities (vLOSasc and vLOSdesc) raster maps derived from ERS-1/2, RADARSAT and ENVISAT data.
The vertical component of the velocity was calculated by combining the vLOSasc and vLOSdesc raster maps on pixels common to both maps [13,16,32,33,81,82], which assumed that the ascending and descending LOS belong to the East–Z plane and the look-angle is the same for both ascending and descending geometries. Based on these assumptions, the following equation [16,33] was used:
where “v” is the displacement velocity vector of an investigated PS; vVert is the projection along the Cartesian vertical axes; vLOSdesc and vLOSasc are the projections of velocity along different LOSs; and q is the look-angle. A value of q given by the average of the two LOS incidence angles of the ascending and descending orbits was used for the calculation of vVert related to each satellite dataset, which was 22.5° for ERS-1/2, 33.25° for RADARSAT and 23.5° for ENVISAT. The obtained 50-m spaced grid maps show the distribution of the vertical components of ground deformation velocity in the Volturno Plain for the datasets in the time periods of 1992–2000 (ERS-1/2), 2003–2007 (RADARSAT) and 2003–2010 (ENVISAT).
In order to obtain a quantitative assessment of the subsidence process, the amount of vertical ground deformation was calculated based on the average yearly vertical velocity for each satellite dataset and the number of years of the time interval to which they are referred (i.e., 9 years for ERS-1/2, 2.5 years for RADARSAT and 5.5 years for ENVISAT, as the overlapping years of RADARSAT and ENVISAT datasets count 0.5 year each). The result is a 50-m spaced grid map, showing the cumulated distribution of vertical movements in the Volturno Plain (expressed in millimeters) for the period of 1992–2010.
4. Results
4.1. LOS Velocity Fields
The LOS velocity data distribution of used PS datasets is mainly characterized by negative values in both ascending and descending orbits for all satellite datasets (Table 3). The mean and median LOS velocity values are negative (respectively ranging from −1.32 to −0.40 mm/year and from −0.83 to −0.01 mm/year) for all datasets, showing an asymmetrical distribution toward negative values. This is due to general subsidence affecting the plain (skewness ranging from −3.62 to −1.49). The Quartile (Q1, Q3) values and the interquartile range (IQR) are similar for all datasets (Table 3). The ranges of “normal” values (less and more than two standard deviations away from the mean) that account for approximately 95% of all data show very similar values for all datasets (Table 3). This implies that the distribution of most (95%) of the data in each dataset is homogenous, which describes a constant and persistent process of ground deformation at the regional scale. Only the extreme maximum and minimum values of velocity (representing approximately 5% of all data) show significant differences, which are usually due to very local causes (e.g., instabilities of anthropic structures or buildings, water extraction from the subsurface or infiltration).
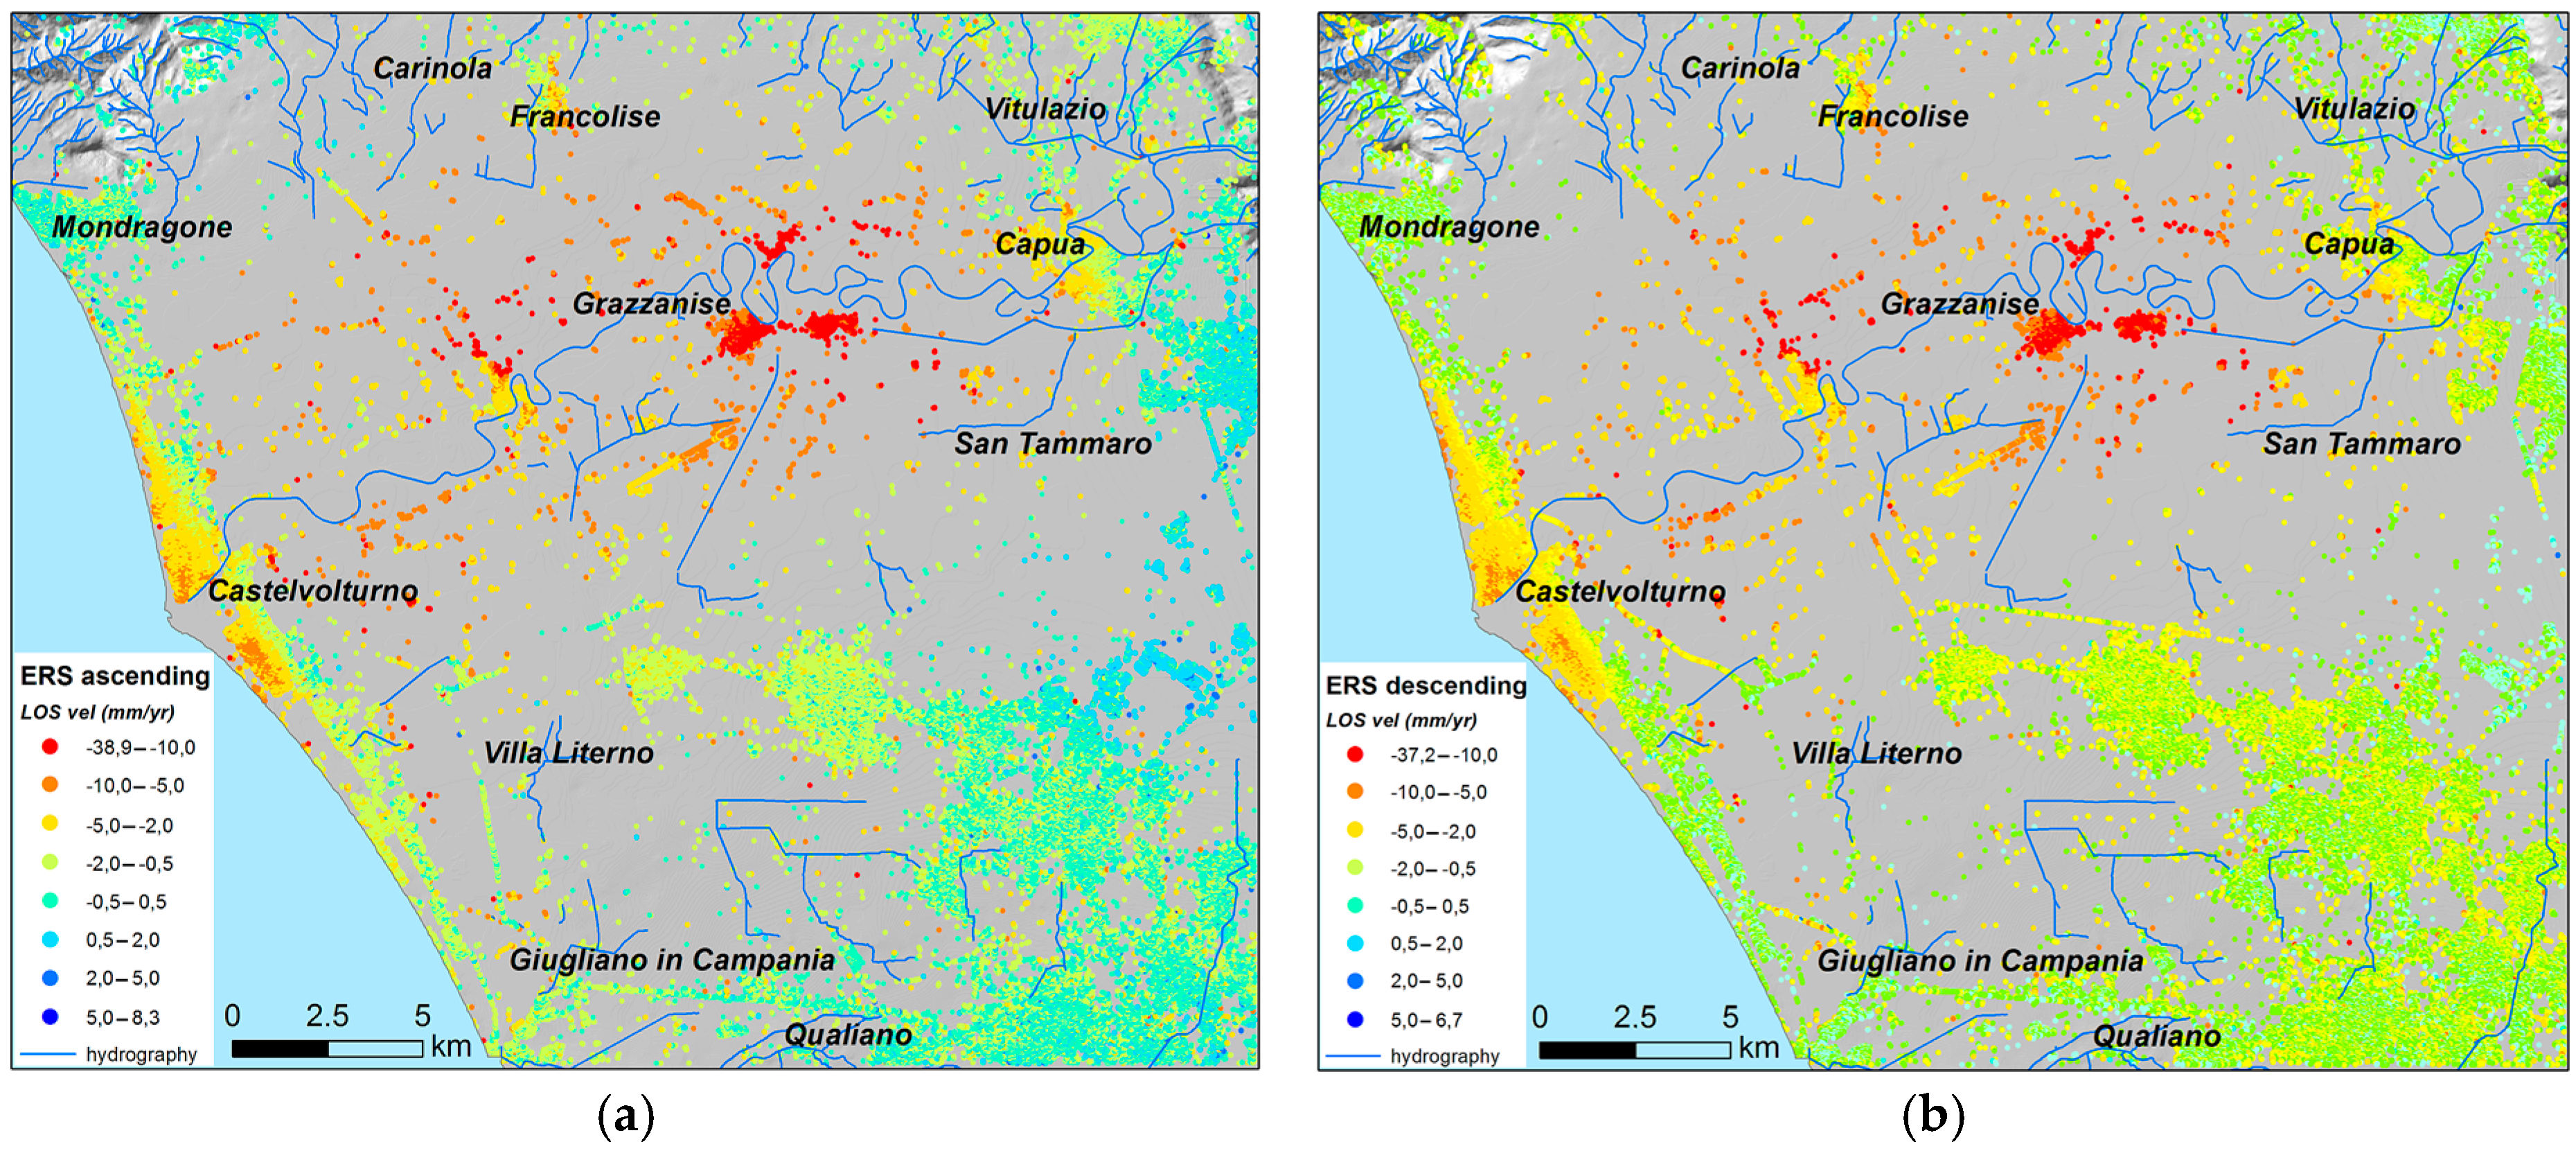
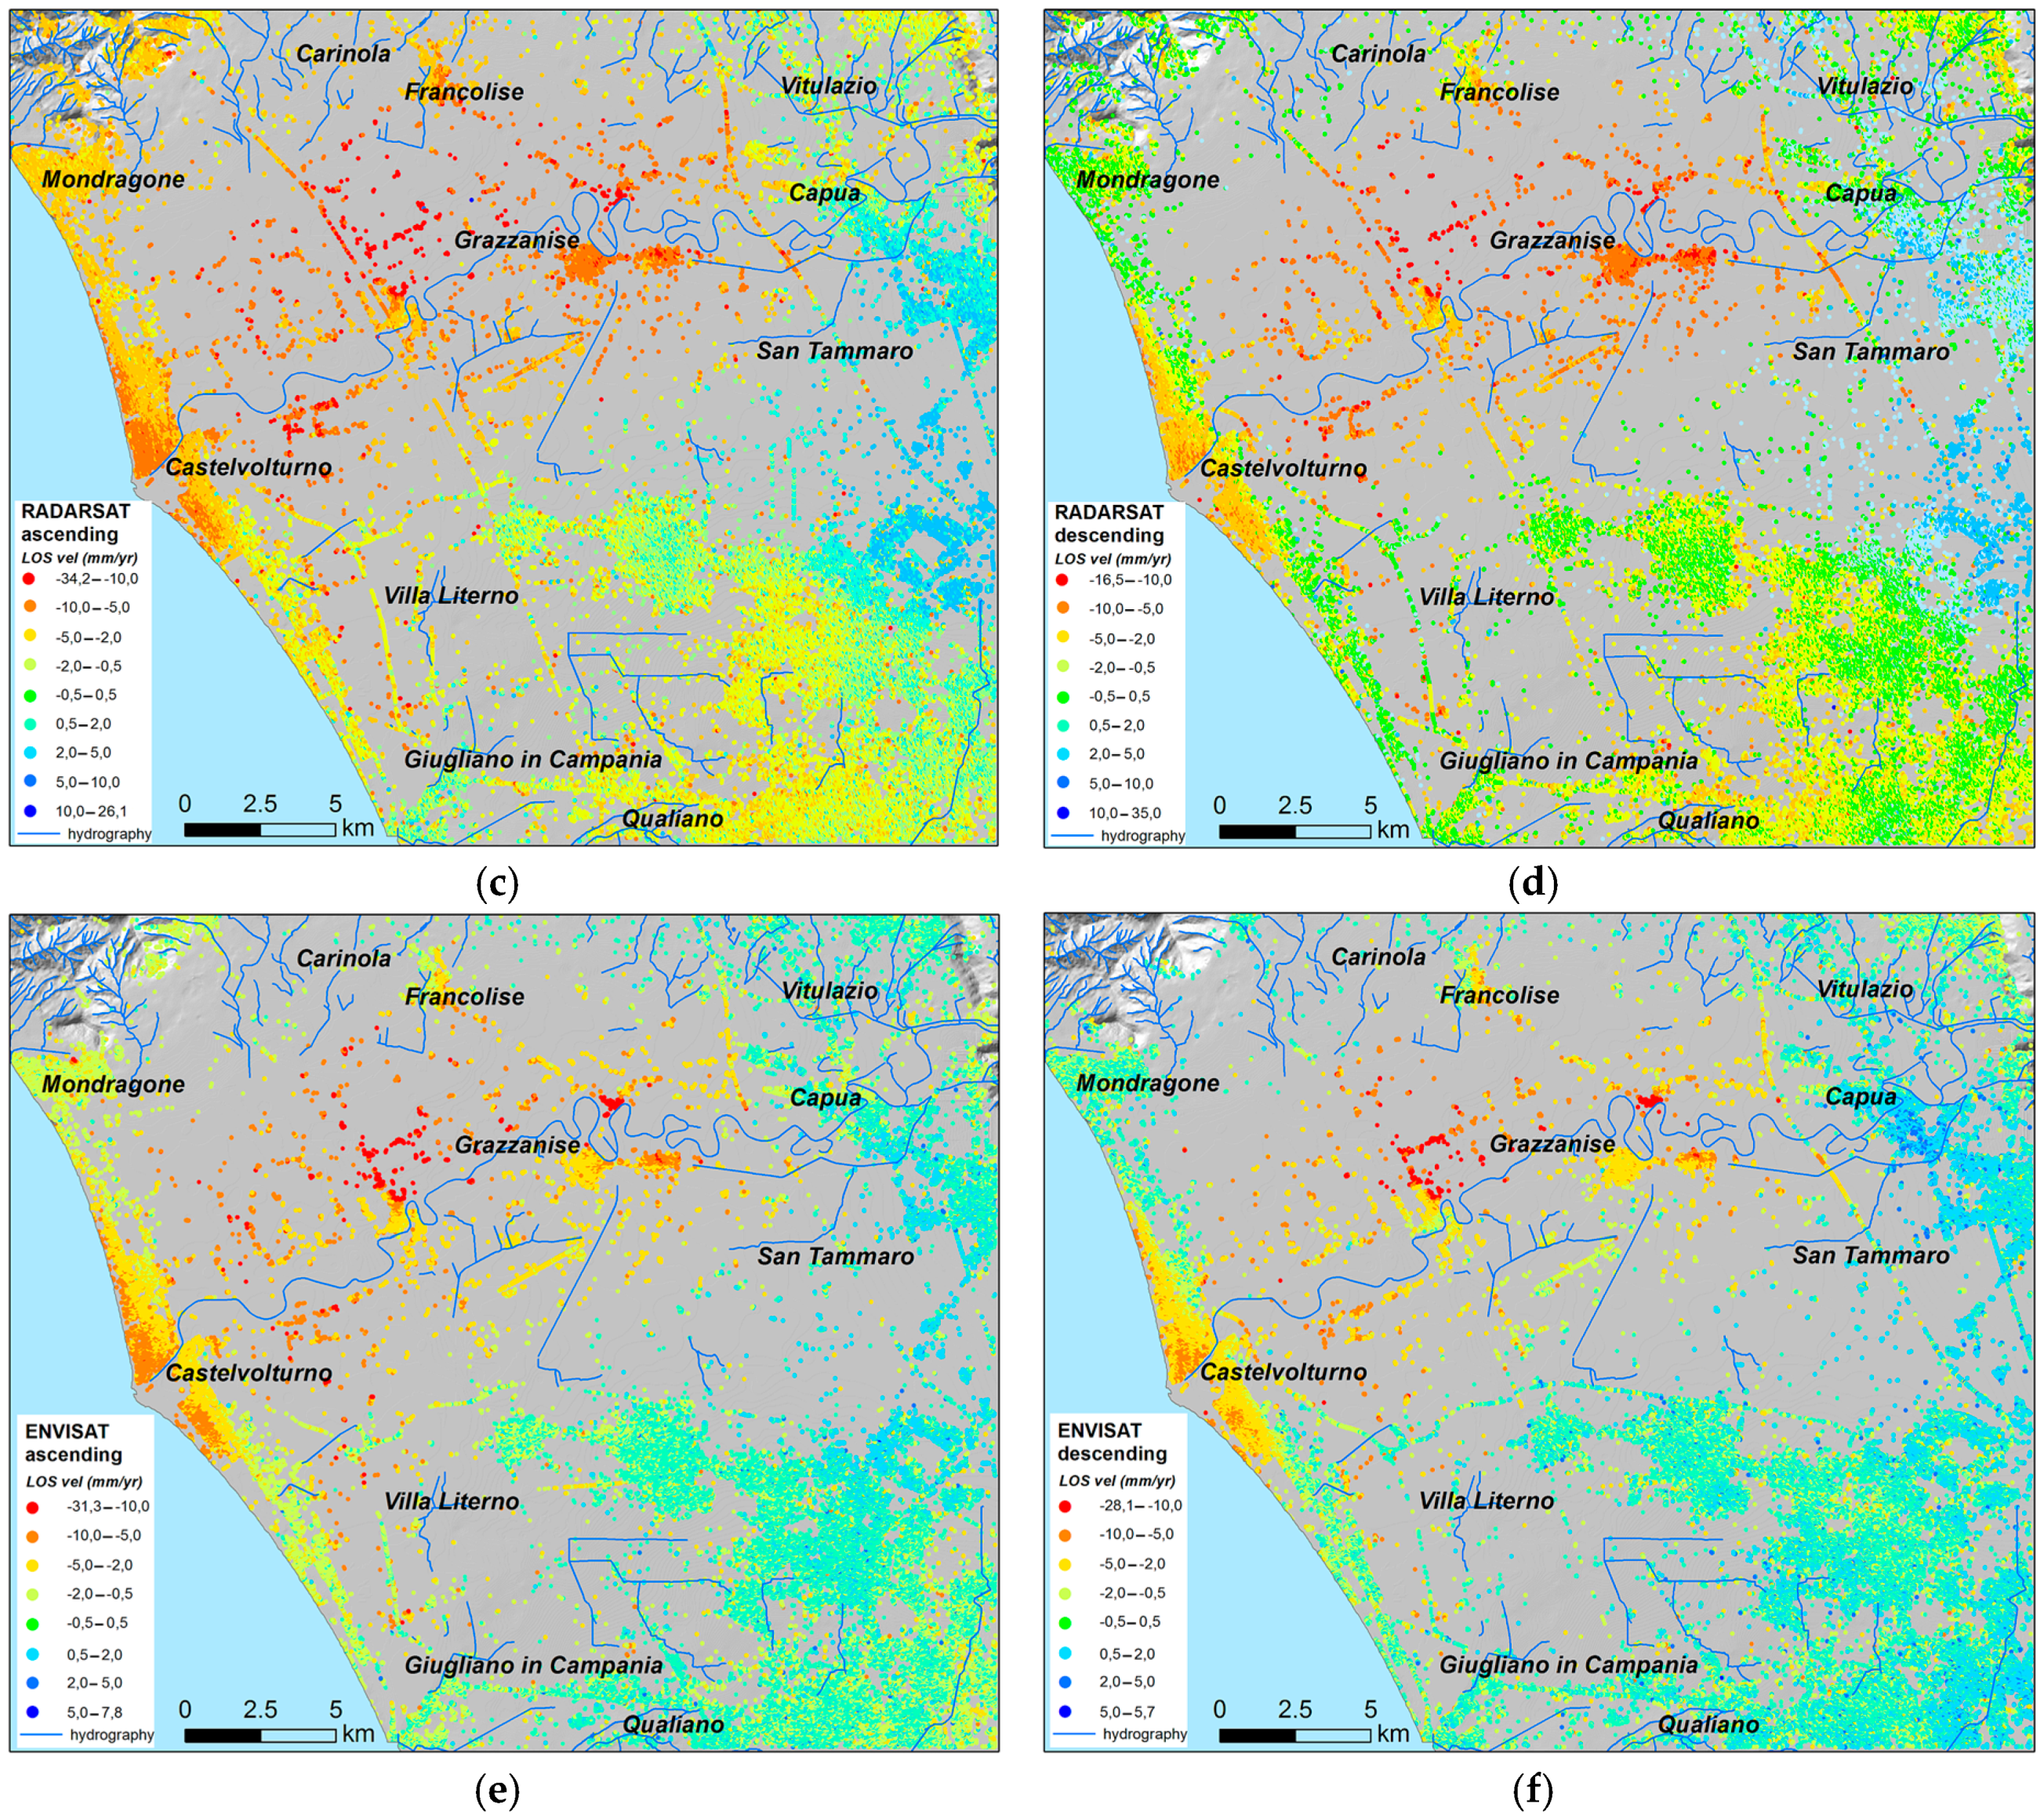
The spatial distribution of PS yearly average LOS velocity values is shown in different maps for both ascending and descending orbits of ERS-1/2, RADARSAT and ENVISAT datasets (Figure 4). All maps show a similar geographical distribution of PSs. Most of the PS are concentrated along linear infrastructures (roads, railway, etc.) and over urban areas, where the concentration of buildings and other manufactured structures is very high (Figure 4). Even if there is no data in local areas, the overall distribution of PS is sufficiently homogenous for a regional analysis of ground deformation. Considering the PS density (Table 2), we observed that ERS-1/2 and ENVISAT datasets are characterized by higher values of 96–157 PS/km2, whereas RADARSAT datasets are characterized by lower values of PS density (72–75 PS/km2). This difference depends on the adopted procedure. For example, using the PSP technique for ERS-1/2 and ENVISAT data processing results in a denser distribution of points for the measurement of displacement [19].
The spatial distribution of the mapped velocity classes displays a common general trend in the six datasets, even though some differences are present in the different maps (Figure 4). The lowest LOS velocity values (lower than −10 mm/year) are recorded in the central sector of the study area (around Grazzanise) and along the Volturno River (Figure 4). The Volturno river mouth shows moderate negative LOS velocity values (−2 to −10 mm/year), whereas positive values (+2 to +10 mm/year) are recorded in the eastern sector (eastward Capua and San Tammaro cities).
In more detail, RADARSAT and ENVISAT datasets display higher positive values in the eastern sector of the study area and less negative values in the central sector of the study area when compared to ERS-1/2 datasets, showing some changes in the intensity of subsidence/uplift velocity during the two decades of observation. Moreover, some datasets show differences in the displacement rates obtained from ascending and descending geometries. RADARSAT datasets show some differences along the coastal area near Castelvolturno, which display higher subsidence in ascending datasets. RADARSAT and ERS datasets are characterized by lower positive values in descending datasets in the eastern uplifting sector. Along the southern sector of the study area, minor differences were found between ascending and descending RADARSAT and ERS datasets. These differences are interpreted as the effect of non-vertical movements affecting those sectors, such as local displacement from East to West along the horizontal component of ground deformation for the coastal area and the eastern sectors.
It is important to note that the difference between the LOS angles for the two orbital systems (32–34° compared to 22–25°; Table 1) can only justify a difference of a few mm/year in the values of LOS velocity related to the same ground deformation phenomenon. Consequently, only a minor part of the discrepancy between RADARSAT and ERS/ENVISAT datasets are ascribed to the geometrical differences in the satellite acquisition geometry.
4.2. Vertical Components of Ground Deformation Velocity
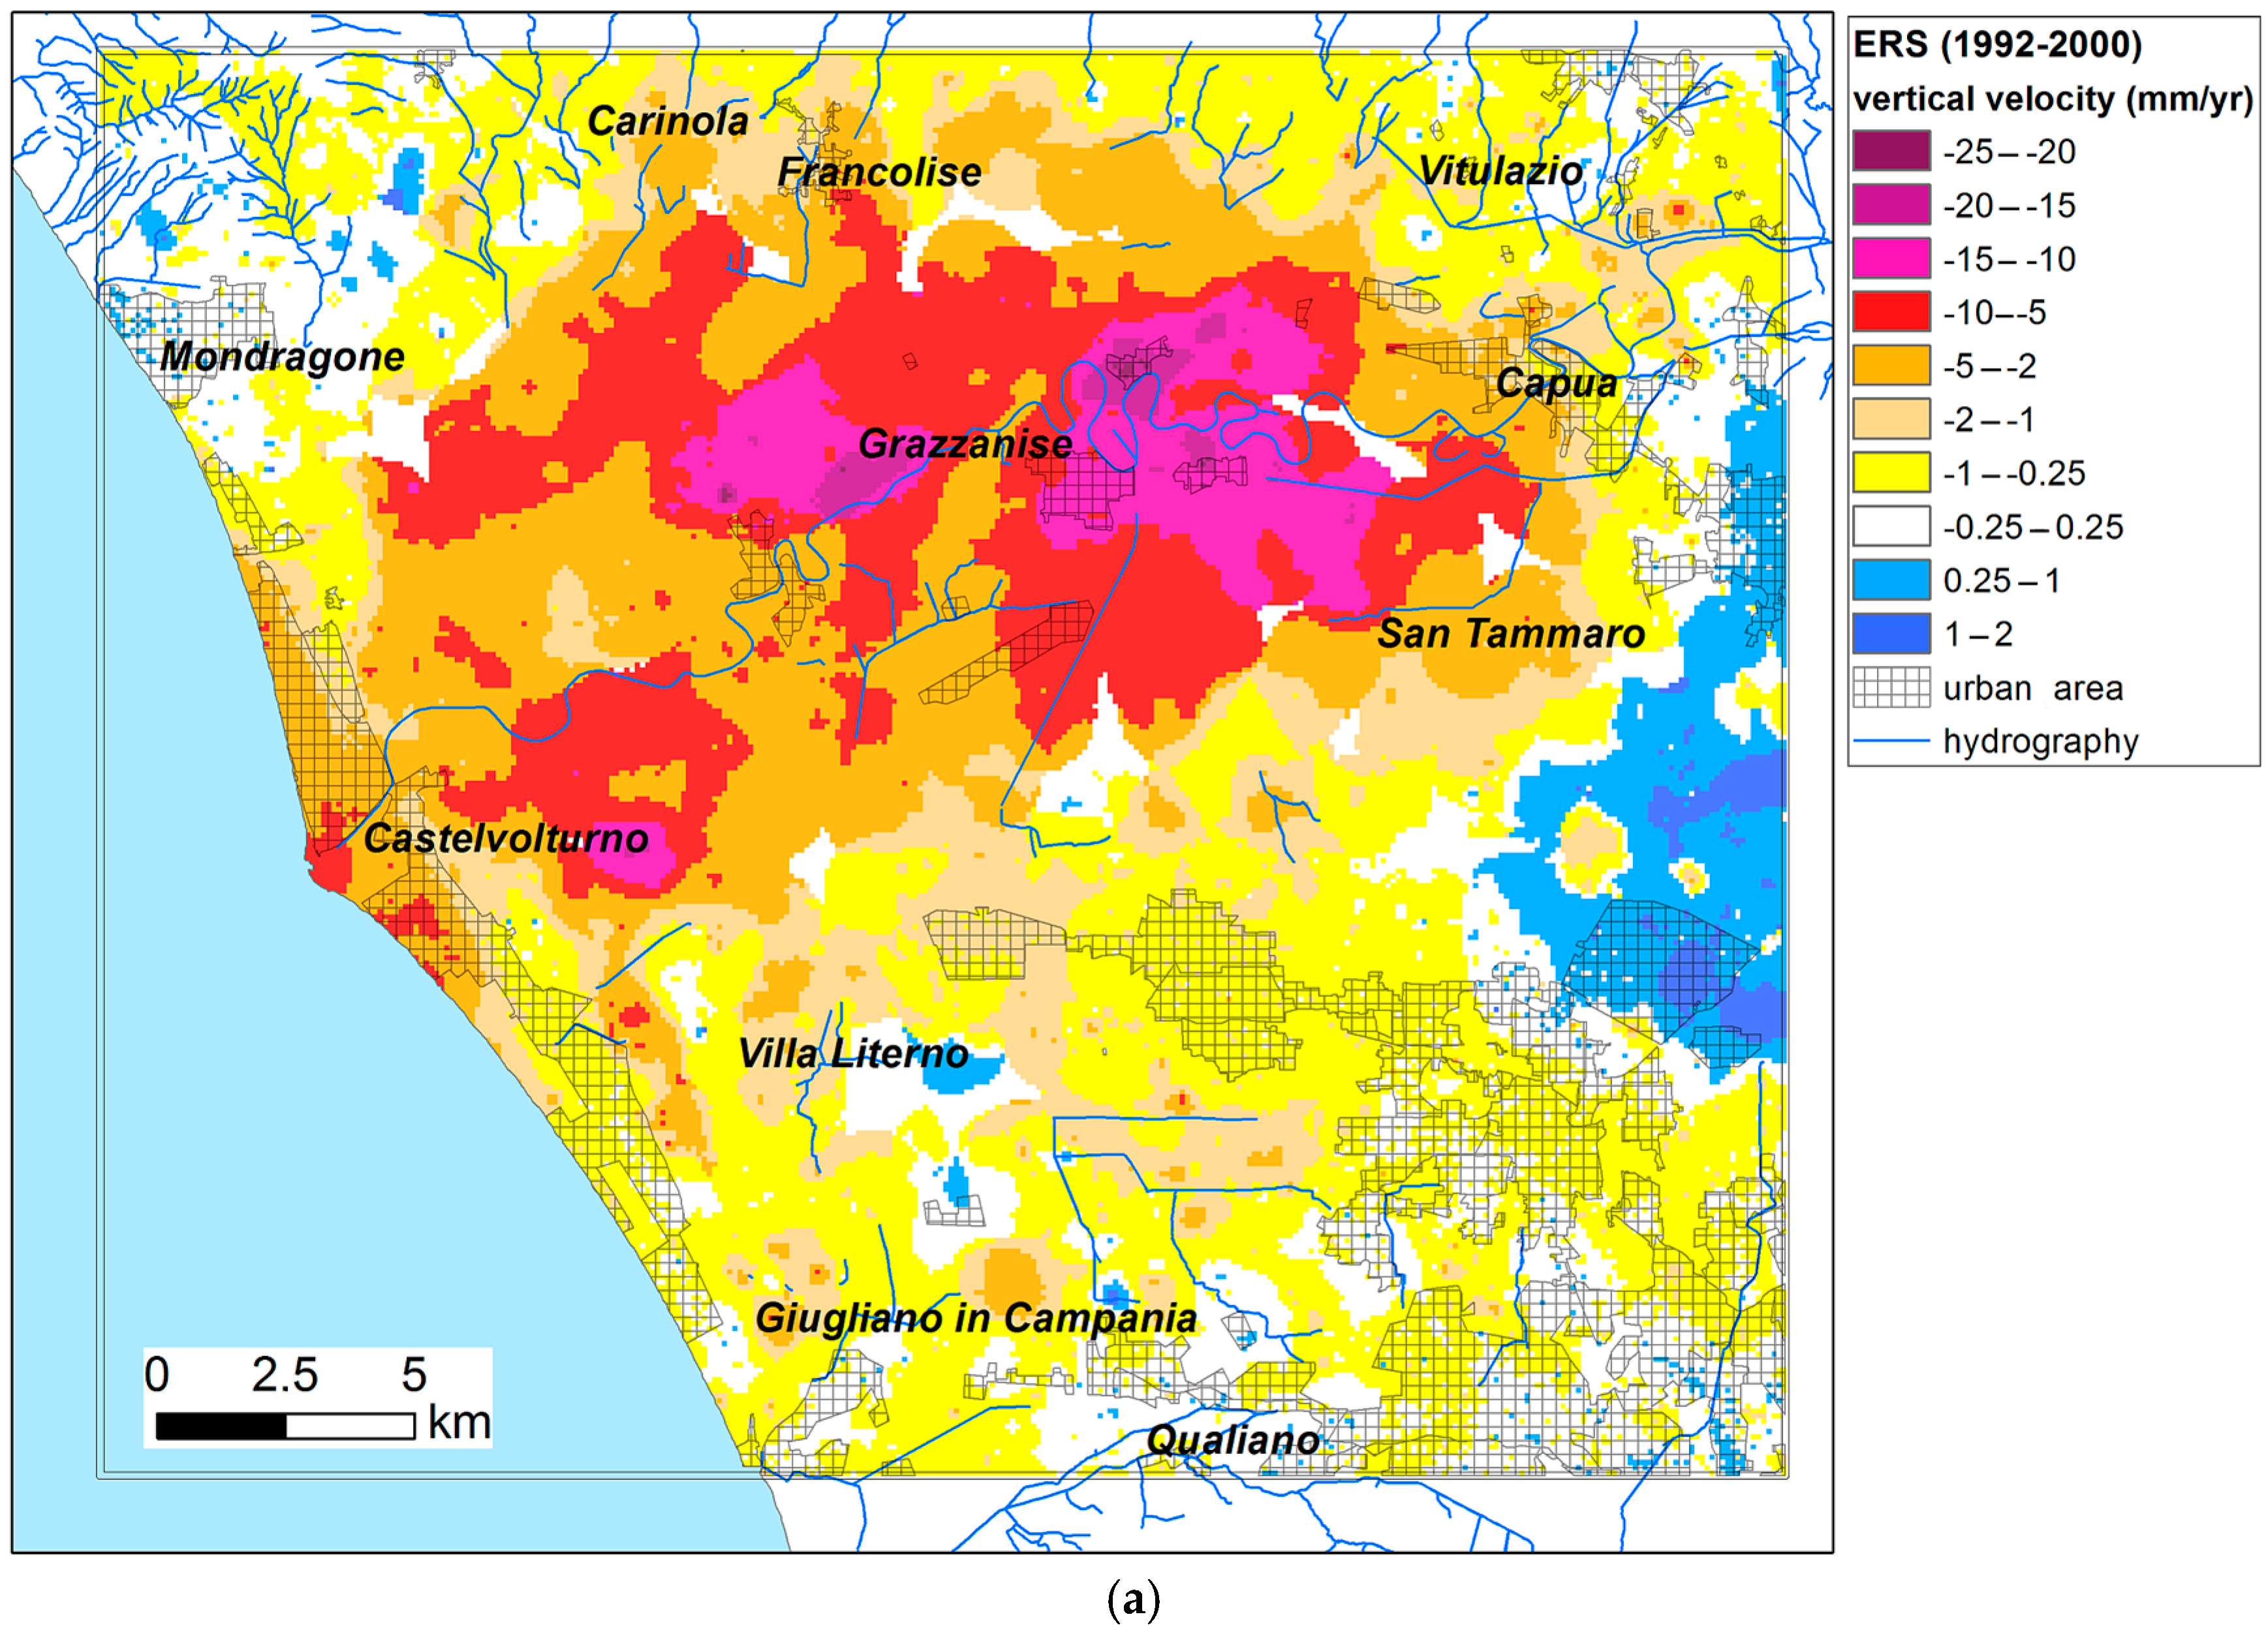
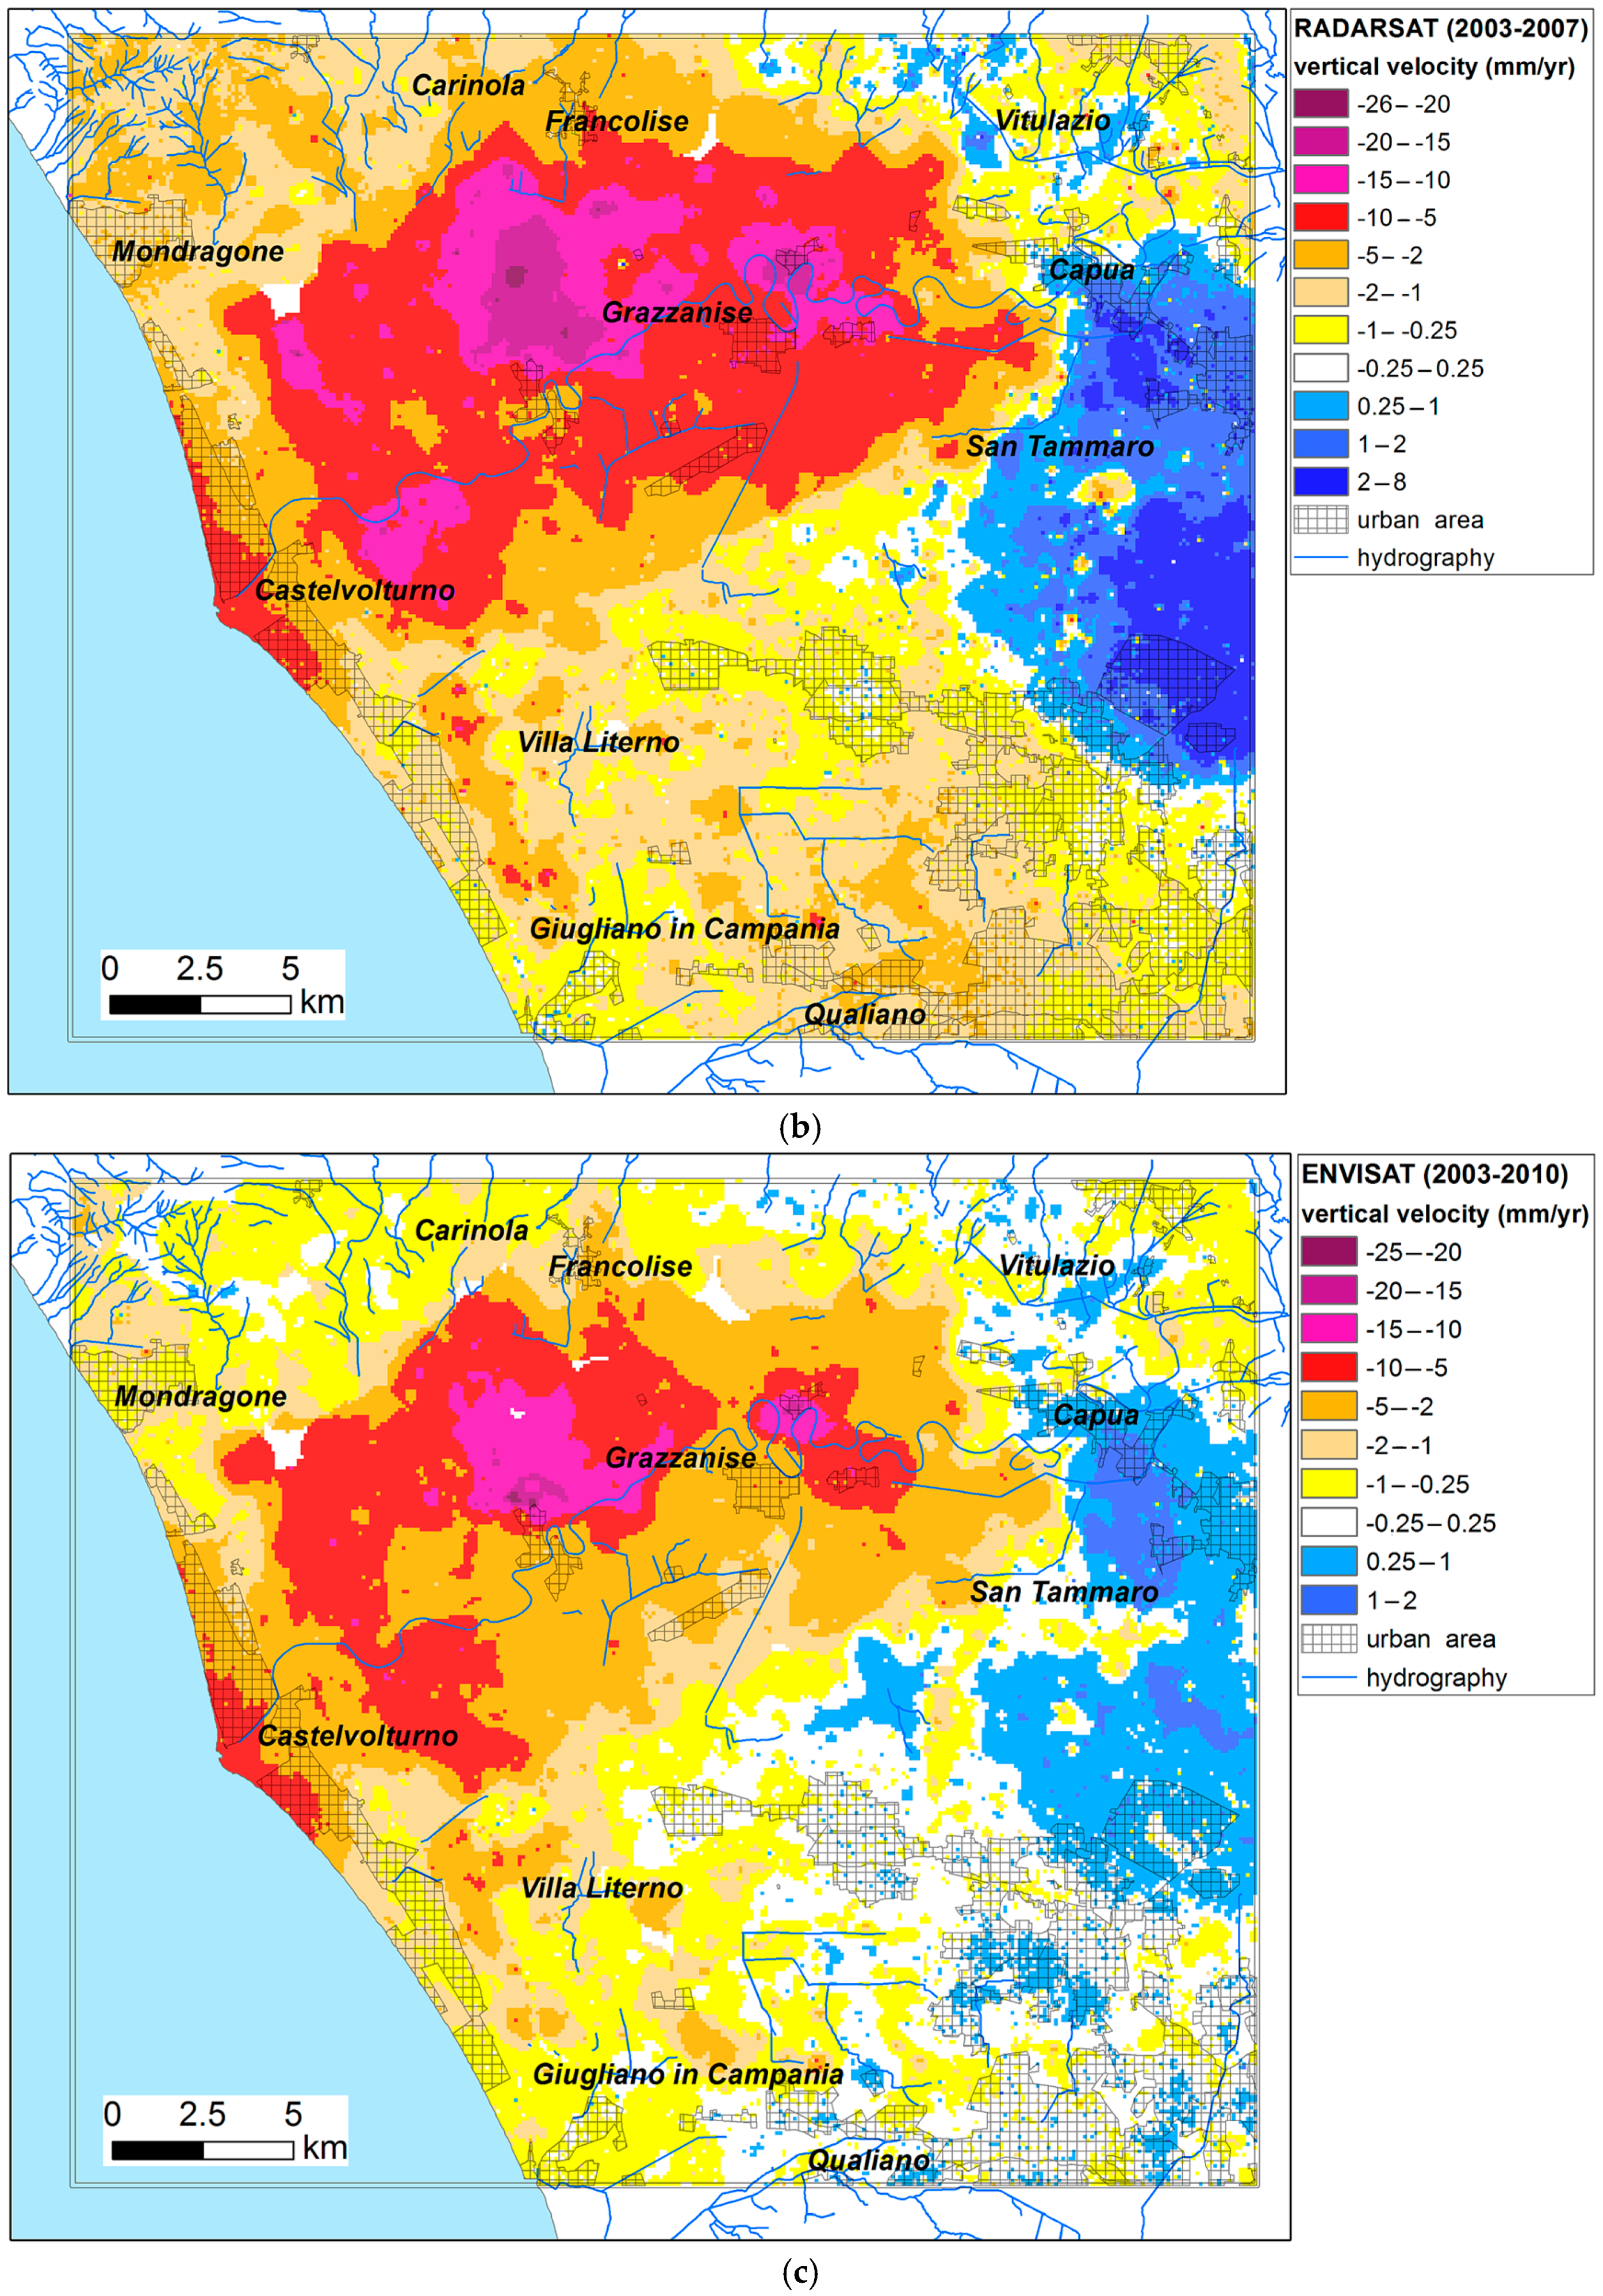
The maps of the vertical component of the displacement velocity, derived by the processing of ascending and descending LOS velocities maps, demonstrate that the study area has been characterized by similar vertical velocity patterns over the 1992–2000 (Figure 5a), 2003–2007 (Figure 5b) and 2003–2010 (Figure 5c) time intervals.
All the vertical velocity maps (Figure 5) indicate significant ground deformation in central-northern part of the Campania plain, which is mostly concentrated along the course of the Volturno River and around Grazzanise since the early 1990s. The subsidence rates are in the order of −33 to −15 mm/year. Wider areas that are also affected by significant subsidence processes with rates of −15 to −5 mm/year occur along the Volturno river channels in several areas: the central sector of the plain, along the lateral flood plains, on the lowland area at the back of the dune system (Villa Literno) and at the estuary area of Castelvolturno. An uplift sector with positive (uplift) rates of +0.25 to +8 mm/year is detected to the East of San Tammaro, which is located in the eastern sector of the study area.
Even though the main ground deformation trends are consistent throughout the processed datasets, the differences between subsiding and uplifting sectors appear more marked and extended on the 2003–2010 maps (Figure 5b,c), which show uplifting sectors displaying rates up to +8 mm/year. In contrast, subsiding areas of the intermediate class (−5 to −10 mm/year) appear wider on the 2003–2007 map (Figure 5b).
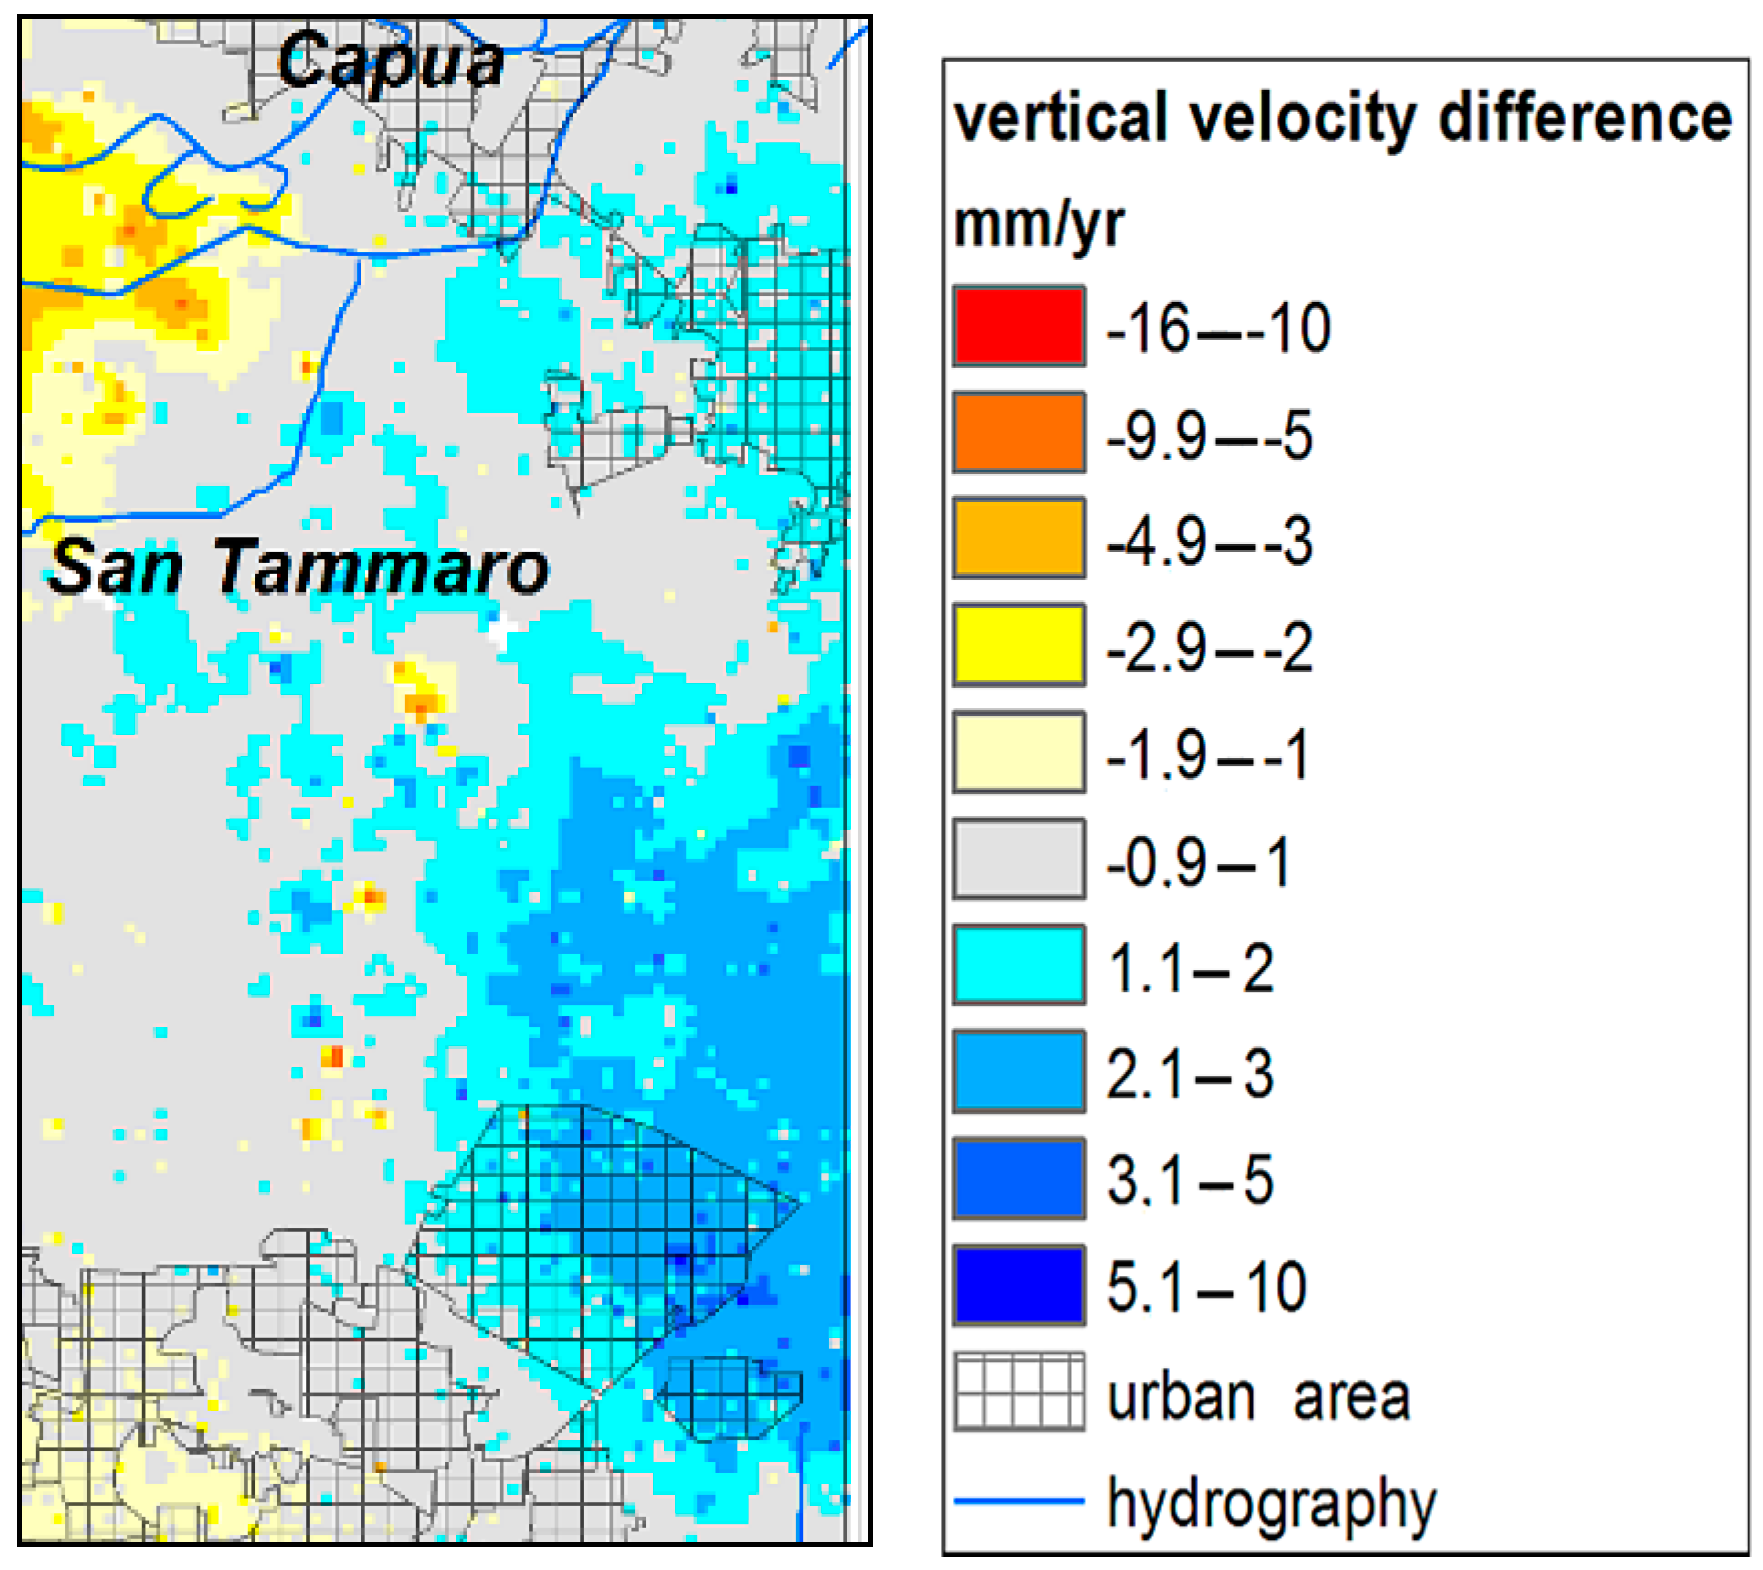
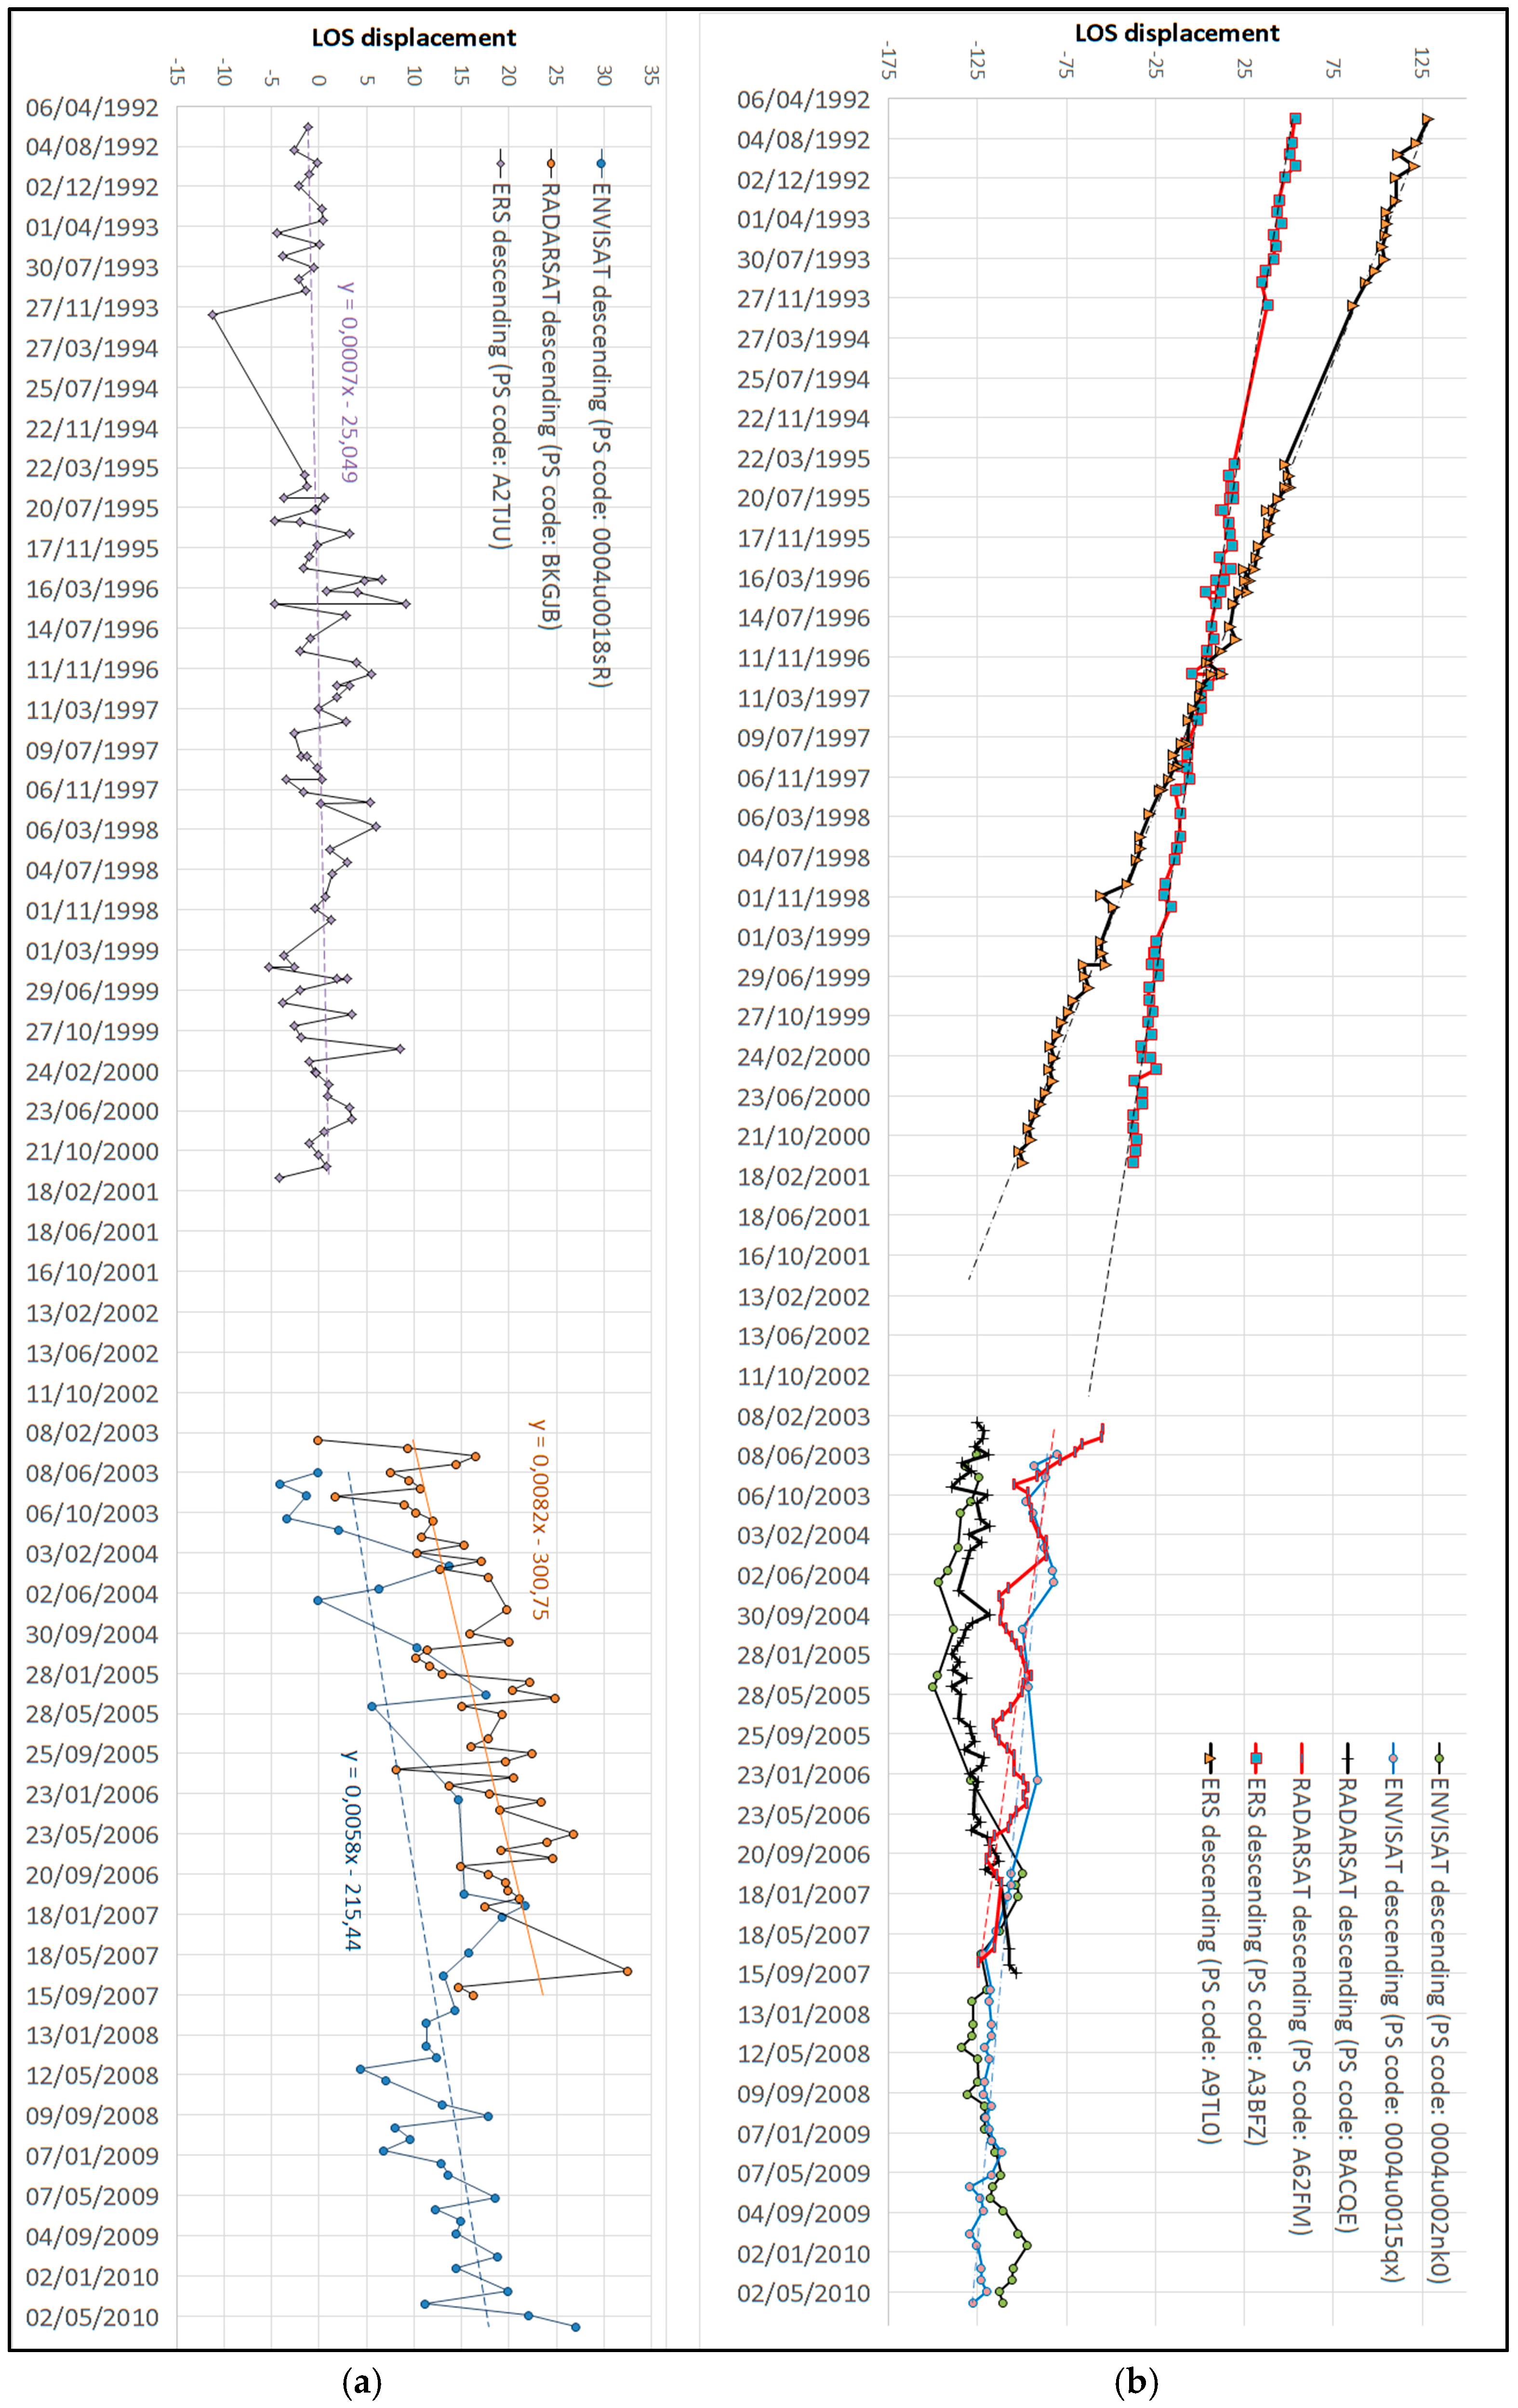
The differences in vertical velocity rates between RADARSAT and ENVISAT datasets in the uplifting sector (Figure 6) are mainly limited to 1–3 mm/year, with RADARSAT velocity rates being higher than the ENVISAT datasets. These differences are likely to depend on the different values of LOS incidence angle of the two orbital systems and also reflect a net change in the intensity of subsidence/uplift velocity between the two periods. This change is observed in the displacement time series trends in Figure 7a. The same considerations can be made for areas affected by subsidence, which are characterized by different negative values in RADARSAT and ENVISAT datasets (Figure 7b).
4.3. Subsidence Assessment
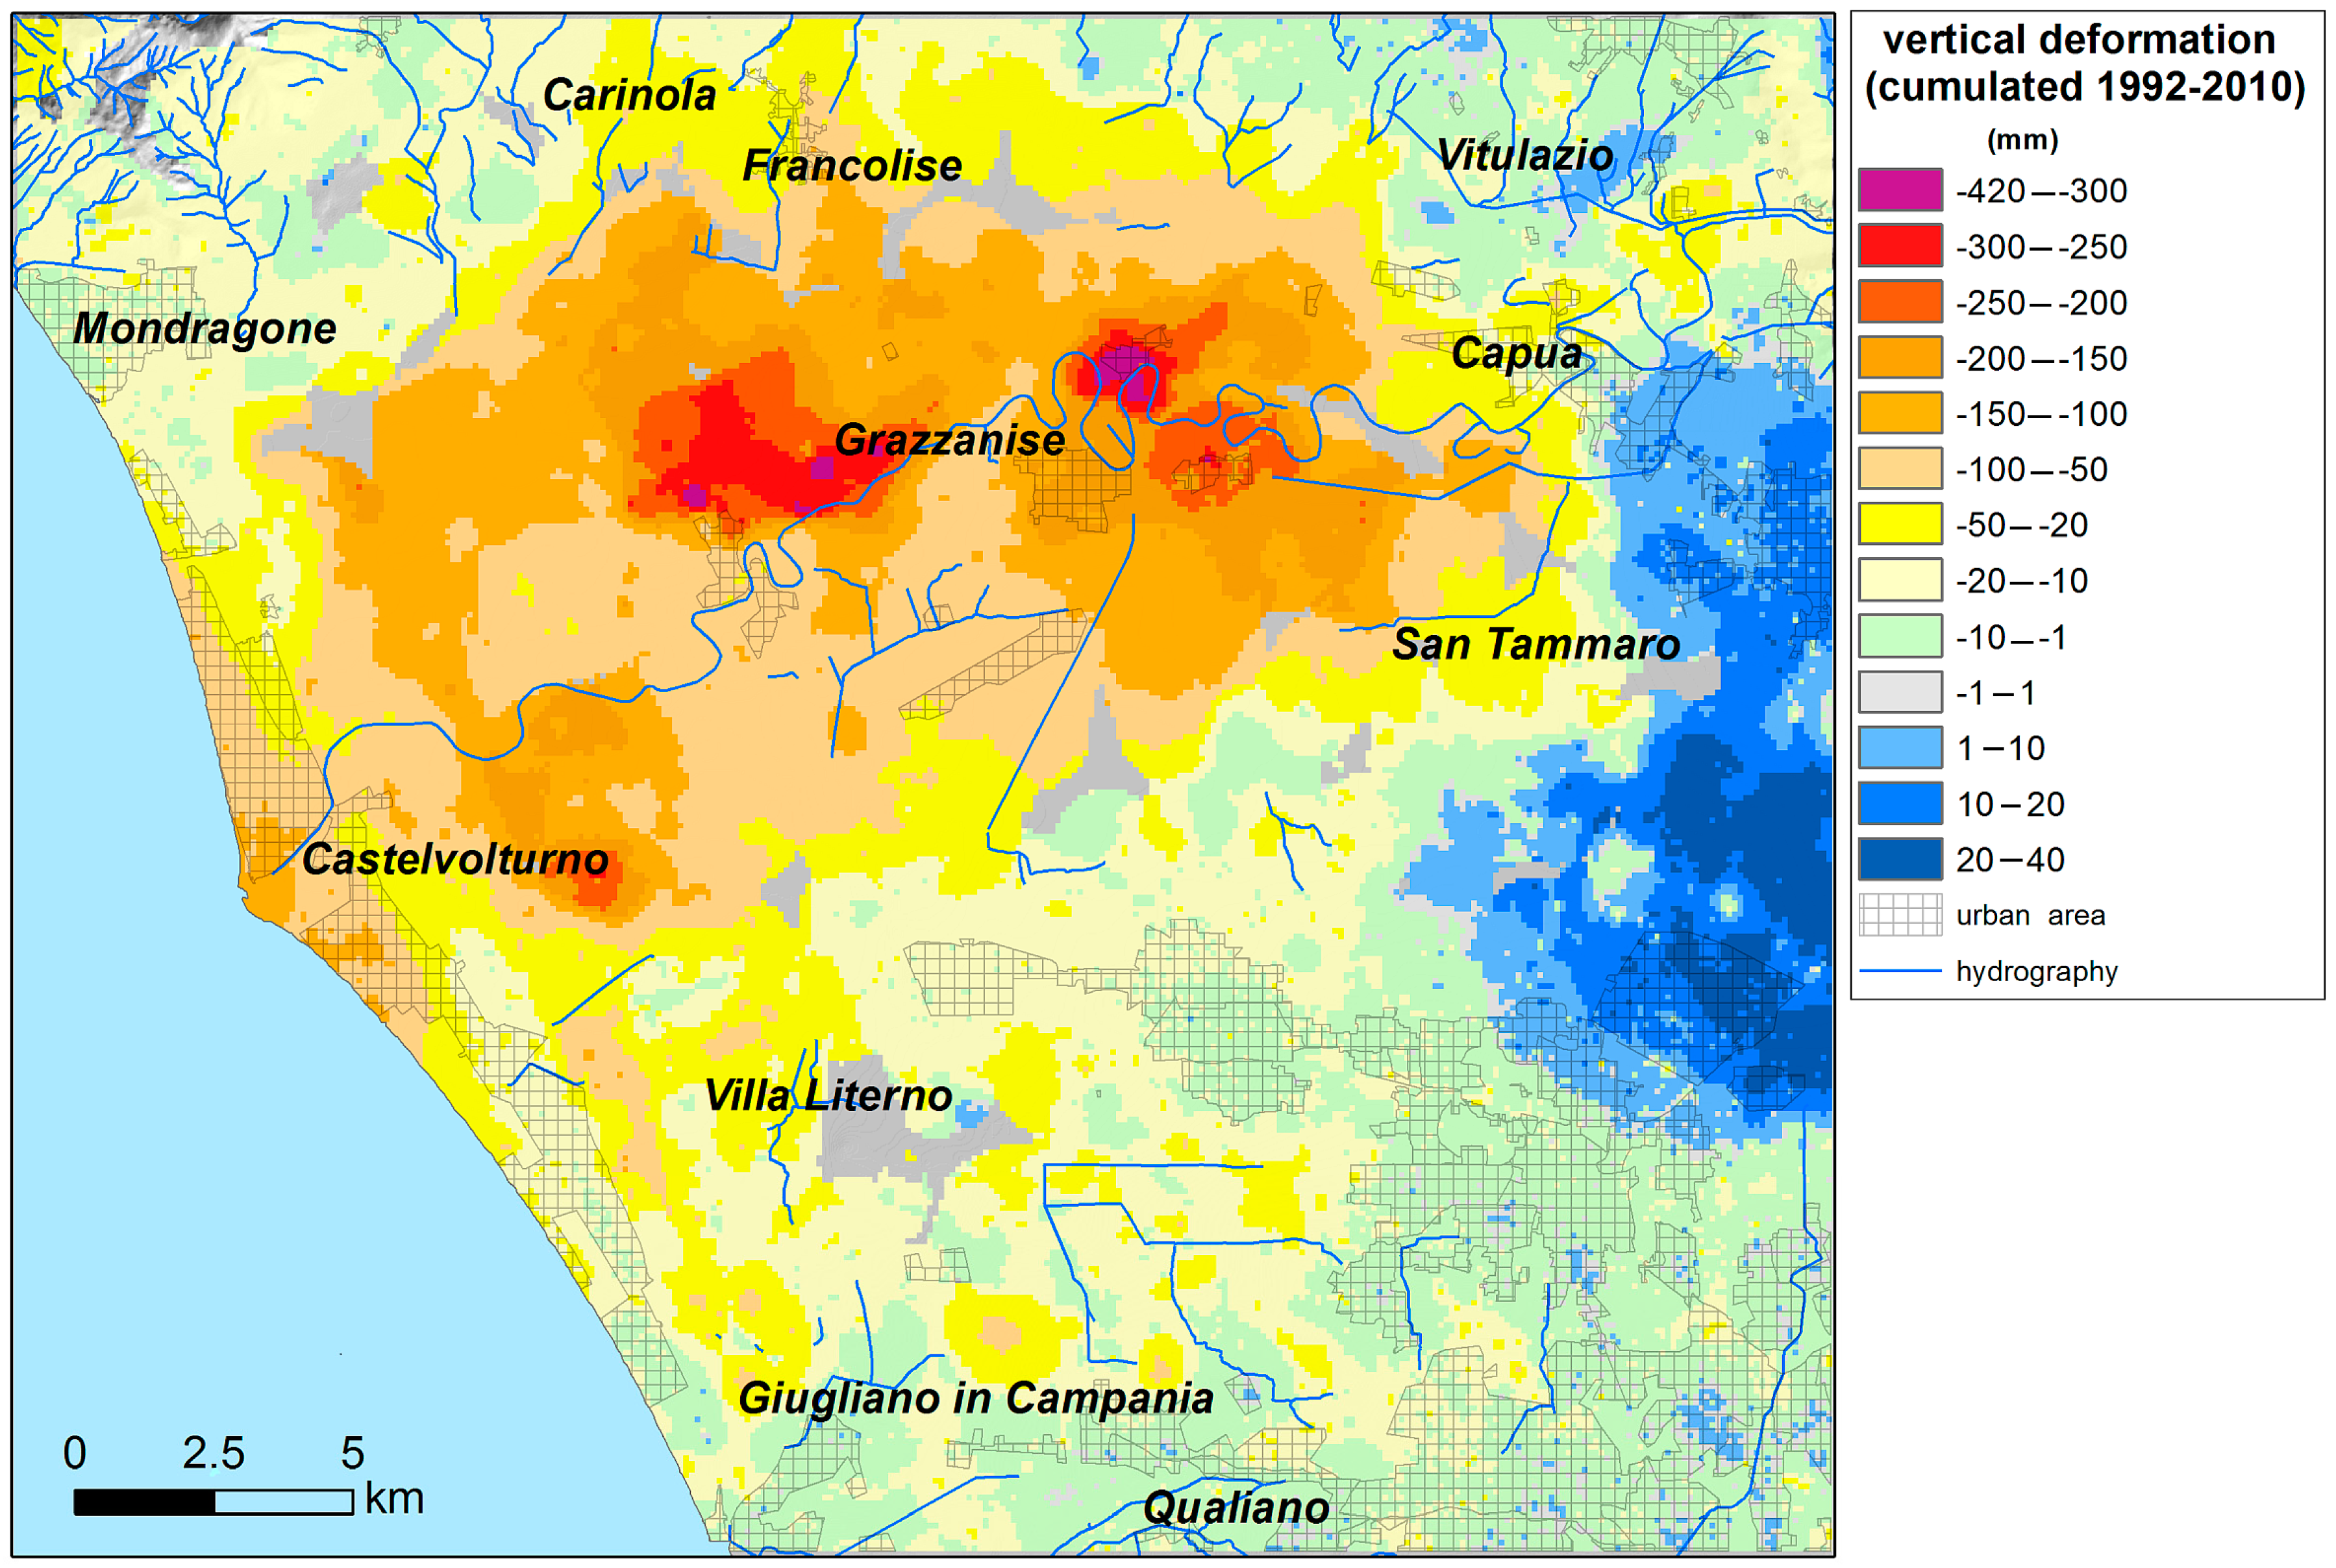
A quantitative assessment (expressed in mm) of subsidence and uplift processes affecting the Volturno plain has been obtained by calculating the cumulative amount of the vertical deformation of ground surface, which was derived by the average annual vertical velocity of the three processed satellite datasets. The map of Figure 8 shows that approximately 89% of the study area (685 km2) is characterized by negative values (from 0 to −417.4 mm). Only the remaining part, representing approximately 11% of the area (85 km2), is characterized by positive values (from 0 to +40 mm) in the analyzed time interval (1992–2010).
If we regard the coastal plain sectors characterized by vertical ground movements with values between +10 and −10 mm as being stable (green, gray and light blue colors in the map of Figure 8), almost 200 km2 (26% of the study area) shows no significant evidence of subsidence or uplift during the period of 1992–2010. Conversely, the central part of the Volturno Plain shows a large area of 215 km2, corresponding to approximately 30% of the investigated area, which displays subsidence values ranging from −50 to −418 mm. This sector is characterized by a complex deformation pattern (Figure 8) with the highest negative values (lower than −200 mm) along the course of the Volturno River around the city of Grazzanise. High subsidence values (−50 to −200 mm) are found in the more external sectors of the alluvial plain and the back-dune depressions, which extend for approximately 8 km2, in the vicinity of Villa Literno. The coastal sector close to the Volturno river mouth (approximately 10 km2) is characterized by moderate subsidence values (−50 to −150 mm), whereas the dune ridge system shows very slight subsidence or stability. Low subsidence (−10 to −50 mm) was found in the remaining sectors of the plain, which are located to the North and to the South of the Volturno River. The eastern sector (East of San Tammaro and Capua cities), extending for approximately 40 km2 and corresponding to approximately 5% of the investigated area, displays moderate uplift with vertical ground movements between +10 mm and +40 mm (Figure 8).
5. Discussion
Vertical deformation values derived by the post-processing of selected PSI datasets indicate that the Volturno river plain is characterized by a complex trend of vertical ground deformation. A 19-year period of observation (1992–2010) revealed that a moderate subsidence (between −50 mm and −10 mm) has characterized most of the investigated area. Severe subsidence has been detected in the central sectors of the plain with ground deformation lower than −200 mm along the course of the Volturno River and values lower than −150 mm close to the river mouth. Conversely, the eastern part of the study area, East of San Tammaro and Capua, is characterized by the occurrence of a slightly uplifting sector (Figure 8). The maps created in this study, which are based on results from different datasets (Figure 5), indicate that the study area is generally characterized by consistent vertical velocity patterns during the two periods of observation (1992–2000 and 2003–2010). LOS displacement time series (Figure 7) of some exemplative PS located (Figure 9) both in the subsiding sector near Grazzanise and in the uplifting sector near San Tammaro display mainly linear trends, which are characterized by continuous subsidence or uplift with similar rates through time. This behavior is substantially different from that observed in the adjacent structural domain of the Campi Flegrei (Figure 1). In fact, LOS displacement time series (Figure 7b) derived from the selected PS located near Pozzuoli clearly indicate that the Campi Flegrei district is characterized by remarkably non-linear behavior of ground deformation, due to repeated alternation between phases of uplift and subsidence. This is ostensibly related to active volcano–tectonic processes occurring in the volcanic caldera [12].
The interpretation of mechanisms controlling ground deformation patterns in the Volturno Plain is quite complex, as the entire coastal area has suffered from severe land use and profound landscape modifications during the last three centuries [42]. On the coastal zone, especially along the shoreline [37,42], a wild growth of both touristic and residential housing over the last decades has had a dramatic environmental impact. In turn, the increasing construction load and water pumping activity have contributed to enhance the longer-term subsidence rates due to tectonics [47,48], as suggested by a comparison of the 1992–2000 ERS-1/2 (Figure 4a) and 2003–2010 RADARSAT-ENVISAT datasets (Figure 4b,c).
Vilardo et al. [16] have proposed that the subsidence characterizing the Volturno plain is mostly due to the negative balance between the water recharge rates of the Volturno basin and the drainage operated by the artificial channeling, which is related to industrial and intense agricultural activities. The lack of an unequivocal correlation of subsidence trends with agricultural land use and zootechnical farm location [44] indicates that these human activities do not exert a significant impact on regional subsidence rates.
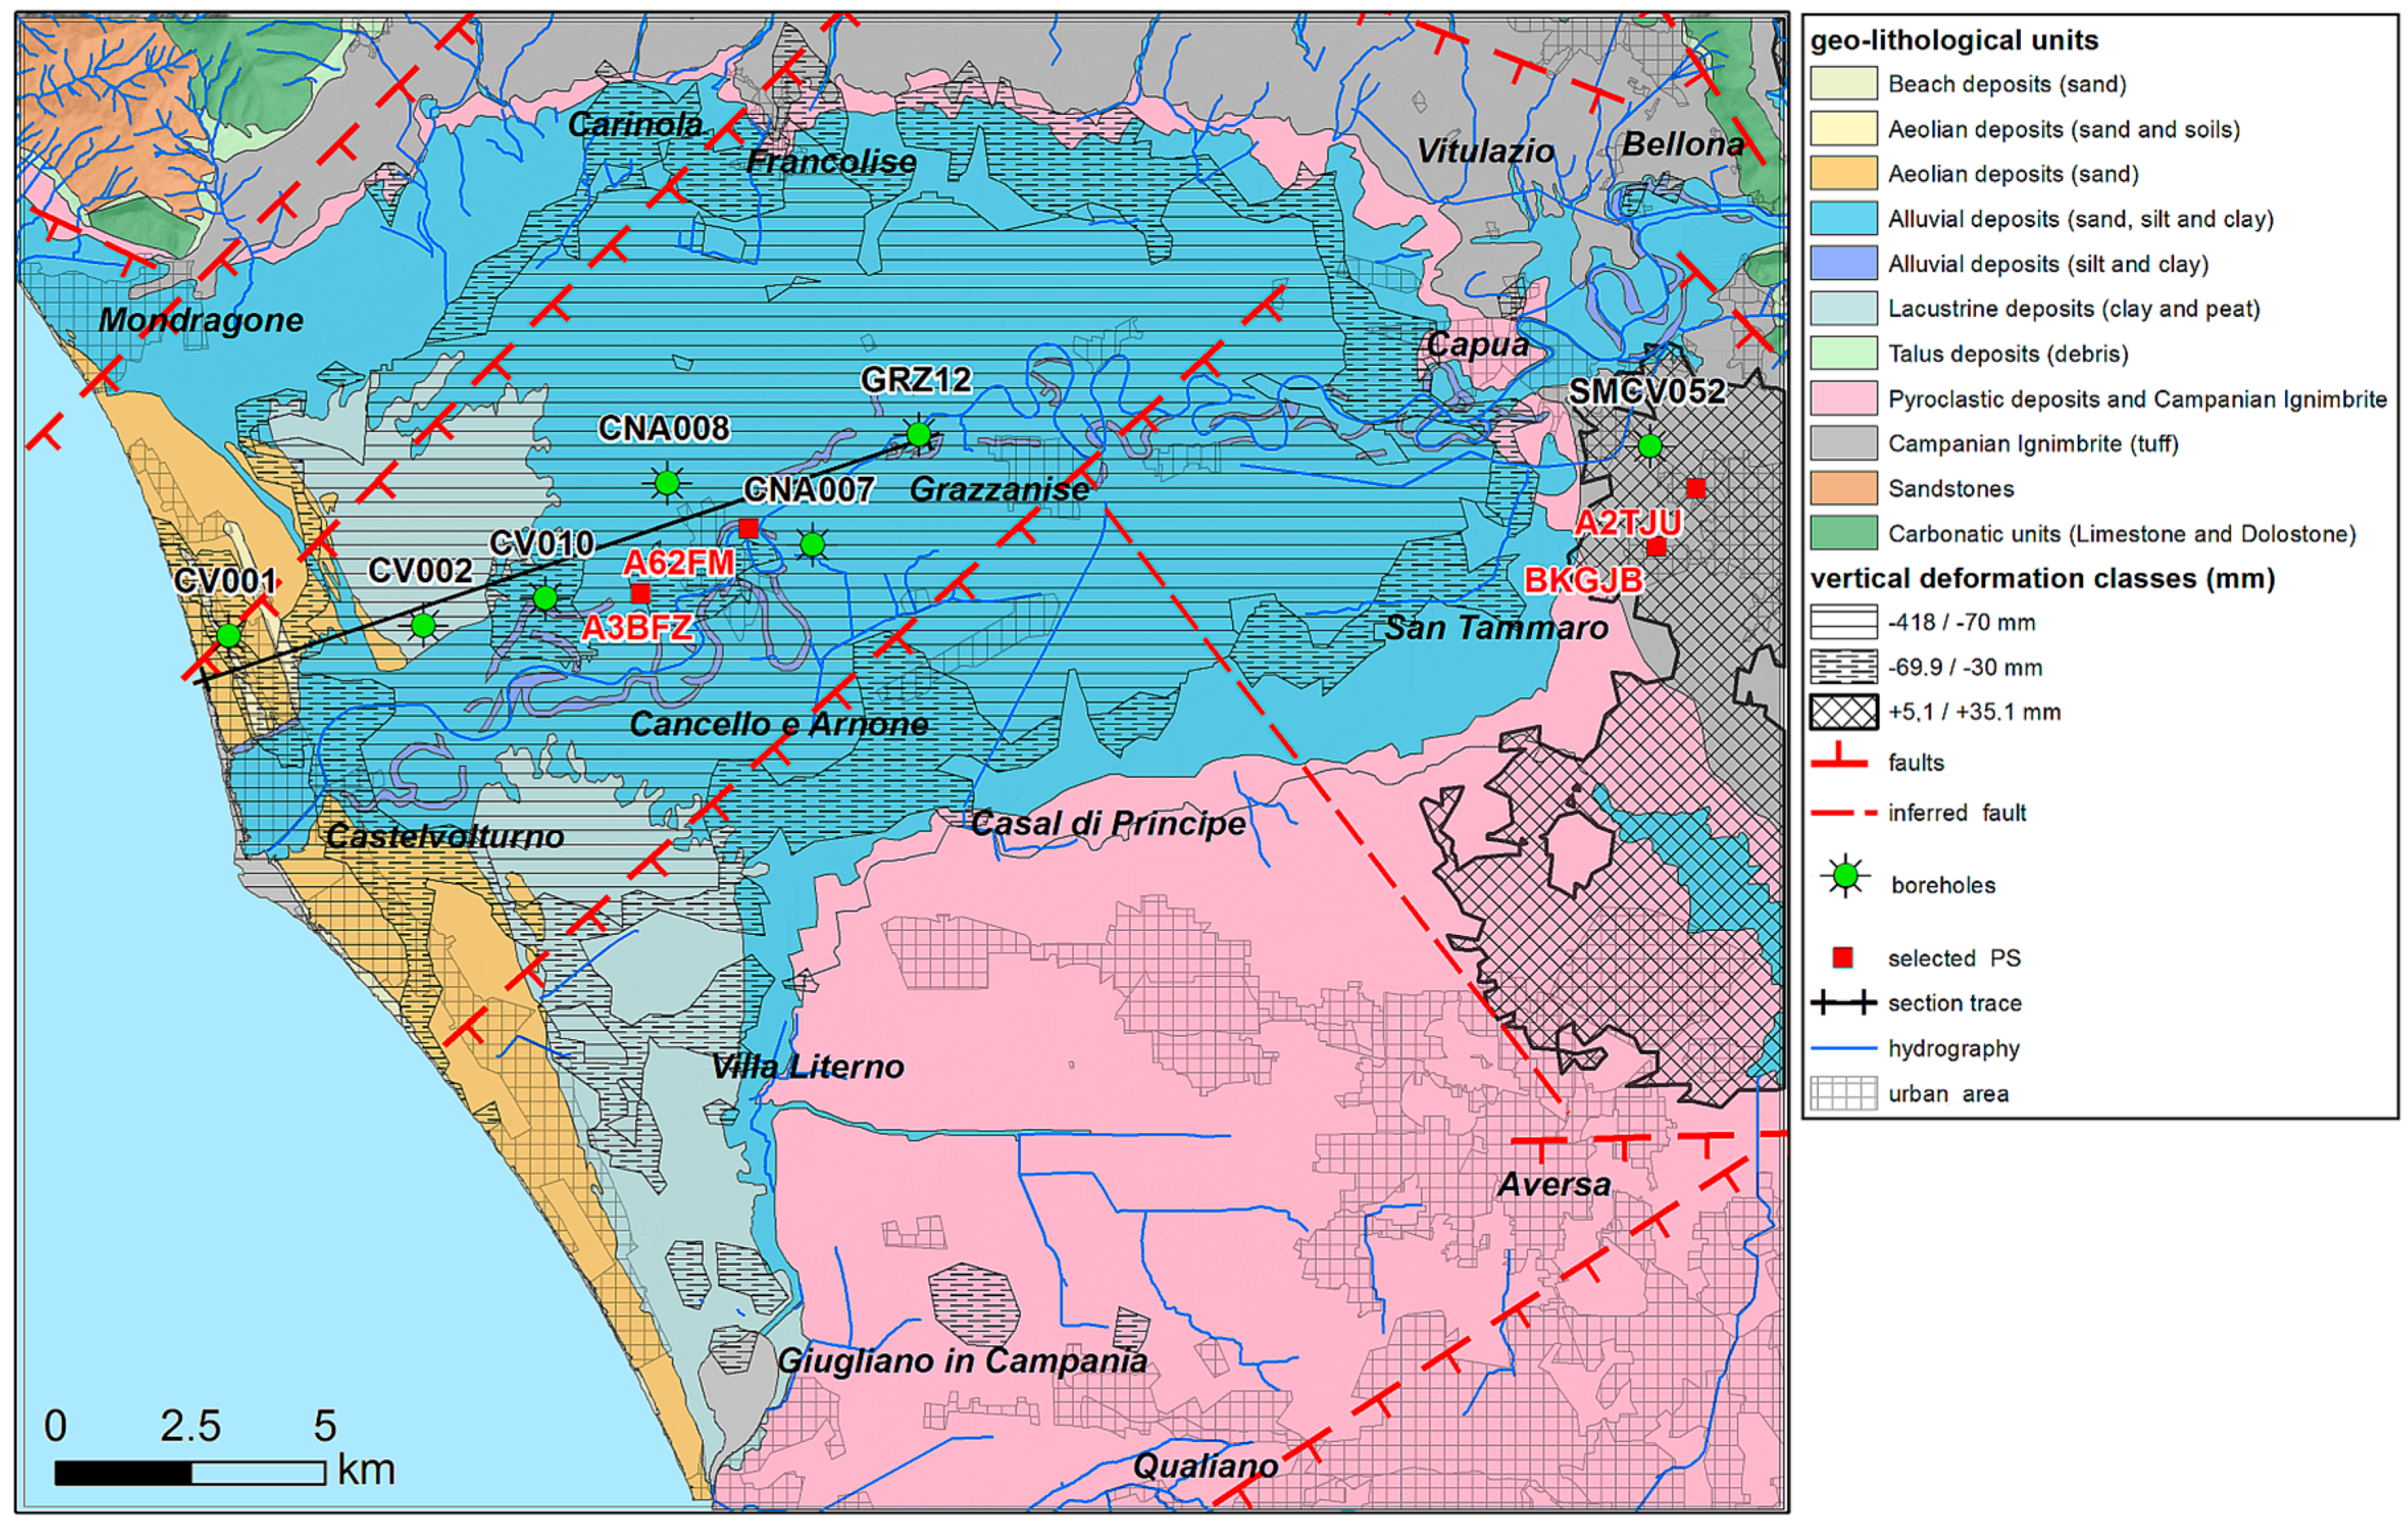
In contrast, the overlay of the main trends of subsidence with a geological map of the study area (Figure 9) suggests that the vertical ground deformation is partly controlled by the lithology and stratigraphic architecture of geological units forming the subsurface of the alluvial plain.
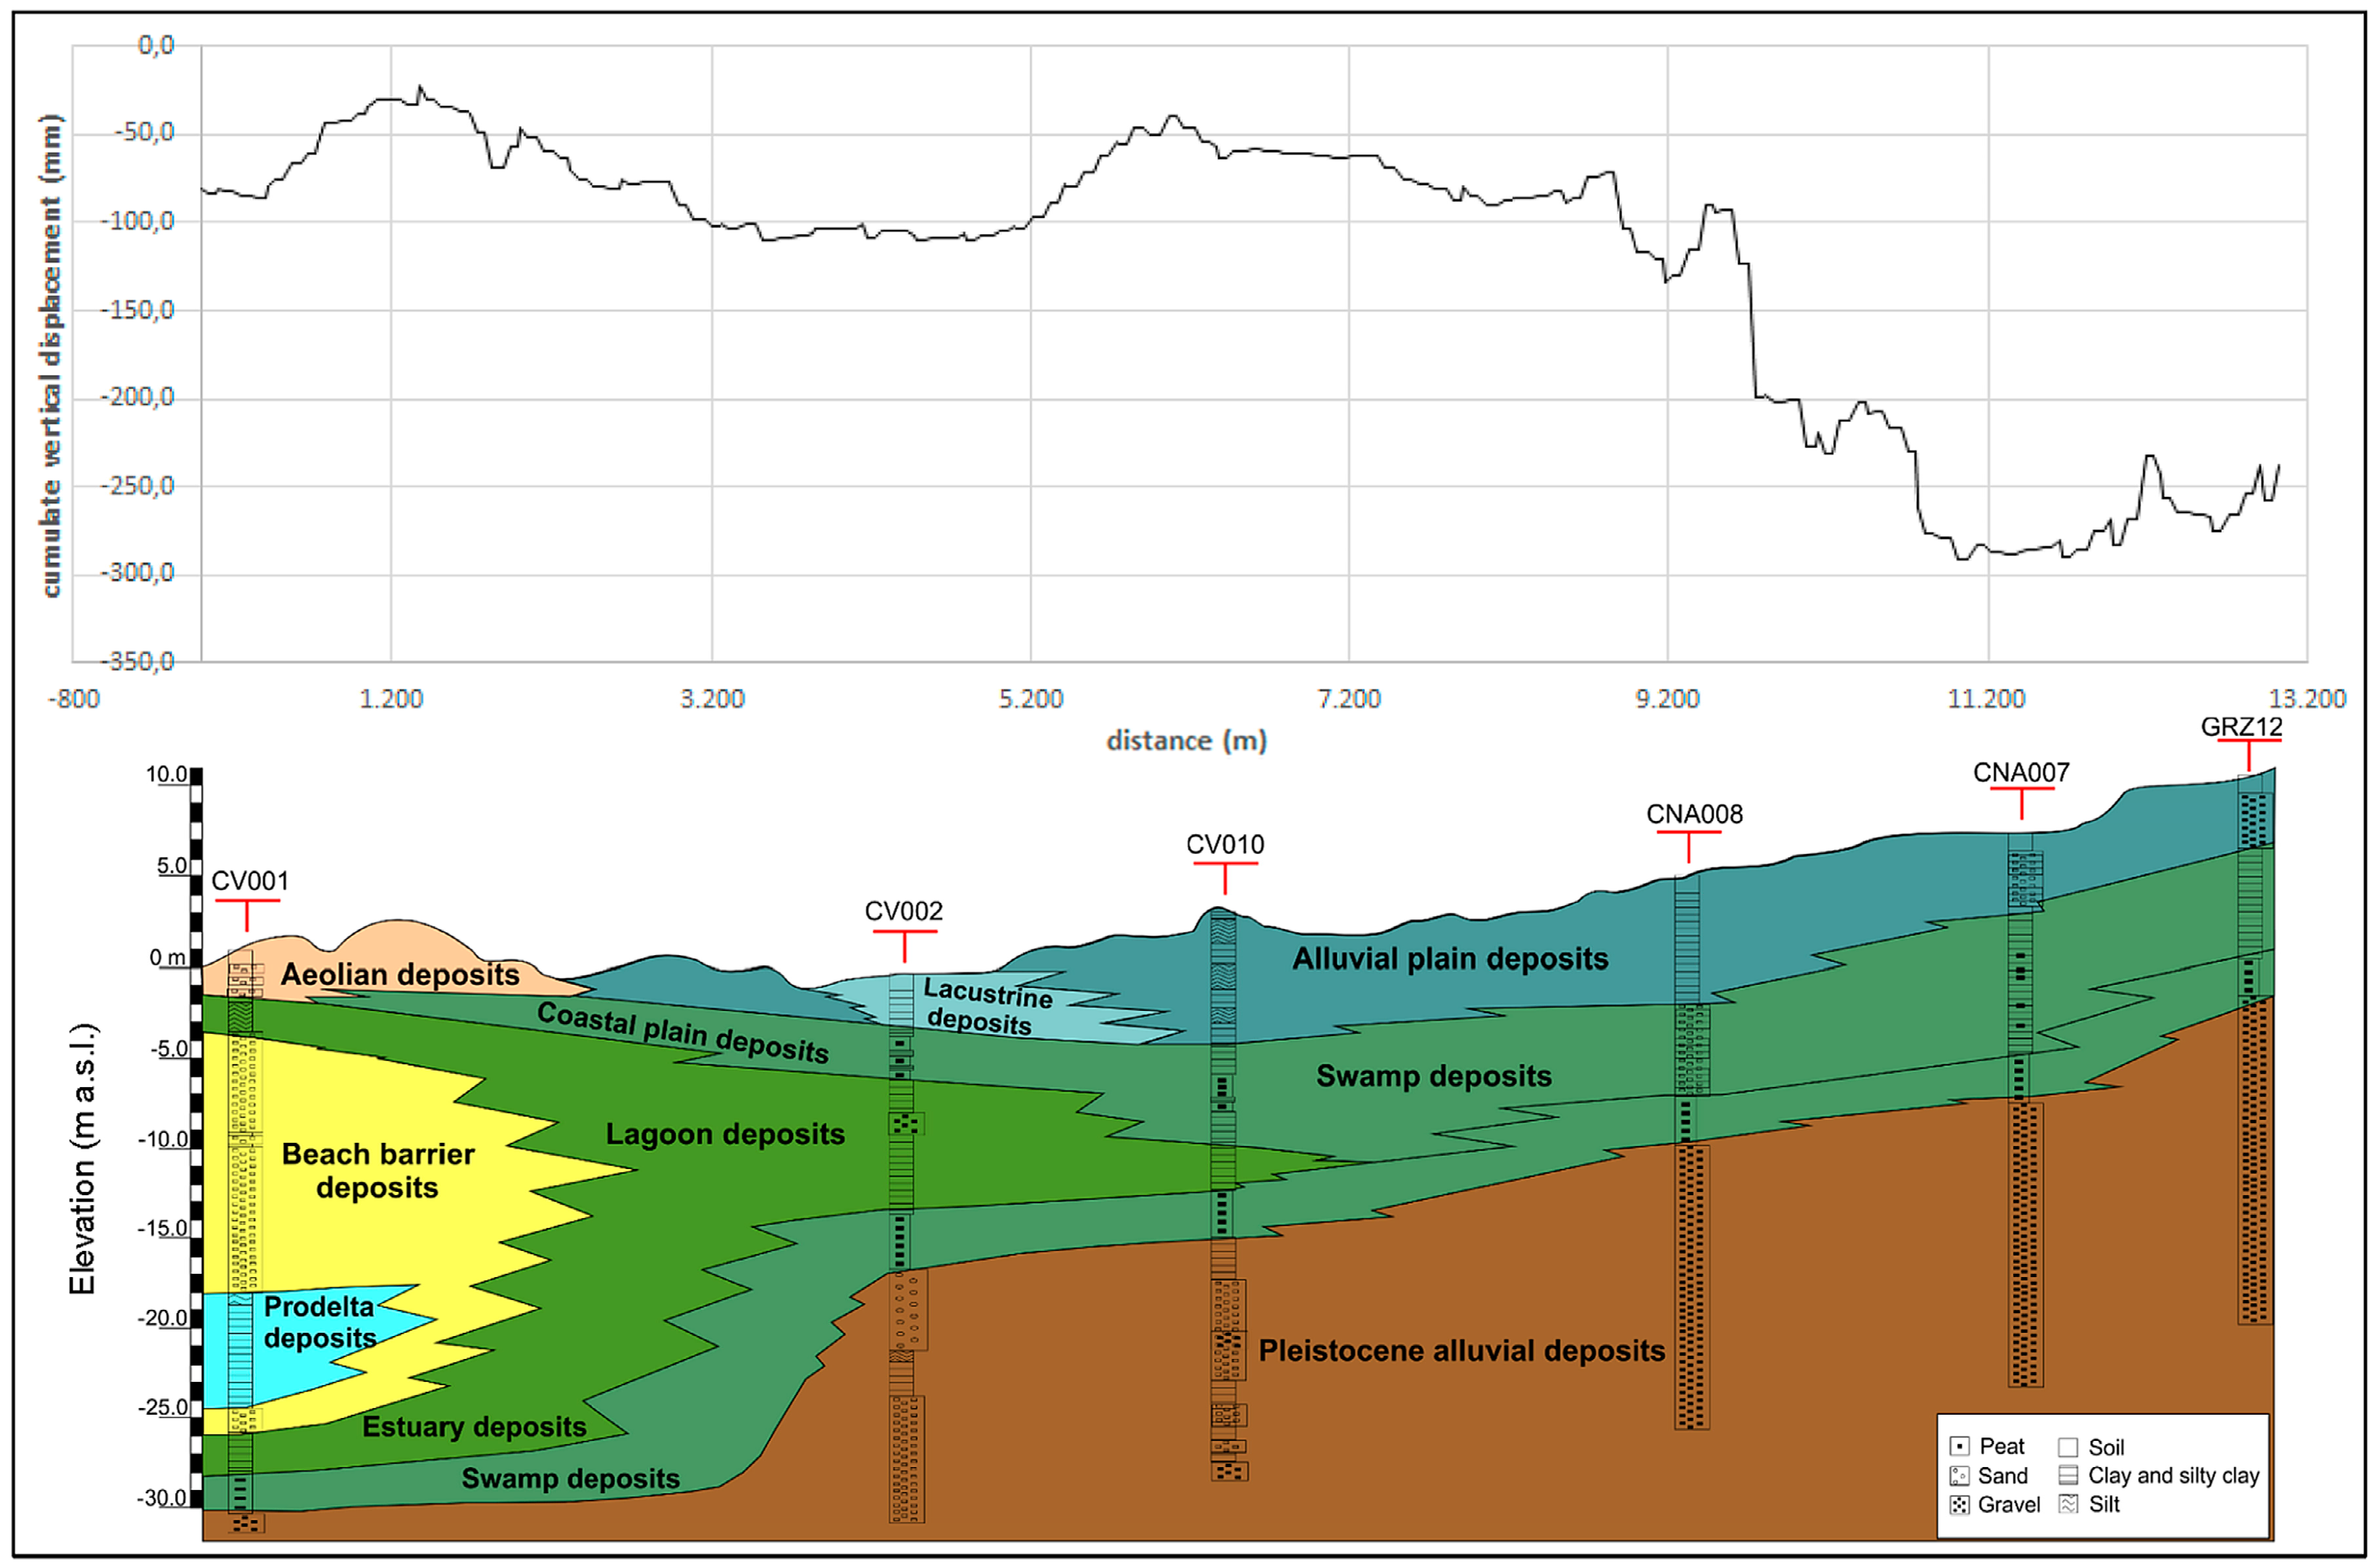
The occurrence of several tens of meters thick of Holocene alluvial deposits in the axial zone of the Volturno plain between the cities of Capua, Grazzanise, Cancello Arnone and Castelvolturno, and subordinately at the Volturno River mouth suggests that the high subsidence values (from −30 mm to −418 mm) recorded in this area are affected by the nature of the subsurface geological units (Figure 9). Particularly, the highest subsidence values (lower than −170 mm) detected in the vicinity of Grazzanise and Castelvolturno are correlated with the occurrence of thick peat layers in the subsurface (Figure 10). These layers are characterized by successions of organic clays, peat layers and alluvial brackish deposits (Coastal plain, Swamp and Lagoon deposits in Figure 10), which are easily compressible by a lithostatic load [37,62,63]. They were formed as a result of the accumulation of flood plain sediments by the Volturno river during the transition between the late phases (Early-Middle Holocene) of the post-glacial marine transgression and the Late Holocene progradation of the Volturno delta system [62,63]. In these areas, subsidence has been ostensibly driven by enhanced sediment compaction following the rapid progradation of the coastal environments during the Holocene [37,63].
The stratigraphic section of Figure 10 shows this geological phenomenon, which is also common to other major deltas of the Mediterranean region and Asia. Recent studies [7,83,84,85,86,87] have suggested that the natural compaction of alluvial/coastal plain deposits may cause subsidence of several millimeters/year, especially in organic-rich deposits, although there is still a lack of reliable information on the magnitude of the expected compaction rates.
The enhancement of the natural subsidence process has resulted from the uncontrolled groundwater exploitation, especially in the urban areas of the inner sector of the plain and along the coast with the highest values of subsidence (Figure 5).
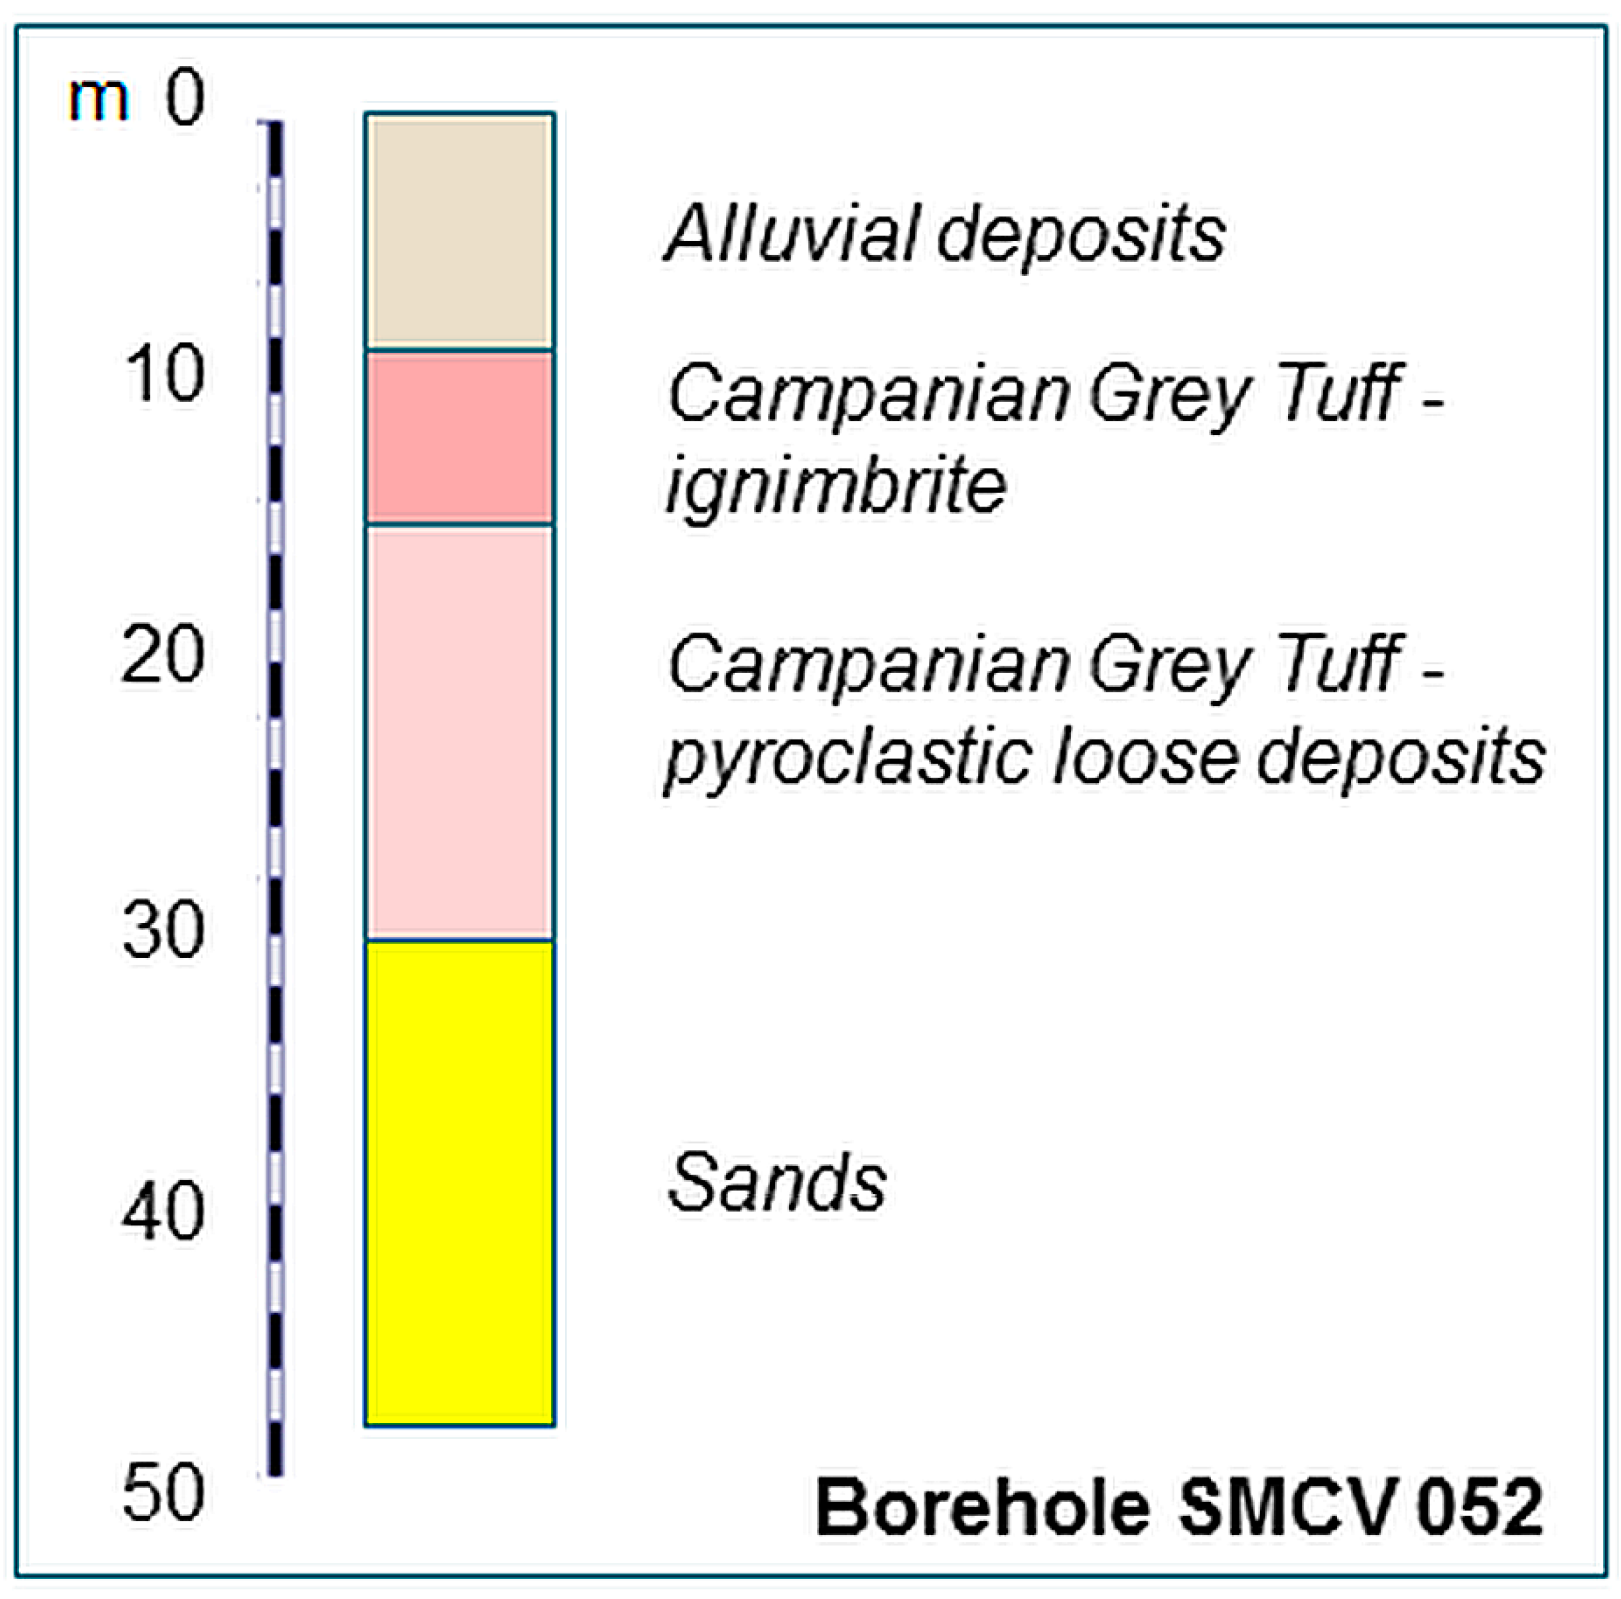
In the north-eastern sector of the study area, the Campanian Ignimbrite tuff represents the main relative bedrock, which is locally covered by thin pyroclastic layers or alluvial and colluvial deposits (Figure 9 and Figure 11). These tuffaceous units are formed mainly by consolidated rocky materials, which are substantially unaffected by the compaction processes due to secondary consolidation occurring under the lithostatic load of thick alluvial deposits. This geological setting clearly explains why the subsidence processes do not affect areas where the Campanian Ignimbrite and associated volcaniclastic cover units occur at shallow depths beneath the ground surface.
Unlike the central area of the Volturno Plain, the eastern sector of the study area is characterized by a slight uplift (values from +10 to +40 mm during 1992–2000) (Figure 9). The uplift appears to be continuous during the analyzed time intervals (1992–2000, 2003–2007 and 2003–2010; Figure 5). When analyzing the displacement time series (Figure 7a), we observed a change in uplift rates between the two decades of observation, as already detected from the maps of Figure 5. Minor oscillations are also related to the annual episodes of rainfall and groundwater variations. Actually, the uplifting sector is bounded to the south by the lateral termination of an E–W trending normal fault, which is known as the “Cancello fault” [51]. This tectonic element is located south of Marcianise (Figure 6) and has a vertical slip rate of approximately 1 mm/year from 130 ky to the present day, which has been estimated on the basis of morpho-tectonic analysis [51]. The area to the north of the fault is characterized by an average uplift of 1–4 cm in 19 years, which corresponds to a vertical rate of 0.5–2.0 mm/year. This scenario seems to be compatible with the active tectonic uplift component controlled by the “Cancello” fault activity and its estimated vertical rates. The south-western structural boundary between uplifting and subsiding sectors is tentatively interpreted as a fault zone, located between Casal di Principe and San Tammaro (Figure 9).
6. Conclusions
The analysis and interpretation of three SAR datasets of both ascending and descending orbits acquired over the Campania coastal sectors during the period of June 1992–July 2010 provides new insights into the spatial variability of vertical ground deformation (subsidence/uplift) of the Volturno River coastal plain. These data are in agreement with the long-term tectonic subsidence process affecting the whole Tyrrhenian margin [45,46,47,48].
Ground deformation occurring in the Volturno plain was fully detectable by the SAR techniques. With reference to a period of about twenty years (1992–2010), we have documented a significant, continuous subsidence in some sectors of the alluvial and coastal plain and a moderate uplift in the eastern sector of the plain. Ground deformation patterns have been consistently imaged by the different SAR datasets, albeit with minor differences.
The integration of the three datasets has provided advantages with respect to the use of a single dataset:
- By averaging and cumulating the different datasets, it was possible to minimize the contributions resulting from the different acquisition geometries (LOS angles) and SAR technique processing (PS-InSAR and PSP) of ERS-1/2—ENVISAT satellite data with respect to the RADARSAT satellite data;
- By using multi-annual time series with different durations, it was possible to encompass a longer time period of observation, so that the final results of cumulated amount of vertical ground displacement is less affected by local and short-term changes.
According to our interpretation, the subsidence of the Volturno plain is regarded as a natural process, which is mainly due to the compaction under the lithostatic load of the alluvial/transitional sediments fill. The magnitude of the recorded subsidence has been found to be greater when the peat layers occur in the subsoil. Conversely, anthropic influences (e.g., water pumping and urbanization) are only considered as an additional factor, which locally enhances the subsidence processes. The detected uplift involving the eastern part of the study area is consistent with the tectonic activity already documented in the area [51].
The results of this study confirm the fundamental importance of using SAR data for a comprehensive understanding of rates and patterns of recent ground deformation over coastal plain regions within tectonically-active continental margins. They also provide a valuable tool for efficient territorial management addressed for coastal risk mitigation.
Acknowledgments
We thank three anonymous reviewers for their comments and suggestions that helped us to improve earlier versions of the manuscript. Patricia Sclafani is also acknowledged for the review of the English text.
Author Contributions
All the authors conceived and designed the research and interpreted the data; F.M. analyzed and processed the SAR data; M.S. provided a sequence stratigraphic framework of the delta system and the correlation between coastal marine and continental units; M.V. processed the stratigraphic data and elaborated the georeferenced geological map; D.R. analyzed the stratigraphic data and provided the geological profiles; F.M., D.R. and M.S. wrote the paper.
Conflicts of Interest
The authors declare no conflicts of interest.
References
- Frihy, O.E.; El Sayed, E.E.; Deabes, E.A.; Gamai, I.H. Shelf sediments of Alexandria region, Egypt: Explorations and evaluation of offshore sand sources for beach nourishment and transport dispersion. Mar. Georesour. Geotechnol. 2010, 28, 250–274. [Google Scholar] [CrossRef]
- Teatini, P.; Tosi, L.; Strozzi, T. Quantitative evidence that compaction of Holocene sediments drives the present land subsidence of the Po Delta, Italy. J. Geophys. Res. 2011, 116, 1–10. [Google Scholar] [CrossRef]
- Teatini, P.; Tosi, L.; Strozzi, T.; Carbognin, L.; Cecconi, G.; Rosselli, R.; Libardo, S. Resolving land subsidence within the Venice Lagoon by persistent scatterer SAR interferometry. Phys. Chem. Earth 2012, 40, 72–79. [Google Scholar] [CrossRef]
- Higgins, S.A. Review: Advances in delta-subsidence research using satellite methods. Hydrogeol. J. 2015, 24, 587–600. [Google Scholar] [CrossRef]
- Warrick, R.A.; Provost, C.L.; Meier, M.F.; Oerlemans, J.; Woodworth, P.L. Changes in sea level, Climate Change. In The Science of Climate Change; Cambridge University Press: Cambridge, UK, 1996; pp. 359–405. [Google Scholar]
- Xie, X.; Heller, P. Plate tectonics and basin subsidence history. Geol. Soc. Am. Bull. 2006, 121, 55–64. [Google Scholar] [CrossRef]
- Long, A.J.; Waller, M.P.; Stupples, P. Driving mechanisms of coastal change: Peat compaction and the destruction of late Holocene coastal wetlands. Mar. Geol. 2005, 225, 63–84. [Google Scholar] [CrossRef] [Green Version]
- Poland, J.F.; Davis, G.H. Land subsidence due to withdrawal of fluids. Rev. Eng. Geol. 1969, 2, 187–269. [Google Scholar]
- Galloway, D.L.; Burbey, T.J. Review: Regional land subsidence accompanying groundwater extraction. Hydrogeol. J. 2011, 19, 1459–1486. [Google Scholar] [CrossRef]
- Burgmann, R.; Rosen, P.A.; Fielding, E.J. Synthetic aperture radar interferometry to measure Earth’s surface topography and its deformation. Annu. Rev. Earth Planet. Sci. 2000, 28, 169–209. [Google Scholar] [CrossRef]
- Strozzi, T.; Wegmüller, U.; Tosi, L.; Bitelli, G.; Spreckels, V. Land subsidence monitoring with differential SAR interferometry. Photogramm. Eng. Remote Sens. 2001, 67, 1261–1270. [Google Scholar]
- Herrera, G.; Fernández, J.A.; Tomás, R.; Cooksley Mulas, G.J. Advanced interpretation of subsidence in Murcia (SE Spain) using A-DInSAR data-modelling and validation. Nat. Hazards Earth Syst. Sci. 2009, 9, 647–661. [Google Scholar] [CrossRef] [Green Version]
- Terranova, C.; Iuliano, S.; Matano, F.; Nardo, S.; Piscitelli, E.; Cascone, E.; D’Argenio, F.; Gelli, L.; Alfinito, M.; Luongo, G. The TELLUS Project: A satellite-based slow-moving landslides monitoring system in the urban areas of Campania Region. Rend. Online Soc. Geol. Ital. 2009, 8, 148–151. [Google Scholar]
- Hanseen, R.F. Radar Interferometry, Data Interpretation and Error Analysis; Kluwer Academic Publishers: Dordrecht, The Netherlands, 2001; ISBN 978-0792369455. [Google Scholar]
- Hooper, A.; Zebker, H.; Segall, P.; Kampes, B. A new method for measuring deformation on volcanoes and other natural terrains using InSAR persistent scatterers. Geophys. Res. Lett. 2004, 31, 1–5. [Google Scholar] [CrossRef]
- Vilardo, G.; Ventura, G.; Terranova, C.; Matano, F.; Nardò, S. Ground deformation due to tectonic, hydrothermal, gravity, hydrogeological and anthropic processes in the Campania Region (Southern Italy) from Permanent Scatterers Synthetic Aperture Radar Interferometry. Remote Sens. Environ. 2009, 113, 197–212. [Google Scholar] [CrossRef]
- Tofani, V.; Raspini, F.; Catani, F.; Casagli, N. Persistent Scatterer Interferometry (PSI) Technique for Landslide Characterization and Monitoring. Remote Sens. 2013, 5, 1045–1065. [Google Scholar] [CrossRef]
- Gabriel, A.K.; Goldstein, R.M.; Zebker, H.A. Mapping small elevation changes over large areas: Differential radar interferometry. J. Geophys. Res. 1989, 94, 9183–9191. [Google Scholar] [CrossRef]
- Costantini, M.; Falco, S.; Malvarosa, F.; Minati, F.; Trillo, F.; Vecchioli, F. Persistent Scatterer Pair Interferometry: Approach and Application to COSMO-SkyMed SAR Data. IEEE J. Sel. Top. Appl. Earth Obs. Remote Sens. 2014, 7, 2869–2879. [Google Scholar] [CrossRef]
- Regione Campania—Settore Difesa del Suolo. Progetto TELLUS WebGIS (PSInSAR). 2009. Available online: http://webgis.difesa.suolo.regione.campania.it:8080/psinsar/map.phtml (accessed on 3 September 2017).
- Regione Campania—Settore Difesa del Suolo. Progetto TELLUS web page. 2009. Available online: http://www.difesa.suolo.regione.campania.it/content/category/4/64/92/ (accessed on 3 September 2017).
- Terranova, C.; Iuliano, S.; Matano, F.; Nardò, S.; Piscitelli, E. Relazione finale del Progetto TELLUS. PODIS Project of the Italian Ministry of Environment and of Protection of Territory and Sea—Campania Region. 2009. Available online: http://www.difesa.suolo.regione.campania.it/content/category/4/64/92/ (accessed on 3 September 2017).
- EPRS-E. Not-Ordinary Plan of Environmental Remote Sensing Web Page. National Geoportal (NG) of the Italian Ministry of Environment and of Protection of Territory and Sea. 2015. Available online: http://www.pcn.minambiente.it/GN/en/projects/not-ordinary-plan-of-remote-sensing (accessed on 3 September 2017).
- EPRS-E. Not-Ordinary Plan of Environmental Remote Sensing; ENVISAT Ascending e ENVISAT Descending Interferometric Products. National Geoportal (NG) of the Italian Ministry of Environment and of Protection of Territory and Sea. 2015. Available online: http://www.pcn.minambiente.it/viewer/ (accessed on 3 September 2017).
- IREA-CNR InSAR WebGIS. Napoli Study Area. 2017. ENVISAT Dataset. Available online: http://webgis.irea.cnr.it/webgis.html (accessed on 3 September 2017).
- Trasatti, E.; Casu, F.; Giunchi, C.; Pepe, S.; Solaro, G.; Tagliaventi, S.; Berardino, P.; Manzo, M.; Pepe, A.; Ricciardi, G.P.; et al. The 2004–2006 uplift episode at Campi Flegrei caldera (Italy): Constraints from SBAS-DInSAR ENVISAT data and Bayesian source inference. Geophys. Res. Lett. 2008, 35, 1–6. [Google Scholar] [CrossRef]
- Ferretti, A.; Prati, C.; Rocca, F. Permanent Scatterers in SAR Interferometry. IEEE Trans. Geosci. Remote Sens. 2001, 39, 8–20. [Google Scholar] [CrossRef]
- Costantini, M.; Falco, S.; Malvarosa, F.; Minati, F. A new method for identification and analysis of persistent scatterers in series of SAR images. In Proceedings of the 2008 IEEE International Geoscience and Remote Sensing Symposium (IGARSS), Boston, MA, USA, 7–11 July 2008; pp. 449–452. [Google Scholar]
- Costantini, M.; Falco, S.; Malvarosa, F.; Minati, F.; Trillo, F. Method of Persistent Scatterer Pairs (PSP) and high resolution SAR interferometry. In Proceedings of the 2009 IEEE International Geoscience and Remote Sensing Symposium (IGARSS), Cape Town, South Africa, 12–17 July 2009; Volume 3, pp. 904–907. [Google Scholar]
- Berardino, P.; Fornaro, G.; Lanari, R.; Sansosti, E. A new algorithm for surface deformation monitoring based on small baseline differential SAR interferograms. IEEE Trans. Geosci. Remote Sens. 2002, 40, 2375–2383. [Google Scholar] [CrossRef]
- Lanari, R.; Mora, O.; Manunta, M.; Mallorquí, J.J.; Berardino, P.; Sansosti, E. A small baseline approach for investigating deformation on full resolution differential SAR interferograms. IEEE Trans. Geosci. Remote Sens. 2004, 42, 1377–1386. [Google Scholar] [CrossRef]
- Lanari, R.; Casu, F.; Manzo, M.; Zeni, G.; Berardino, P.; Manunta, M. An overview of the Small Baseline subset algorithm: A DInSAR technique for surface deformation analysis. Pure Appl. Geophys. 2007, 164, 637–661. [Google Scholar] [CrossRef]
- Vilardo, G.; Isaia, R.; Ventura, G.; De Martino, P.; Terranova, C. InSAR Permanent Scatterer analysis reveals fault re-activation during inflation and deflation episodes at Campi Flegrei caldera. Remote Sens. Environ. 2010, 114, 2373–2383. [Google Scholar] [CrossRef]
- Iuliano, S.; Matano, F.; Caccavale, M.; Sacchi, M. Annual rates of ground deformation (1993–2010) at Campi Flegrei, Italy, revealed by Persistent Scatterer Pair (PSP)—SAR interferometry. Int. J. Remote Sens. 2015, 36, 6160–6191. [Google Scholar] [CrossRef]
- Terranova, C.; Ventura, G.; Vilardo, G. Multiple causes of ground deformation in the Napoli metropolitan area (Italy) from integrated Persistent Scatterers Din-SAR, geological, hydrological, and urban infrastructure data. Earth Sci. Rev. 2015, 146, 105–119. [Google Scholar] [CrossRef]
- Peduto, D.; Cascini, L.; Arena, L.; Ferlisi, S.; Fornaro, G.; Reale, D. A general framework and related procedures for multiscale analyses of DInSAR data in subsiding urban areas. ISPRS J. Photogramm. Remote Sens. 2015, 105, 186–210. [Google Scholar] [CrossRef]
- Aucelli, C.P.P.; Di Paola, G.; Incontri, P.; Rizzo, A.; Vilardo, G.; Benassai, G.; Buonocore, B.; Pappone, G. Coastal inundation risk assessment due to subsidence and sea level rise in a Mediterranean alluvial plain (Volturno coastal plain e southern Italy). Estuar. Coast. Shelf Sci. 2016, 198, 597–609. [Google Scholar] [CrossRef]
- Di Paola, G.; Alberico, I.; Aucelli, P.P.C.; Matano, F.; Rizzo, A.; Vilardo, G. Coastal subsidence detected by Synthetic Aperture Radar interferometry and its effects coupled with future sea-level rise: The case of the Sele Plain (Southern Italy). J. Flood Risk Manag. 2017. [Google Scholar] [CrossRef]
- Cocco, E.; Crimaco, L.; de Magistris, M.A. Dinamica ed evoluzione del litorale campano-laziale: Variazioni della linea di riva dall’epoca romana ad oggi nel tratto compreso tra la foce del Volturno e Torre S. In Proceedings of the “10° Congresso AIOL”, Mondragone, Italy, 4–6 November 1992; pp. 543–555. [Google Scholar]
- Donadio, C.; Vigliotti, M.; Valente, R.; Stanislao, C.; Ivaldi, R.; Ruberti, D. Anthropic vs. natural shoreline changes along the northern Campania coast, Italy. J. Coast. Cons. 2017. [Google Scholar] [CrossRef]
- Ruberti, D.; Vigliotti, M.; Di Mauro, A.; Chieffi, R.; Di Natale, M. Human influence over 150 years of coastal evolution in the Volturno delta system (southern Italy). J. Coast. Cons. 2017. [Google Scholar] [CrossRef]
- Ruberti, D.; Vigliotti, M. Land use and landscape pattern changes driven by land reclamation in a coastal area. The case of Volturno delta plain, Campania Region, southern Italy. Environ. Earth Sci. 2017, 76, 694. [Google Scholar]
- ENEA. Analisi di specifiche situazioni di degrado della qualità delle acque in Campania. In Riferimento ai Casi Che Maggiormente Incidono Negativamente Sulle Aree Costiere; ENEA, Sezione Protezione-Idrogeologica: Roma, Italy, 2008. [Google Scholar]
- Riccio, T. Analysis of Subsidence in Campania Plain. Ph.D. Thesis, cycle XXVIII, University of Campania “L. Vanvitelli”, Aversa, Italy, 2016; p. 67. [Google Scholar]
- Patacca, E.; Sartori, R.; Scandone, P. Tyrrhenian basin and Apenninic arcs: Kinematic relations since late Tortonian times. Mem. Soc. Geol. Ital. 1990, 45, 425–451. [Google Scholar]
- Oldow, J.S.; D’Argenio, B.; Ferranti, L.; Pappone, G.; Marsella, E.; Sacchi, M. Large-scale longitudinal extension in the southern Apennines contractional belt, Italy. Geology 1993, 21, 1123–1126. [Google Scholar] [CrossRef]
- Ferranti, L.; Oldow, J.S.; Sacchi, M. Pre-Quaternary orogen-parallel extension in the Southern Apennine belt, Italy. Tectonophysics 1996, 260, 325–347. [Google Scholar] [CrossRef]
- Casciello, E.; Cesarano, M.; Pappone, G. Extensional detachment faulting on the Tyrrhenian margin of the southern Apennines contractional belt (Italy). J. Geol. Soc. Lond. 2006, 163, 617–629. [Google Scholar] [CrossRef]
- Di Nocera, S.; Matano, F.; Pescatore, T.; Pinto, F.; Torre, M. Geological characteristics of the external sector of the Campania-Lucania Apennines in the CARG maps. Rend. Online Soc. Geol. Ital. 2011, 12, 39–43. [Google Scholar]
- Matano, F.; Critelli, S.; Barone, M.; Muto, F.; Di Nocera, S. Stratigraphic and provenance evolution of the Southern Apennines foreland basin system during the Middle Miocene to Pliocene (Irpinia-Sannio successions, Italy). Mar. Petr. Geol. 2014, 57, 652–670. [Google Scholar] [CrossRef]
- Cinque, A.; Ascione, A.; Caiazzo, C. Distribuzione spazio-temporale e caratterizzazione della fagliazione quaternaria in Appennino meridionale. In Le Ricerche del GNDT nel Campo Della Pericolosità Sismica 1996–1999; Galadini, F., Meletti, C., Rebez, A., Eds.; CNR-Gruppo Nazionale per la Difesa dai Terremoti: Roma, Italy, 2000; pp. 203–218. [Google Scholar]
- Mariani, M.; Prato, R. I bacini neogenici costieri del margine tirrenico: Approccio sismico-stratigrafico. Mem. Della Soc. Geol. Ital. 1988, 41, 519–531. [Google Scholar]
- Milia, A.; Torrente, M.M. Late Quaternary volcanism and transtensional tectonics in the Naples Bay, Campanian continental margin, Italy. Miner. Petrol. 2003, 79, 49–65. [Google Scholar] [CrossRef]
- Milia, A.; Torrente, M.M.; Massa, B.; Iannace, P. Progressive changes in rifting directions in the Campania margin (Italy): New constrains for the Tyrrhenian Sea opening. Glob. Planet. Chang. 2013, 109, 3–17. [Google Scholar] [CrossRef]
- Ortolani, F.; Aprile, F. Nuovi dati sulla struttura profonda della Piana Campana a sud-est del fiume Volturno. Boll. Soc. Geol. Ital. 1978, 97, 591–608. [Google Scholar]
- Scandone, R.; Bellucci, F.; Lirer, L.; Rolandi, G. The structure of the Campanian Plain and the activity of the Neapolitain volcanoes (Italy). J. Volcanol. Geotherm. Res. 1991, 48, 1–31. [Google Scholar] [CrossRef]
- Barberi, F.; Innocenti, F.; Lirer, L.; Munno, R.; Pescatore, T.; Santacroce, R. The Campanian Ignimbrite: A major prehistoric eruption in the Neapolitan area (Italy). Bull. Volcanol. 1978, 41, 1–22. [Google Scholar] [CrossRef]
- Di Girolamo, P.; Ghiara, M.R.; Lirer, L.; Munno, R.; Rolandi, G.; Stanzione, D. Vulcanologia e Petrologia dei Campi Flegrei. Boll. Soc. Geol. 1984, 103, 349–413. [Google Scholar]
- Deino, A.L.; Southon, I.; Terrasi, F.; Campajola, L.; Orsi, G. 14C and 40Ar/39Ar dating of the Campanian Ignimbrite. Phlegrean Fields, Italy. In Proceedings of the 8th International Conference on Geochronology, Cosmochronology and Isotope Geology (ICOG), Berkeley, CA, USA, 5–11 June 1994; Volume 3, p. 633. [Google Scholar]
- De Vivo, B.; Rolandi, G.; Gans, P.B.; Calvert, A.; Bohrson, W.A.; Spera, F.J.; Belkin, H.E. New constraints on the pyroclastic eruptive history of the Campanian volcanic plain (Italy). Miner. Petrol. 2001, 73, 47–65. [Google Scholar] [CrossRef]
- Deino, A.L.; Orsi, G.; de Vita, S.; Piochi, M. The age of the Neapolitan Yellow Tuff caldera-forming eruption (Campi Flegrei caldera, Italy) assessed by Ar-40/Ar-39 dating method. J. Volcanol. Geotherm. Res. 2004, 133, 157–170. [Google Scholar] [CrossRef]
- Amorosi, A.; Pacifico, A.; Rossi, V.; Ruberti, D. Late Quaternary incision and deposition in an active volcanic setting: The Volturno valley fill, southern Italy. Sediment. Geol. 2012, 282, 307–320. [Google Scholar] [CrossRef]
- Sacchi, M.; Molisso, F.; Pacifico, A.; Vigliotti, M.; Sabbarese, C.; Ruberti, D. Late-Holocene to recent evolution of Lake Patria, South Italy: An example of a coastal lagoon within a Mediterranean delta system. Glob. Planet. Chang. 2014, 117, 9–27. [Google Scholar] [CrossRef]
- Pappone, G.; Alberico, I.; Amato, V.; Aucelli, P.P.C.; Di Paola, G. Recent evolution and the present-day conditions of the Campanian Coastal plains (South Italy): The case history of the Sele River Coastal plain. WIT Trans. Ecol. Environ. 2011, 149, 15–27. [Google Scholar]
- Scorpio, V.; Aucelli, P.P.C.; Giano, S.I.; Pisano, L.; Robustelli, G.; Rosskopf, C.M.; Schiattarella, M. River channel adjustments in Southern Italy over the past 150 years and implications for channel recovery. Geomorphology 2015, 251, 77–90. [Google Scholar] [CrossRef]
- Barra, D.; Romano, P.; Santo, A.; Campaiola, L.; Roca, V.; Tuniz, C. The Versilian transgression in the Volturno river plain (Campania, Southern Italy): Palaeoenvironmental history and chronological data. II Quaternario 1996, 9, 445–458. [Google Scholar]
- Amorosi, A.; Molisso, F.; Pacifico, A.; Rossi, V.; Ruberti, D.; Sacchi, M.; Vigliotti, M. The Holocene evolution of the Volturno River coastal plain (southern Italy). J. Mediter. Earth Sci. 2013, 5, 7–11. [Google Scholar]
- Romano, P.; Santo, A.; Voltaggio, M. L’evoluzione morfologica della pianura del fiume Volturno (Campania) durante il tardo Quaternario. II Quaternario 1994, 7, 41–56. [Google Scholar]
- Lambeck, K.; Antonioli, F.; Anzidei, M.; Ferranti, L.; Leoni, G.; Scicchitano, G.; Silenzi, S. Sea level change along the Italian coast during the Holocene and projections for the future. Quat. Int. 2011, 232, 250–257. [Google Scholar] [CrossRef]
- Putignano, M.L.; Ruberti, D.; Tescione, M.; Vigliotti, M. Evoluzione recente di un territorio di pianura a forte sviluppo urbano: La Piana Campana nell’area di Caserta. Boll. Soc. Geol. Ital. 2007, 126, 11–24. [Google Scholar]
- Lu, Z.; Kwoun, O.; Rykus, R. Interferometric syntetic aperture radar (InSAR): Its past, present and future. Photogramm. Eng. Remote Sens. 2007, 73, 217–221. [Google Scholar]
- Rott, H. Advances in interferometric synthetic aperture radar (InSAR) in earth system science. Prog. Phys. Geogr. 2009, 33, 769–791. [Google Scholar] [CrossRef]
- Vasco, D.W.; Rucci, A.; Ferretti, A.; Novali, F.; Bissell, R.C.; Ringrose, P.S.; Mathieson, A.S.; Wright, I.W. Satellite-based measurements of surface deformation reveal fluid flow associated with the geological storage of carbon dioxide. Geophys. Res. Lett. 2010, 37, L03303. [Google Scholar] [CrossRef]
- Colesanti, C.; Locatelli, R.; Novali, F. Ground deformation monitoring exploiting SAR permanent scatterers. IEEE IGARSS 2002, 2, 1219–1221. [Google Scholar]
- Colesanti, C.; Ferretti, A.; Locatelli, R.; Novali, F.; Savio, G. Permanent Scatterers: Precision assessment and multi-platform analysis. IEEE IGARSS 2003, 2, 1193–1195. [Google Scholar]
- Colesanti, C.; Wasowski, J. Investigating landslides with spaceborne synthetic aperture radar (SAR) interferometry. Eng. Geol. 2006, 88, 173–199. [Google Scholar] [CrossRef]
- Ferretti, A.; Savio, G.; Barzaghi, R.; Borghi, A.; Musazzi, S.; Novali, F.; Prati, C.; Rocca, F. Submillimeter accuracy of InSAR time series: Experimental validation. IEEE Trans. Geosci. Remote Sens. 2007, 45, 1142–1153. [Google Scholar] [CrossRef]
- Massironi, M.; Zampieri, D.; Bianchi, M.; Schiavo, A.; Franceschini, A. Use of PSInSAR™ data to infer active tectonics: Clues on the differential uplift across the Giudicarie belt (Central-Eastern Alps, Italy). Tectonophysics 2009, 476, 297–303. [Google Scholar] [CrossRef]
- Franke, R. Scattered data interpolation: Test of some methods. Math. Comput. 1982, 33, 181–200. [Google Scholar]
- Mueller, T.G.; Pusuluri, N.B.; Mathias, K.K.; Cornelius, P.L.; Barnhisel, R.I.; Shearer, S.A. Map quality for ordinary kriging and inverse distance weighted interpolation. Soil Sci. Soc. Am. J. 2004, 68, 2042–2047. [Google Scholar] [CrossRef]
- Lundgren, P.; Casu, F.; Manzo, M.; Pepe, A.; Berardino, P.; Sansosti, E.; Lanari, R. Gravity and magma induced spreading of Mount Etna volcano revealed by satellite radar interferometry. Geophys. Res. Lett. 2004, 31, L04602. [Google Scholar] [CrossRef]
- Manzo, M.; Ricciardi, G.P.; Casu, F.; Ventura, G.; Zeni, G.; Borgström, S.; Berardino, P.; Del Gaudio, C.; Lanari, R. Surface deformation analysis in the Ischia island (Italy) based on spaceborne radar interferometry. J. Volcanol. Geotherm. Res. 2006, 151, 399–416. [Google Scholar] [CrossRef]
- Meckel, T.A.; Brink, U.S.; Williams, S.J. Sediment compaction rates and subsidence in deltaic plains: Numerical constraints and stratigraphic influences. Basin Res. 2007, 19, 19–31. [Google Scholar] [CrossRef]
- Meckel, T.A.; Brink, U.S.; Williams, S.J. Current subsidence rates due to compaction of Holocene sediments in southern Louisiana. Geophys. Res. Lett. 2006, 33, L11403. [Google Scholar] [CrossRef]
- Shi, C.; Zhang, D.; You, L.; Li, B.; Zhang, Z.; Zhang, O. Land subsidence as a result of sediment consolidation in the Yellow River Delta. J. Coast. Res. 2007, 23, 173–181. [Google Scholar]
- Tornqvist, T.E.; Wallace, D.J.; Storms, J.E.A.; Wallinga, J.; Van Dam, R.L.; Blaauw, M.; Derksen, M.S.; Klerks, C.J.W.; Meijneken, C.; Snijders, E.M.A. Mississippi Delta subsidence primarily caused by compaction of Holocene strata. Nat. Geosci. 2008, 1, 173–176. [Google Scholar] [CrossRef]
- Van Asselen, S. The contribution of peat compaction to total basin subsidence: Implications for the provision of accommodation space in organic-rich deltas. Basin Res. 2011, 23, 239–255. [Google Scholar] [CrossRef]
Figure 1.
Geological map of the Campania Plain, with the black frame indicating the study area.

Figure 2.
Geological map of the Volturno Plain (based on Geological Map of Italy and stratigraphic data [62,63,70]).

Figure 3.
Altimetry classes of the Volturno Plain from Digital Terrain Model with 70-m cell size.

Figure 4.
Map view of range-change rate measurements (LOS velocity) of PS with coherence ≥0.65 of the six used datasets: (a) ERS-1/2 ascending orbit; (b) ERS-1/2 descending orbit; (c) RADARSAT ascending orbit; (d) RADARSAT descending orbit; (e) ENVISAT ascending orbit; and (f) ENVISAT descending orbit.


Figure 5.
Vertical components of ground deformation velocity detected by interferometric processing of (a) ERS-1/2; (b) RADARSAT; and (c) ENVISAT datasets.
Figure 5.
Vertical components of ground deformation velocity detected by interferometric processing of (a) ERS-1/2; (b) RADARSAT; and (c) ENVISAT datasets.


Figure 6.
Differences in vertical velocity ranges between 2003–2007 RADARSAT and 2003–2010 ENVISAT datasets in the uplifting eastern sector of the study area.
Figure 6.
Differences in vertical velocity ranges between 2003–2007 RADARSAT and 2003–2010 ENVISAT datasets in the uplifting eastern sector of the study area.

Figure 7.
Time series of exemplative PS located in the study area: (a) comparison between time series of PSs located near San Tammaro in the uplifting sector (PS codes: A2TJU, BKGJB, 0004u0018sR); and (b) comparison between the time series of PSs located near Grazzanise in subsiding sectors (PS codes: A3BFZ, A62FM, 0004u0015qx) and PS in Phlegrean Fields area (PS codes: A9TL0, BACQE, 0004u002nk0). The PSs location is shown in Figure 9, except for the PS of Phlegrean Fields area, which is located within the harbor of the Pozzuoli city.

Figure 8.
Cumulative amount of vertical ground displacement estimated during 1992–2010.

Figure 9.
Correlation between cumulated amounts of vertical ground displacement classes, mapped in classes with wide thresholds to better highlight the main trends, and geology maps.
Figure 9.
Correlation between cumulated amounts of vertical ground displacement classes, mapped in classes with wide thresholds to better highlight the main trends, and geology maps.

Figure 10.
Correlation between stratigraphy and vertical velocity of displacement detected by Synthetic Aperture Radar (SAR) data.
Figure 10.
Correlation between stratigraphy and vertical velocity of displacement detected by Synthetic Aperture Radar (SAR) data.

Figure 11.
Example of a borehole stratigraphy inside the uplifting sector. For borehole location, see Figure 9.
Figure 11.
Example of a borehole stratigraphy inside the uplifting sector. For borehole location, see Figure 9.


| Satellite-Orbit | Track/Frame | Line of Sight Incidence Angle | Used Scenes | Time Range |
|---|---|---|---|---|
| ENVISAT-Descending | 36/2781 | 22° | 41 | 5 June 2003–3 June 2010 |
| ENVISAT-Ascending | 358, 129/819 | 25° | 60 | 13 November 2002–30 July 2010 |
| RADARSAT-Ascending | 104/S3 | 34° | 52 | 4 March 2003–15 September 2007 |
| RADARSAT-Descending | 11, 111/S3 | 32–33° | 51 | 5 March 2003–23 August 2007 |
| ERS-1/2-Ascending | 129/801 | 22° | 69 | 14 June 1992–13 December 2000 |
| ERS-1/2-Descending | 36, 265/2781, 2783 | 23° | 81 | 8 June 1992–23 December 2001 |
Table 2.
Summary of Permanent Scattere (PS) datasets used in this study.
| Satellite-Orbit | Persistent Scatterer Interferometry Technique | Count | PS Velocity-Mean (mm/year) | PS Stand. Dev.-Mean | PS Coherence-Mean | PS Density (Num./km2) |
|---|---|---|---|---|---|---|
| ENVISAT-Ascending | PSP | 105.319 | –0.88 | 0.31 | 0.73 | 136.8 |
| ENVISAT-Descending | PSP | 120.557 | –0.40 | 0.39 | 0.77 | 156.6 |
| RADARSAT-Ascending | PS-InSAR | 57.563 | –1.32 | 1.31 | 0.84 | 74.8 |
| RADARSAT-Descending | PS-InSAR | 55.324 | –0.96 | 0.72 | 0.85 | 71.8 |
| ERS-1/2-Ascending | PSP | 73.694 | –1.08 | 0.73 | 0.73 | 95.7 |
| ERS-1/2-Descending | PSP | 93.480 | –0.80 | 0.50 | 0.68 | 121.4 |
Table 3.
Data distribution statistics of Line of Sight (LOS) velocity data in the used datasets.
| Satellite-Orbit | Mean | Std. Dev. | Skewness | Q1 | Median | Q3 | IQR | −2 s.d. | +2 s.d. | Min | Max |
|---|---|---|---|---|---|---|---|---|---|---|---|
| ENVISAT-Ascending | −0.88 | 2.14 | −3.32 | −1.20 | −0.20 | +0.30 | 1.50 | −5.16 | +3.40 | −31.30 | +7.80 |
| ENVISAT-Descending | −0.40 | 1.88 | −3.16 | −0.80 | −0.01 | +0.60 | 1.40 | −4.16 | +3.36 | −28.10 | +5.70 |
| RADARSAT-Ascending | −1.32 | 2.60 | −1.49 | −2.25 | −0.83 | +0.10 | 2.35 | −6.52 | +3.88 | −34.25 | +26.09 |
| RADARSAT-Descending | −0.96 | 2.45 | −2.52 | −1.49 | −0.57 | +0.21 | 1.70 | −5.86 | +3.94 | −35.02 | +16.51 |
| ERS-1/2-Ascending | −1.08 | 2.41 | −3.62 | −1.26 | −0.46 | +0.08 | 1.34 | −5.90 | +3.74 | −38.87 | +8.26 |
| ERS-1/2-Descending | −0.80 | 2.23 | −3.47 | −1.05 | −0.26 | +0.31 | 1.36 | −5.26 | +3.66 | –37.22 | +6.71 |
© 2018 by the authors. Licensee MDPI, Basel, Switzerland. This article is an open access article distributed under the terms and conditions of the Creative Commons Attribution (CC BY) license (http://creativecommons.org/licenses/by/4.0/).
Share and Cite
MDPI and ACS Style
Matano, F.; Sacchi, M.; Vigliotti, M.; Ruberti, D. Subsidence Trends of Volturno River Coastal Plain (Northern Campania, Southern Italy) Inferred by SAR Interferometry Data. Geosciences 2018, 8, 8. https://doi.org/10.3390/geosciences8010008
AMA Style
Matano F, Sacchi M, Vigliotti M, Ruberti D. Subsidence Trends of Volturno River Coastal Plain (Northern Campania, Southern Italy) Inferred by SAR Interferometry Data. Geosciences. 2018; 8(1):8. https://doi.org/10.3390/geosciences8010008
Chicago/Turabian StyleMatano, Fabio, Marco Sacchi, Marco Vigliotti, and Daniela Ruberti. 2018. "Subsidence Trends of Volturno River Coastal Plain (Northern Campania, Southern Italy) Inferred by SAR Interferometry Data" Geosciences 8, no. 1: 8. https://doi.org/10.3390/geosciences8010008
Note that from the first issue of 2016, this journal uses article numbers instead of page numbers. See further details here.