Phase Evolution and Textural Changes during the Direct Conversion and Storage of CO2 to Produce Calcium Carbonate from Calcium Hydroxide


Department of Civil and Environmental Engineering, University of Wisconsin-Madison, Madison, WI 53706, USA
*
Author to whom correspondence should be addressed.
Geosciences 2018, 8(12), 445; https://doi.org/10.3390/geosciences8120445
Submission received: 19 October 2018
/
Revised: 22 November 2018
/
Accepted: 23 November 2018
/
Published: 30 November 2018
(This article belongs to the Special Issue Carbon Sequestration)
Abstract
:The increasing use of energy resources recovered from subsurface environments and the resulting carbon imbalance in the environment has motivated the need to develop thermodynamically downhill pathways to convert and store CO2 as water-insoluble calcium or magnesium carbonates. While previous studies extensively explored aqueous routes to produce calcium and magnesium carbonates from CO2, there is limited scientific understanding of the phase evolution and textural changes during the direct gas–solid conversion routes to produce calcium carbonate from calcium hydroxide, which is one of the abundant constituents of alkaline industrial residues. With increasing interest in developing integrated pathways for capturing, converting, and storing CO2 from dilute flue gases, understanding the composition of product phases as they evolve is essential for evaluating the efficacy of a given processing route. Therefore, in this study, we investigate the phase evolution and the corresponding textural changes as calcium hydroxide is converted to calcium carbonate under the continuous flow of CO2 at an ambient pressure of 1 atm with continuous heating from 30 °C to 500 °C using in-operando wide angle X-ray scattering (WAXS), small angle X-ray scattering (SAXS), and ultrasmall angle X-ray scattering (USAXS) measurements.
1. Introduction
One of the emerging challenges in sustainable energy production is the development of integrated pathways for carbon dioxide capture, utilization, and storage (CCUS). With CO2 concentrations increasing from ~280 ppm before the industrial age to over 400 ppm presently, the need for CCUS technologies is unprecedented [1,2,3,4]. The transition to a low carbon economy will require us to develop a portfolio of technologies for capturing, utilizing, and storing CO2 at the gigaton scale [5]. Carbon mineralization is one approach which involves the accelerated conversion and storage of CO2 as water insoluble calcium and magnesium carbonate via thermodynamically downhill routes [6,7,8,9,10,11,12]. Various routes including gas–solid and gas–liquid–solid reaction routes have been explored to accelerate the conversion of CO2 to calcium and magnesium carbonates [13,14,15]. While gas–solid reaction routes are easier to implement, the kinetics of CO2 conversion to calcium and magnesium carbonates may be slower. However, with increasing interest in the direct use of dilute concentrations of CO2 representative of flue gas concentrations or atmospheric CO2 concentrations, the need to understand the phase transitions and the textural changes in sorbents such as calcium hydroxide as it is converted to calcium carbonate provides important insights into the composition of these materials for potential use.
One of the key motivations for investigating the phase transitions and textural changes of calcium hydroxide during carbon mineralization is the abundance of these materials in alkaline industrial residues including coal fly ash, steel slag, and red mud [8] and less studied wastes such as carbide slag residues [16] which have been reported to have more than 90% calcium hydroxide in the dry state. Carbide slag is one of the byproducts of the hydrolysis of calcium carbide (CaC2), a reaction generating ethylene, polyvinyl chloride (PVC), and other products in the industry [17]. Significant quantities of carbide slag are generated around the world. For example, in China, 70% of acetylene (C2H2), a raw material of polyvinyl chloride (PVC), is generated from calcium carbide. Approximately one ton of PVC results in the production of 1.5–1.9 tons of carbide slag in an industrial plant [17,18]. However, treating carbide slag in an economical manner has been a challenge. While landfilling these materials has been proposed, carbide slag is caustic and corrosive, which increases the risk of environmental contamination. Another approach to utilize carbide slag is to use it to produce cement [18,19]. Recently, a calcium looping process (CLP) was proposed to integrate carbide slag disposal and CO2 capture [20,21,22]. In this approach, carbide slag, recovered from energy-intensive industrial plants, could be used to capture CO2, which is generated by industrial plants, and then used as raw materials to produce cement [23,24,25].
Previous studies discussing CO2 capture with carbide slag or modified carbide slag reported that carbonate conversions up to 28% could be reached after 100 calcination/carbonation cycles in the optimal temperature range of 650 to 700 °C [17]. Modified sorbents produced from carbide slag using reagents such as aluminum nitrate hydrate and glycerol water solution and propionic acid has higher CO2 capture capacity compared to untreated slag. While these studies focused on enhancing the conversion of carbide slag, there was a limited fundamental understanding of the phase transitions and textural behavior of the key constituents of carbide slag such as calcium hydroxide [26,27]. This fundamental understanding is essential for engineering efficient reaction routes for accelerated carbon mineralization with targeted conversions to minimize the associated energy consumption and costs.
In this paper, the evolution of calcium carbonate phases from calcium hydroxide and the corresponding changes in the roughness of the pore–solid interface are investigated using in-operando synchrotron ultrasmall, small, and wide angle X-ray scattering (USAXS/SAXS/WAXS) measurements [6,8,10,11,28,29,30,31,32]. Wide angle X-ray scattering measurements provide unambiguous insights into the structural changes, while ultrasmall and small angle X-ray scattering measurements reveal the changes in the textures of the pore–solid interface during the carbon mineralization of calcium hydroxide to produce calcium carbonate. Calcium hydroxide is continuously reacted with CO2 flowing at 1 atm while being heated from 30 °C to 500 °C in a capillary reaction cell as the multiscale X-ray scattering measurements were taken. While recent efforts by Benedetti, Ilavsky and coworkers relate the reactivity of calcium oxide with CO2 during carbonation and calcination cycles using microstructural modeling of the USAXS [33], in this study, we systematically track the structural evolution of calcium carbonate as it is formed from calcium hydroxide.
2. Materials and Methods
2.1. Materials
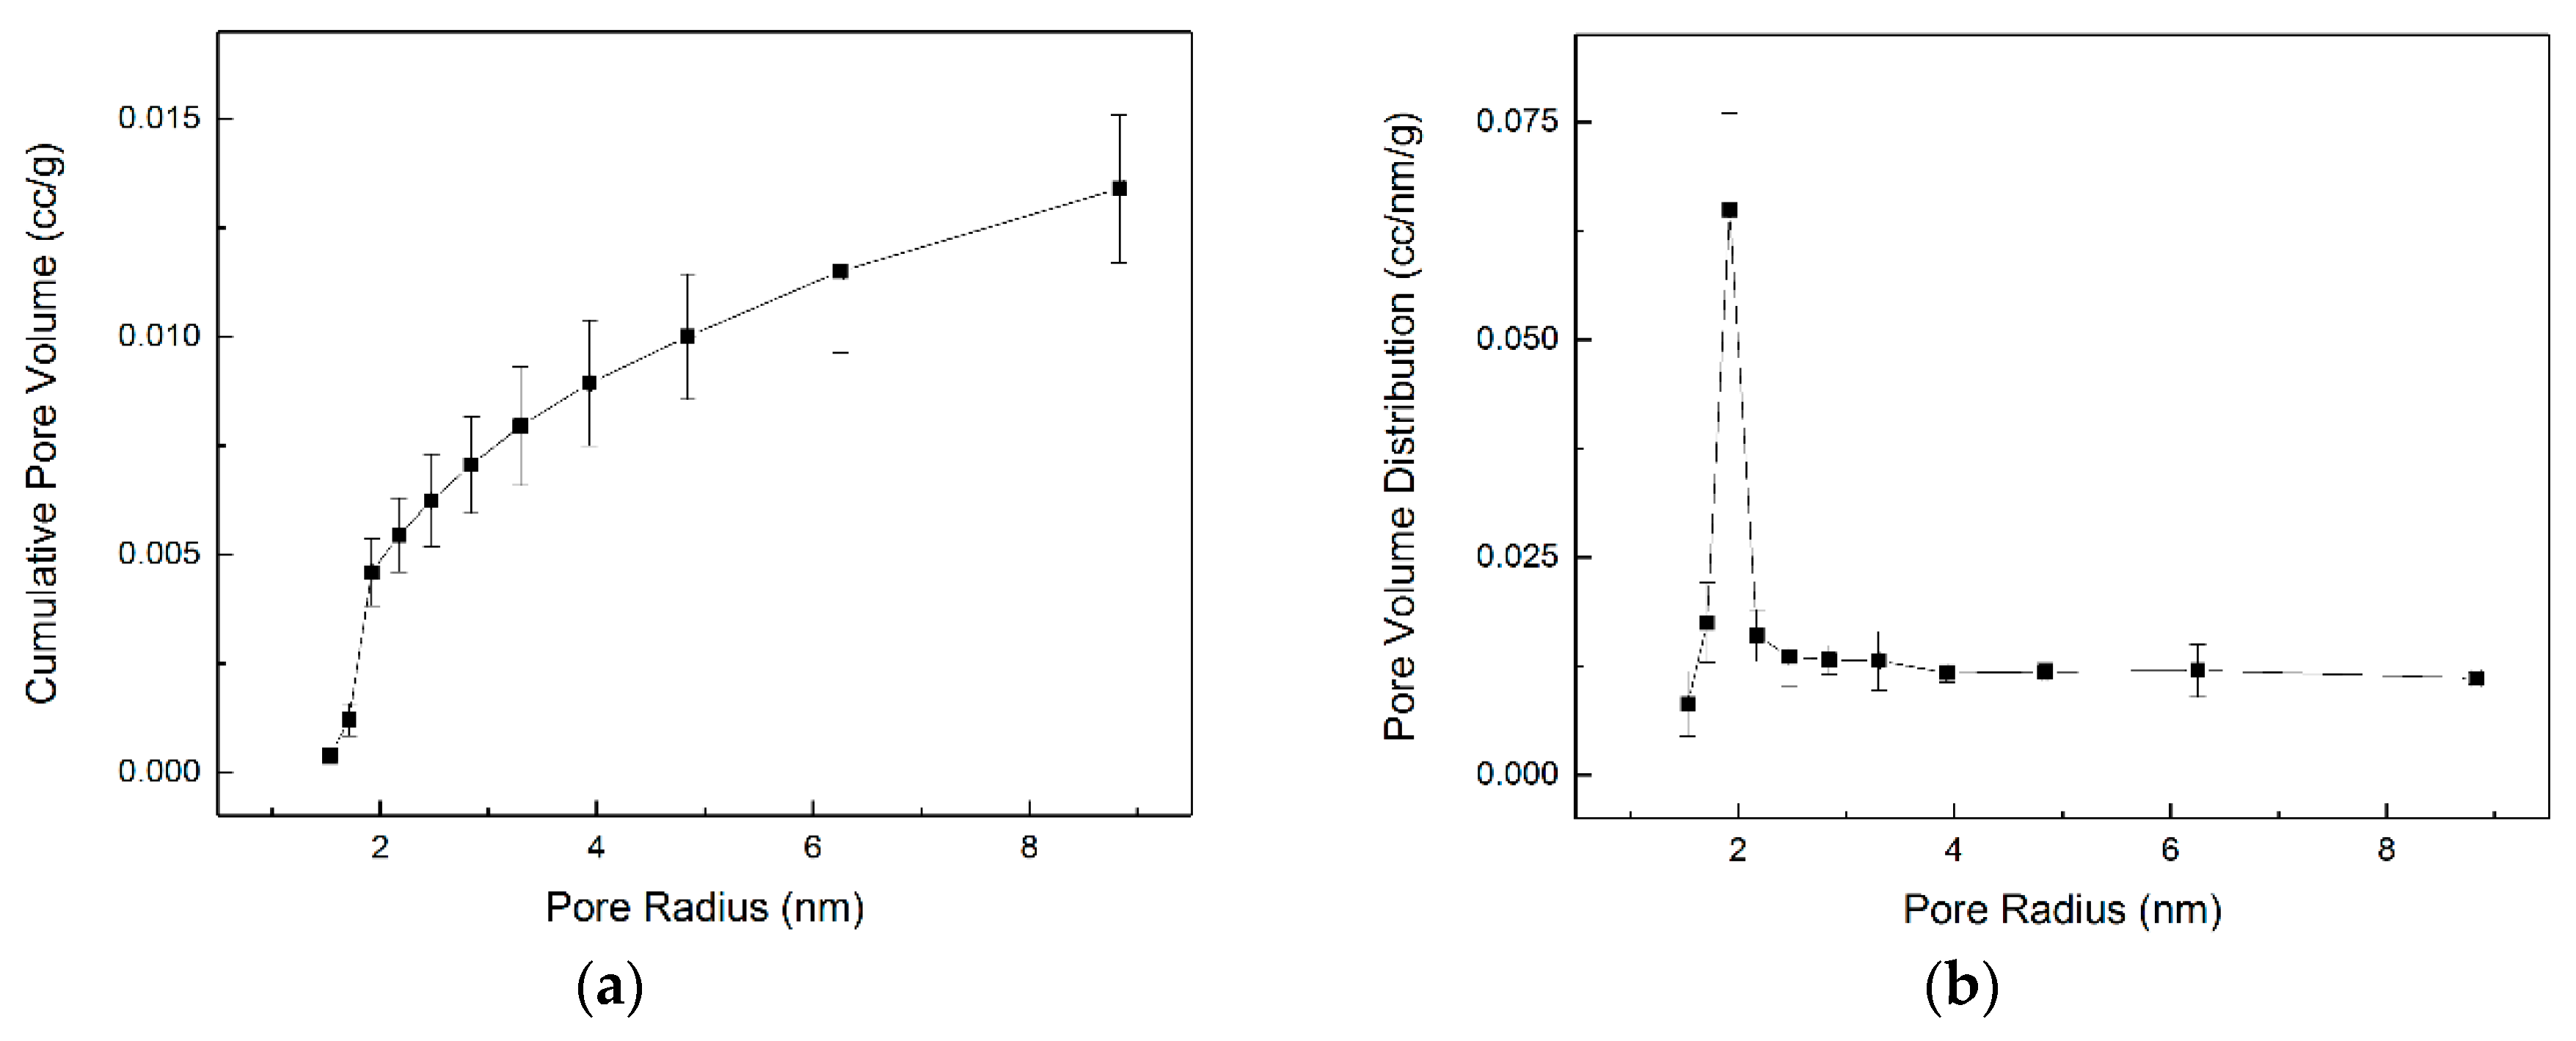
Calcium hydroxide powder (TGA in Figure S1) procured from Himedia Laboratories (West Chester, PA, USA) was placed in a quartz capillary with an internal diameter of 1.3 mm and thickness of 0.2 mm (Friedrich & Dimmock Inc., Millville, NJ, USA) and loaded into a capillary cell holder [34]. Glass wool was placed at both ends of the capillary to hold the powder in place. CO2 was continuously supplied at a flow rate of 10 mL/min. Temperatures in the range of 29 °C to 502 °C were investigated and the ramp rate was set to 4.73 °C/min. The surface area and cumulative pore volume of Ca(OH)2 used in this experiment is 8.65 (±0.82) m2/g and 0.0134 (±0.0017) mL/g, respectively. The pore size distribution of calcium hydroxide is shown in Figure 1.
2.2. USAXS/SAXS/WAXS Measurements
The multiscale X-ray scattering measurements were performed at Sector 9-ID at the Advanced Photon Source (APS) in Argonne National Laboratory (ANL), Argonne, IL, USA [35,36]. Temporal uncertainties in the collected data were reduced with rapid acquisition times which were set to 90 s, 30 s, and 30 s for USAXS, SAXS, and WAXS, respectively. The total X-ray flux, energy, and corresponding wavelength were 10−13 photon s−1, 21.0 keV, and 0.59 Å, respectively. SAXS and WAXS measurements were calibrated using silver behenate and the NIST standard reference material, SRM 640d (Si), respectively [37]. Data analyses were performed in the Irena and Nika software packages embedded in IgorPro (Wavemetrics, Lake Oswego, OR, USA) [38,39].
3. Results
3.1. Phase Transformations during the Carbon Mineralization of Calcium Hydroxide
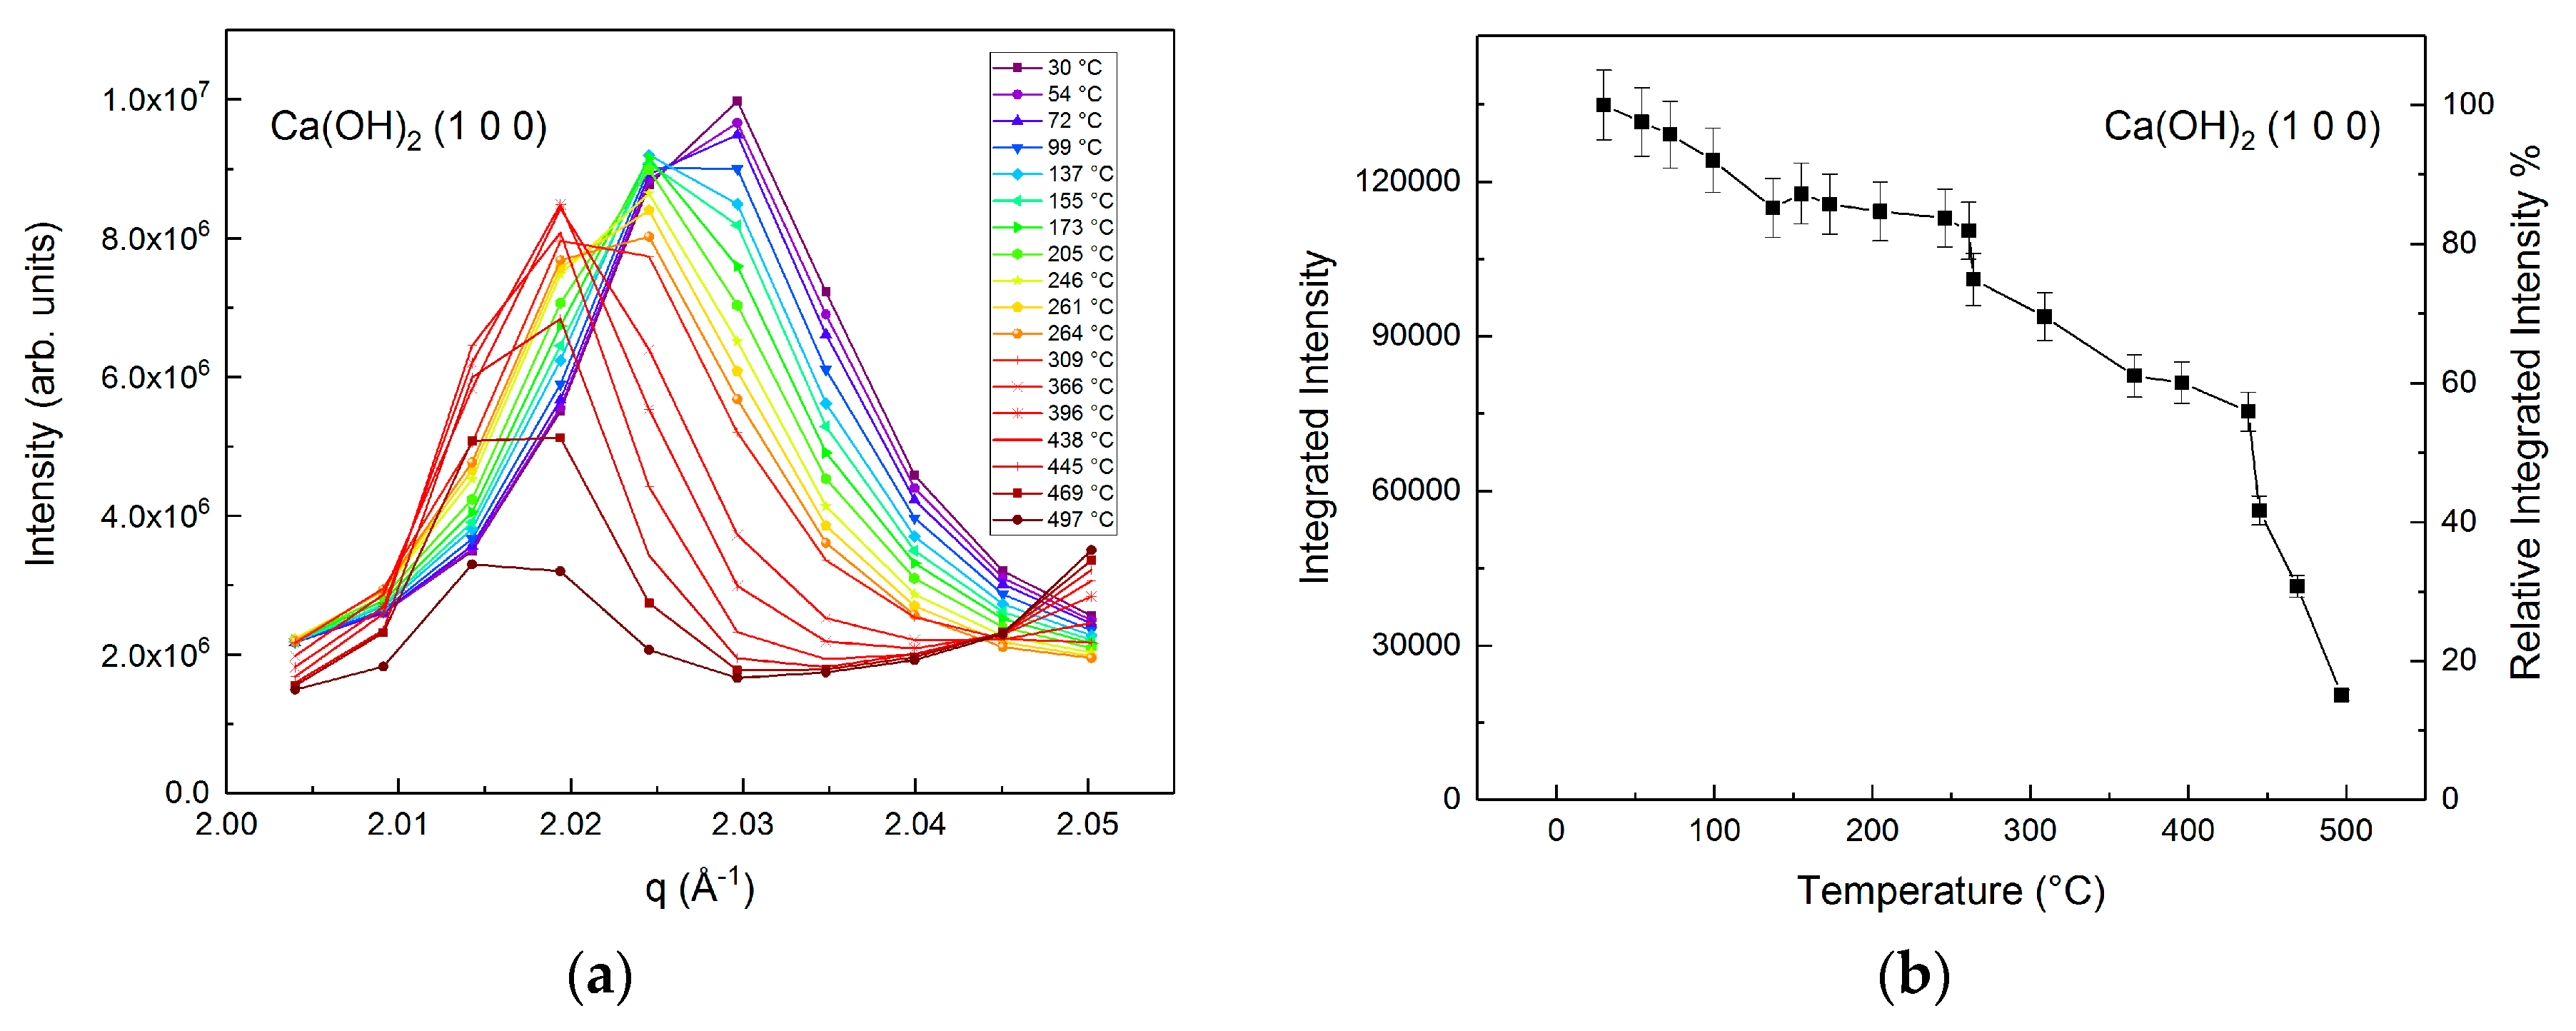
The changes in the structure of calcium hydroxide were determined from the wide angle X-ray scattering data. The characteristic peak of calcium hydroxide which corresponds to the (1 0 0) reflection at q = 2.024 Å−1 undergoes significant changes with continuous CO2 flow as the temperature increases (Figure 2) [40]. The shift in the characteristic peak to lower q or larger d values corresponds to thermal expansion, as reported in previous studies [10,28,41]. Tracking the changes in the integrated intensity of calcium hydroxide peak yields important insights into the onset of carbon mineralization behavior. The relative integrated intensity of calcium hydroxide as it reacts with CO2 and with increasing temperature is shown in Figure 2b. As the reaction temperature is increased to 400 °C, the peak intensity is reduced to 60% of the original value at ambient temperature (Figure 2b). A steeper reduction in the integrated peak intensity to 15% of the original value at ambient temperature is noted as the reaction temperature increases to 500 °C. These observations were consistent with the changes in the characteristic (0 0 1) reflection of calcium hydroxide at q = 1.28 Å−1 (Figure S2a,b). The relative integrated intensity of this peak decreases from 80% at 400 °C to 30% at 500 °C, which provides additional validation of major structural changes of calcium hydroxide to produce calcium carbonate. The disappearance of the characteristic peaks of calcium hydroxide as it is reacted with CO2 is consistent with previous studies [17,42,43].
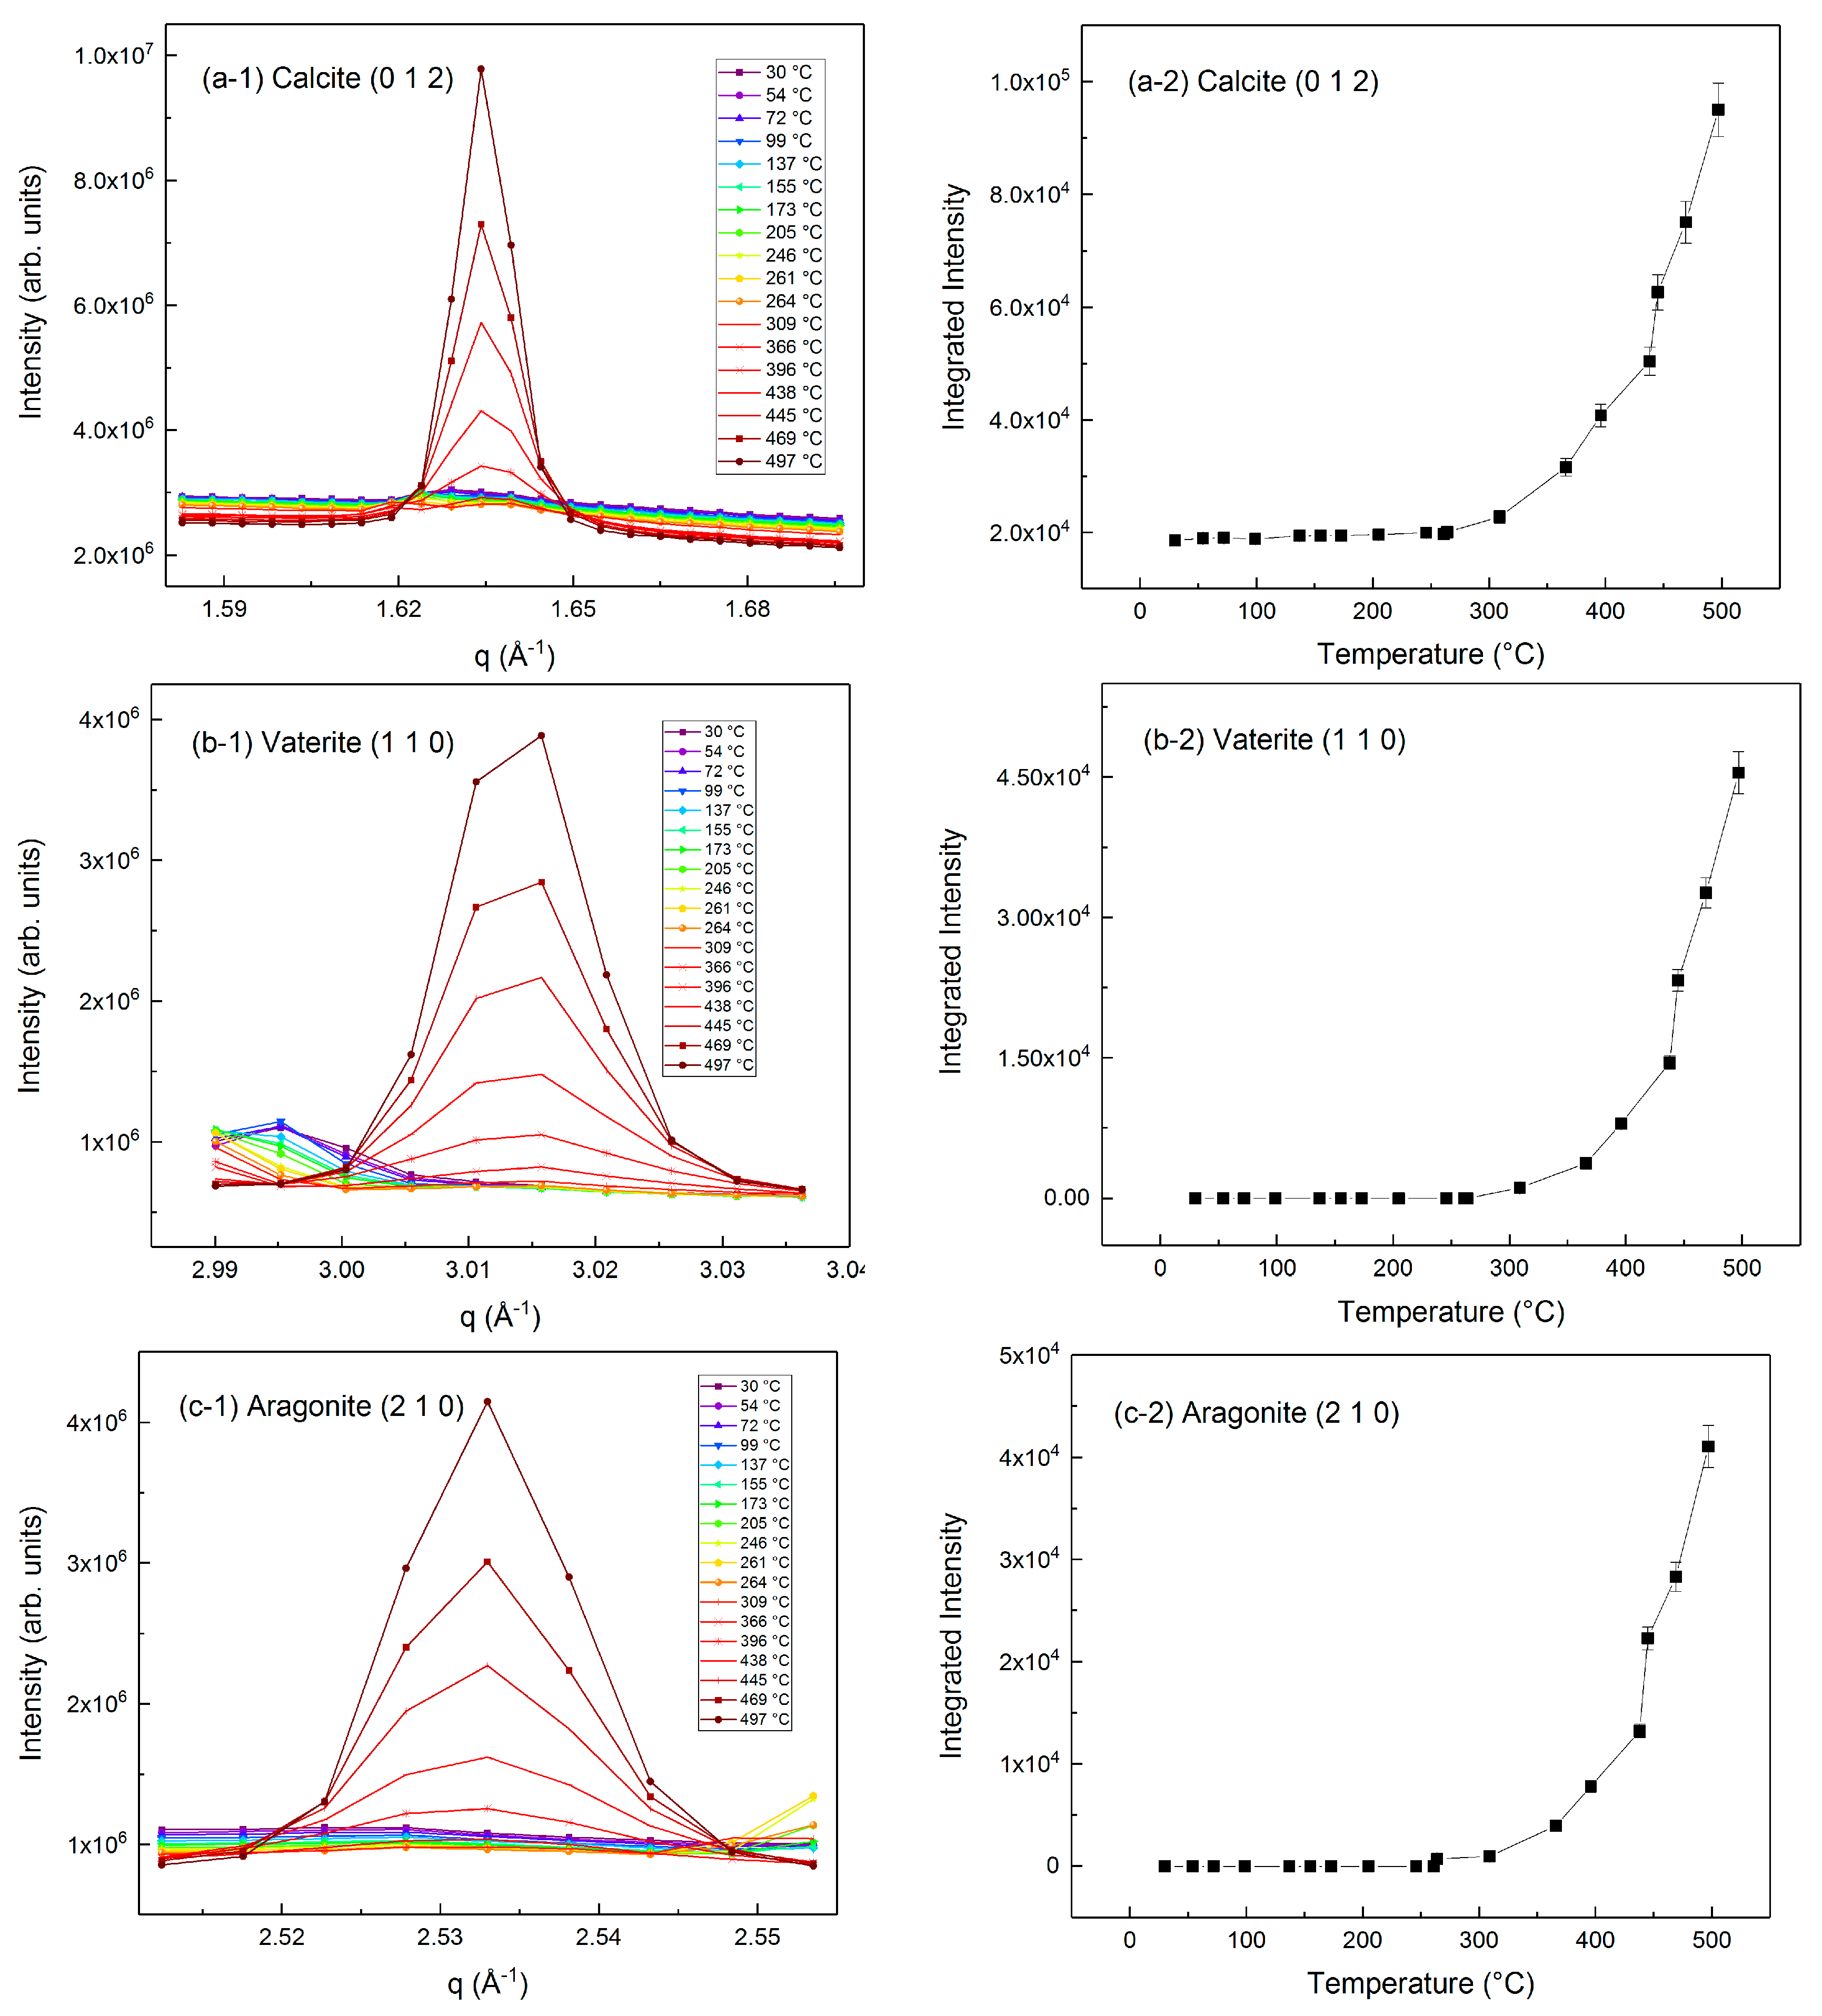
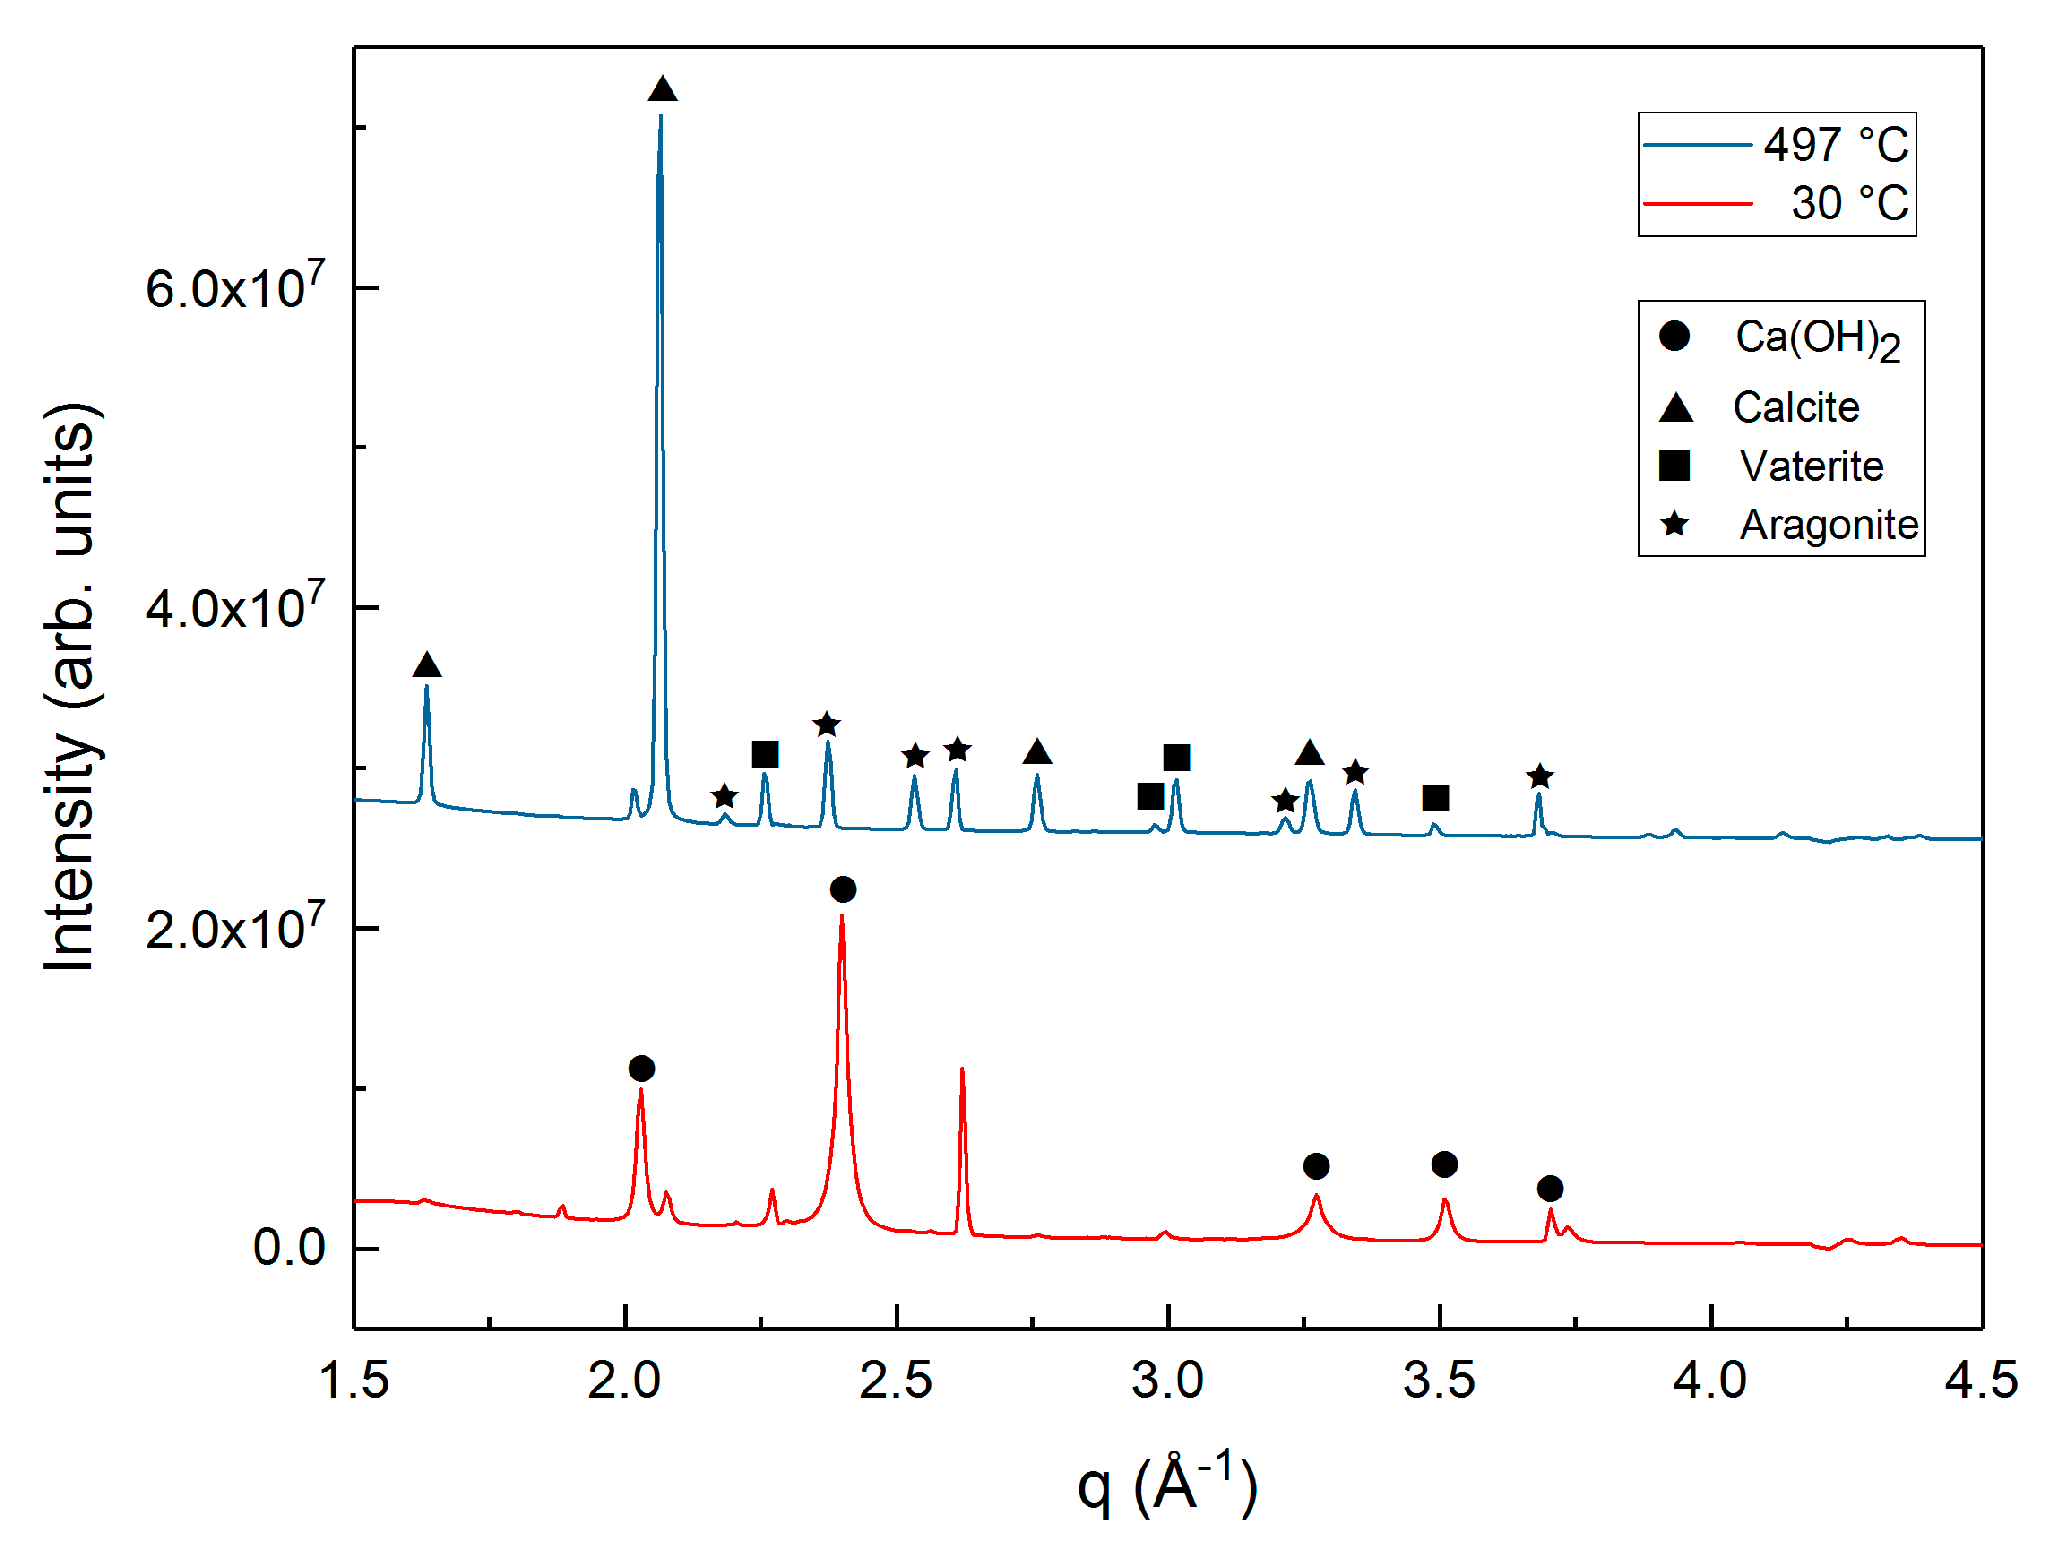
The disappearance of the calcium hydroxide peaks corresponds to the onset of calcium carbonate peaks. The onset of three different phases of calcium hydroxide: aragonite, vaterite, and calcite is noted during the carbon mineralization process. The characteristic peaks of calcite (0 1 2) at q = 1.63 Å−1, vaterite (1 1 0) at q = 3.02 Å−1, and aragonite (2 1 0) at q = 2.53 Å−1 in the WAXS regime, all start to emerge at 300 °C. These data suggest that all types of CaCO3 form at the same time, instead of transforming from one structure to another [44,45,46]. The integrated peak intensities show that the growth of the calcium carbonate phases is significantly enhanced as the temperature increases above 400 °C (Figure 3). These observations are consistent with previous investigations [42]. It was also interesting to note that the formation of calcium carbonate phases did not level off on heating to 500 °C suggesting that less than 100% conversion of calcium hydroxide to calcium carbonate was achieved (Figure 3). A comparison of the wide angle X-ray scattering data at 30 °C and 497 °C suggests that the amount of calcium hydroxide present in the sample reacted at 497 °C may be too small to be detected compared to the abundance of the calcium carbonate present (Figure 4). It was also interesting to note the formation of denser calcium carbonate phases compared to the less dense calcium hydroxide material. The densities of calcite, vaterite, and aragonite are 2.71, 2.65, and 2.94 g/cm3 respectively [47]. In comparison, the density of calcium hydroxide is 2.21 g/cm3. The influence of forming more dense phases on the textural properties of the end product are discussed in the following section.
3.2. Evolution of the Pore–solid Interface during the Carbon Mineralization of Calcium Hydroxide
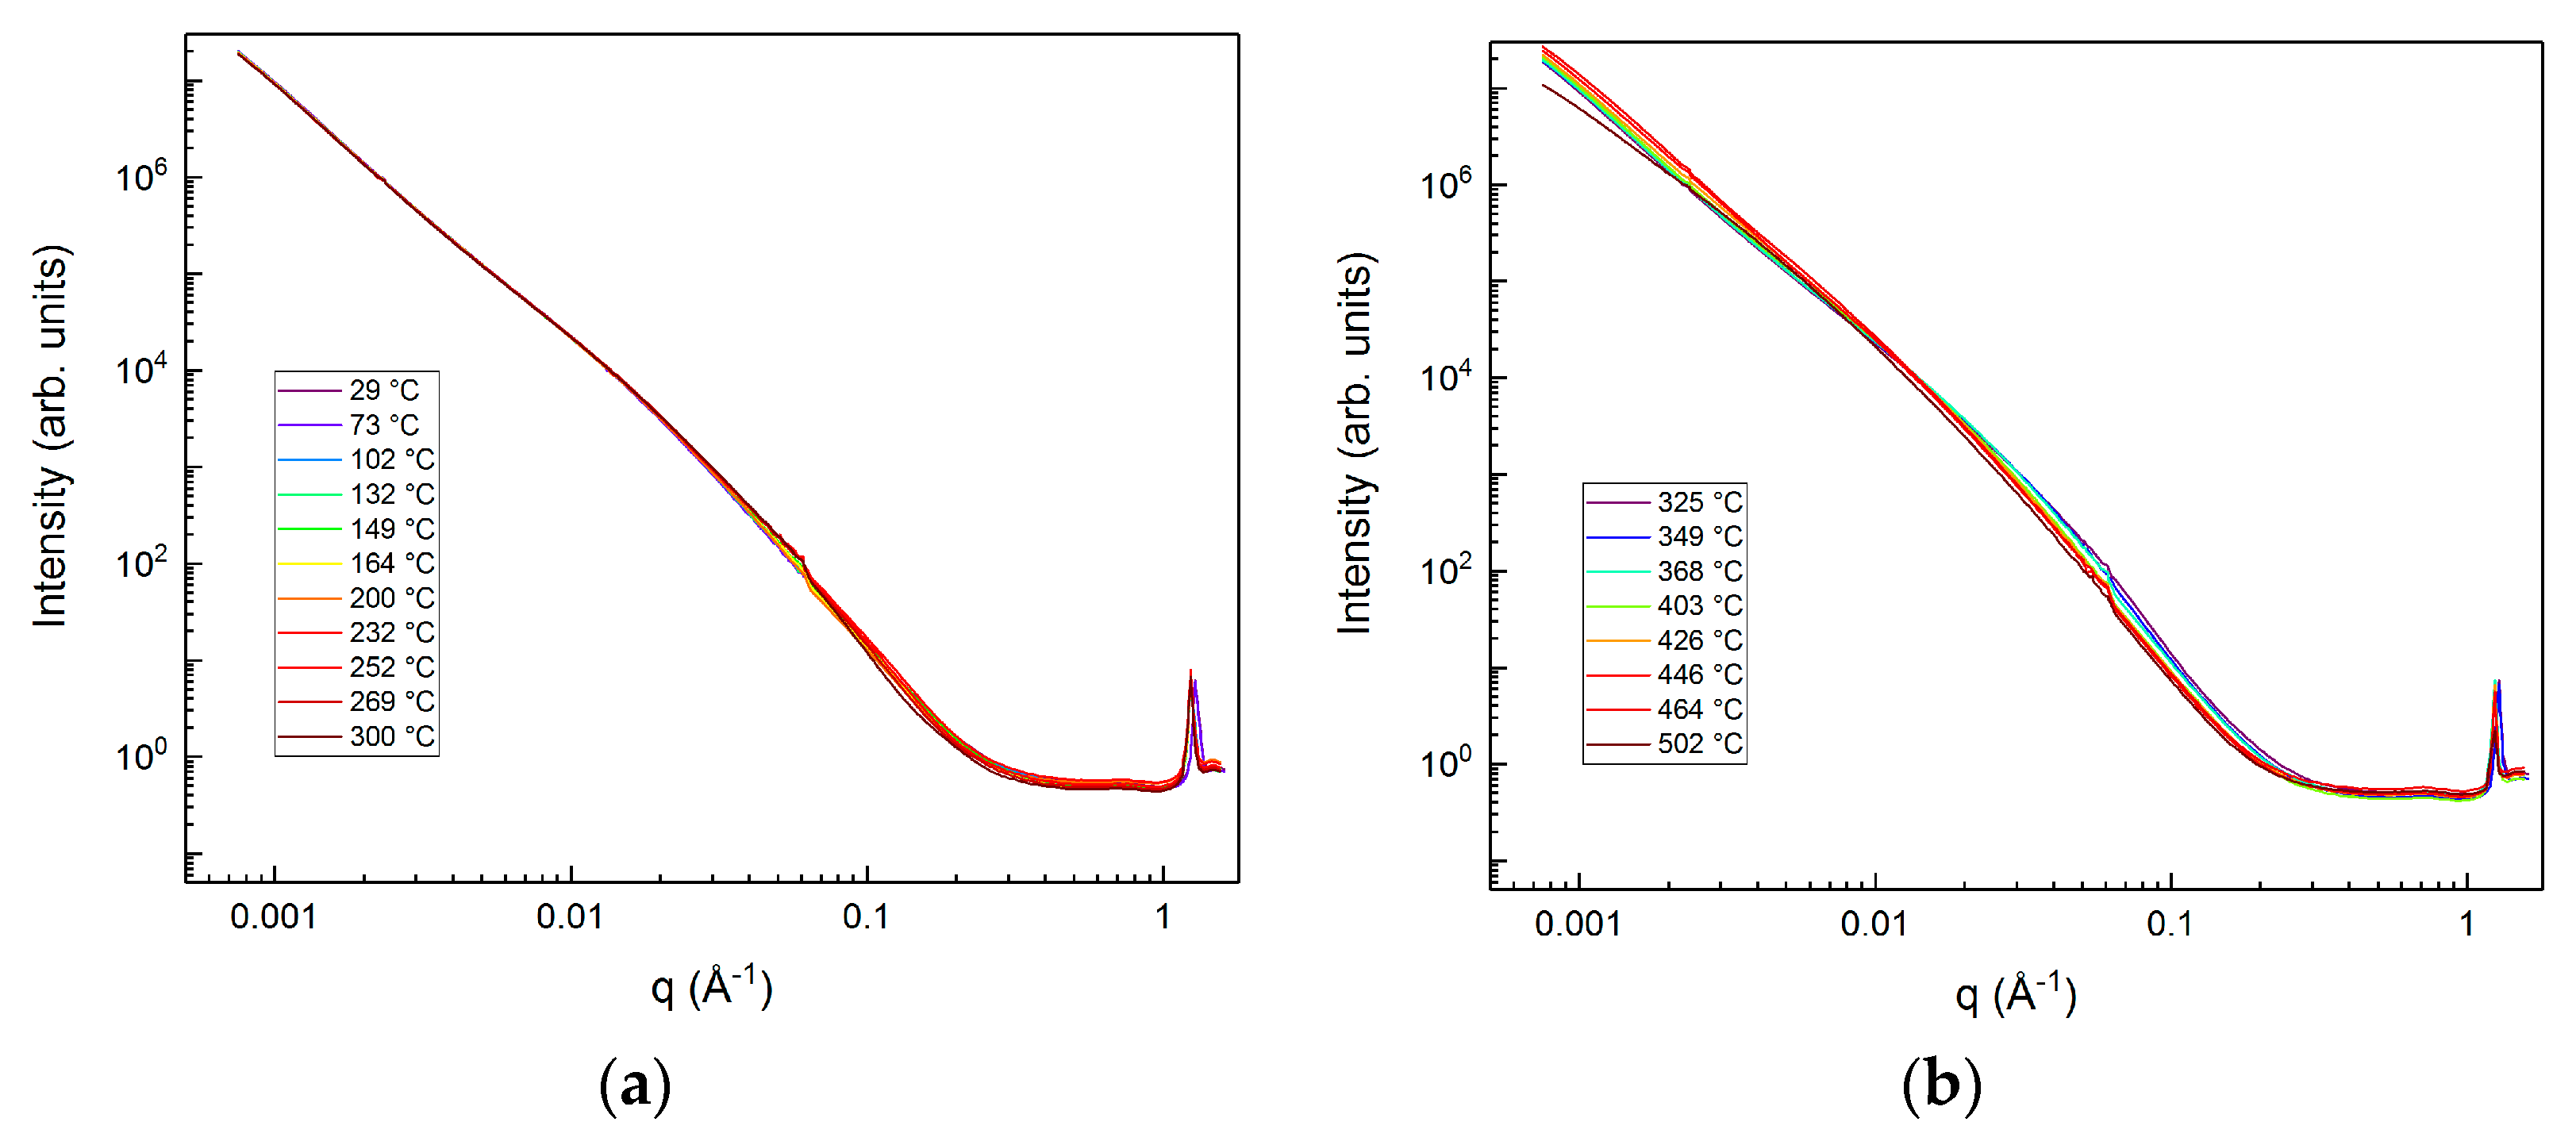
As discussed in the previous section, the changes in the density and shape of the product phases during carbon mineralization may potentially impact the morphology of the material as the reaction proceeds. Insights into the morphological changes of calcium hydroxide as it is converted to calcium carbonate are obtained from the combined Ultrasmall and Small Angle X-Ray Scattering (USAXS/SAXS) data. The combined USAXS/SAXS data of calcium hydroxide during carbon mineralization is represented at temperatures in the range of 29 to 300 °C and 325 to 502 °C in Figure 5a,b, respectively.
The intensity of the USAXS/SAXS data did not change significantly on heating from ambient temperature to 300 °C as shown in Figure 5a. The small reduction in the intensity of the scattering data at q in the range of 0.1 to 2 Å−1 suggests a coarsening in the morphology of the calcium hydroxide. Significant reduction in the scattering intensity, particularly in the range of 0.01 to 0.1 Å−1 is noted. This reduction corresponds to the onset and growth of denser calcium carbonate phases and depletion of calcium hydroxide (Figure 5b). These data suggest that the newly formed CaCO3 phases may occupy the pores of calcium hydroxide resulting in a lower scattering intensities.
Determination of the Porod slopes in the q-range of 0.001 to 0.01 Å−1 and 0.01 to 0.1 Å−1 provided detailed insights into the pore–solid interface. Previous literature reports the fractal character of porous materials such as calcium hydroxide (surface fractal dimension Ds = 2.0 [49]), calcium carbonate (surface fractal dimension, Ds = 1.7665 [50]), cementitious materials (the fractal dimension found was universally 1.25 in pore boundary fractal terms [51]), and shales (surface fractal dimension based on the Porod slope is 3.4 [52]) using scattering techniques. In this study, the fractality of the microstructure is probed in the q regions of 0.001 to 0.01 Å−1 and 0.01 to 0.1 Å−1 using the universal porod slope model. The porod slope is calculated based on the relationships shown below, where I (q) represents the scattering intensity and the n represents the porod slope.
The growth of denser and crystalline calcium carbonate phases results in increasingly smoother pore–solid interfaces in the high q and low q regimes as shown in Figure 5. Porod slope in the low q regime is in the range of 2 to 3, which is indicative of a branched or mass fractal morphology at larger length scales. Porod slopes in the high q regime are in the range of 3 to 4, which is indicative of a surface fractal morphology or rough pore–solid interfaces. The changes in the porod slopes were much larger in the high q regime as opposed to in the low q regime suggesting that the morphologies at the larger length scales are branched while the local microstructures are characterized by surface fractal morphologies (Figure 6). These data also suggest that the changes in the local microstructure are much larger compared to the changes in the bulk morphology. The increase in the porod slope from 3.3 to 3.6 in the high q regime of the USAXS/SAXS data suggests that the relative smoothness of the pore–solid interface may be enhanced during the growth of the calcium carbonate phases. These observations are consistent with previously observed studies that report smoother pore–solid interfaces resulting from the growth of denser, crystalline phases [10,51].
4. Conclusions
In this study, we report the phase transitions and the textural changes as calcium hydroxide, one of the significant components of alkaline industrial residues, is converted to calcium carbonate using in-operando Ultrasmall, Small, and Wide Angle X-Ray Scattering (USAXS/SAXS/WAXS) measurements. The onset of calcium carbonate formation is noted at 300 °C and the progressive growth of these phases is noted as the temperature increases to 500 °C. The simultaneous onset of three different calcium carbonate phases identified as calcite, vaterite, and aragonite are reported. Textural changes as calcium hydroxide is converted to calcium carbonate are noted. The pore–solid interface in the high q regime in the range of 0.01 to 0.1 Å−1 is representative of a surface fractal morphology. Reduced roughness of the pore–solid interface is noted due to the formation of denser and crystalline phases of calcium carbonate. These data suggest that connecting the phase transitions and the morphologies of alkaline-bearing materials as they are converted to their respective carbonates has important implications for process scale considerations such as the temperature conditions that yield optimal composition and morphology of the desired end-products.
Supplementary Materials
The following are available online at https://www.mdpi.com/2076-3263/8/12/445/s1, Figure S1: Determination of the weight change in calcium hydroxide using thermogravimetric analyses (TGA). Figure S2: Changes in the characteristic peaks of Ca(OH)2 (d = 4.90 Å, q = 1.28 Å−1, h k l: (0 0 1)) and the integrated peak intensity are represented in (a) and (b), respectively [40]. The relative integrated intensity of calcium hydroxide represented in (b) is the integrated intensity of the characteristic peak at a given temperature normalized to the integrated intensity at 30 °C. Vertical bars in (b) represent estimated 5% standard deviation uncertainties.
Author Contributions
Conceptualization, G.G.; Methodology, G.G.; Software, G.G. and M.L.; Validation, Formal Analysis, Investigation, G.G. and M.L; Resources, G.G.; Data Curation, G.G.; Writing—Original draft preparation, M.L.; Writing—Review and editing, G.G.; Visualization, G.G. and M.L.; Supervision, G.G.; Project Administration, G.G.; Funding Acquisition, G.G.
Funding
This research was funded by the Fall Competition Grant provided by the University of Wisconsin, Madison, WI, USA.
Acknowledgments
The authors gratefully acknowledge the Wisconsin Alumni Research Foundation and the College of Engineering at the University of Wisconsin, Madison, WI, USA. A special thanks to Jan Ilavsky and Ivan Kuzmenko, X-ray Science Division, Argonne National Laboratory, for providing experimental support for the combined USAXS/SAXS/WAXS measurements at the Advanced Photon Source. The use of the Advanced Photon Source, an Office of Science User Facility operated for the U.S. Department of Energy (DOE) Office of Science by Argonne National Laboratory, was supported by the U.S. DOE under Contract DE-AC02-06CH11357.
Conflicts of Interest
The authors declare no conflicts of interest.
References
- Fauth, D.J.; Goldberg, P.M.; Knoer, J.P.; Soong, Y.; O’Connor, W.K.; Dahlin, D.C.; Nilsen, D.N.; Walters, R.P.; Lackner, K.S.; Ziock, H.J.; et al. Carbon dioxide storage as mineral carbonates. ACS Div. Fuel Chem. Prepr. 2000, 45, 708–711. [Google Scholar]
- Lackner, K.S. Carbonate chemistry for sequestering fossil carbon. Annu. Rev. Energy Environ. 2002, 27, 193–232. [Google Scholar] [CrossRef]
- Seifritz, W. CO2 disposal by means of silicates. Nature 1990, 345, 486. [Google Scholar] [CrossRef]
- Metz, B. IPCC Special Report on Carbon Dioxide Capture and Storage; Cambridge University Press: Cambridge, UK, 2005. [Google Scholar]
- Mission Innovation Carbon Capture, Utilization, and Storage (CCUS) Expert’s Workshop. Accelerating Breakthrough Innovation in Carbon Capture, Utilization, and Storage. Available online: https://www.energy.gov/fe/downloads/accelerating-breakthrough-innovation-carbon-capture-utilization-and-storage (accessed on 19 October 2018).
- Gadikota, G.; Matter, J.; Kelemen, P.; Park, A.-H.A. Chemical and morphological changes during olivine carbonation for CO2 storage in the presence of NaCl and NaHCO3. Phys. Chem. Chem. Phys. 2014, 16, 4679–4693. [Google Scholar] [CrossRef] [PubMed]
- Gadikota, G.; Swanson, E.; Zhao, H.; Park, A.-H.A. Experimental Design and Data Analysis for Accurate Estimation of Reaction Kinetics and Conversion for Carbon Mineralization. Ind. Eng. Chem. Res. 2014, 53, 6664–6676. [Google Scholar] [CrossRef]
- Gadikota, G.; Park, A.-H.A. Accelerated Carbonation of Ca- and Mg-Bearing Minerals and Industrial Wastes Using CO2. In Carbon Dioxide Utilisation: Closing the Carbon Cycle; Elsevier: Amsterdam, The Netherlands, 2015; pp. 115–137. [Google Scholar]
- Gadikota, G.; Fricker, K.J.; Jang, S.-H.; Park, A.-H.A. Carbonated silicate minerals and industrial wastes as construction materials. In Advances in CO2 Capture, Sequestration, and Conversion; American Chemical Society: Washington, DC, USA, 2015; pp. 295–322. [Google Scholar]
- Liu, M.; Gadikota, G. Chemo-morphological coupling during serpentine heat treatment for carbon mineralization. Fuel 2018, 227, 379–385. [Google Scholar] [CrossRef]
- Liu, M.; Gadikota, G. Integrated CO2 capture, conversion and storage to produce calcium carbonate using an amine looping strategy. Energy Fuels 2018. [Google Scholar] [CrossRef]
- Power, I.M.; Harrison, A.L.; Dipple, G.M.; Wilson, S.A.; Kelemen, P.B.; Hitch, M.; Southam, G. Carbon mineralization: From natural analogues to engineered systems. Rev. Mineral. Geochem. 2013, 77, 305–360. [Google Scholar] [CrossRef]
- Sanna, A.; Hall, M.R.; Maroto-Valer, M. Post-processing pathways in carbon capture and storage by mineral carbonation (CCSM) towards the introduction of carbon neutral materials. Energy Environ. Sci. 2012, 5, 7781–7796. [Google Scholar] [CrossRef]
- Gerdemann, S.J.; O’Connor, W.K.; Dahlin, D.C.; Penner, L.R.; Rush, H. Ex situ aqueous mineral carbonation. Environ. Sci. Technol. 2007, 41, 2587–2593. [Google Scholar] [CrossRef] [PubMed]
- McKelvy, M.J.; Chizmeshya, A.V.G.; Diefenbacher, J.; Béarat, H.; Wolf, G. Exploration of the role of heat activation in enhancing serpentine carbon sequestration reactions. Environ. Sci. Technol. 2004, 38, 6897–6903. [Google Scholar] [CrossRef] [PubMed]
- Liu, W.; Yang, J.; Xiao, B. Review on treatment and utilization of bauxite residues in China. Int. J. Miner. Process. 2009, 93, 220–231. [Google Scholar] [CrossRef]
- Li, Y.; Sun, R.; Liu, C.; Liu, H.; Lu, C. CO2 capture by carbide slag from chlor-alkali plant in calcination/carbonation cycles. Int. J. Greenh. Gas Control 2012, 9, 117–123. [Google Scholar] [CrossRef]
- Cheng, J.; Zhou, J.; Liu, J.; Cao, X.; Cen, K. Physicochemical characterizations and desulfurization properties in coal combustion of three calcium and sodium industrial wastes. Energy Fuels 2009, 23, 2506–2516. [Google Scholar] [CrossRef]
- Cao, J.; Liu, F.; Lin, Q.; Zhang, Y. Hydrothermal synthesis of xonotlite from carbide slag. Prog. Nat. Sci. 2008, 18, 1147–1154. [Google Scholar] [CrossRef]
- Bobicki, E.R.; Liu, Q.; Xu, Z.; Zeng, H. Carbon capture and storage using alkaline industrial wastes. Prog. Energy Combust. Sci. 2012, 38, 302–320. [Google Scholar] [CrossRef]
- Li, B.; Duan, Y.; Luebke, D.; Morreale, B. Advances in CO2 capture technology: A patent review. Appl. Energy 2013, 102, 1439–1447. [Google Scholar] [CrossRef]
- Blamey, J.; Anthony, E.J.; Wang, J.; Fennell, P.S. The calcium looping cycle for large-scale CO2 capture. Prog. Energy Combust. Sci. 2010, 36, 260–279. [Google Scholar] [CrossRef]
- Liu, W.; An, H.; Qin, C.; Yin, J.; Wang, G.; Feng, B.; Xu, M. Performance enhancement of calcium oxide sorbents for cyclic CO2 capture—A review. Energy Fuels 2012, 26, 2751–2767. [Google Scholar] [CrossRef]
- Valverde, J.M. Ca-based synthetic materials with enhanced CO2 capture efficiency. J. Mater. Chem. A 2013, 1, 447–468. [Google Scholar] [CrossRef]
- Manovic, V.; Anthony, E.J. Lime-based sorbents for high-temperature CO2 capture-a review of sorbent modification methods. Int. J. Environ. Res. Public Health 2010, 7, 3129–3140. [Google Scholar] [CrossRef] [PubMed]
- Li, Y.; Su, M.; Xie, X.; Wu, S.; Liu, C. CO2 capture performance of synthetic sorbent prepared from carbide slag and aluminum nitrate hydrate by combustion synthesis. Appl. Energy 2015, 145, 60–68. [Google Scholar] [CrossRef]
- Sun, R.; Li, Y.; Zhao, J.; Liu, C.; Lu, C. CO2 capture using carbide slag modified by propionic acid in calcium looping process for hydrogen production. Int. J. Hydrog. Energy 2013, 38, 13655–13663. [Google Scholar] [CrossRef]
- Gadikota, G.; Zhang, F.; Allen, A.J. Towards understanding the microstructural and structural changes in natural hierarchical materials for energy recovery: In-operando multiscale X-ray scattering characterization of Na- and Ca-montmorillonite on heating to 1150 °C. Fuel 2017, 196, 195–209. [Google Scholar] [CrossRef] [PubMed]
- Gadikota, G.; Zhang, F.; Allen, A. In Situ angstrom-to-micrometer characterization of the structural and microstructural changes in kaolinite on heating using ultra small-angle, small-angle, and wide-angle X-ray scattering (USAXS/SAXS/WAXS). Ind. Eng. Chem. Res. 2017, 56, 11791–11801. [Google Scholar] [CrossRef]
- Gadikota, G.; Allen, A.J. Microstructural and structural characterization of materials for CO2 storage using multiscale X-ray scattering methods. In Materials and Processes for CO2 Capture, Conversion, and Sequestration; John Wiley & Sons: Hoboken, NJ, USA, 2017; Volume 27, pp. 296–318. [Google Scholar]
- Anovitz, L.; Cole, D. Characterization and analysis of porosity and pore structures. Rev. Mineral. Geochem. 2015, 80, 61–164. [Google Scholar] [CrossRef]
- Ilavsky, J.; Zhang, F.; Andrews, R.N.; Kuzmenko, I.; Jemian, P.R.; Levine, L.E.; Allen, A.J. Development of combined microstructure and structure characterization facility for in situ and operando studies at the advanced photon source. J. Appl. Crystallogr. 2018, 51, 867–882. [Google Scholar] [CrossRef]
- Benedetti, A.; Ilavsky, J.; Segre, C.; Strumendo, M. Analysis of textural properties of CaO-based CO2 sorbents by ex situ USAXS. Chem. Eng. J. 2019, 355, 760–776. [Google Scholar] [CrossRef]
- Chupas, P.J.; Chapman, K.W.; Kurtz, C.; Hanson, J.C.; Lee, P.L.; Grey, C.P. A versatile sample-environment cell for non-ambient X-ray scattering experiments. J. Appl. Crystallogr. 2008, 41, 822–824. [Google Scholar] [CrossRef]
- Ilavsky, J.; Jemian, P.R.; Allen, A.J.; Zhang, F.; Levine, L.E.; Long, G.G. Ultrasmall-angle X-ray scattering at the Advanced Photon Source. J. Appl. Crystallogr. 2009, 42, 469–479. [Google Scholar] [CrossRef]
- Ilavsky, J.; Zhang, F.; Allen, A.J.; Levine, L.E.; Jemian, P.R.; Long, G.G. Ultrasmall-angle X-ray scattering instrument at the advanced photon source: History, recent development, and current status. Metall. Mater. Trans. A 2013, 44, 68–76. [Google Scholar] [CrossRef]
- Black, D.R.; Windover, D.; Henins, A.; Gil, D.; Filliben, J.; Cline, J.P. Certification of NIST standard reference material 640d. Powder Diffr. 2010, 25, 187–190. [Google Scholar] [CrossRef]
- Ilavsky, J.; Jemian, P.R. Irena: Tool suite for modeling and analysis of small-angle scattering. J. Appl. Crystallogr. 2009, 42, 347–353. [Google Scholar] [CrossRef]
- Ilavsky, J. Nika: Software for two-dimensional data reduction. J. Appl. Crystallogr. 2012, 45, 324–328. [Google Scholar] [CrossRef]
- Petch, H.E. The hydrogen positions in portlandite, Ca(OH)2, as indicated by the electron distribution. Acta Crystallogr. 1961, 14, 950–957. [Google Scholar] [CrossRef]
- Gadikota, G.; Zhang, F.; Allen, A. In Situ Angstrom-to-Micrometer Characterization of the Structural and Microstructural Changes in Kaolinite on Heating Using Ultrasmall-Angle, Small-Angle, and Wide-Angle X-ray Scattering (USAXS/SAXS/WAXS). Ind. Eng. Chem. Res. 2017, 56, 11791–11801. [Google Scholar] [CrossRef]
- Materic, V.; Smedley, S.I. High Temperature Carbonation of Ca(OH)2. Ind. Eng. Chem. Res. 2011, 50, 5927–5932. [Google Scholar] [CrossRef]
- Nikulshina, V.; Gálvez, M.E.; Steinfeld, A. Kinetic analysis of the carbonation reactions for the capture of CO2 from air via the Ca(OH)2-CaCO3-CaO solar thermochemical cycle. Chem. Eng. J. 2007, 129, 75–83. [Google Scholar] [CrossRef]
- Kamhi, S.R. On the structure of vaterite, CaCO3. Acta Crystallogr. 1963, 16, 770–772. [Google Scholar] [CrossRef]
- Dal Negro, A.; Ungaretti, L. Refinement of the Crystal Structure of Aragonite. Am. Mineral. 1971, 56, 768–772. [Google Scholar]
- Chessin, H.; Hamilton, W.C.; Post, B. Position and thermal parameters of oxygen atoms in calcite. Acta Crystallogr. 1965, 18, 689–693. [Google Scholar] [CrossRef] [Green Version]
- Christy, A.G. A review of the structures of vaterite: the impossible, the possible, and the likely. Cryst. Growth Des. 2017, 17, 3567–3578. [Google Scholar] [CrossRef]
- Maslen, E.N.; Streltsov, V.A.; Streltsova, N.R. X-ray study of the electron density in calcite, CaCO3. Acta Crystallogr. Sect. B 1993, 49, 636–641. [Google Scholar] [CrossRef]
- Richards, R.; Li, W.; Decker, S.; Davidson, C.; Koper, O.; Zaikovski, V.; Volodin, A.; Rieker, T.; Klabunde, K.J. Consolidation of metal oxide nanocrystals. Reactive pellets with controllable pore structure that represent a new family of porous, inorganic materials. J. Am. Chem. Soc. 2000, 122, 4921–4925. [Google Scholar] [CrossRef]
- Liang, J.Z.; Duan, D.R.; Tang, C.Y.; Tsui, C.P. Correlation between impact strength and fractal dimensions of fracture surface for PLLA/nano-CaCO3 composites. Polym. Test. 2014, 35, 109–115. [Google Scholar] [CrossRef]
- Diamond, S. Aspects of concrete porosity revisited. Cem. Concr. Res. 1999, 29, 1181–1188. [Google Scholar] [CrossRef]
- Liu, M.; Gadikota, G. Probing the Influence of Thermally Induced Structural Changes on the Microstructural Evolution in Shale using Multiscale X-ray Scattering Measurements. Energy Fuels 2018, 32, 8193–8201. [Google Scholar] [CrossRef]
Figure 1.
The cumulative pore volume (a) and pore volume distribution (b) of unreacted calcium hydroxide using Brunauer–Emmett–Taylor (BET) measurements.
Figure 1.
The cumulative pore volume (a) and pore volume distribution (b) of unreacted calcium hydroxide using Brunauer–Emmett–Taylor (BET) measurements.

Figure 2.
Changes in the characteristic peak of calcium hydroxide (d = 3.105 Å, q = 2.024 Å−1, h k l: (1 0 0)) and the integrated peak intensity are represented in (a) and (b), respectively [40]. The relative integrated intensity of calcium hydroxide represented in (b) is the integrated intensity of the characteristic peak at a given temperature normalized to the integrated intensity at 30 °C. Vertical bars in (b) represent estimated 5% standard deviation uncertainties.

Figure 3.
Changes in the characteristic carbonates peaks: calcite (d = 3.85 Å, q = 1.63 Å−1, h k l: (0 1 2)) [46] in (a-1), vaterite (d = 2,08 Å, q = 3.02 Å−1, h k l: (1 1 0)) [44] in (b-1), and aragonite (d = 2.48 Å, q = 2.53 Å−1, h k l: (2 1 0)) [45] in (c-1) as calcium hydroxide is reacted with CO2 at reaction temperatures in the range of 30 °C to 500 °C. The integrated peak intensities of calcite, vaterite, and aragonite are shown in Figure 3 (a-2,b-2 and c-2) respectively. Vertical bars represent estimated 5% standard deviation uncertainties in Figure 3 (a-2,b-2 and c-2).

Figure 4.
Identification of the characteristic peaks in unreacted and reacted calcium hydroxide at 30 °C and 497 °C, respectively, using wide angle X-ray scattering (WAXS) measurements. Peak identification is based on the crystallographic data reported for calcium hydroxide [40], calcite [46,48], vaterite [44,47], and aragonite [45].

Figure 5.
Changes in the combined slit-smeared USAXS/SAXS data as calcium hydroxide is reacted with CO2 where (a) and (b) represent temperatures in the range of 29 to 300 °C and 325 to 502 °C, respectively.
Figure 5.
Changes in the combined slit-smeared USAXS/SAXS data as calcium hydroxide is reacted with CO2 where (a) and (b) represent temperatures in the range of 29 to 300 °C and 325 to 502 °C, respectively.

Figure 6.
Porod slopes as calcium hydroxide is reacted with calcium carbonate are represented. Low q and high q ranges represent 0.001 to 0.01 Å−1 and 0.01 to 0.1 Å−1, respectively. The data was obtained after desmearing the USAXS/SAXS data shown in Figure 5. Porod slope of 1 and 4 indicated scattering from rigid rods and smooth surfaces, respectively. Porod slopes in the range of 2 to 3 and 3 to 4 are indicative of branched systems or networks also known as mass fractals and rough interfaces with a fractal dimension, D where n = 6 − D represents a surface fractal.

© 2018 by the authors. Licensee MDPI, Basel, Switzerland. This article is an open access article distributed under the terms and conditions of the Creative Commons Attribution (CC BY) license (http://creativecommons.org/licenses/by/4.0/).
Share and Cite
MDPI and ACS Style
Liu, M.; Gadikota, G. Phase Evolution and Textural Changes during the Direct Conversion and Storage of CO2 to Produce Calcium Carbonate from Calcium Hydroxide. Geosciences 2018, 8, 445. https://doi.org/10.3390/geosciences8120445
AMA Style
Liu M, Gadikota G. Phase Evolution and Textural Changes during the Direct Conversion and Storage of CO2 to Produce Calcium Carbonate from Calcium Hydroxide. Geosciences. 2018; 8(12):445. https://doi.org/10.3390/geosciences8120445
Chicago/Turabian StyleLiu, Meishen, and Greeshma Gadikota. 2018. "Phase Evolution and Textural Changes during the Direct Conversion and Storage of CO2 to Produce Calcium Carbonate from Calcium Hydroxide" Geosciences 8, no. 12: 445. https://doi.org/10.3390/geosciences8120445
Note that from the first issue of 2016, this journal uses article numbers instead of page numbers. See further details here.