Article

The Application of Seismic Attributes and Wheeler Transformations for the Geomorphological Interpretation of Stratigraphic Surfaces: A Case Study of the F3 Block, Dutch Offshore Sector, North Sea

by
Mohammad Afifi Ishak
1,
Md. Aminul Islam
1,*,
Mohamed Ragab Shalaby
1 and
Nurul Hasan
2
1
Department of Physical and Geological Sciences, Faculty of Science, Universiti Brunei Darussalam, Jalan Tungku Link, Gadong BE1410, Brunei Darussalam
2
Department of Petroleum and Chemical Engineering, Faculty of Engineering, Universiti Teknologi Brunei, Jalan Tungku Link, Gadong BE1410, Brunei Darussalam
*
Author to whom correspondence should be addressed.
Geosciences 2018, 8(3), 79; https://doi.org/10.3390/geosciences8030079
Submission received: 25 December 2017 / Revised: 21 February 2018 / Accepted: 23 February 2018 / Published: 26 February 2018

Abstract

:
This study was carried out in the Pliocene interval of the southern North Sea F3 Block in the Netherlands. This research paper demonstrates how an integrated interpretation of geological information using seismic attributes, sequence stratigraphic interpretation and Wheeler transformation methods allow for the accurate interpretation of the depositional environment of a basin, as well as locating seismic geomorphological features. The methodology adopted here is to generate a 3D dip-steered HorizonCube followed by chronostratigraphic analysis, 3D Wheeler transformation, and system tract interpretation. A dip-steered seismic attribute (similarity, dip, and curvature) was performed on each stratigraphic surface of interest and the isopach maps were generated for each stratigraphic surface to help identify the maximum deposition. The results of this study show that the similarity attribute is able to identify distinct stratigraphic features such as sand-waves and deep marine meandering channels. However, its lateral continuity is poorly understood, as the similarity attribute does not take into account the true geological dip and curvature of the surfaces. Structural features such as faults are not easily recognizable due to these reasons. However, the dip-apparent attributes are found to be very useful in identifying both the structural and stratigraphic features. The seismic dip map is then improved by rotating the dip measurements to user-defined azimuths. Such optimization has revealed the structural and stratigraphic features that are not clearly evident on the similarity and curvature attributes. The maximum curvature attribute is found to be useful in delineating faults and predicting the orientation and distribution of fractures and also in subtle structural features.

Graphical Abstract

1. Introduction

Seismic attributes provide geophysicists and seismic interpreters with useful information related to the amplitude, position, and shape of a seismic waveform compared to the conventional or more traditional ways of interpreting seismic stratigraphy. It fully utilizes the use of seismic amplitudes and 3D seismic to map and visualize subsurface stratigraphy and geomorphology, geological structures, and reservoir architecture [1]. Sheriff [2] classified seismic attributes such as a measurement based on seismic data such as envelope, instantaneous phase and frequency, polarity, dip, and dip azimuth. Taner [3] defined seismic attributes as the information obtained either by direct measurement of seismic data or by logical/experience-based reasoning. Seismic attributes form an integral part of the qualitative interpretative tool that facilitates structural and stratigraphic interpretation. It also offers clues to lithology type and fluid content estimation with a potential benefit of detailed reservoir characterization [4]. The rapid advancement of 3D seismic data made in-depth analysis and high-resolution visualization of subsurface possible in a manner resembling surface geomorphology. Seismic geomorphology interpretation is a primary method for mapping and viewing subsurface features as well as aiding the interpretation of seismic structures and stratigraphy, especially in areas away from well control [5].
Understanding sequence stratigraphy is crucial for the better reconstruction of the depositional system and also in identifying new hydrocarbon plays. Sequence stratigraphy refers to a sequence of geological events, processes, or rocks arranged in chronological order [6] and this discipline is still controversial and has generated long arguments among researchers and geoscientist attempting to define the conceptual basis of its technique. Recent software developments, particularly through open-source software such as OpendTect, have enabled researchers to study time attributes of seismic stratigraphic surfaces within the chronostratigraphic framework by using 3D Wheeler Transformation [7,8] and recently 4D Wheeler Transformation [9]. Through 3D Wheeler Transformation, seismic data, as well as attribute volumes, are flattened in 3D space [7] along the auto-tracked horizons while at the same time honoring erosional events and non-depositional hiatuses [10]. Recently, a fourth dimension was introduced [11] which integrated stratigraphic thickness per stratigraphic unit into the 4D Wheeler diagram. A comprehensive historical review of the Wheeler diagram has been documented by Qayyum and Catuneanu [12]. The role of the Wheeler Transformation when integrating it with seismic attributes has proven to be a powerful tool in seismic interpretation and identifying geological features. By combining these two methods instead of using it as a stand-alone tool, it has helped researchers to better understand numerous things as demonstrated in previous studies done in the Netherland Offshore F3 Block (Figure 1) such as porosity prediction [13], fracture and fault characterization [14], structural interpretation [1,15], and turbidites characterization [16]. However, the application of Wheeler Transformation and using seismic attributes to identify geomorphological changes to reconstruct depositional history has been given little to no attention to date.
Therefore, the goals and objectives of this paper are to identify geomorphological changes of stratigraphic surfaces by integrating the Sequence Stratigraphic Interpretation System (SSIS) with Wheeler Transformation methods and seismic attribute analysis, particularly focusing on minimum similarity, maximum curvature, and dip attributes. The surfaces of interest are MFS1, BSFR1, CC/SU1 (depositional sequence 1), and MRS1 (depositional sequence 2). A much more detailed interpretation was done by Qayyum et al. [17]. Although the interval studied does not have any direct relevance for hydrocarbon exploration, the study can be used as an analog in similar geological environments that have potential for valid hydrocarbon plays.

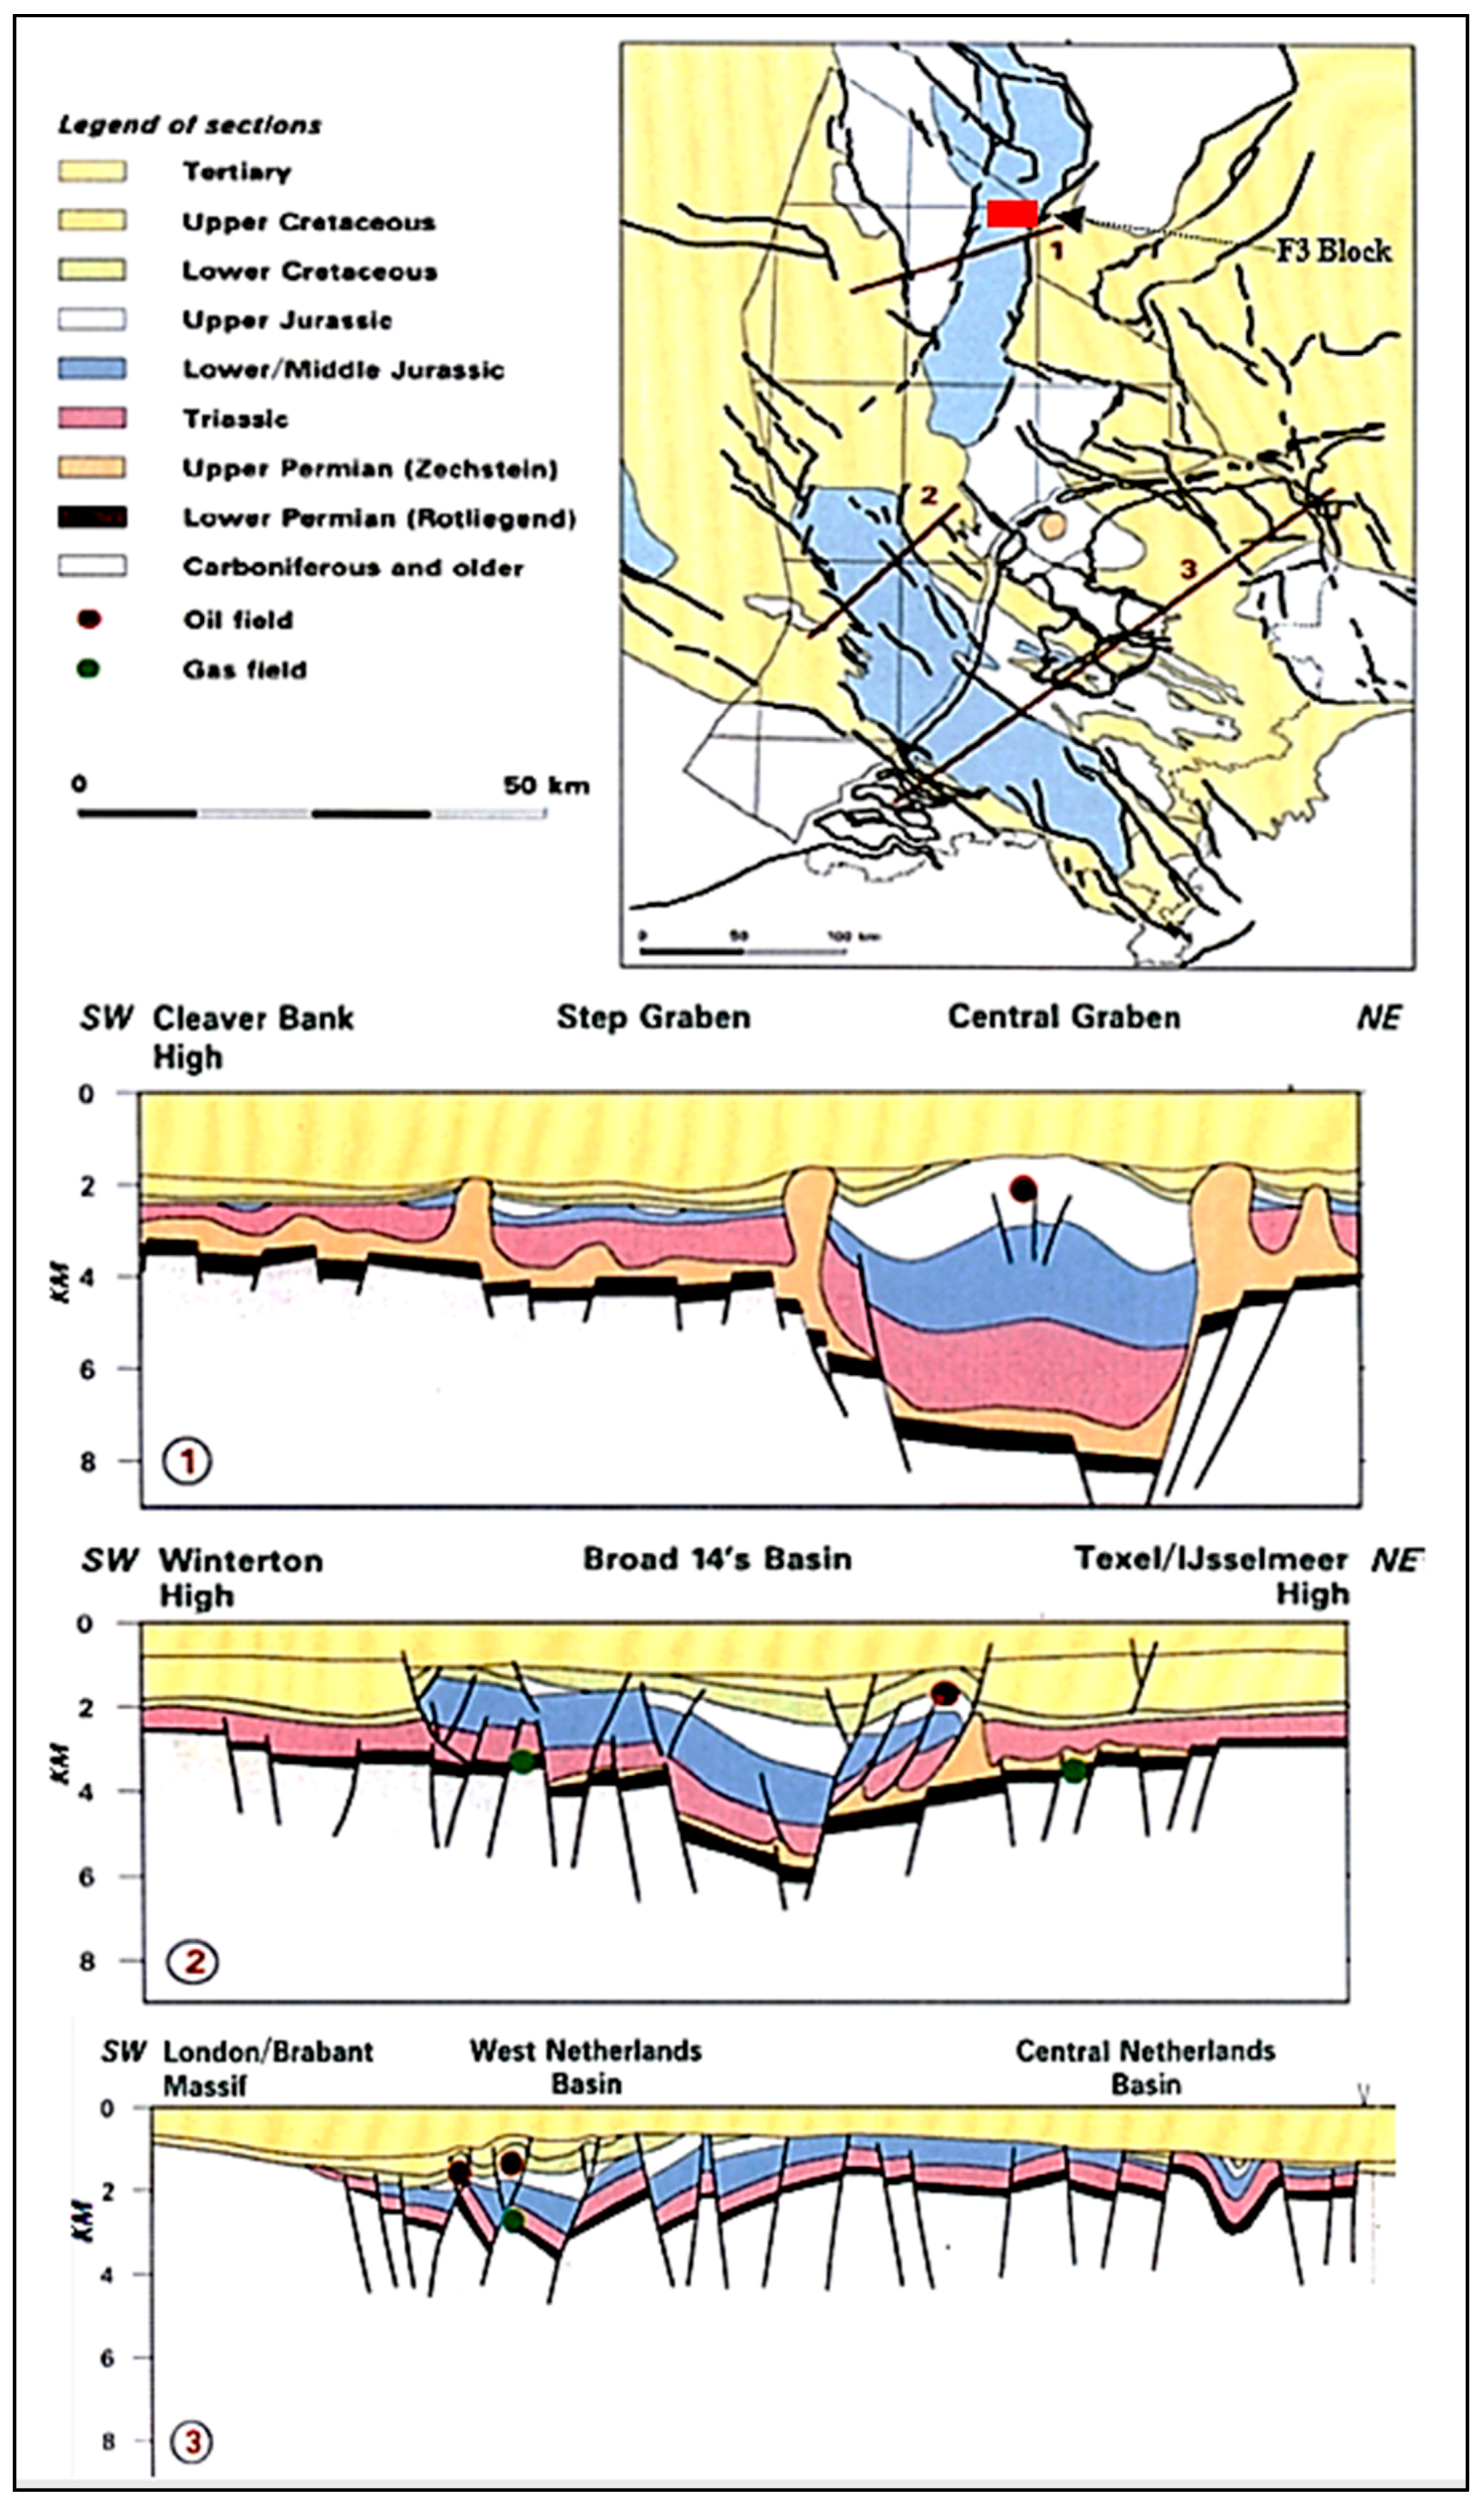
2. Regional Geological Setting

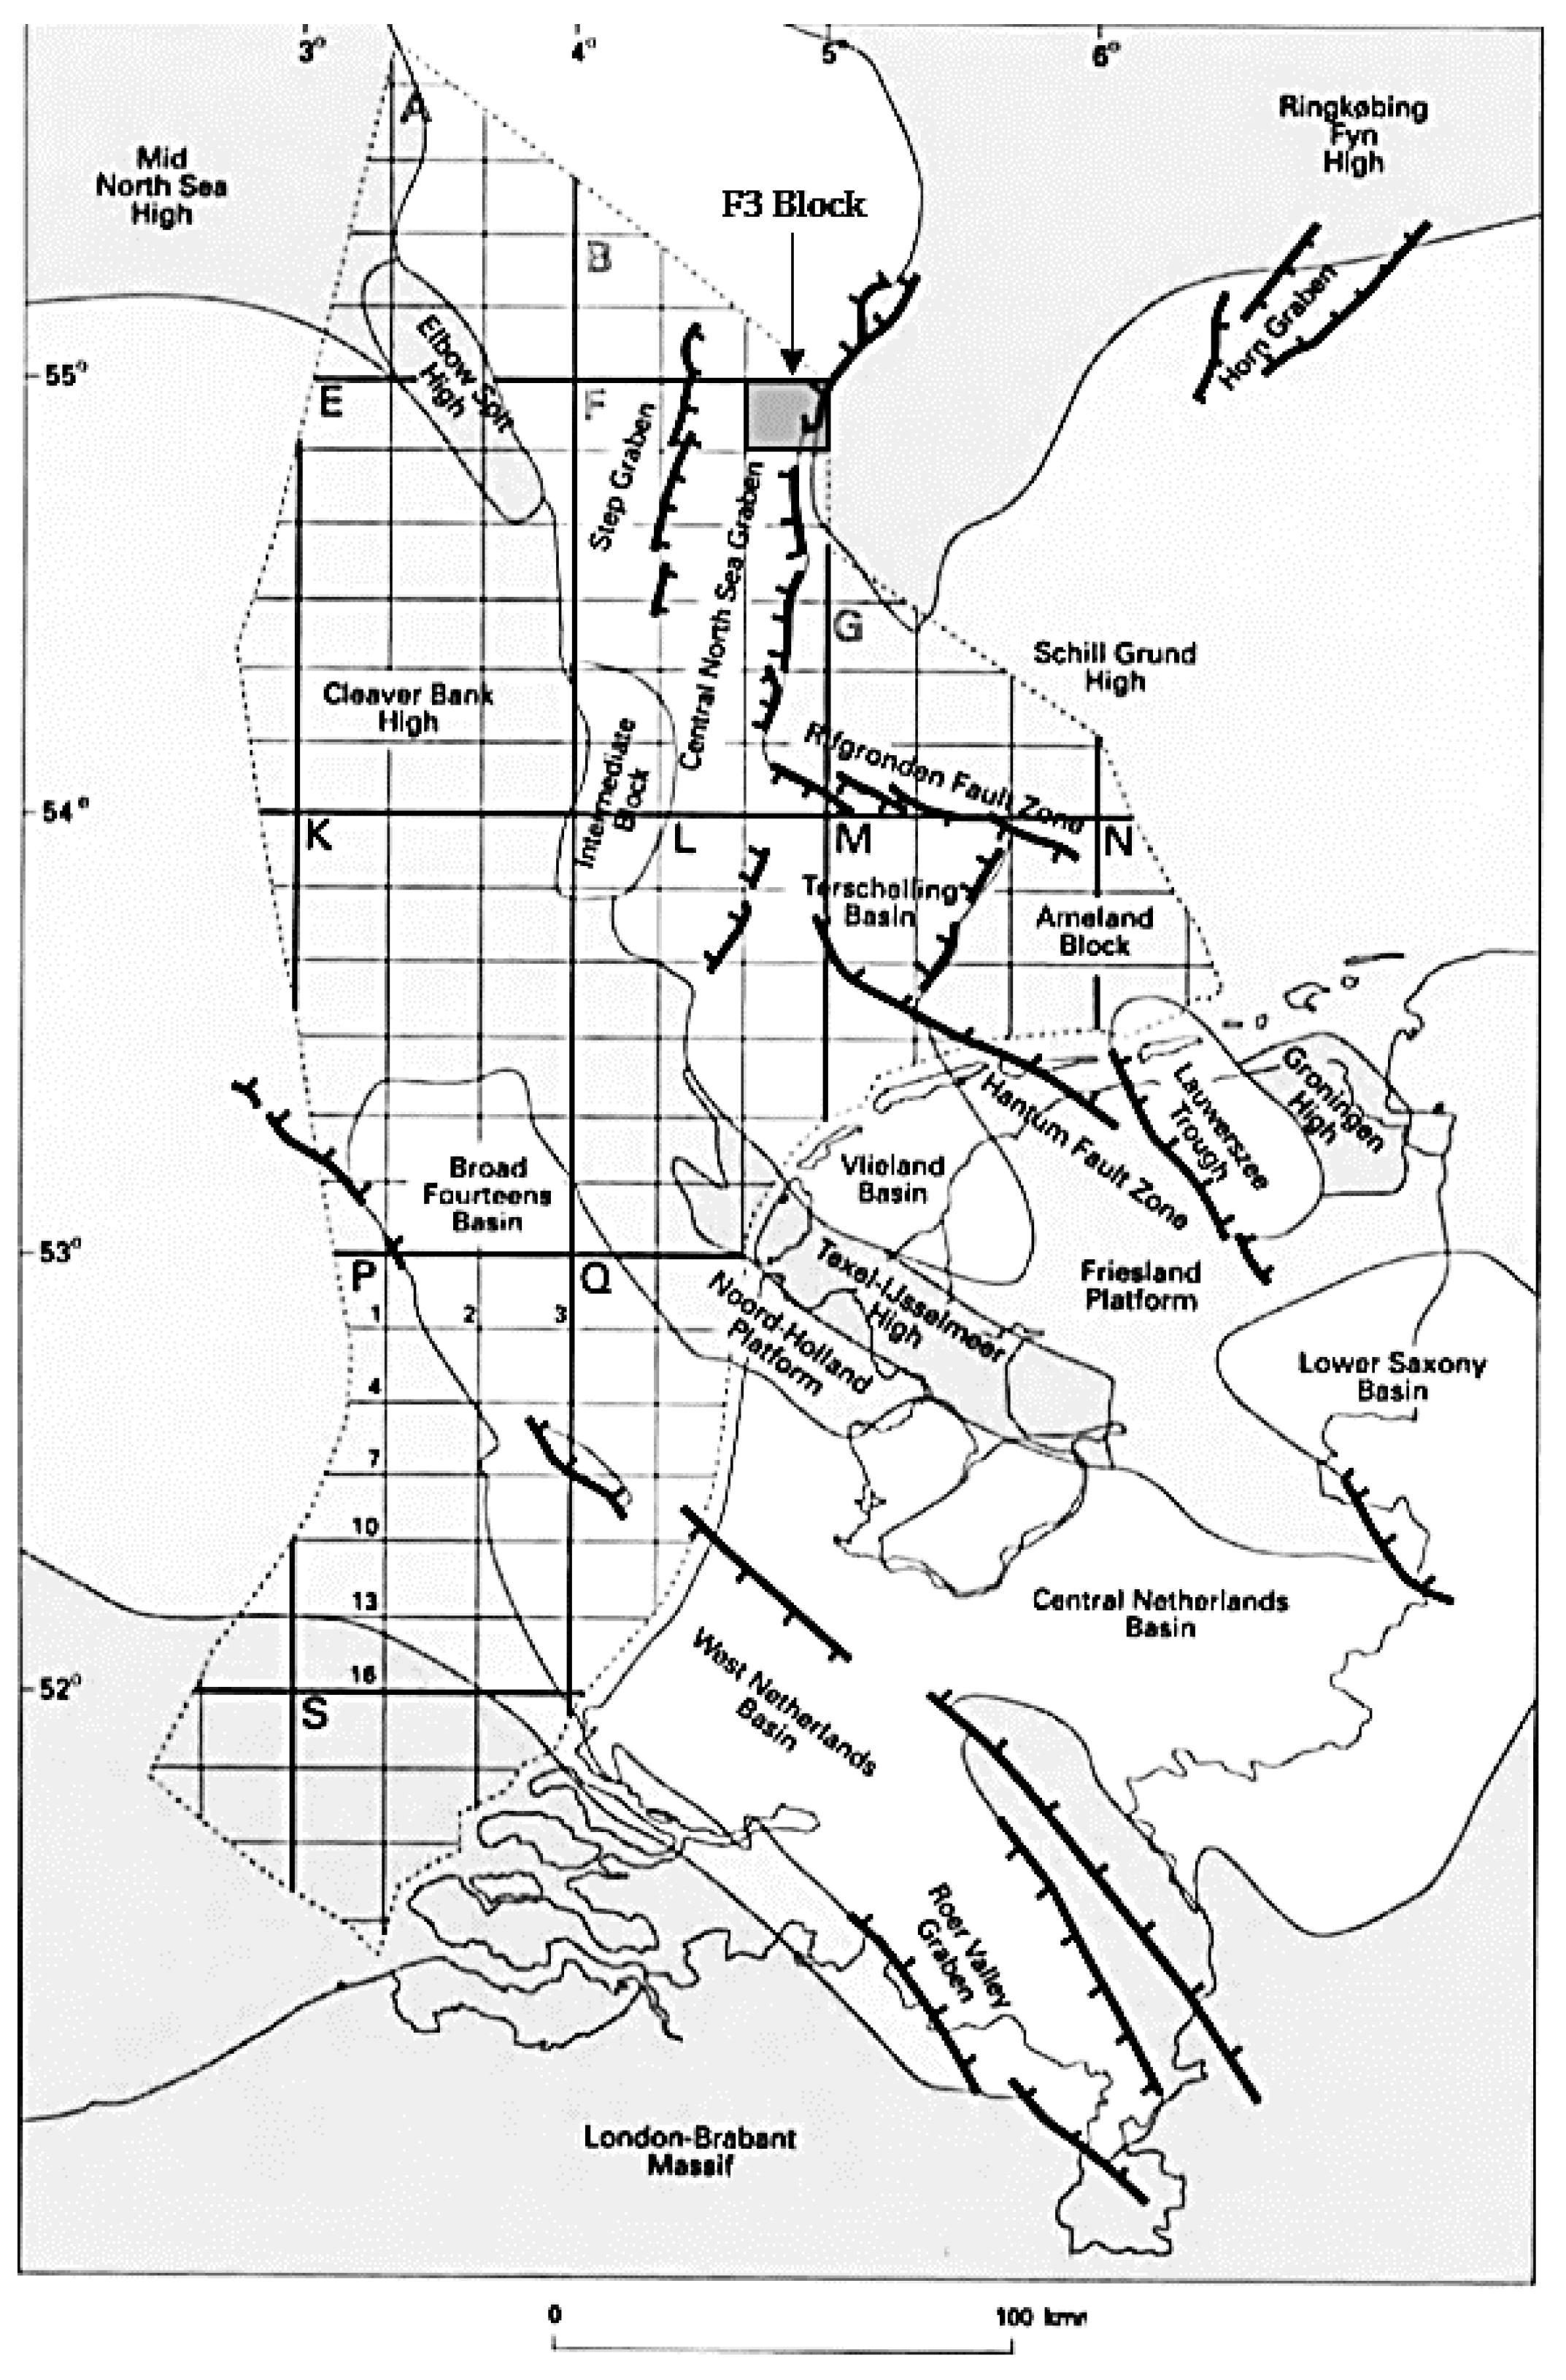
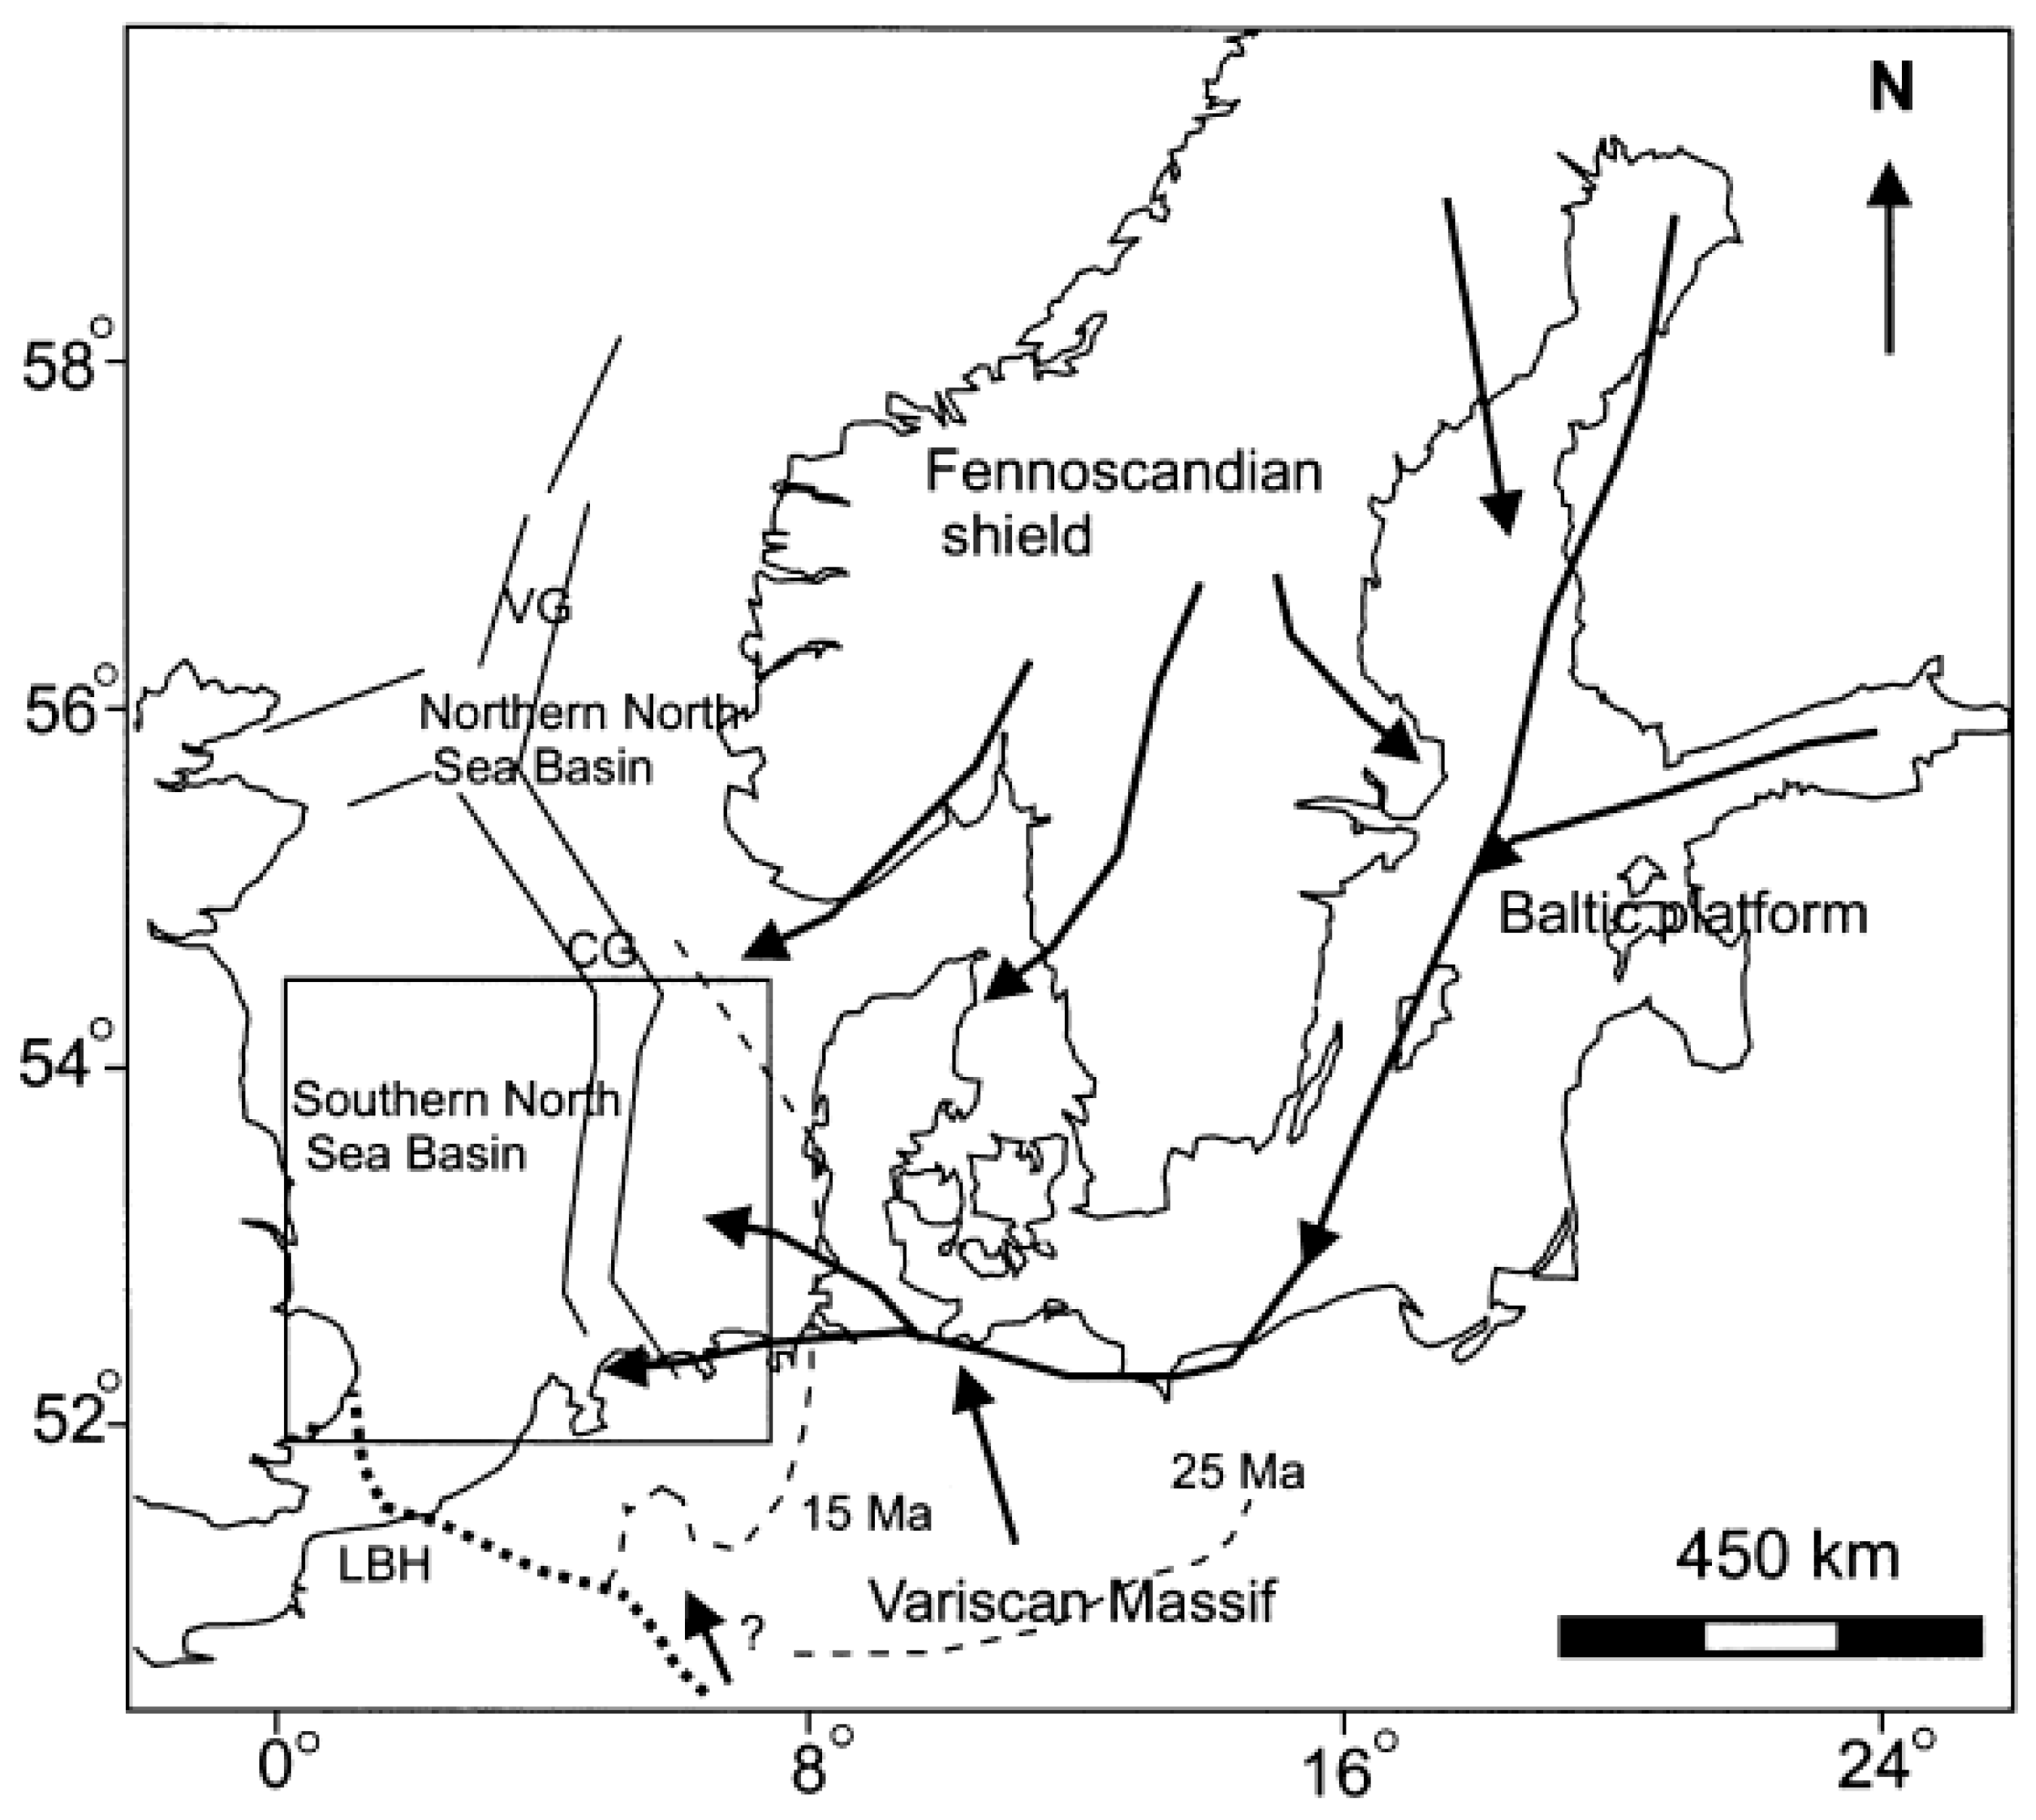
2.1. Tectonic Framework

The development of the Eridanos delta system is a result of simultaneous episodes of uplift of the Fennoscandian Shield and the subsidence of the North Sea Basin [18] (see Figure 2). It is believed that the uplift of the Fennoscandian Shield started during the Oligocene. The uplift rate increased during the late Miocene [19] and further uplift activity in the early Pliocene has also been suggested by other researchers [20,21]. Previous studies [19,22,23,24] suggested that a total uplift amounting to 3000 m occurred in the central part of the dome in northern Norway and about 1000–1500 m more to the south. The hinge zone, which is along the western Scandinavian margin, was relatively narrow and a 600 m differential uplift occurred over a distance of less than 100 km [25,26,27]. The Eridanos deltaic system started during the Oligocene period while the Scandinavian Shield was being uplifted, resulting in the development of a siliciclastic delta system [18]. High sedimentation influx filled the northern North Sea region of the Dutch sector as a result of the late Miocene uplift [28]. The increasing sediment load resulted in a differential load throughout the region which caused the underlying Permian Zechstein salt to start moving and several localized unconformities underlain by salt domes were formed within the Pliocene interval [29]. These unconformities were often sub-aerially exposed in the southern North Sea causing the topset beds of some clinoforms to be vulnerable to erosional activity.
The Cenozoic succession of the Eridanos fluvio-deltaic system can be subdivided into two main packages: the Lower and Upper packages separated by a major unconformity called the Mid-Miocene Unconformity [30]. The Lower package mainly comprises of relatively fine-grained gradational Paleogene sediments. The Upper package mainly comprises of a coarse-grained Neogene sediment and most of it is part of a progradational deltaic sequence that could be further subdivided into three units corresponding to the three phases of delta evolution shown as Unit 1, 2, and 3 on Figure 3. The age of the downlap onto the MMU becomes gradually younger towards the central part of the North Sea. The estimated ages are believed to be 12.4 Ma in the Danish sector [31,32], and 10.7 Ma in the German sector [33]. The downdip prograding units are overlain by thick distinctive units between 100 m and 300 m which represent the delta-top facies [28]. The dominant direction of progradation is towards the west-southwest direction [34]. The progradation configuration is expressed as sigmoidal lineaments or clinoforms in the dip section [34]. Figure 4 shows the regional cross-section and structural framework of the North Sea region.

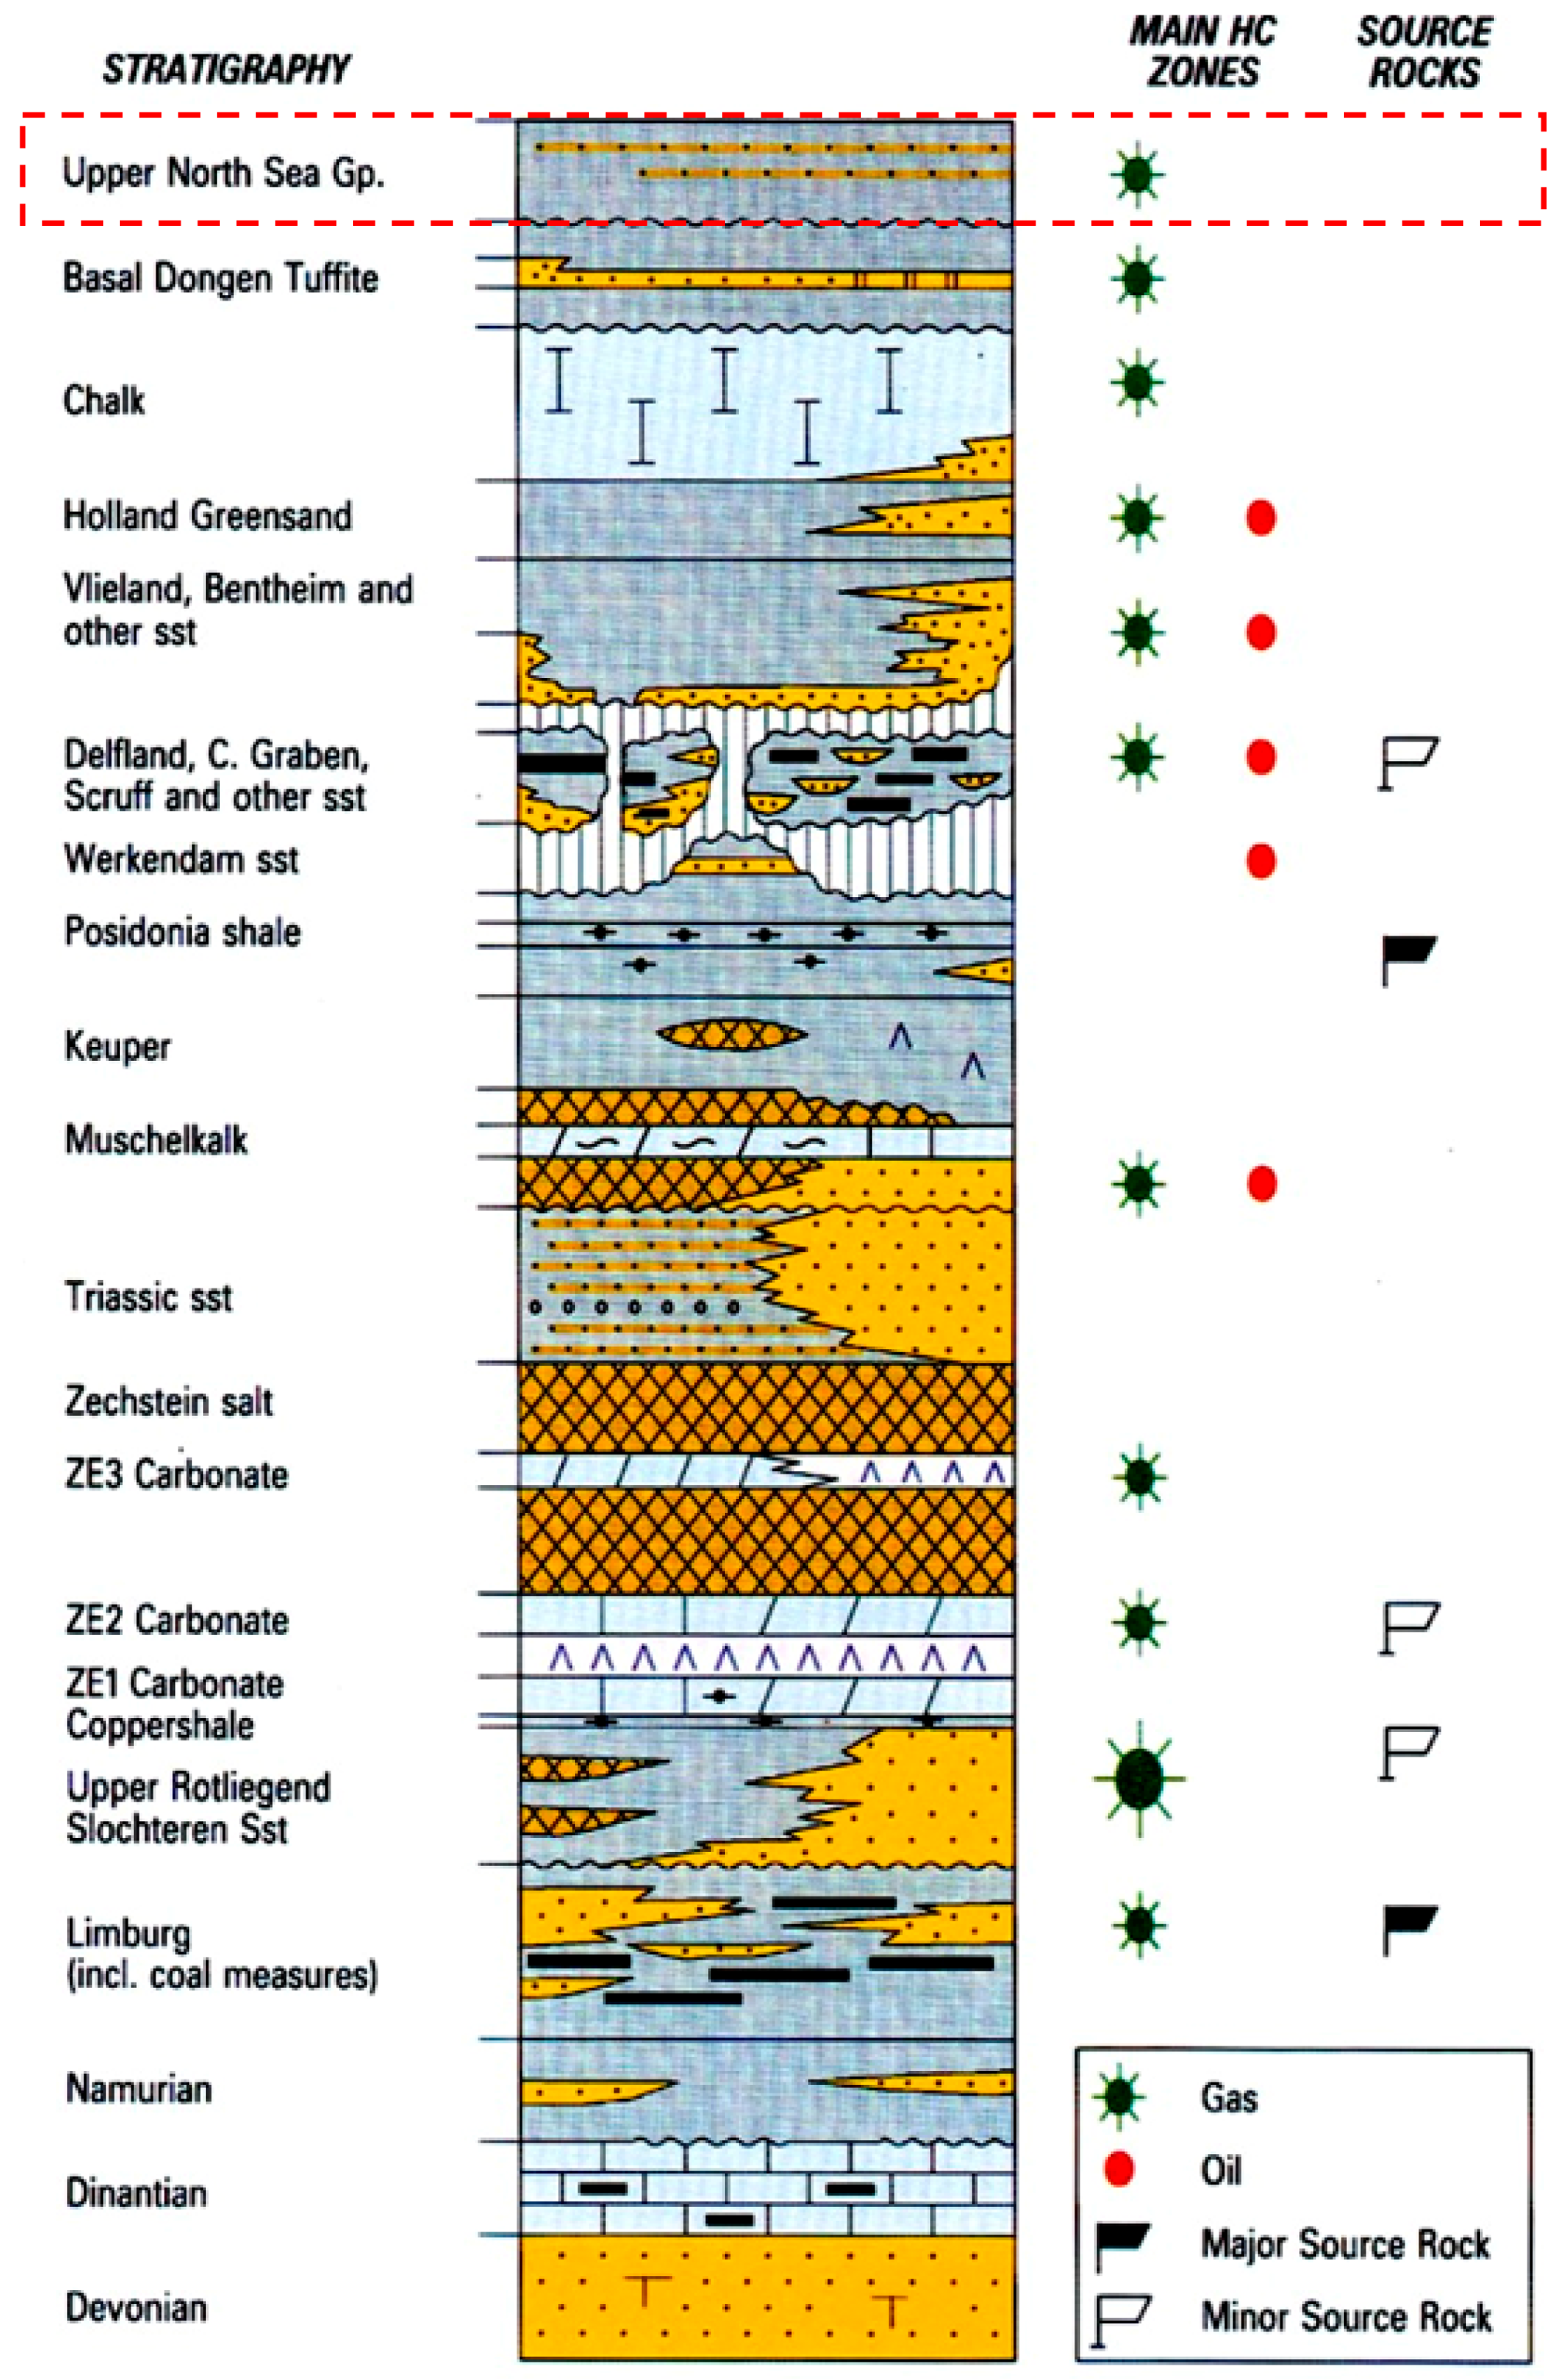
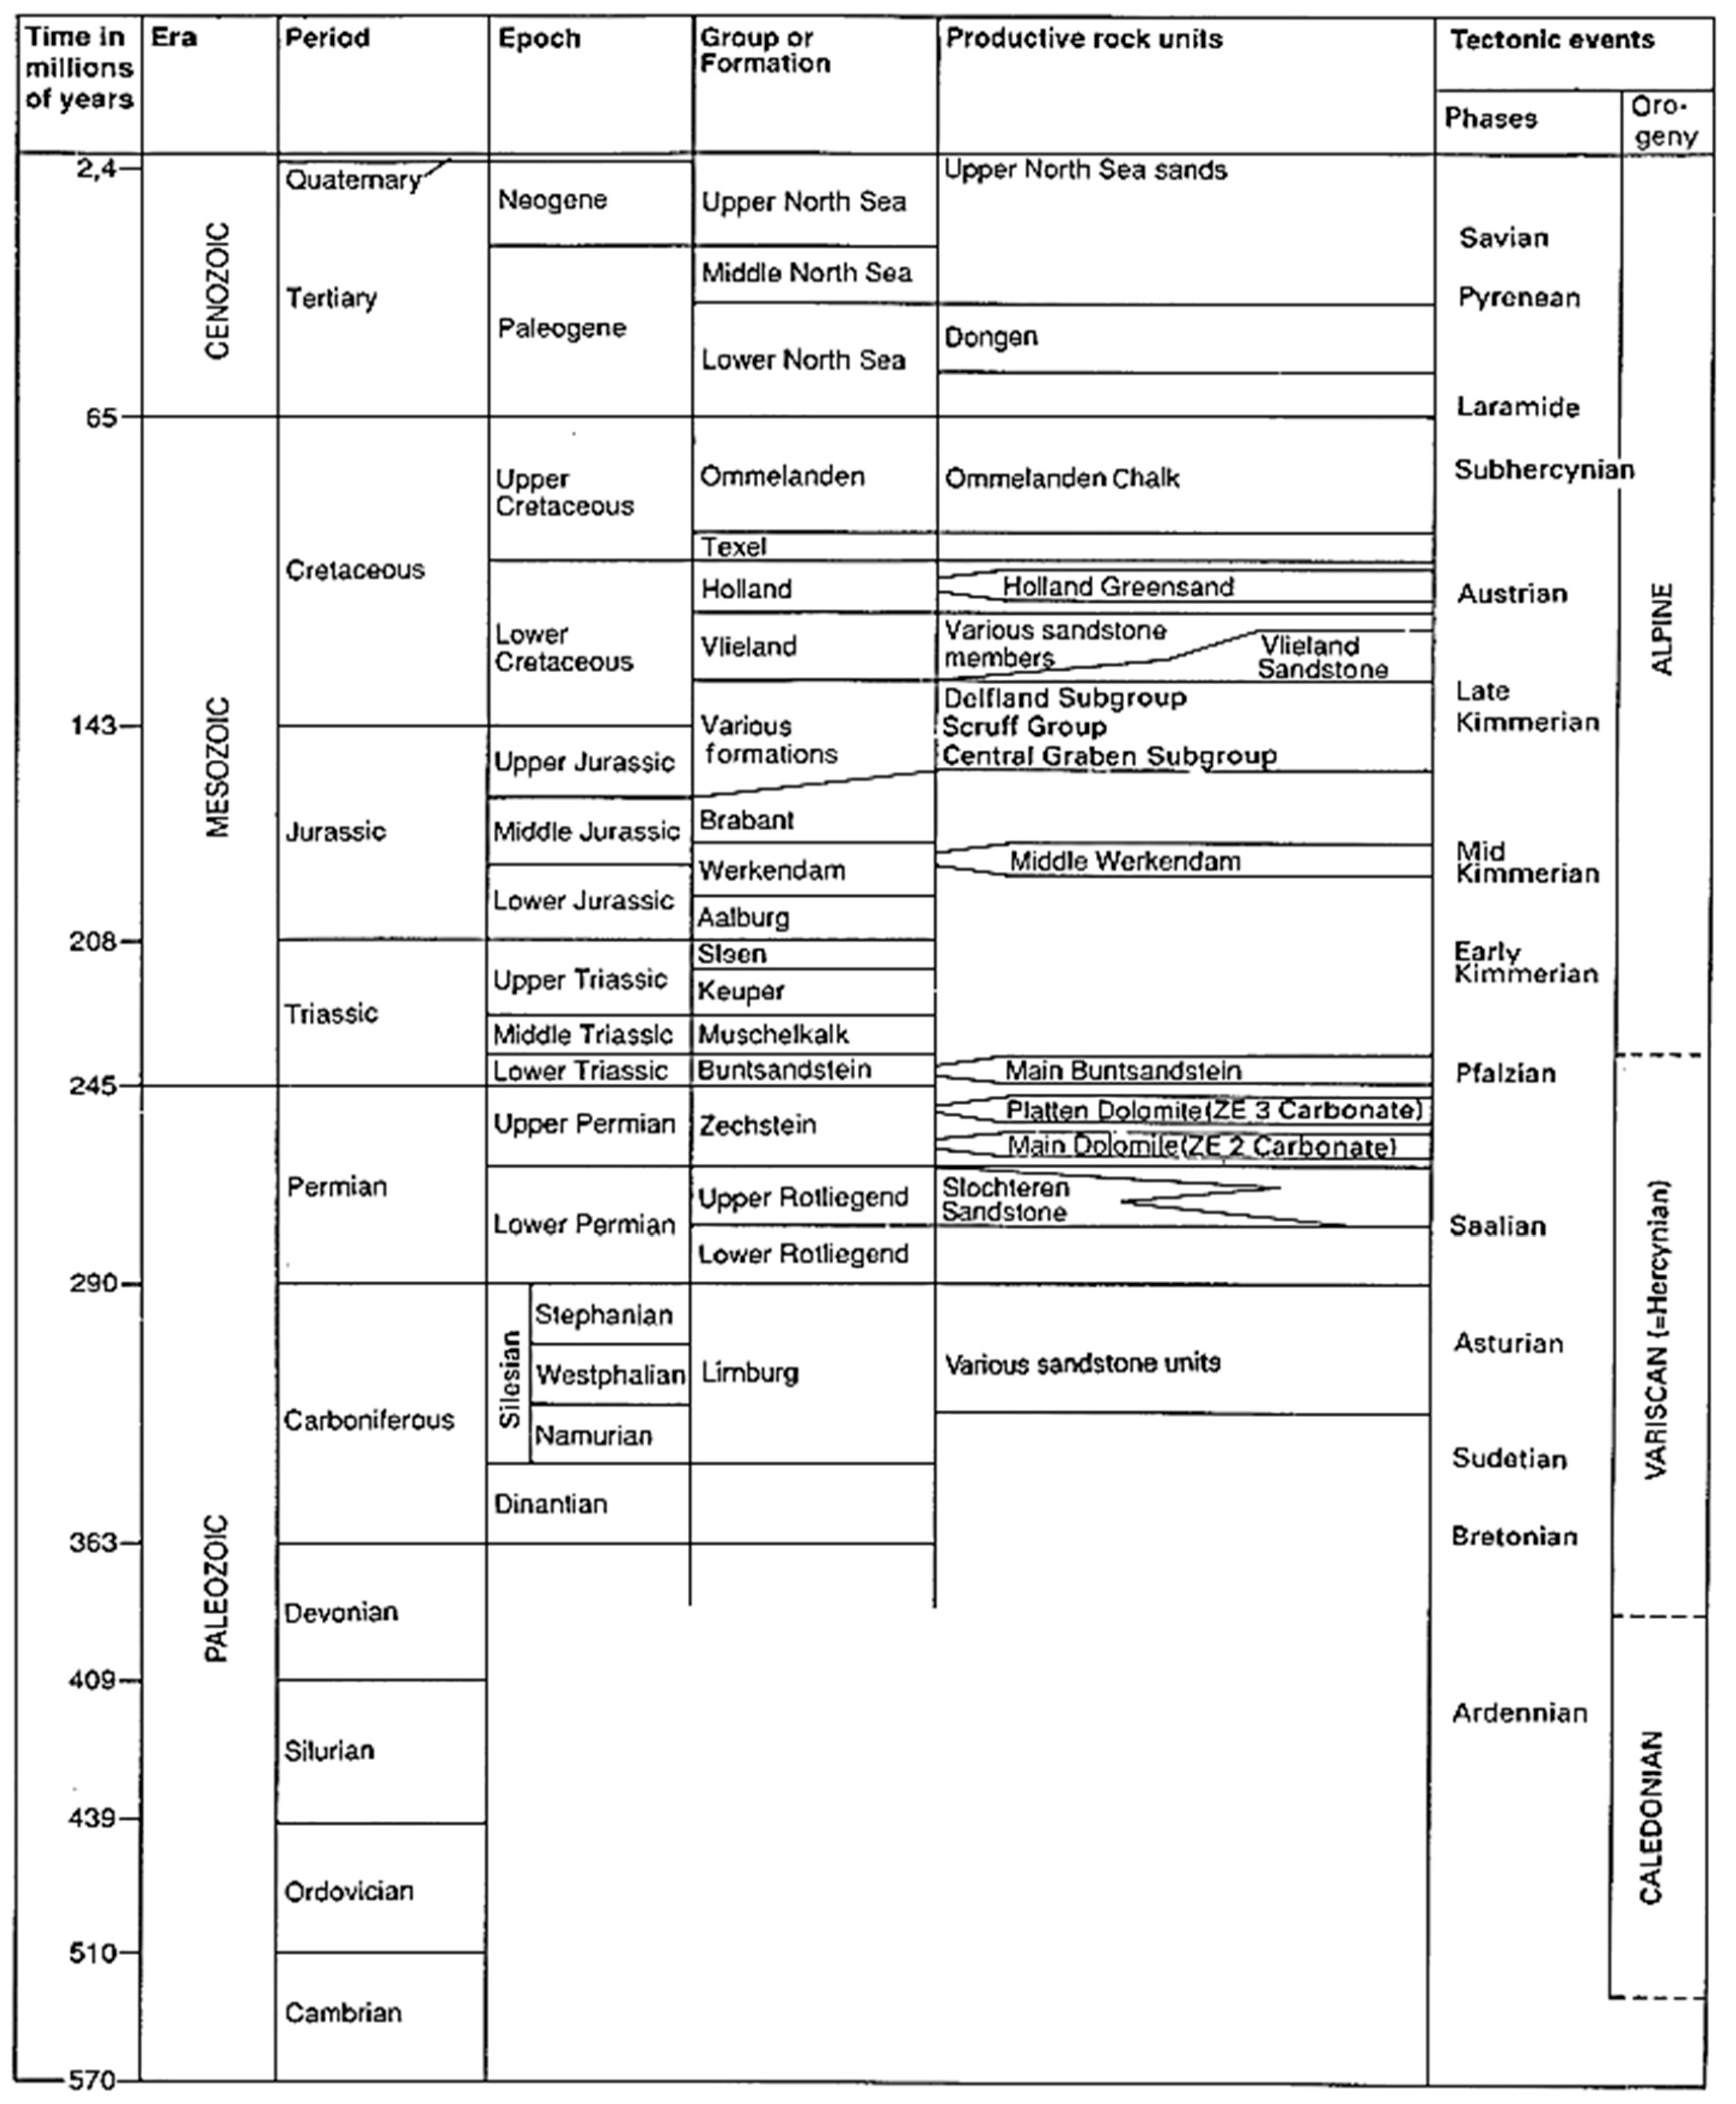
2.2. The Stratigraphy of the North Sea Basin

The Netherlands is predominantly known as a gas producing country with the majority of its onshore and offshore gas fields coming from the Carboniferous coal source rock (Figure 1). The sandstones of the Lower Permian Rotliegend formation forms excellent reservoirs sealed by the Upper Permian Zechstein carbonate and salt formations (Figure 5 and Figure 6) [40]. The stratigraphy of the North Sea can be viewed in three geological eras, the Paleozoic, Mesozoic, and Cenozoic. The present study focuses on the rock formation called the North Sea Group, assembled during the Tertiary and Quaternary period. The North Sea Group can be divided into three sub-formations: the Lower North Sea (Paleogene), the Middle North Sea (Paleogene), and Upper North Sea (Neogene).
The Lower North Sea Group essentially consists of grey sands, sandstones, and clays and is a product of several small and large scale clastic sedimentation cycles in a marine setting at the edge of the North Sea Basin. The upper boundary of this group is characterized by unconformably overlying deposits of the Middle North Sea Group or younger units, while the lower boundary is characterized by an unconformity expressed as a sharp lithologic break marking the top of the Chalk Group. The overall depositional setting of this group is predominantly marine [41].
The Middle North Sea is a group of formations consisting of sands, silts, and clays with the main sand distribution along the southern margin of the North Sea Basin. The depositional setting of this group is interpreted predominantly as marine with some lagoon and coastal plain sediments [41].
The Upper North Sea Group is interpreted as a sequence of clays and fine-grained to coarse-grained sands with gravel, peat, and brown coal seams. The general trend from coarse- to fine-grained sands is observed towards the north and west region of the North Sea Basin. The lower boundary of this sub-group is the Middle North Sea group and other older beds, and the upper boundary is overlain by the present land surface or seafloor. The overall depositional setting is interpreted as shallow marine settings and terrestrial beds of a fluvial and lacustrine origin. The uppermost portion of this group may contain glacial deposits [41].

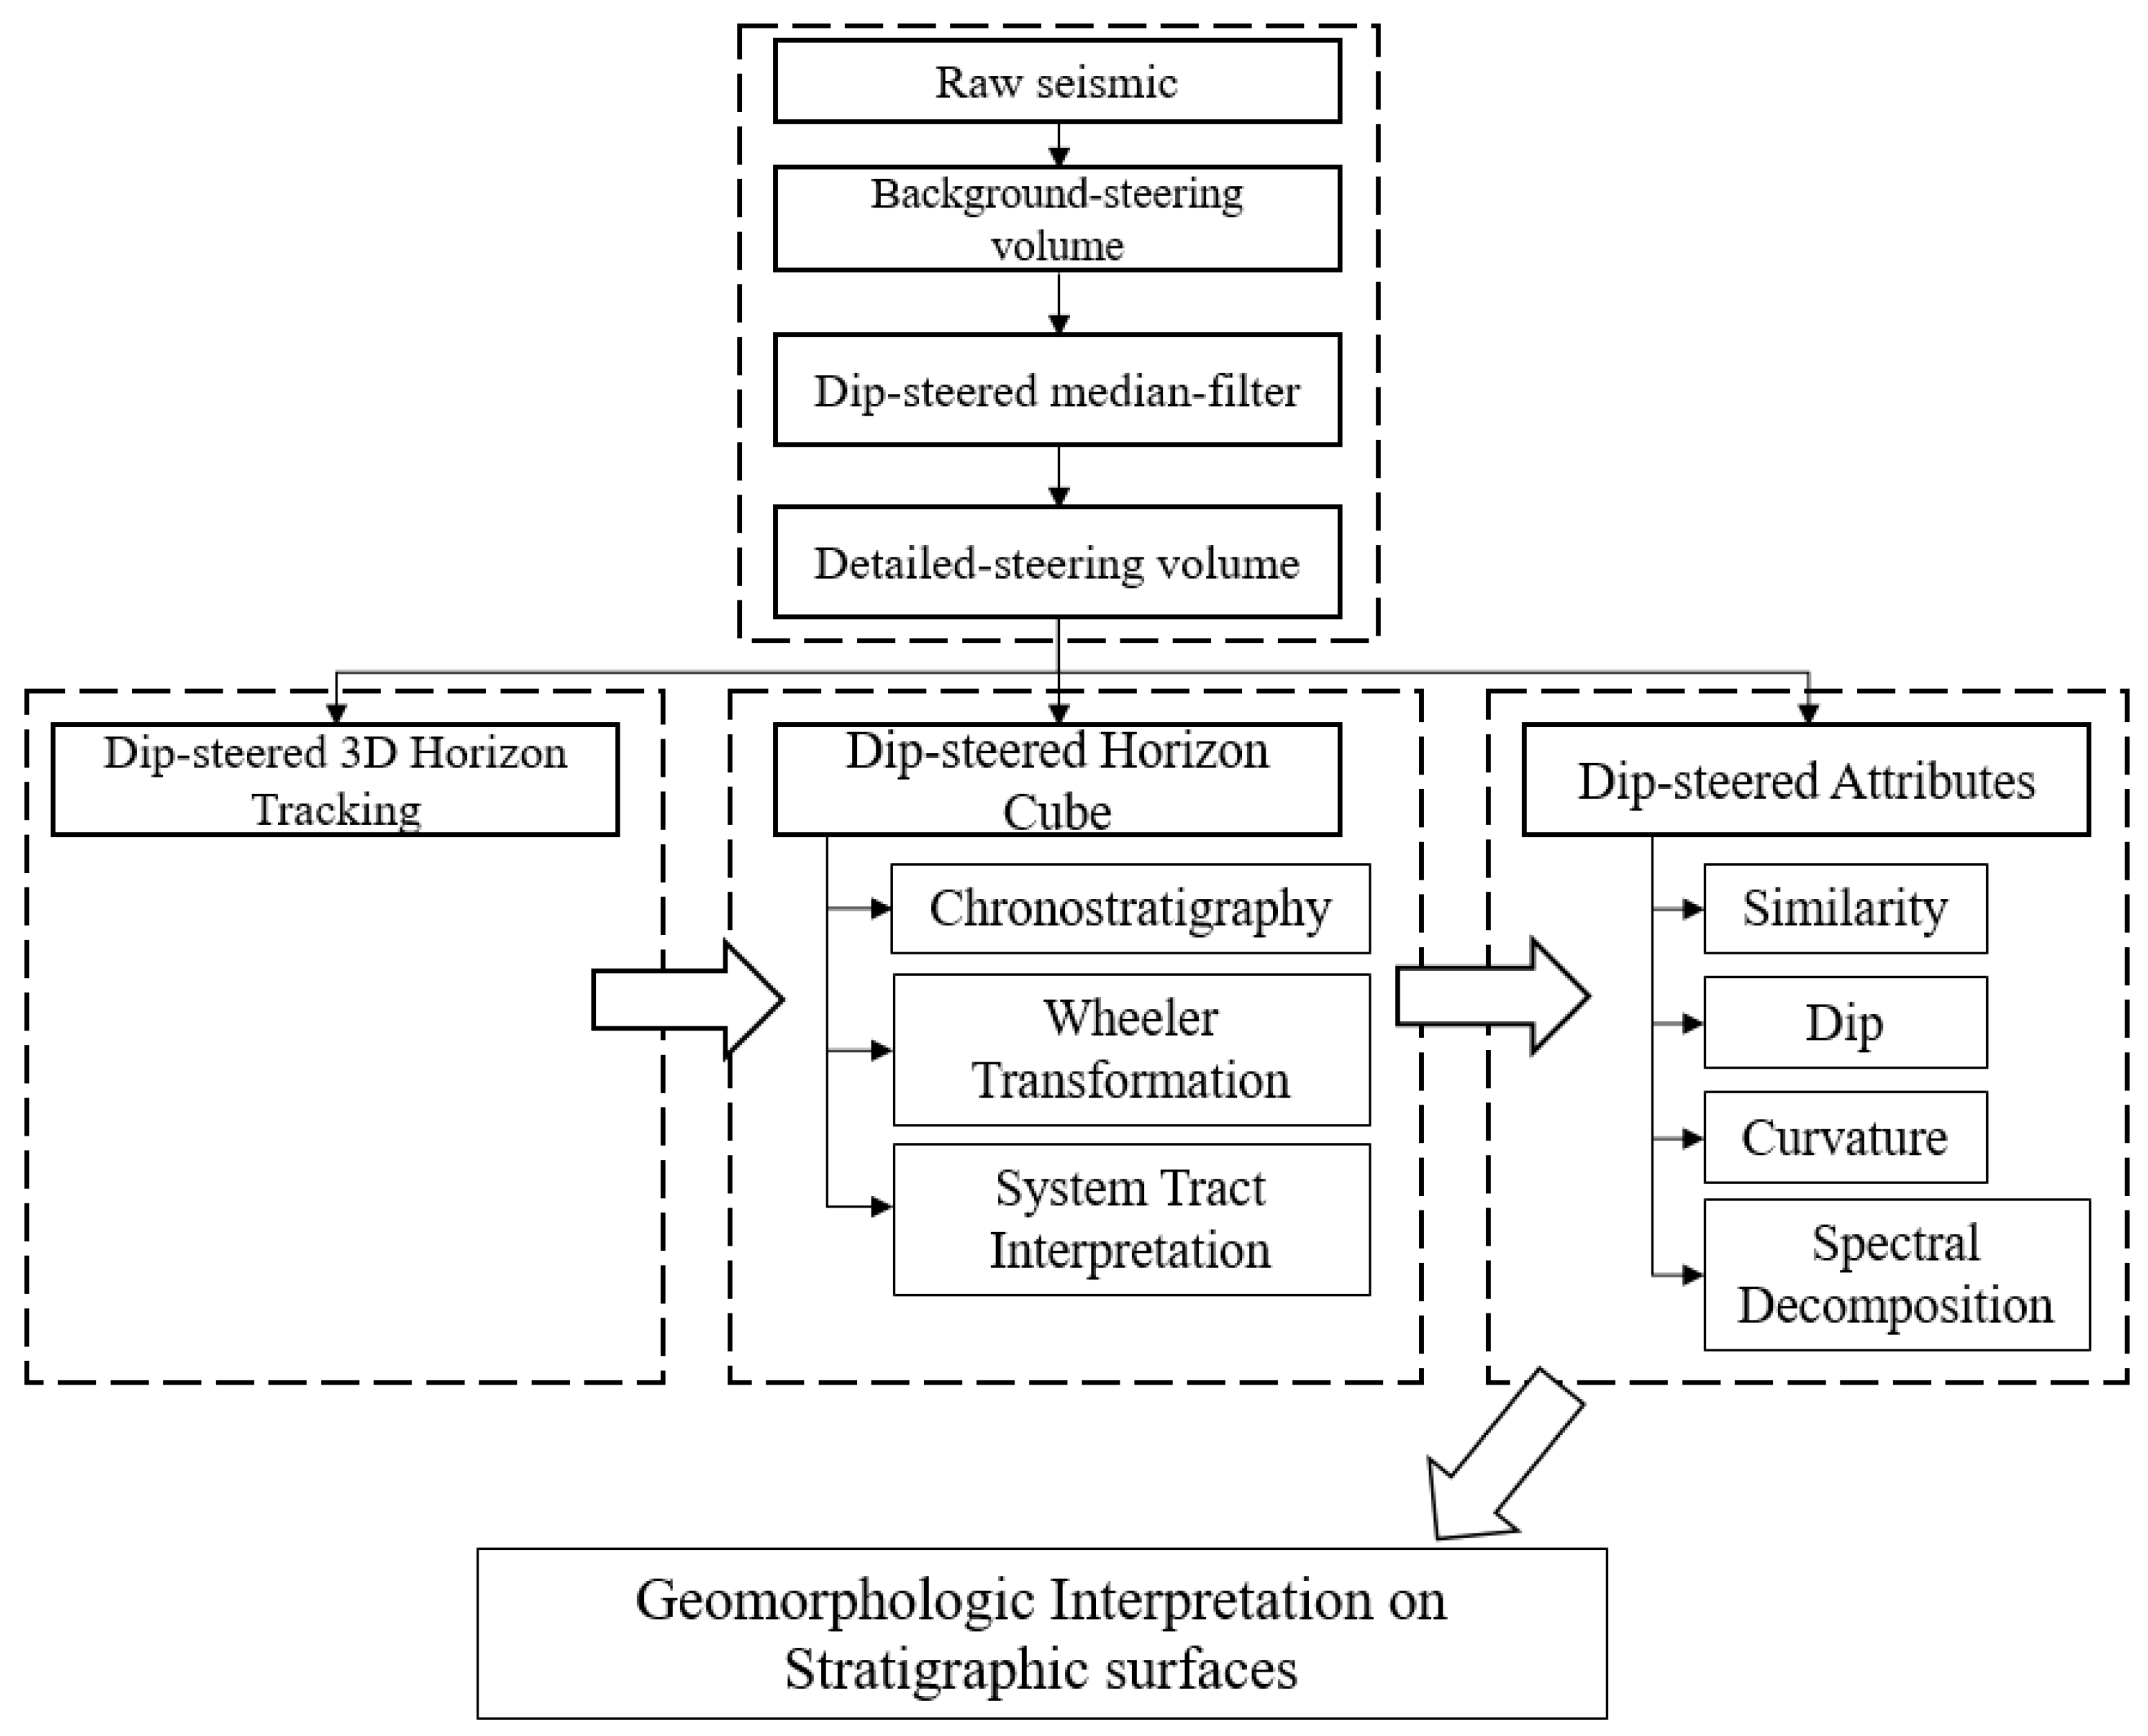
3. Data and Methodology

The high quality raw 3D seismic data acquired from block F3 located in the North Sea Offshore of Netherlands is used for this study. The 3D seismic survey covered an area of approximately 24 × 16 km2. The data volume consists of 650 inlines and 950 crosslines and the line spacing for both is 25 m with a 4 ms sample rate. The seismic data volume was loaded into an open-source geological modeling and interpretative tool; in this case the OpendTect software. The dataset also consists of four wells with relevant log data available, in particular well logs of gamma ray, caliper, P-wave, density, and porosity in true vertical depth. Both seismic and well data, as well as the software, was provided by dGB Earth Sciences through its open source seismic repository portal. An integrated approach was used to achieve the aim of the study and Figure 7 shows a brief summary of the workflow.
The very first step in the workflow was to improve the quality of the raw seismic data by increasing the signal to noise ratio and hence suppressing the noise from the data in order to display the preserved geologic signals. There are three [42] different algorithms available in the OpendTect academic version for creating SteeringCubes which are the BG Fast Steering (Gradient Structure Tensor) method, the event-based steering method, and the Fast Fourier Transform (FFT) method. The FFT algorithm is preferred in this study for horizon tracking and HorizonCube processing [11] due to its sensitivity to noise. A dip-steered median filter was applied to the steering cube to solve the noise problem. The steering cube forms the foundation for the structure oriented filtering of seismic volumes, enhancing the multi-trace attributes and eventually generating curvature attributes. These dips can be displayed as overlays on seismic sections. The dip-steering plug-in in OpendTect allows interpreters to improve the multi-trace attributes by extracting attribute input along reflectors. It also helps with the calculation of some unique attributes such as curvature, similarity, and variance of the dip and also with the interpretation of single horizons or multi-zones through the dip-steered auto-tracking technique. There are many different types of SteeringCube that can be calculated in OpendTect and each of them has their own advantages and applications. In this study, the detailed dip-steered SteeringCube is preferred as it preserves and contains several important geologic details such as the dip associated faults or sedimentary structures, and hence provides the perfect platform for detailed seismic attribute analysis [11].
Right after conditioning the seismic image, the next step in the workflow is horizon interpretations. Conventional seismic interpretation is a time-consuming process and the geometrical expression of seismic reflectors is qualitatively mapped in time with little or no emphasis on seismic amplitude variations [43]. The dip-steered 3D auto tracker [9] in OpendTect allows multiple horizon interpretations in a short period of time. Eight horizons were auto-tracked and interpreted pertaining to the region of interests which will later act as a bounding surface for the Sequence Stratigraphic Interpretation System (SSIS).
OpendTect SSIS allows seismic data to be studied in the chronostratigraphic domain where numerous events are auto-tracked per sequence bounded by major horizons created previously. The SSIS plug-in allows for the reconstruction of depositional history using the HorizonCube slider, flattening seismic data in the Wheeler domain and making full system tract interpretations with automatic stratigraphic surface identifications and base-level reconstructions (Figure 8). There are two types of HorizonCube available in OpendTect. The first one is the Continuous HorizonCube where all horizons exist everywhere in the volume. When horizons converge, the density of the horizons increases and this usually tends to happen along unconformities and condensed sections. Continuous events can neither cross nor terminate against other events. The second HorizonCube is called the Truncated HorizonCube where chronostratigraphic events terminate against other events when they approach adjacent events closer than a certain user-defined threshold value [11,12,17]. This characteristic is very significant as it incorporates unconformities automatically and reveals depositional hiatuses in the Wheeler domain. In this study, the Continuous HorizonCube was initially created and later converted into a Truncated HorizonCube by following the methodology used by Qayyum et al. [11], de Bruin et al. [10,44], and Brouwer et al. [45] to map major bounding surfaces. Intermediate horizons were auto-tracked with sub-sample accuracy. Two auto-tracked modes are available: data-driven and model-driven. In the data-driven model, the seismic horizons are auto-tracked, following the local dip and azimuth of the seismic events. Thus, it will follow the geometries of seismic reflections and is the preferred mode to construct accurate subsurface models and interpret the seismic data within a geologic framework. In the model-driven approach, the seismic horizons are calculated by interpolation or by adding horizons parallel to the upper or lower bounding surfaces. The model-driven mode is a way of slicing the seismic data relative to the framework horizons.
The next stage in the workflow is to create a Wheeler diagram through 3D automated Wheeler Transformation [46]. Through Wheeler Transformation, the seismic data and attribute volumes were flattened in 3D along the auto-tracked horizons while at the same time, honoring the erosional events and non-depositional hiatuses [10]. By integrating the Wheeler domain and structural domain, we can make a system tract interpretation on multiple 2D sections which will give a full or complete 3D understanding of the system tracts.
The final step of the workflow is attribute analysis. Three attribute analyses were performed, namely the minimum similarity, apparent dip, and maximum curvature attributes. The minimum similarity attribute is known to be useful in highlighting discontinuity of seismic data related to faulting or stratigraphy such as channel edges. In this study, a fully steered similarity attribute is preferred in order to honor the dip-steered HorizonCube which preserves important details such as dip associated faults or sedimentary structures. The time gate used is [−8, 24] ms as this will highlight the geological features below the stratigraphic horizons and eliminate overlapping features above the horizons. The apparent dip attribute is known to be useful in highlighting undulations and incisions on seismic surfaces by calculating the lateral gradient of the geological dip. The advantage of using this attribute is to allow interpreters to analyze structural and stratigraphic features at specific azimuth directions (0–360°). In this study, three azimuth direction were selected: 0°, 45°, and 90°. The default time gate of [−28, 28] ms and a step-out value of (1, 1, 1) is chosen as the input parameters. The maximum curvature attribute defines the maximum bending or curvature of the surface at a specific point orthogonal to the minimum curvature. It is known to be useful in highlighting the channel lateral distribution and delineating the downthrown or upthrown part of a fault block. This attribute was derived from the dip-steered HorizonCube by using the default time gate of [−28, 28] ms, a step-out value of (2, 2, 2) and a constant velocity of 2500 m/s as input parameters. These three seismic attributes were performed on stratigraphic surfaces and interpreted automatically in the previous stages. Table 1 shows the parameter setting used in the filtering and conditioning of the seismic cube in order to calculate the attribute response. Attribute analysis allows us to identify both the structural and stratigraphic features, especially on the dip-steered cube.

4. Results and Discussion

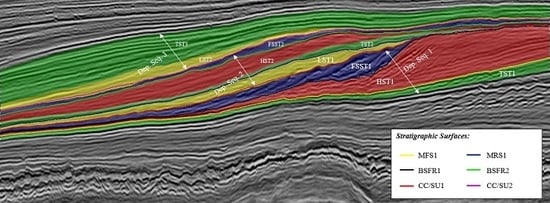
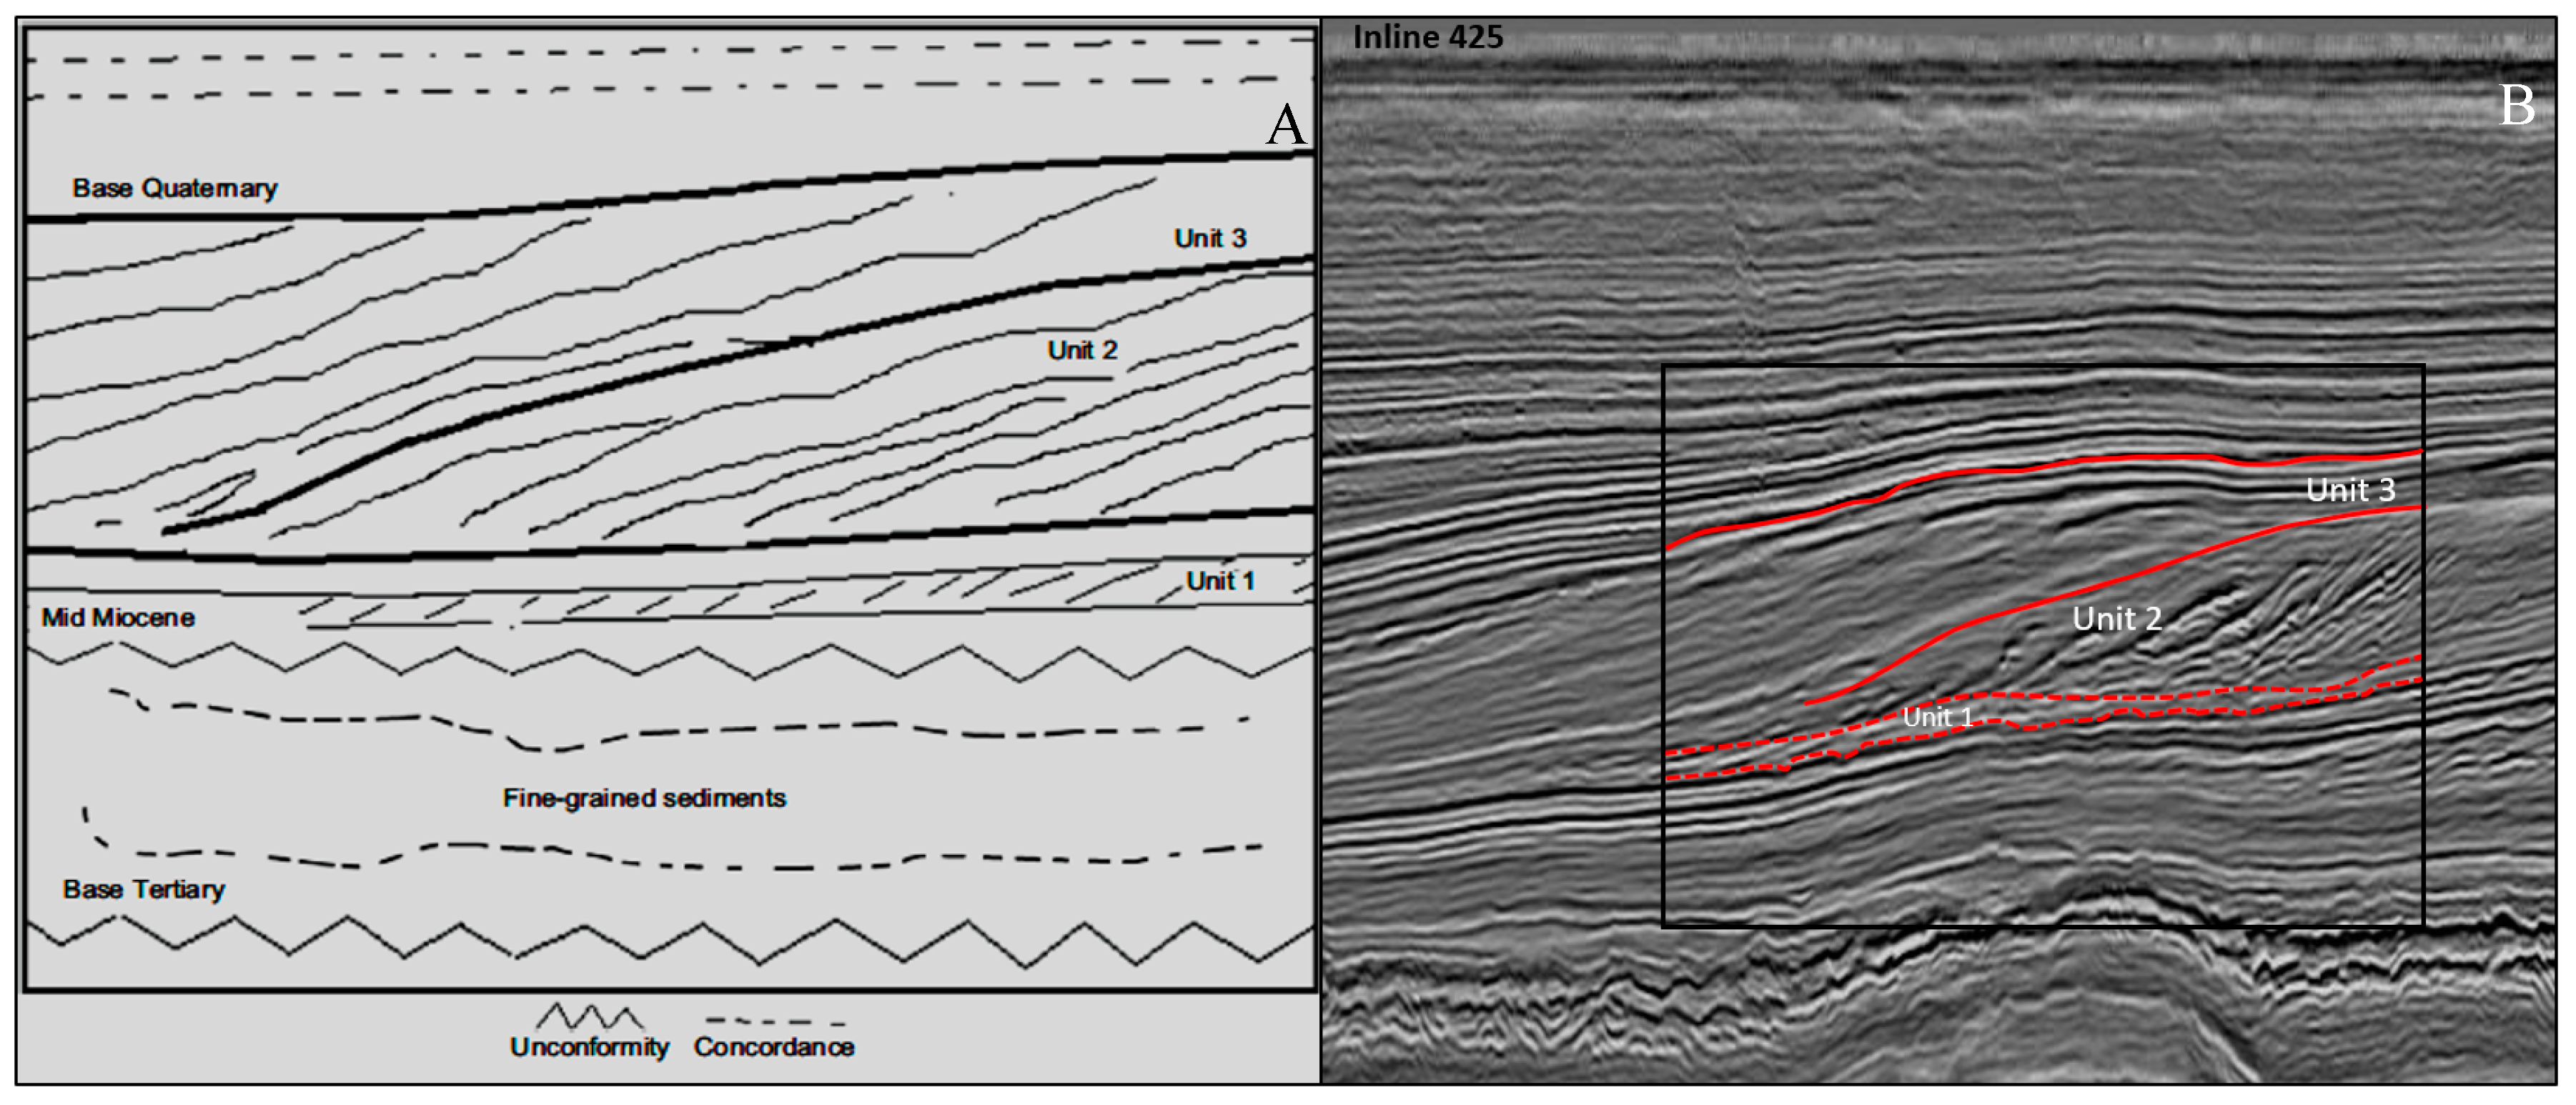
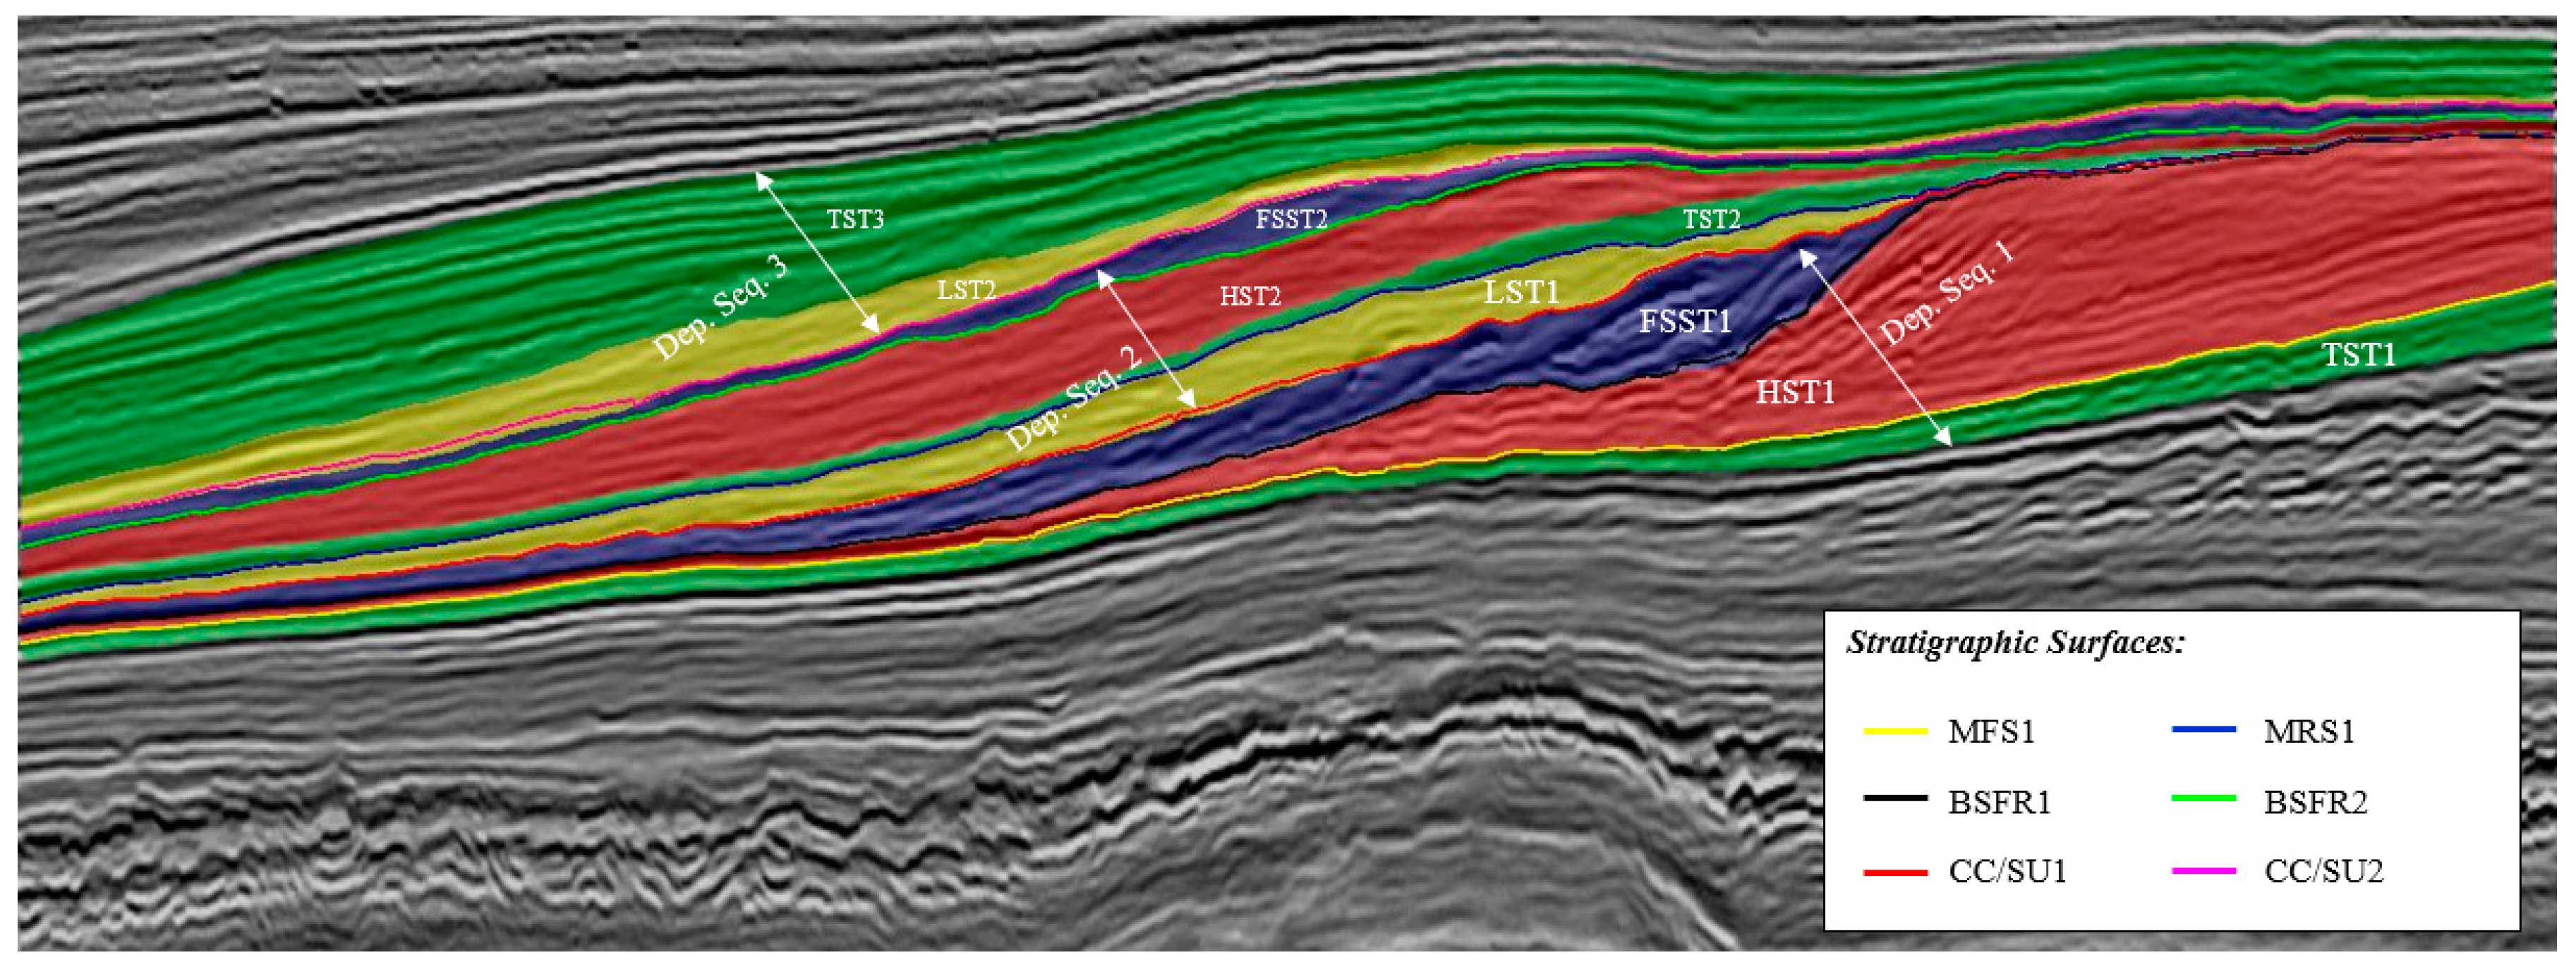
4.1. Sequence Stratigraphic Interpretation

The synchronized analysis in both the structural and Wheeler domains allows the interpretation of system tracts and helps us to define the sequence into a different set of packages. The interpretation was made using a four-systems tract sequence stratigraphic model introduced by Hunt and Tucker [47] termed the Depositional Model IV by Catuneanu [48]. Following the work of Qayyum et al. [11,12,17], the stratigraphic interpretation is made and three depositional sequences are identified (Figure 9). Each sequence has a complete set of packages comprising of the Transgressive System Tract (TST), the Highstand System Tract (HST), the Falling Stage System Tract (FSST), and the Lowstand System Tract (LST). These packages are bounded at the top by its subsequent stratigraphic surfaces, namely the maximum flooding surfaces (MFS), the basal surface force regression (BSFR), the correlative conformity and sub-aerial conformity (CC/SU), and the maximum regressive surface (MRS) respectively. In a normal base-level cycle with a constant magnitude of base level rise and fall, a complete set of packages of TST, HST, FSST, and LST are to be expected. However, in reality, with varying magnitudes of base level rise and fall and unpredictable fluctuations of base level in geologic time, not all packages exist in the same sequence.
In order to achieve the objective of this study (to identify geomorphological changes of stratigraphic surfaces), only the stratigraphic surfaces from the depositional sequence 1 (MFS1, BSFR1, CC/SU1) and MRS1 surface from depositional sequence 2 were considered in this study. Six stratigraphic surfaces were identified and only four are then extracted as seismic horizons from the HorizonCube for attribute analysis. Table 2 shows the stratigraphic surfaces of interest and their corresponding system tract events and depositional sequence.

4.2. Analysis

4.2.1. Similarity

The dip-steered similarity was preferred in the study by using steering data representative of a regional dip which provided high-quality visualization of the seismic trace and better geomorphological interpretations. The similarity attribute was calculated by using user-defined parameters which are based on the quality, frequency, and sampling rate. The time-gate operator determines the desired wavelength of the structures to be detected. In this case, a time gate of −8 ms and +24 ms, which will highlight geological features below the stratigraphic horizons and eliminate overlapping features above the horizons, was used to calculate the similarity of the seismic traces in the data. A step-out of (1, 1, 1) was used for the similarity attribute and this implies that the sampling was taken along every inline and crossline. The step-out defines the radius of investigation in inline, crossline, and time-slice, and also determines the sampling size.
Figure 10 shows the result of similarity attribute analysis performed on each stratigraphic surface. It can be observed that a northwest-southeast trending, parallel and asymmetrical feature presents on each surface. This feature is identified as a sand wave or sediment wave. Sand waves are elongated depositional bed forms with undulating surfaces which are located mainly in transverse or with a small angle to the dominant current direction. Its environment of formation is usually in shallow water, riverbeds, tidal channel, estuaries, and flood tidal deltas. In this case, sand waves give an indication of paleo-water depths and the direction of flow. Sand waves usually form in water with a depth of less than 30 m.
Maximum flooding surface marks the end of the transgressive system tract or the end of the shoreline transgression. Hence an MFS1 surface (Figure 10A) separates the underlying and retrograding transgressive system tract from the prograding highstand system tract which progrades on top of it. The change from retrogradational to overlying progradational stacking patterns take place during continued base level rise at the shoreline. It can be observed from Figure 10A that the sand waves developed landwards while on BSFR1 surfaces (Figure 10B), the field of sand waves has shifted significantly basin-ward as indicated by the position of the paleo-coastline (the yellow dashed line). The highstand system tract is associated with aggradational and progradational sediment deposits where the relative sea level is undergoing a slow rise. The sediment supply is sufficient enough to outpace the sea level rise and hence drive a basin-ward building off the coast [48].
In Figure 10C, it can be observed on the CC/SU1 surface that the sand waves have shifted basin-ward again due to a massive drop in the relative sea level and hence is considered a by-product of forced regression. For MRS1 surfaces (Figure 10D), redevelopment and realignment of the sand waves are observed as the coastline shifted back landward due to relative sea-level rise. The rise in sea-levels causes the sediment deposits to prograde and aggrade. The overall basin- and land-ward shifts of sand waves are in an agreement with the regressive and progressive nature of the system tracts.
Other distinct features that can be observed here are a series of meandering deep water channels with a northeast-southwest flow direction indicated by the blue arrows on Figure 10. The lateral continuity of the deep marine channel is not readily identifiable by the similarity attribute as it does not take into account the true geological dip and curvature of certain geologic features which can be best analyze by using the dip and curvature attributes. Pockmark—a geological feature commonly found in the seabed—can also be seen on each stratigraphic surface. Pockmark can be considered as deep marine craters which are caused by biogenic gas and liquid escaping or a dewatering event which is very common in the North Sea region [49]. Overall, similar observations were made in the Niger Delta [1,15] regarding the application of similarity attributes in interpreting seismic and sub-seismic scale structural and stratigraphic features.

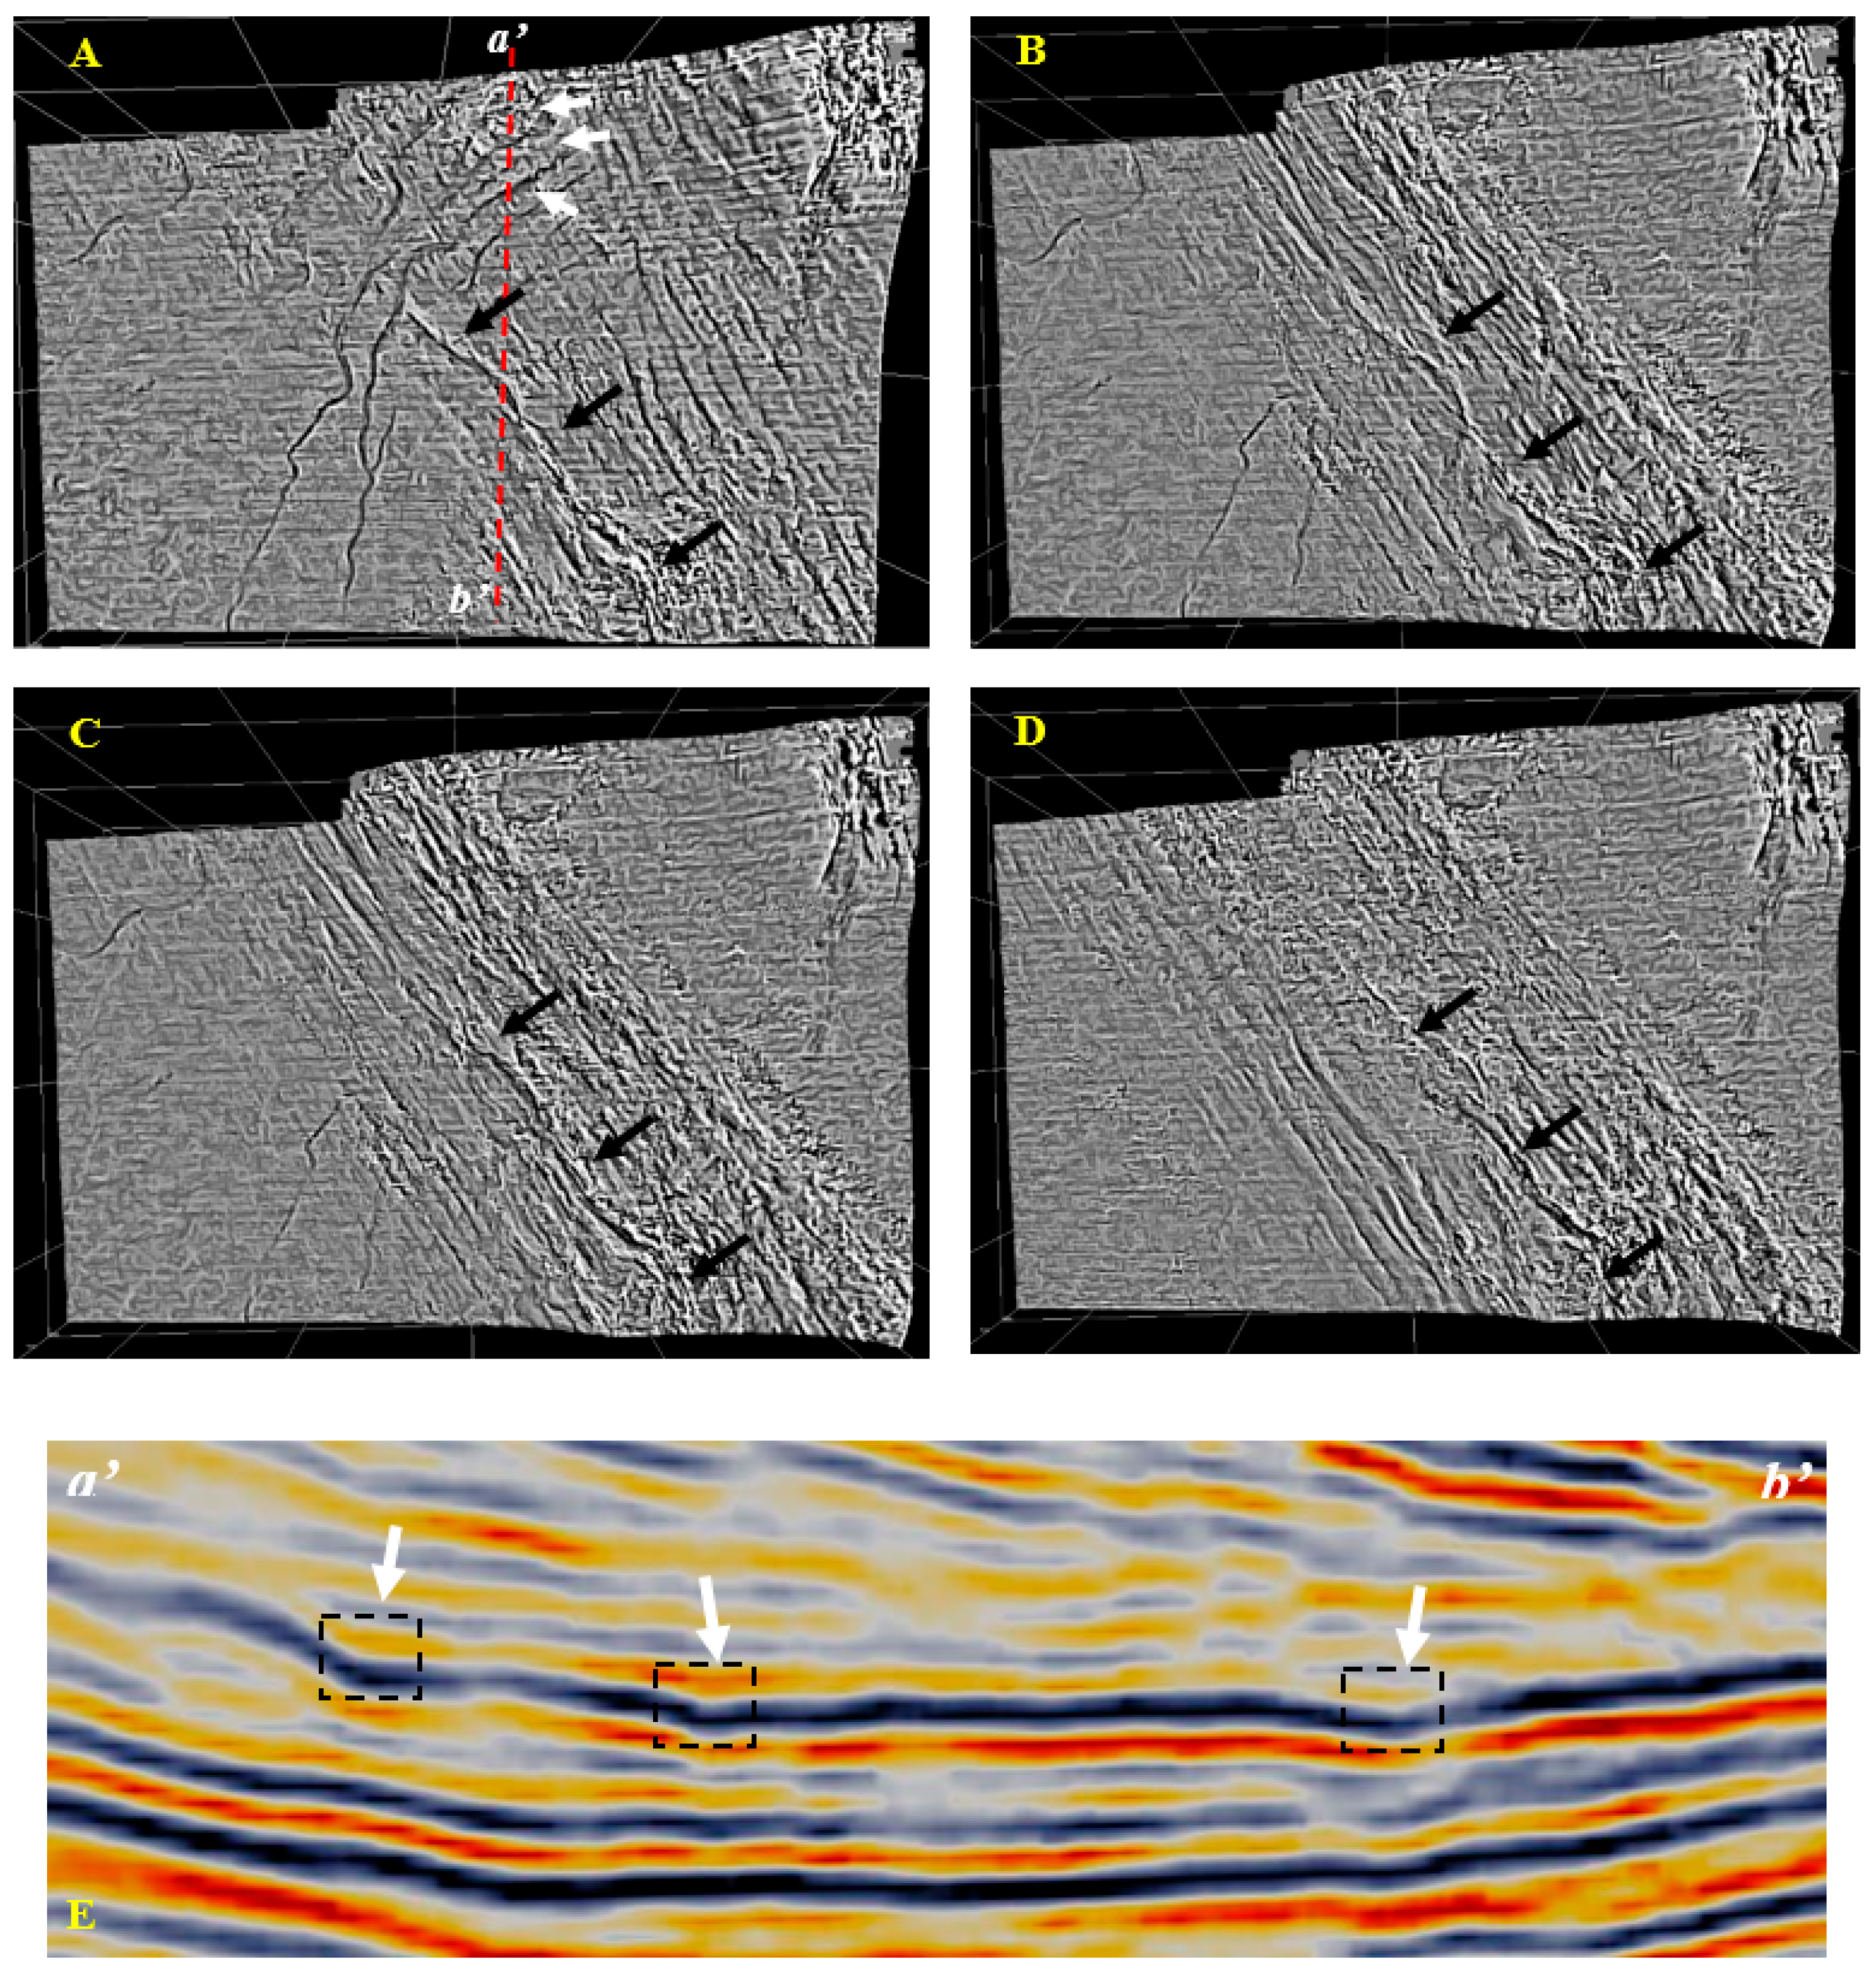
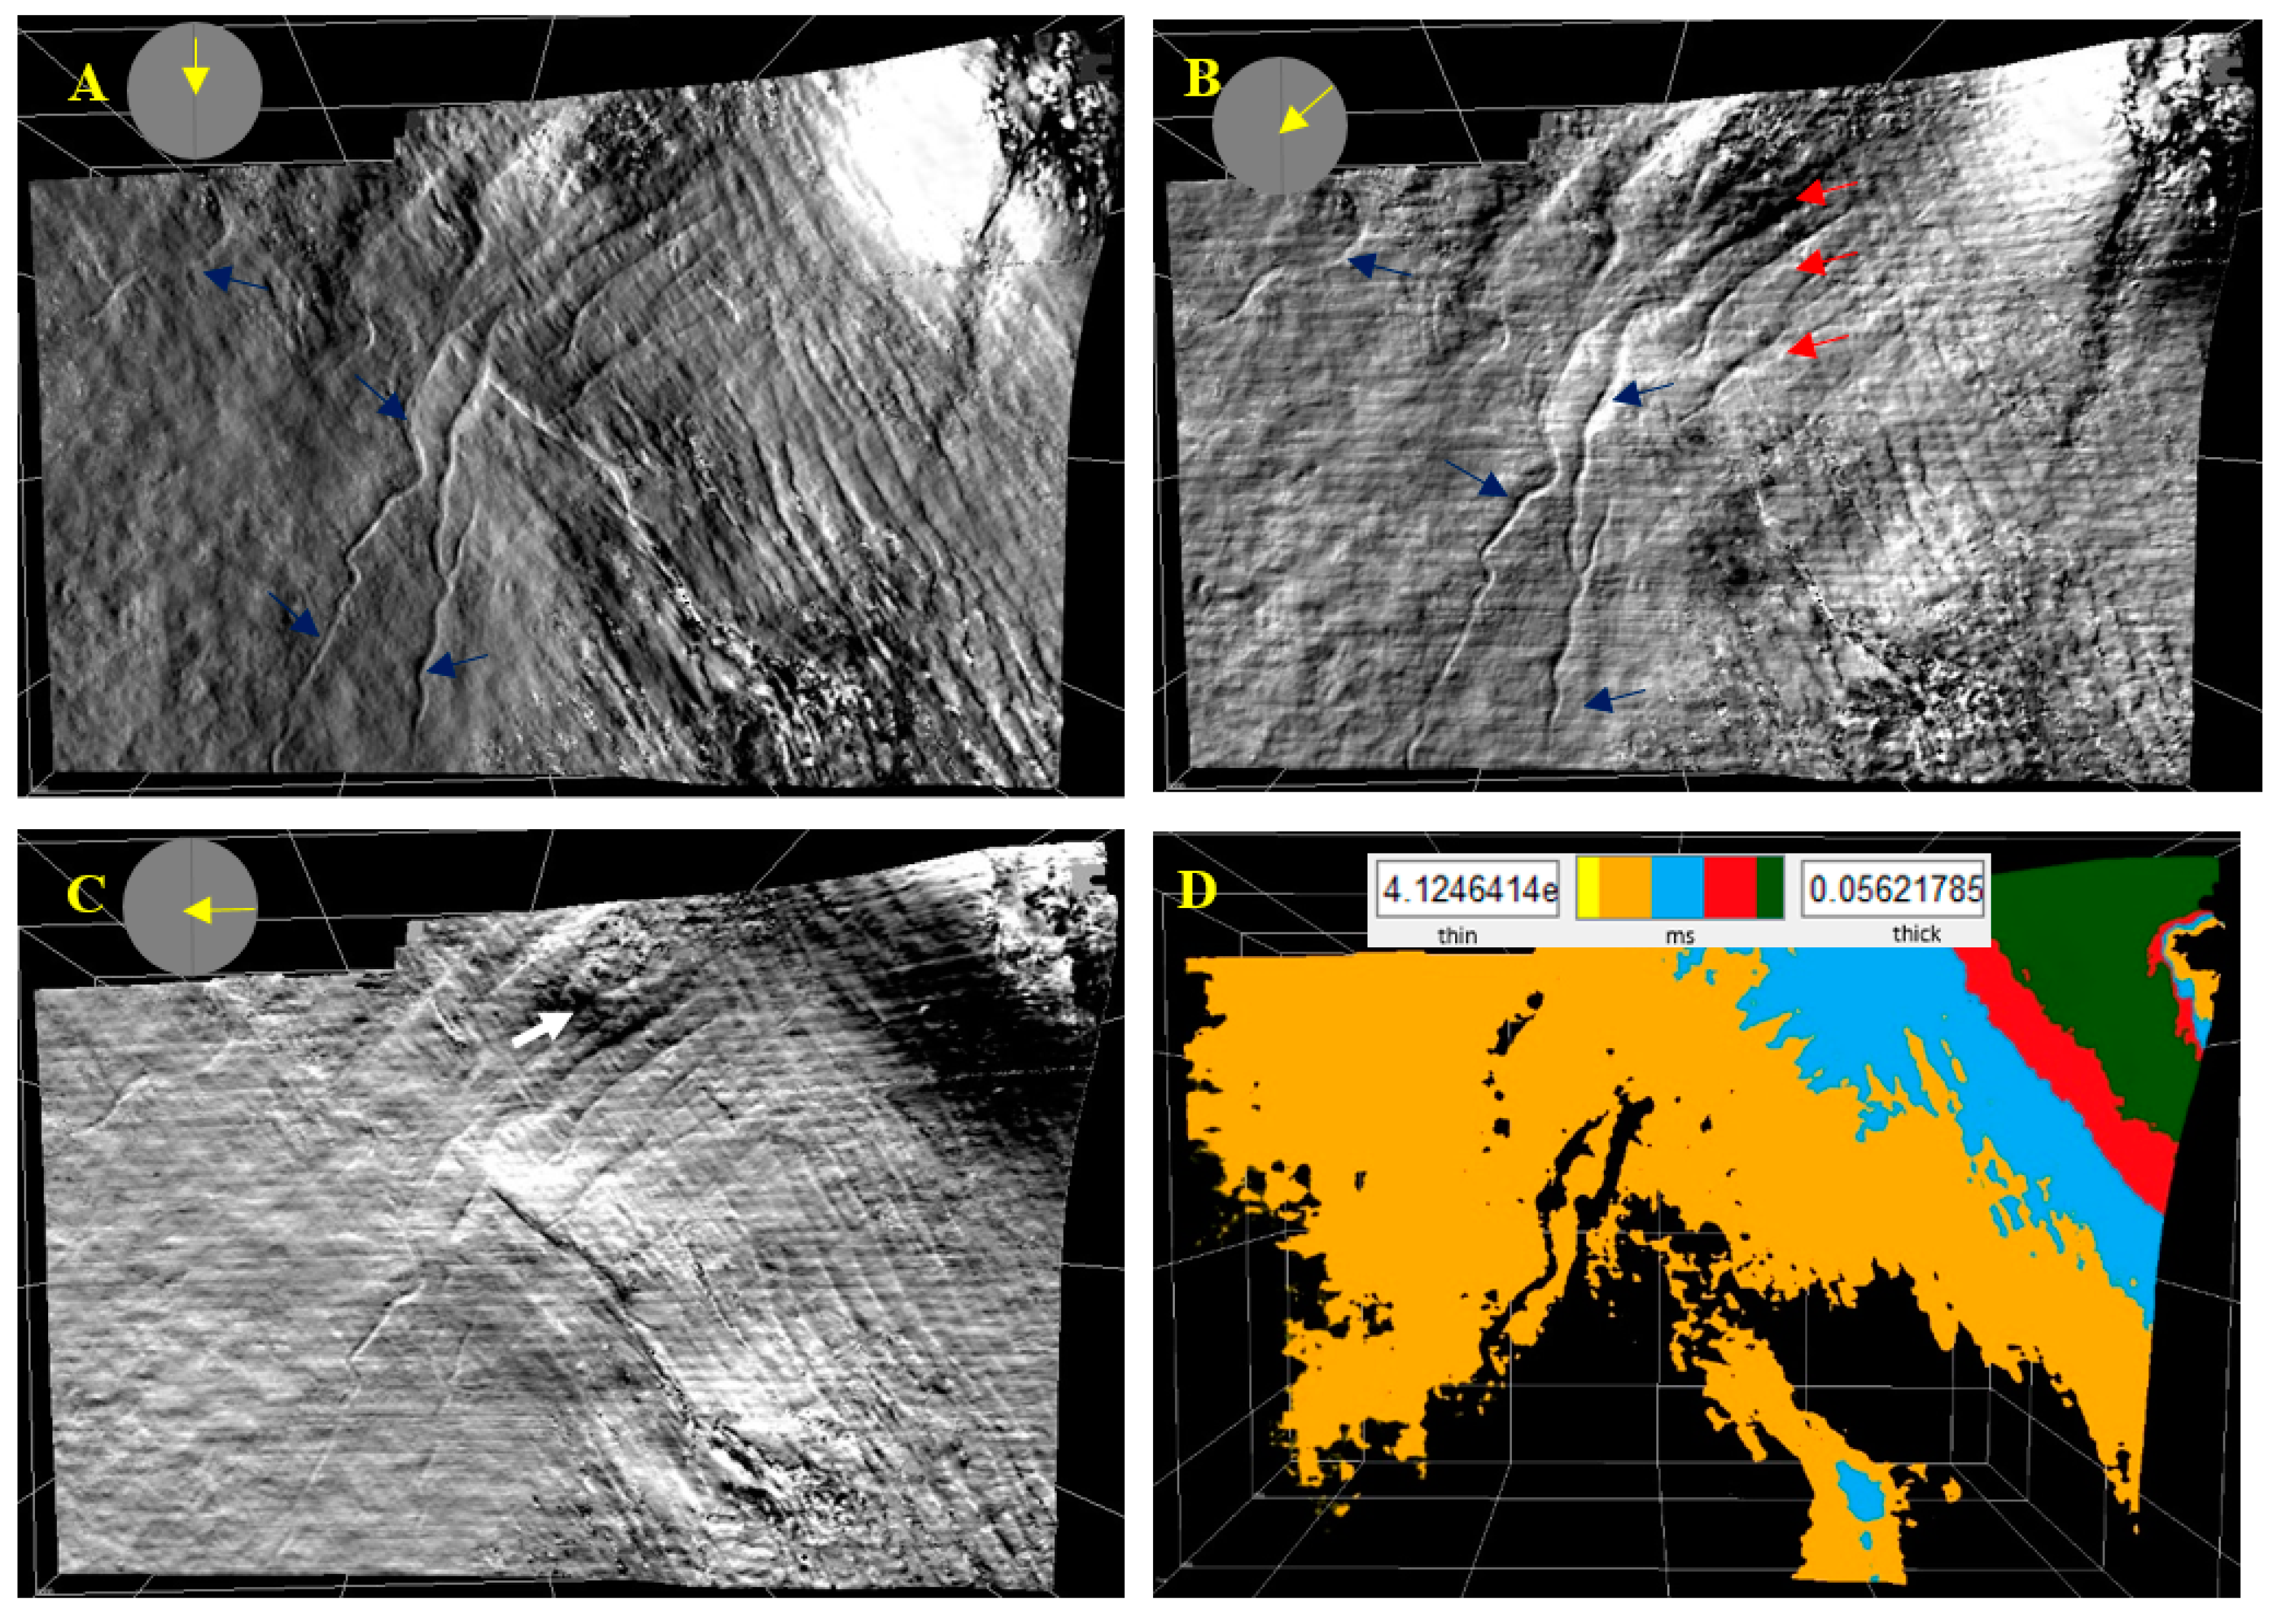
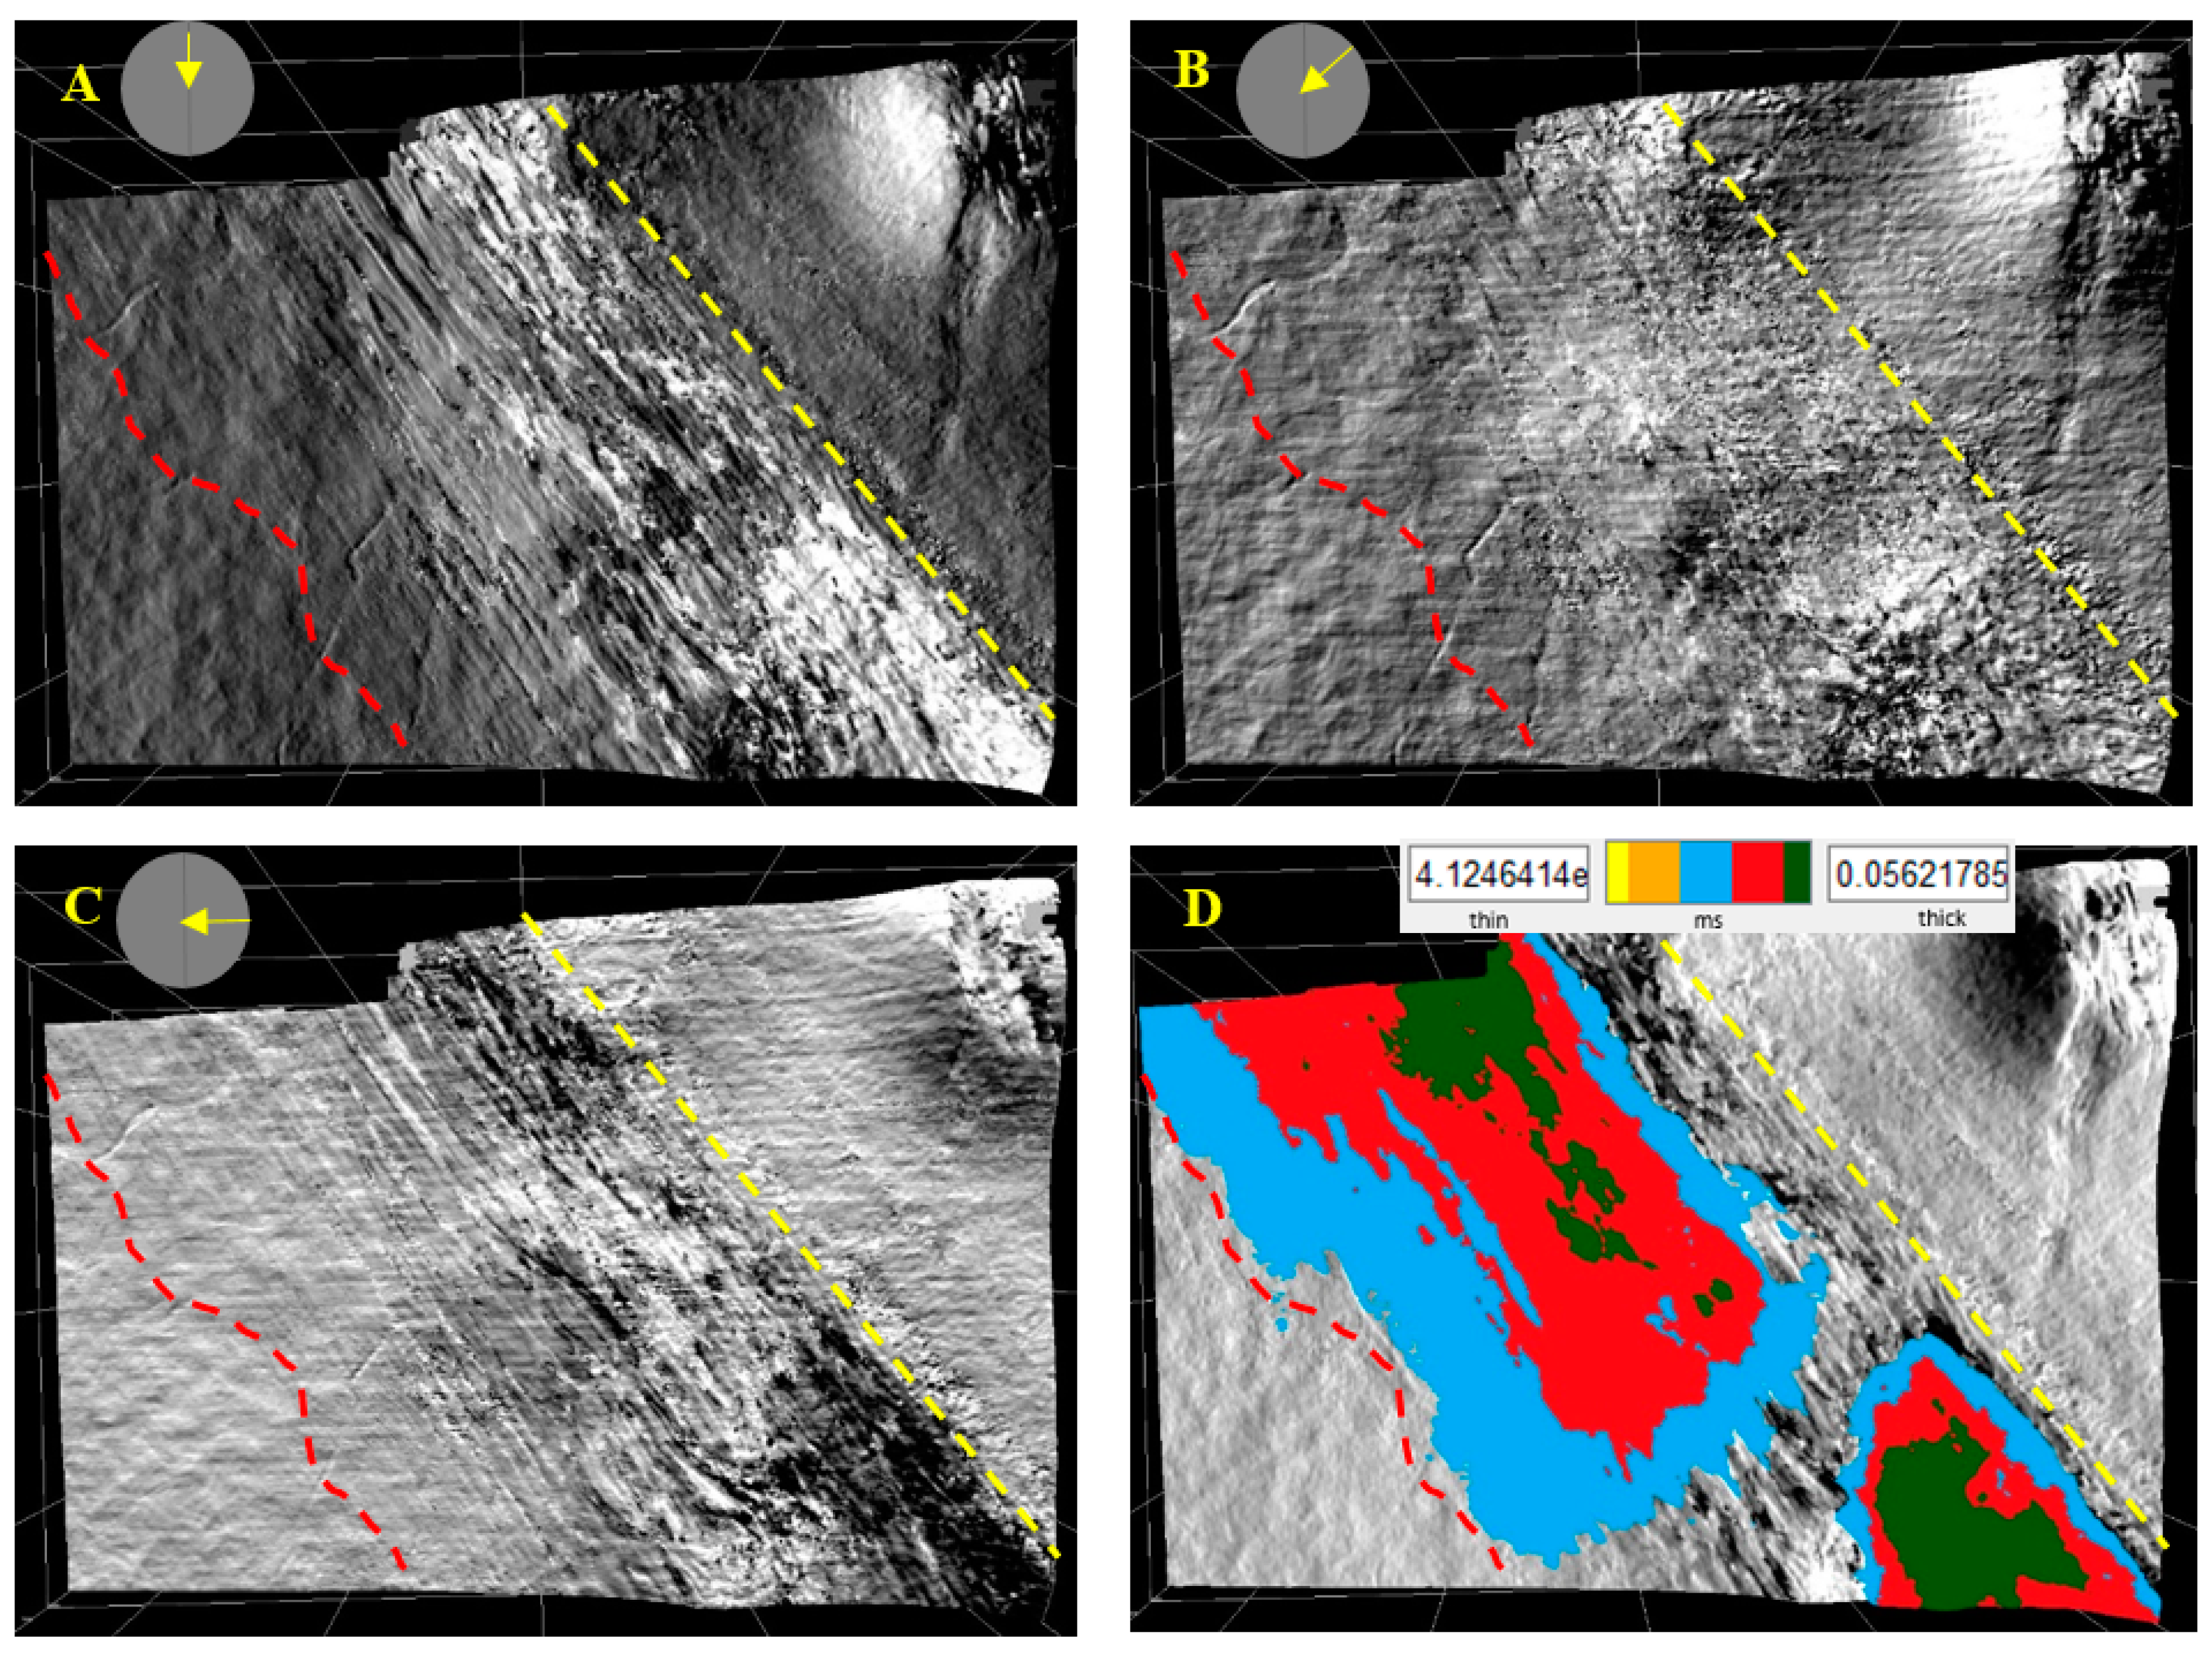
4.2.2. Dip-Apparent Attributes

MFS1 Surfaces

The azimuth attribute helps visualize geological dips and curvatures in apparent dips ranging from 0–360 degrees. In this study, three apparent dips were used to identify and analyze the structural and stratigraphic features which are 0°, 45°, and 90°. An apparent dip at 0° indicates that the seismic reflector at the evaluation point is dipping in the direction of increasing cross-line numbers while a 90° apparent dip angle indicates that the seismic reflector at the evaluation point is dipping in the direction of increasing inline numbers.
Based on Figure 11, the lateral continuity of the deep marine meandering channel (the blue arrow) is clearly observable especially at a 0° and 45° apparent dip angle. The lateral extension of the sand waves can be identified on all apparent angles where the troughs and crests of the sand waves can be clearly seen. Other structural features that can be identified here are a series of minor faults and a major fault. Three subtle features (the red arrow in Figure 11B) believed to be either a fault or channel trending northeast-southwest, cutting through the sand waves, is clearly visible only when the apparent dip angle is at 45°. Figure 11D shows the maximum deposition or depocenter of sediment deposited within the transgressive system tracts.

BSFR1 Surfaces

Figure 12 shows the aggradational and progradational basin-ward movement of sediment deposits due to the steady relative sea level rise at the shoreline and normal regression. The yellow line indicates the paleo-coastline at the very end of the highstand system tract stages and at the early stage of force regression. The red line indicates the lateral extent of sediment deposition on top of the previous stratigraphic surface (MFS1) which, in stratal termination terms, is known as downlap. This also correlates directly to the region of maximum deposition (Figure 12D). The apparent-dip attribute viewed at all azimuth angles shows that the existing sand waves have shifted basin-ward and subsequently buried some part of the existing deep marine meandering channel (the blue arrow).
Recent studies done by Illidge, et al. [50] on the same area indicate the presence of turbidite deposits generated during the FSST stages. The main turbidites geobodies were found right after the last prograding offlapping lobe where the high-density turbidite deposits are most likely to be found as mounded geometries. This confirms the observation in this study as shown by the maximum depocenter (Figure 12D) on BSFR1 surfaces which might indicate high-density turbidite deposits. 3D geobodies are modeled in this study by integrating the 3D horizons framework, system tracts, internal seismic geometry, and maximum depocenter data. Illidge et al. [50] concluded that the proximal portion of the turbidite is sand-rich compare to the distal portion which is mud-rich. In terms of hydrocarbon play, the underlying MFS surface might act as a potential source rock and the late stage of an FSST stage might have generated a potential seal layer [50].

CC/SU1 Surfaces

The CC/SU1 is part of a forced regressional surface where there is a high rate of progradation due to a significant sea-level fall at the shoreline. Figure 13 shows the downstepping, offlapping pattern, and progradational movement of the sediment deposits due to force regression. The yellow line indicates the paleo-coastline at the end of the falling stage system tract and the red line indicates the progression and lateral extent of sediment deposition. The product of wave reworking as mentioned before is evident on the dip attributes (Figure 13A–C). Sediment continues to be deposited basin-ward and on top of existing surfaces as offlap and this can be seen in the distribution of the depocenter or the maximum deposition of sediments (Figure 13D). The deep marine channel continues to be buried by basin-ward movement of sediment on top.

MRS1 Surfaces

MRS1 is part of a lowstand system tract where there is a steady rise in sea-level. This stage is marked by a steady progradational and aggradational movement of sediment. Based on Figure 14, due to an influx of sediment depositions, the lateral extent of sediment deposition (the red line) has shifted significantly basin-ward and has created a favorable setting for the realignment and redevelopment of sand waves at the basin region. Sand waves are clearly visible when the apparent dip is at a 0° and 90° angle. The existing deep marine channel is completely overlaid on top by the massive basin-ward influx of sediment. It is also possibly shifted basin-ward at the deep marine setting and low energy environment where the formation of the deep marine channel is favorable. Figure 14D shows the distribution of the sediment depocenter occurring during the lowstand system tract and that it is in agreement with the progradational and aggradational movement of sediment.

4.2.3. Maximum Curvature

The curvature attribute has been known to be very powerful and a useful tool in delineating faults that are smeared due to inaccurate migration [51] and predicting the orientation and distribution of fractures [52,53]. Curvature also aids in the mapping of stratigraphic features such as channels, levees, bars, and contourites, especially in a region where older rocks have undergone differential compactions [54].
In this study, a Maximum Curvature attribute was used and applied to each stratigraphic layer of interest and the outcome is shown in Figure 15. Sigismondi and Soldo [51] clarified that the use of a correct color map with an appropriate range of values is important for better visualization as the wrong use of a color map can result in the loss of structural and stratigraphic seismic definitions. In this study, we either used a grey scale or a coherency color map as it helped in enhancing subtle discontinuities. Considering Figure 15, the maximum curvature was able to identify the lateral extent of the deep marine meandering channel on each stratigraphic surface. Especially on the MFS1 surface (Figure 15A), three subtle features noted by the colored arrows are observed and later confirmed to be a series of three separate river channels as indicated in Figure 15E. This subtle feature is not clearly observed in the similarity or dip attributes. Other stratigraphic features that were highlighted by the maximum curvature are sand-waves and pockmark.
In terms of structural features, a major fault is observed on each stratigraphic surface trending northwest-southeast as denoted by the black arrows. The existence of this major fault is confirmed by viewing it in the seismic inline section (Figure 16). The only problem with the maximum curvature is that it does not really indicate the upthrown (or anticlinal features) or the downthrown (or synclinal features) part of the fault block without directly viewing it from the seismic section.

5. Conclusions

This research paper has managed to show how integrated interpretation of geological information allows researchers to accurately interpret the depositional environment of a basin as well as locating both seismic and sub-seismic geomorphologic features. By utilizing the steering cube and the wheeler transformation, we improved the accuracy in interpreting stratigraphic surfaces and system tracts when compared to the conventional interpretation of stratigraphic surfaces that relies on manual interpretation and consumes a lot of time. In this study, three depositional sequences were identified using synchronized analyses of both the structural and wheeler domain and following the Depositional Model IV. Each sequence has a set of packages comprising TST, HST, FSST, and LST and their corresponding stratigraphic surfaces. Defining the stratigraphic surfaces allow us to accurately observe the accumulation of sediment and changes in geomorphology on each stratigraphic surface which was demonstrated in this study by applying appropriate seismic attributes. As we move along the basal cycle, changes in geomorphology and the evolution of sediment and depocenter on each stratigraphic surface is very much evident in the response to sea level changes and hence control of the sediment deposition or influx. The basin-ward and/or land-ward movement of sediment is very clear as indicated by the changes in geomorphology. In addition, by analyzing the seismic internal geometry, system tract, well log, and depocenter, it enables us to locate the presence of turbidite geobody generated during the late stage of FSST as predicted. For future research, this study might be useful in defining a new petroleum play if the drilling core data and analog study are integrated with the present workflow.

Acknowledgments

The first author is very much grateful to the Government of Brunei Darussalam for providing a scholarship to carry out his study at the University of Brunei Darussalam. The open source data for this study is also highly acknowledged. The authors are really grateful and thankful to dGB Earth Sciences for donating OpendTect software for academic use at the Department of Geological Sciences, Universiti Brunei Darussalam. The authors thank lecturers and staffs of Geological Sciences Department for providing the enabling environment and other useful supports.

Author Contributions

Mohammad Afifi Ishak is an M.Sc student who carried out this study and Md Aminul Islam is his principal supervisor who formulate the idea of study, supervise the first author while carrying out this study, and mentor him to develop the manuscript. Other two coauthors Mohamed Ragab Shalaby and Nurul Hasan are two co-supervisors of the first author. Both co-authors helped the first author through guidance and stimulating discussion and take part in preparation, correction and revision of the manuscript.

Conflicts of Interest

The authors declare no conflict of interest.

References

  1. Adigun, A.; Ayolabi, E. The use of seismic attributes to enhance structural interpretation of z-field, onshore niger delta. J. Climatol. Weather Forecast. 2013. [Google Scholar] [CrossRef]
  2. Sheriff, R.E. Reservoir Geophysics; Society of Exploration Geophysicists: Tulsa, OK, USA, 1992. [Google Scholar]
  3. Taner, M.T. Seismic attributes. CSEG Rec. 2001, 26, 48–56. [Google Scholar]
  4. Strecker, M.R.; Carrapa, B.; Hulley, G.; Scoenbohm, L.; Sobel, E.R. Erosional control of plateau evolution in the central andes. In Proceedings of the 2004 Denver Annual Meeting, Denver, Colorado, 7–10 November 2004. [Google Scholar]
  5. Koson, S.; Chenrai, P.; Choowong, M. Seismic attributes and their applications in seismic geomorphology. Bull. Earth Sci. Thailand 2014, 6, 1–9. [Google Scholar]
  6. Catuneanu, O. Principles of Sequence Stratigraphy; Elsevier: Amsterdam, The Netherlands, 2006. [Google Scholar]
  7. Qayyum, F.; Betzler, C.; Catuneanu, O. The wheeler diagram, flattening theory, and time. Mar. Petrol. Geol. 2017, 86, 1417–1430. [Google Scholar] [CrossRef]
  8. Qayyum, F.; Betzler, C.; Catuneanu, O. Space-time continuum in seismic stratigraphy: Principles and norms. Interpretation 2017, 6, 1–42. [Google Scholar] [CrossRef]
  9. Qayyum, F.; De Groot, P.; Hemstra, N.; Catuneanu, O. 4d wheeler diagrams: Concept and applications. Geol. Soc. London Spec. Publ. 2015, 404, 223–232. [Google Scholar] [CrossRef]
  10. De Bruin, G.; Ligtenberg, H.; Hemstra, N.; Tingdahl, K. Synchronized sequence stratigraphic interpretation in the structural and chrono-stratigraphic (wheeler transformed) domain. In Proceedings of the EAGE Research Workshop 2006, Grenoble, France, 25–27 September 2006. [Google Scholar]
  11. Qayyum, F.; de Groot, P.; Hemstra, N. Using 3d wheeler diagrams in seismic interpretation—The horizoncube method. First Break 2012, 30, 103–109. [Google Scholar]
  12. Qayyum, F.; Catuneanu, O.; Groot, P. Historical developments in wheeler diagrams and future directions. Basin Res. 2015, 27, 336–350. [Google Scholar] [CrossRef]
  13. Mojeddifar, S.; Kamali, G.; Ranjbar, H. Porosity prediction from seismic inversion of a similarity attribute based on a pseudo-forward equation (pfe): A case study from the North Sea basin, Netherlands. Petrol. Sci. 2015, 12, 428–442. [Google Scholar] [CrossRef]
  14. Jaglan, H.; Qayyum, F.; Hélène, H. Unconventional seismic attributes for fracture characterization. First Break 2015, 33, 101–109. [Google Scholar]
  15. Odoh, B.I.; Ilechukwu, J.N.; Okoli, N.I. The Use of Seismic Attributes to Enhance Fault Interpretation of OT Field, Niger Delta. Int. J. Geosci. 2014, 5, 826–834. [Google Scholar] [CrossRef]
  16. Illidge, E.; Camargo, J.; Pinto, J. In Turbidites characterization from seismic stratigraphy analysis: Application to the Netherlands offshore F3 block. In Proceedings of the AAPG/SEG 2016 International Conference & Exhibition, Cancun, Mexico, 6–9 September 2016. [Google Scholar]
  17. Qayyum, F.; Hemstra, N.; Singh, R. A modern approach to build 3d sequence stratigraphic framework. Oil Gas J. 2013, 111, 46. [Google Scholar]
  18. Rohrman, M.; Beek, P.; Andriessen, P.; Cloetingh, S. Meso-cenozoic morphotectonic evolution of southern Norway: Neogene domal uplift inferred from apatite fission track thermochronology. Tectonics 1995, 14, 704–718. [Google Scholar] [CrossRef]
  19. Sales, J. Uplift and subsidence do northwestern Europe: Possible causes and influence on hydrocarbon productivity. Nor. Geol. Tidsskr. 1992, 72, 253–258. [Google Scholar]
  20. Ghazi, S. Cenozoic uplift in the Stord basin area and its consequences for exploration. Nor. Geol. Tidsskr. 1992, 72, 285–290. [Google Scholar]
  21. Jordt, H.; Faleide, J.I.; Bjørlykke, K.; Ibrahim, M.T. Cenozoic sequence stratigraphy of the central and northern North Sea basin: Tectonic development, sediment distribution and provenance areas. Mar. Petrol. Geol. 1995, 12, 845–879. [Google Scholar] [CrossRef]
  22. Riis, F. Dating and measuring of erosion, uplift and subsidence in Norway and the Norwegian shelf in glacial periods. Nor. Geol. Tidsskr. 1992, 72, 325–331. [Google Scholar]
  23. Riis, F. Quantification of Cenozoic vertical movements of Scandinavia by correlation of morphological surfaces with offshore data. Glob. Planet. Chang. 1996, 12, 331–357. [Google Scholar] [CrossRef]
  24. Lidmar-Bergström, K.; Ollier, C.; Sulebak, J. Landforms and uplift history of southern Norway. Glob. Planet. Chang. 2000, 24, 211–231. [Google Scholar] [CrossRef]
  25. Hansen, S. Quantification of net uplift and erosion on the Norwegian shelf south of 66 n from sonic transit times of shale. Nor. Geol. Tidsskr. 1996, 76, 245–252. [Google Scholar]
  26. Jensen, L.; Schmidt, B. Late tertiary uplift and erosion in the Skagerrak area: Magnitude and consequences. Nor. Geol. Tidsskr. 1992, 72, 275–279. [Google Scholar]
  27. Rohrman, M.; Andriessen, P.; Beek, P. The relationship between basin and margin thermal evolution assessed by fission track thermochronology: An application to offshore southern Norway. Basin Res. 1996, 8, 45–63. [Google Scholar] [CrossRef]
  28. Overeem, I.; Weltje, G.J.; Bishop-Kay, C.; Kroonenberg, S. The late Cenozoic Eridanos delta system in the southern North Sea basin: A climate signal in sediment supply? Basin Res. 2001, 13, 293–312. [Google Scholar] [CrossRef]
  29. Qayyum, F.; Akhter, G.; Ahmad, Z. Logical expressions a basic tool in reservoir characterization. Oil Gas J. 2008, 106, 33–42. [Google Scholar]
  30. Steeghs, P.; Overeem, I.; Tigrek, S. Seismic volume attribute analysis of the Cenozoic succession in the l08 block (southern North Sea). Glob. Planet. Chang. 2000, 27, 245–262. [Google Scholar] [CrossRef]
  31. Sørensen, J.C.; Gregersen, U.; Breiner, M.; Michelsen, O. High-frequency sequence stratigraphy of upper Cenozoic deposits in the central and southeastern North Sea areas. Mar. Ptrol. Geol. 1997, 14, 99–123. [Google Scholar] [CrossRef]
  32. Michelsen, O.; Thomsen, E.; Danielsen, M.; Heilmann-Clausen, C.; Jordt, H.; Laursen, G.V. Cenzoic sequence stratigraphy in the Easter North Sea. In Proceedings of the SEPM 1998 Conference, Sicily, Italy, 4–9 September 1998. [Google Scholar]
  33. Streif, H. Deutsche Beiträge Zur Quartärforschung in der Südlichen-nordsee; Geologisches Jahrbuch der BGR: Hannover, Germany, 1996. [Google Scholar]
  34. Tigrek, S. 3d seismic interpretation and attribute analysis of the l08 Block, Southern North Sea Basin. Master’s Thesis, Faculty of Applied Earth Sciences, Delft University of Technology, Delft, The Netherlands, 1998. [Google Scholar]
  35. Remmelts, G. Fault-related salt tectonics in the southern North Sea, the Netherlands. In AAPG Memoir; AAPG: Tulsa, OK, USA, 1995. [Google Scholar]
  36. Bijlsma, S. Fluvial sedimentation from the Fennoscandian area into the north-west European basin during the late Cenozoic. Geol. Mijnb. 1981, 60, 337–345. [Google Scholar]
  37. Vinken, R. The Northwest European Tertiary Basin: results of the International Geological Correlation Programme; Project No. 124; Schweizerbart Science Publishers: Stuttgart, Germany, 1988. [Google Scholar]
  38. Ziegler, P. Geological Atlas of Western and Central Europe; Geological Society of London: London, UK, 1990. [Google Scholar]
  39. Cartwright, J. Seismic-stratigraphical analysis of large-scale ridge–trough sedimentary structures in the late Miocene to early Pliocene of the central North Sea. In Sedimentary Facies Analysis: A Tribute to the Research and Teaching of Harold G. Reading; Wiley Online Library: Hoboken, NJ, USA, 1995; pp. 283–303. [Google Scholar]
  40. Rondeel, H.; Batjes, D.; Nieuwenhuijs, W. Geology of gas and oil under the Netherlands; Kluwer Academic Publishers: Alphen aan den Rijn, The Netherlands, 1996. [Google Scholar]
  41. Van Adrichem Boogaert, H.; Kouwe, W. Stratigraphic Nomenclature of the Netherlands, Revision and Update by RGD and NOGEPA; Geological Survey of the Netherlands: Haarlem, The Netherlands, 1993. [Google Scholar]
  42. Qayyum, F.; de Groot, P. Seismic Dips Help Unlock Reservoirs; American Oil and Gas Reporter: Derby, KS, USA, 2012. [Google Scholar]
  43. Avseth, P.; Mukerji, T.; Mavko, G. Quantitative Seismic Interpretation: Applying Rock Physics Tools to Reduce Interpretation Risk; Cambridge University Press: Hongkong, China, 2010. [Google Scholar]
  44. De Bruin, G.; Hemstra, N.; Pouwel, A. Stratigraphic surfaces in the depositional and chronostratigraphic (wheeler-transformed) domain. Lead. Edge 2007, 26, 883–886. [Google Scholar] [CrossRef]
  45. Brouwer, F.; De Bruin, G.; De Groot, P.; Connolly, D. Interpretation of seismic data in the wheeler domain: Integration with well logs, regional geology and analogs. In Proceedings of the 2008 SEG Annual Meeting, Las Vegas, NV, USA, 9–14 November 2008. [Google Scholar]
  46. De Groot, P.; Huck, A.; de Bruin, G.; Hemstra, N.; Bedford, J. The horizon cube: A step change in seismic interpretation! Lead. Edge 2010, 29, 1048–1055. [Google Scholar] [CrossRef]
  47. Hunt, D.; Tucker, M.E. Stranded parasequences and the forced regressive wedge systems tract: Deposition during base-level fall—Reply. Sediment. Geol. 1995, 95, 147–160. [Google Scholar] [CrossRef]
  48. Catuneanu, O. Sequence stratigraphy of clastic systems: Concepts, merits, and pitfalls. J. Afr. Earth Sci. 2002, 35, 1–43. [Google Scholar] [CrossRef]
  49. Schroot, B.; Schuttenhelm, R. Expressions of shallow gas in the Netherlands North Sea. Neth. J. Geosci. 2003, 82, 91–106. [Google Scholar] [CrossRef]
  50. Illidge, E.; Camargo, J.; Pinto, J. Turbidites characterization from seismic stratigraphy analysis: Application to the Netherlands offshore F3 Block. In Proceedings of the AAPG/SEG 2015 International Conference & Exhibition, Melbourne, Australia, 13–16 September 2015. [Google Scholar]
  51. Sigismondi, M.E.; Soldo, J.C. Curvature attributes and seismic interpretation: Case studies from Argentina basins. Lead. Edge 2003, 22, 1122–1126. [Google Scholar] [CrossRef]
  52. Roberts, A. Curvature attributes and their application to 3 d interpreted horizons. First Break 2001, 19, 85–100. [Google Scholar] [CrossRef]
  53. Hakami, A.M.; Marfurt, K.J.; Al-Dossary, S. Curvature attribute and seismic interpretation: Case study from Fort Worth Basin, Texas, USA. In SEG Technical Program Expanded Abstracts 2004; Society of Exploration Geophysicists: Littleton, CO, USA, 2004; pp. 544–547. [Google Scholar]
  54. Chopra, S.; Marfurt, K.J. Seismic curvature attributes for mapping faults/fractures, and other stratigraphic features. CSEG Rec. 2007, 32, 37–41. [Google Scholar]
Figure 1. The location map of the F3 block, the study area (rectangle is indicated by arrow). It is located in the Dutch sector of the North Sea. After Remmelts [35].
Geosciences 08 00079 g001
Figure 2. The Eridanos fluvio-deltaic system of the North-West European Basin [36,37,38,39].
Geosciences 08 00079 g002
Figure 3. (A) The schematic diagram of the Neogene Eridanos fluvio-deltaic system of the North Sea and (B) its corresponding seismic profile (inline 425). The Eridanos delta can be divided into the Upper and Lower packages. The Upper package can be further divided into 3 sub-unit [30].
Geosciences 08 00079 g003
Figure 4. The tectonic framework and regional cross-section of the North Sea after Rondeel, Batjes and Nieuwenhuijs [40]. The red box indicates the F3 block (the study area).
Geosciences 08 00079 g004
Figure 5. The hydrocarbon plays and stratigraphy of the North Sea Basin. The Upper North Sea Group is the zone of interest for this study. After Rondeel, Batjes and Nieuwenhuijs [40].
Geosciences 08 00079 g005
Figure 6. Detailed stratigraphy and tectonic events in the North Sea Basin [40].
Geosciences 08 00079 g006
Figure 7. The workflow for the structural and stratigraphic interpretation applied to the seismic data.
Geosciences 08 00079 g007
Figure 8. Synchronized seismic sequence stratigraphic interpretation done in two domains; (A) the Structural or Chronostratigraphic domain and (B) the Wheeler domain.
Geosciences 08 00079 g008
Figure 9. The complete sequence of stratigraphic systems. The three depositional sequence is identified. However, only the two depositional sequence is considered in this study.
Geosciences 08 00079 g009
Figure 10. The minimum similarity attributes for each surface. (A) Maximum flooding surfaces 1 (MFS1); (B) basal surface force regression 1 (BSFR1); (C) correlative conformity and sub-aerial conformity 1 (CC/SU1); and (D) maximum regressive surface 1 (MRS1). The yellow dashed line indicates the paleo-coastline position. The existence of a deep meandering channel is denoted by the blue arrows.
Geosciences 08 00079 g010
Figure 11. The apparent dip attribute for MFS1 surfaces at (A) 0°, (B) 45°, (C) 90°, and (D) the Isopach map. The blue arrows indicate the deep meandering channels, the red arrows indicate the existence of a minor sub-seismic fault which is only clearly visible in (B) while the white arrows highlight the existence of pockmark.
Geosciences 08 00079 g011
Figure 12. The apparent dip attribute for BSFR1 surfaces at (A) 0°, (B) 45°, (C) 90°, (D) the Isopach map, and (E) 3D turbidite geobody extraction where darker shades indicate mud-rich turbidite while lighter shades indicate sand-rich turbidite. The blue arrows indicate the deep meandering channels and the black arrows indicate the existence of a major fault.
Geosciences 08 00079 g012
Figure 13. The apparent dip attributes for CC/SU1 surfaces at (A) 0°, (B) 45°, (C) 90°, and (D) the Isopach map.
Geosciences 08 00079 g013
Figure 14. The apparent dip attribute for MRS1 surfaces at (A) 0°, (B) 45°, (C) 90°, and (D) the Isopach map. The blue arrows indicate the redevelopment of sand waves towards the basin-ward region.
Geosciences 08 00079 g014
Figure 15. The maximum curvature attributes for each surface. (A) MFS1, (B) BSFR1, (C) CC/SU1, (D) MRS1 and (E) Seismic section indicates series of minor faults. The black arrows indicate a major fault towards the south while the white arrows indicate a series of minor faults towards the north.
Geosciences 08 00079 g015
Figure 16. Cross-section of a major normal fault observed in the F3 block which is representing profile a’b’ drawn in Figure 15A.
Geosciences 08 00079 g016
Table 1. Seismic attributes parameter settings.
AttributeTime Gates (ms)Step-OutDip-SteeringStatistical Operator
Raw Steering-(1, 1, 1)--
Detailed Steering-(1, 1, 3)--
Background Steering-(5, 5, 5)--
Similarity(−8, 24)(1, 1, 1)SteeredMinimum Full
Curvature(−28, 28)(2, 2, 2)SteeredMaximum
Dip(−28, 28)(1, 1, 1)SteeredApparent
Table 2. Stratigraphic surfaces with their corresponding events and depositional sequence.
NoStratigraphic SurfacesCorresponding System Tract EventsDepositional Sequence
1MFS1End of TST11
2BSFR1End of HST11
3CC/SU1End of FSST11
4MRS1End of LST12
5BSFR2End of HST22
6CC/SU2End of FSST22
7MRS2End of LST23

