Sand Dune Albedo Feedback


Department of Solar Energy and Environmental Physics, Blaustein Institutes for Desert Research, Sede Boqer Campus, Ben-Gurion University of the Negev, Be’er Sheva 84990, Israel
*
Author to whom correspondence should be addressed.
Geosciences 2018, 8(3), 82; https://doi.org/10.3390/geosciences8030082
Submission received: 11 December 2017
/
Revised: 22 January 2018
/
Accepted: 13 February 2018
/
Published: 27 February 2018
(This article belongs to the Special Issue Aeolian Processes and Geomorphology)
Abstract
:Sand dunes cover substantial parts of desert areas. Fully active dunes are bare, while fixed dunes are stabilized by vegetation and biogenic crust, and the dune activity is affected by the wind. Here we suggest the following atmosphere-sand dune feedback: spatial differences in the dunes’ vegetation and biogenic crust cover lead to differences in albedo as the albedo of bare sand is larger than that of vegetation and biogenic crust. This leads to a higher temperature over the vegetated area, resulting in air flow from the bare dune area to the vegetated dune area, thus increasing the wind activity over the vegetated dune area. In turn, this leads to enhanced stress on the vegetation and enhanced dune activity and thus to a decrease in vegetation. These changes in vegetation cover affect the surface albedo, leading to a change in wind activity. We examined this feedback using an atmospheric general circulation model, Weather Research and Forecasting (WRF), in selected regions of the northwestern Negev Desert and the Sahara/Sahel region, and we show that changes in surface albedo do indeed lead to significantly enhanced wind activity over the lower albedo region. We then incorporated this feedback into a simple vegetated dune model, showing that the multiple states associated with active and fixed dunes can be obtained for a larger range of parameters and that the stables states become more extreme (i.e., the fixed dune state becomes more vegetated and the active dune state becomes less vegetated).
1. Introduction
The sand dune system is important, unique and involves complex physical (e.g., [1,2,3]), ecological (e.g., [4]), and geomorphological (e.g., [5]) processes. Vast desert areas (∼20%) comprise dunes [5,6], and they can degrade human habitations, agricultural fields, roads, etc. [7,8]. However, stable (fixed) dunes may have economic value; for example, the stable dunes in the Sahel and southern Africa have pastoral and agricultural uses. Sand dunes can be classified into two main categories: active (such as barchans, transverse and seif dunes) and fixed (mainly parabolic and vegetated linear dunes), in which the dune’s mobility state depends on several factors including vegetation and biogenic crust cover, wind power, and precipitation. Sand dunes may be affected by climate changes (e.g., [9,10,11]). The wind is the driving force of a sand dune; yet, precipitation affects the vegetation and biogenic crust covers, which can stabilize the sand, thus playing an important role in dune mobility. Previous studies mainly associated dune formation with arid conditions and dune fixation with humid conditions (e.g., [12,13,14,15,16,17]). Droughts can affect dune mobility by suppressing the growth of vegetation that stabilizes the dunes and can lead to dune reactivation as, for example, occurred in North America, in the Mojave Desert [18], in the Great Sand Dunes [19], and in the Canadian Prairies [20].
The relationship between vegetation and the earth’s climate has been intensively studied in the past. A well-known conceptual model regarding the effect of vegetation on the earth’s climate is the “Daisyworld” model of [21]; in this model, black and white daisies regulate the earth’s temperature to be roughly constant, in spite of the drastic changes in solar insolation. In 1974, Otterman and his colleagues [13,22] analyzed satellite images of the Israel-Egypt border. These studies reported a clear difference between the Israeli and the Egyptian sides in which the former was much darker. This difference was attributed to vegetation and soil characteristics—the Egyptian side experienced massive overgrazing, wood gathering etc., which led to the destruction of vegetation, while the Israeli side was protected from such activities, leaving the vegetation in its natural distribution. Later, it was suggested that the trampling of the biogenic crust cover by Bedouin-tended herds of goats and camels (a practice that was prohibited on the Israeli side) was the primary cause of the brighter (yellowish) sand on the Egyptian side in comparison to the grayish color of the biogenic crust on the Israeli side [4,23,24,25,26]. Otterman further suggested that the differences in the soil color led to a difference in the radiative temperature through changes in the surface albedo—the brighter color of the bare sand resulted in a greater reflection of solar radiation, leading to colder temperatures. Furthermore, a positive feedback was suggested in which colder temperatures caused a decrease in precipitation and thus a further decrease in vegetation cover, which led to further cooling, etc. Charney [12] used a relatively simple atmospheric model to explain the severe drought occurring in the Sahel at that time. In his model, areas with a higher albedo experienced radiative cooling that was connected with other atmospheric processes (such as the Hadley circulation). Charney’s hypothesis was verified using a general circulation model (GCM, [27]).
Since the work of Charney [12] and Otterman et al. [13] positive feedbacks associated with vegetation cover were studied extensively. Such mechanisms were used to explain the severe and prolonged droughts in the Sahel [28], and the differences between the climate across borders, such as the USA-Mexico [29,30] and the Israel-Egypt borders [31,32]. More recent studies (e.g., [33]) have suggested that the severe drought in the Sahel was more closely linked to changes in precipitation rather than anthropogenic activities [34]. Changes in vegetation cover were linked to paleoclimatic phenomena, including the mid-Holocene warming (∼6000 years ago, [35]), Taiga-Tundra dynamics [36], the amplification of glacial-interglacial temperature change [37], the north African wet phase (the ”green Sahara”) during the early and mid-Holocene, Saharan dynamics [38], and long-term Saharan change [35,39,40].
Vegetation on dunes is affected by the wind (e.g., [4,10]). The main effect occurs via sand transport that either covers vegetation (sand deposition) or exposes roots (sand erosion), leading to vegetation suppression. In addition, the biogenic soil crust, which stabilizes dunes, may also be affected by wind through sand transport that covers the crust, blocking light and eventually leading to crust suppression; wind can also erode crust on the interface between the biogenic crust area and the bare sand area. As sand dunes cover a substantial area of arid and semi-arid regions, it is important to study the mutual feedbacks between climate and dune dynamics. Many studies have examined the effects of vegetation on climate through albedo, temperature, and precipitation–to our knowledge, none have examined the feedbacks between wind and vegetation (and biogenic crust) cover on sand dunes.
Here we propose and examine the following feedback between local climate and vegetation: we start from two neighboring sand dune regions, one with fixed dunes that are covered by vegetation (and biogenic crust) and another with bare and mobile dunes. This distinction results in an albedo difference between the two regions, with warmer temperatures on the vegetated fixed dunes due to their larger absorption of solar radiation. This temperature difference leads to a pressure difference and to air flow from the bare side to the vegetated side, with increased winds on the vegetated side. This enhanced wind activity decreases the vegetation cover, which increases the albedo, etc. In principle, this feedback should eventually lead to the same albedo in the two regions. However, due to the dynamics of vegetation cover on sand dunes, this is not always the case. We studied the proposed feedback in two stages. First, using a state-of-the-art atmospheric general circulation model, the Weather Research and Forecasting (WRF) model [41], we examined the changes in wind magnitude and pattern when prescribing the albedo in neighboring regions (i.e., we changed the albedo such that the albedo difference between the neighboring regions varied). We found that the wind drift potential (DP) increased approximately linearly in the vegetated side as the albedo difference between the regions increased. We then used this result in a simple model for vegetation cover on sand dunes [42,43,44] to study the effect of albedo on dune vegetation cover (and hence dune mobility), which then yielded an updated wind DP.
The rest of the manuscript is organized as follows. We first (Section 2) briefly introduce the atmospheric model and the setups we used. We then present the results obtained by this model (Section 3). Then, we introduce a vegetation cover on sand model that includes the sand albedo feedback and discuss the results we obtained using this model (Section 4). A summary of the results concludes the paper (Section 5).
2. The Atmospheric Model, WRF
We used the WRF 3.5 model [41] in our study. The WRF is a mesoscale numerical weather forecasting model that is used both to study atmospheric phenomena and for operational forecasting. The WRF was used to investigate a wide spectrum of meteorological problems and can handle a wide range of spatial scales, from thousands of kilometers down to tens of meters. It can perform simulations using real observational data or can be run under idealized conditions. The WRF is a Euler non-hydrostatic, fully compressible model. We used the WRF single-moment 6-class micro-physics scheme. The planetary boundary layer scheme was that of Yonsei University and for the cumulus parameterization, we used the Kain-Fritsch scheme.
We ran the WRF, using three nested grids, in two regions as depicted in Figure 1. The outermost grid was forced by the NCAR RDA data (https://rda.ucar.edu/data/ds083.2/grib1). We used 30 vertical levels with varying resolutions.
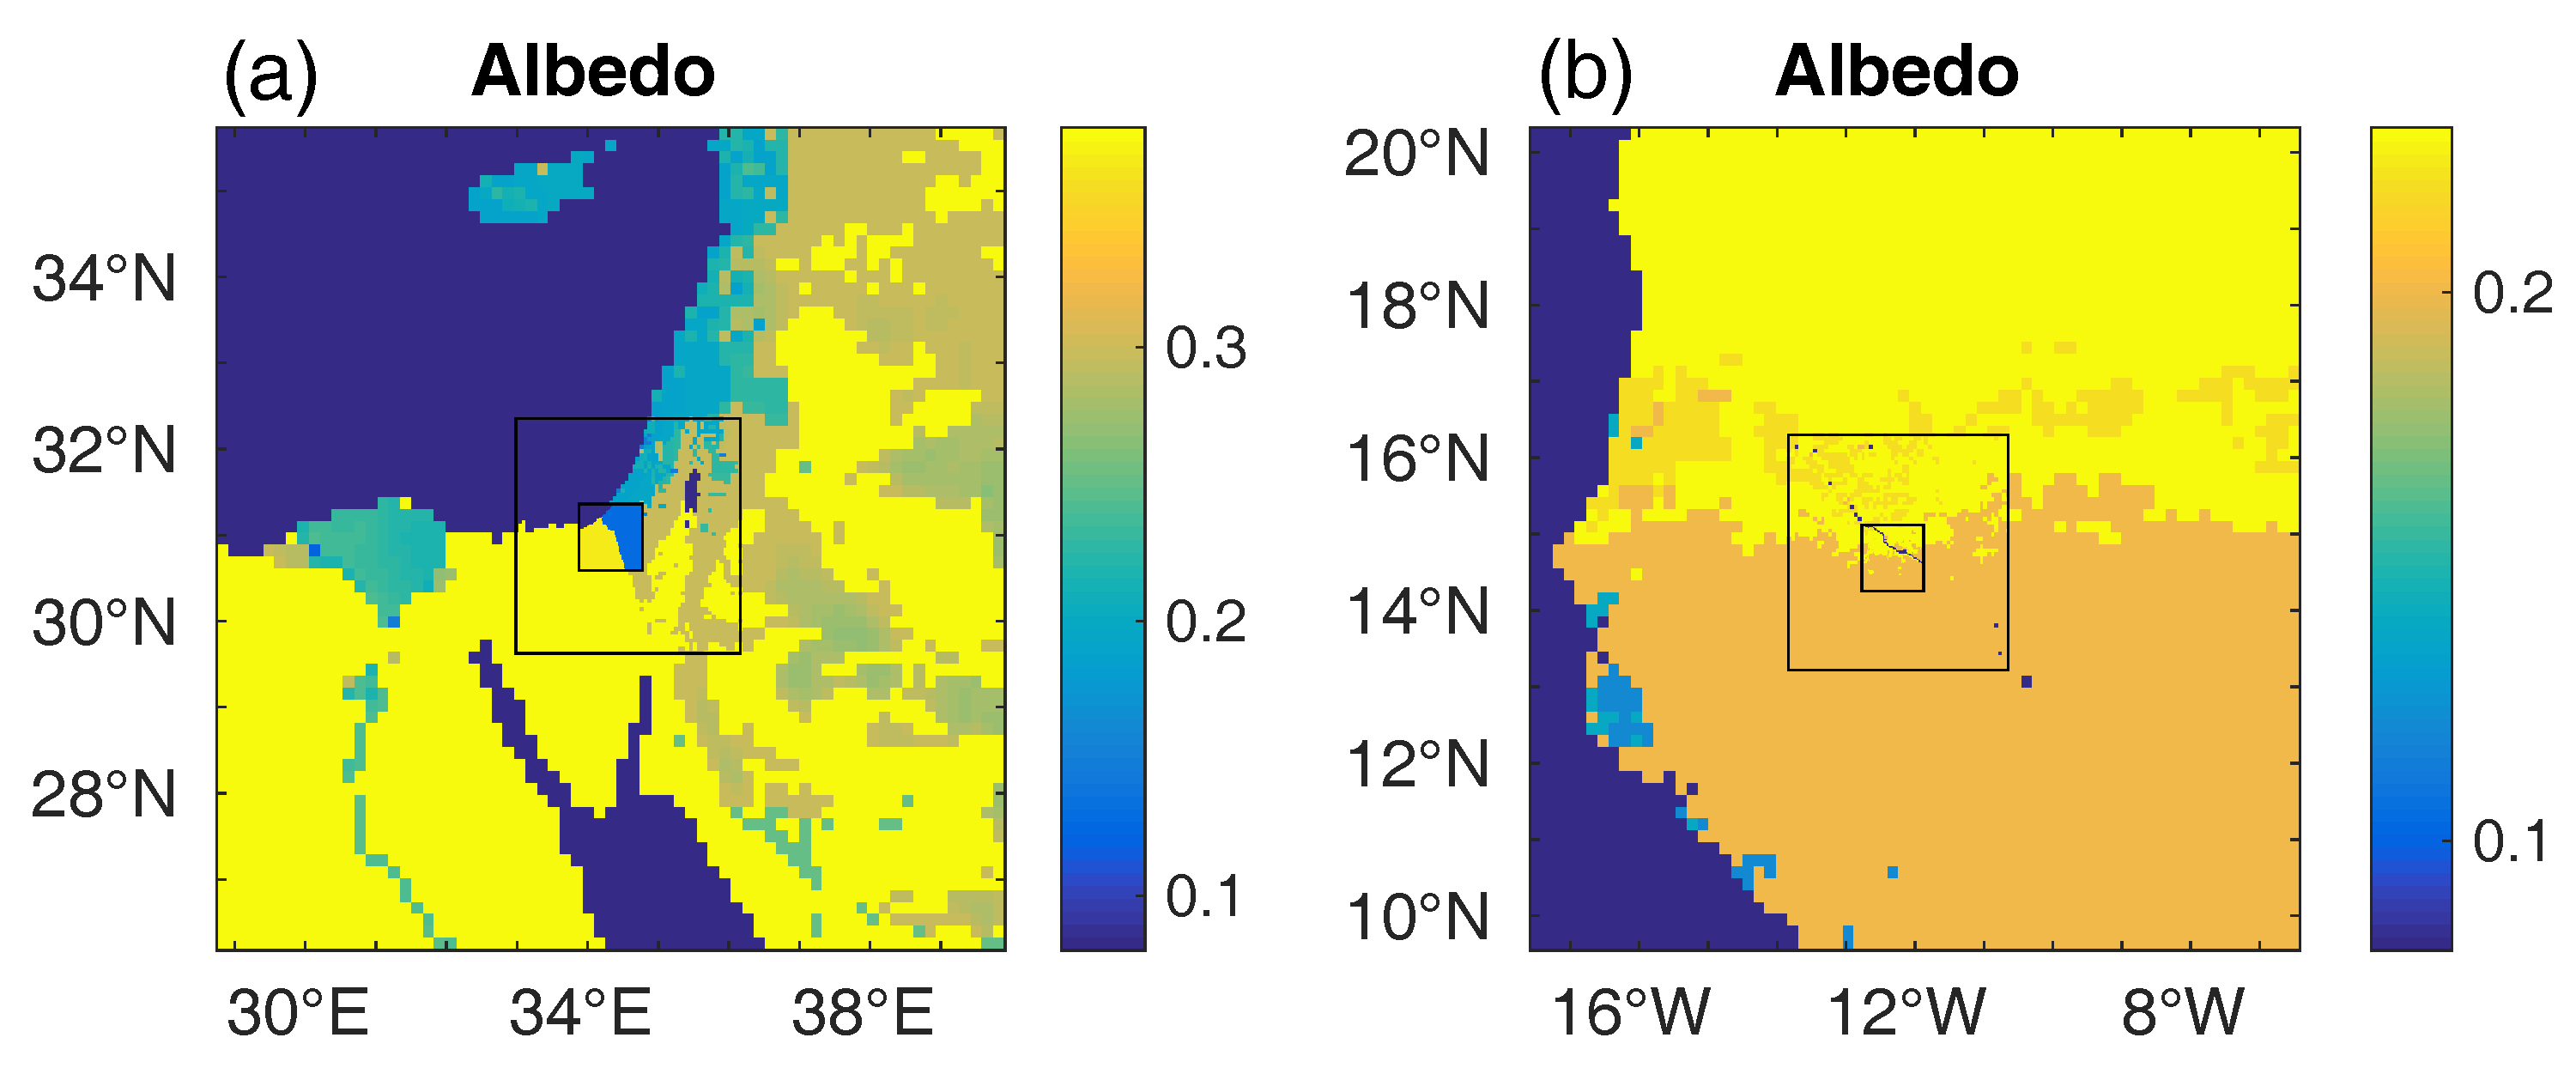
The first region we studied is centered in the northwestern Negev Desert, along the Israel-Egypt border. In this region, there is a noticeable albedo difference between the active dune Egyptian side and the fixed dune Israeli side (Figure 1a). The coarser grid resolution was ∼15.4 km, with 70 × 70 zonal and meridional grid points. The resolution of the second grid was ∼5.1 km and had 60 × 60 grid points in the zonal and meridional directions while the innermost grid had a resolution of 1.7 km with 50 × 50 grid points in the zonal and meridional directions. We studied two years, one with relatively weak winds (September 2004 to August 2005) and one with strong winds (September 2002 to August 2003).
The second region we studied is the Sahel/Sahara region (Figure 1b). We used similar grid resolutions as for the first region with ∼17.5 km, ∼5.8 km, and 1.9 km resolutions and 70 × 70, 60 × 60, and 50 × 50 grid points in the zonal and meridional directions. Here we simulated a 10-day episode, during a storm (17–27 January 1990). Ten days were sufficient to achieve convergence.
To study the effect of albedo difference across two neighboring regions, we ran the simulation using various prescribed albedo values in the regions. We assume that the mean albedo of the region remains the same while the albedo contrast between the two regions is changing; the mean albedo was chosen to be the average of vegetation albedo of 0.1 and bare sand albedo of 0.4, see below. Thus, the mean albedo of the two regions was where the albedo in the neighboring regions was where . We investigate both negative and positive as the background synoptic activity and nonlinear processes associated with it may break the expected symmetry around . This is a wide range of albedo and is used to study the effect of albedo difference under extreme albedo conditions. For the Israel-Egypt example, the country border line was chosen to be the albedo border line, and the albedo was changed only in the innermost grid (Figure 1a and Figure 2a). For the Sahel/Sahara case, the albedo border line was chosen to be 14.7 N, where here we repeated the numerical experiments when the albedo was changed, first only within the innermost grid and then in all three grids.
3. Results
We show the results of a particular numerical experiment from the Israel-Egypt border, where the albedo is low (0.13) on the Israeli side and high (0.37) on the Egyptian side. These values are in range of the albedo of vegetation (and biogenic crust), which, in most cases, is higher than 0.1, and the albedo of dry sand rarely exceeds 0.4 (see, e.g., [45,46]). Below we examine a range of albedo differences. In the current example, the albedo in the innermost grid (within which the simulations are the most realistic) is prescribed while the albedo values of the other grids remain unchanged (Figure 1a and Figure 2a). We show the results of the winter season (three winter months), from December 2002 to February 2003, during which the winds were relatively strong.
Figure 2b depicts the mean surface temperature (colors) and the mean wind field (arrows). The surface temperature over the vegetated/crusted Israeli (northern) region is higher by several degrees than the Egyptian (southern) bare dune region. This is a direct consequence of the lower albedo on the Israeli side that leads to greater absorption of solar radiation. In general, the weather during winter in this region is often affected by the Cyprus low system (e.g., [47,48]), which usually leads to southwesterly winds. The temperature contrast across the border enhances the winds over the vegetated and warmer Israeli side in comparison to the bare and colder Egyptian side (Figure 2b). This temperature difference leads to a pressure difference and hence to enhanced flow over the warmer Israeli region in which the air convects upward.
To visualize the effect of the albedo difference, we compared the results discussed above to results obtained when the albedo on both sides of the Israel-Egypt border is the same and equal to 0.25 (the mean albedo of the example discussed above). In Figure 2c, we present the difference between the surface temperature and the wind field shown in Figure 2b and the temperature and wind field of the run with the same albedo on both sides of the border. Clearly, the vegetated/crusted Israeli side is warmer than the Egyptian side by a few C, and the wind is stronger over the warmer Israeli side. These are the winter mean values; during the winter, the sand activity is strongest. Since the motivation of the present study is the dune activity, we also present the difference (relative to the run in which the albedo is the same on both sides of the Israel-Egypt border) in wind shear velocity (Figure 2d)—wind shear velocity is closely related to sand transport and is calculated by WRF using a logarithmic wind speed profile. The wind shear velocity is enhanced over the warmer, vegetated Israeli side and is suppressed over the colder, bare Egyptian side, indicating enhanced sand activity on the vegetated side. The shear velocity difference is small since we present the winter mean values—as mentioned above, the wind activity during winter in this region is dominated by a few storms while otherwise the wind is weak, leading to a small mean shear velocity. Yet, the winter storms can lead to enhanced sand activity; see the results below regarding the wind drift potential. As expected, the wind shear velocity difference over the sea is about zero.
We next systematically examined the effect of the albedo difference on the temperature and wind. Figure 3a,b depicts the surface (skin) temperature on the Israeli and Egyptian sides, from September to November and December to February in the years 2002–2003 and 2004–2005, as a function of the albedo difference between the Egyptian and Israeli sides; a specific example of this temperature is depicted in Figure 2b. In Figure 3c,d we plot surface air (2 m) temperature and, as expected, the albedo difference effect on the 2 m air temperature is smaller than the effect on the surface skin temperature. It is apparent that, in all cases, both the surface and air temperature increase, almost linearly, as the surface albedo decreases. Similar to the temperature, we plot in Figure 3e,f the mean wind (10 m height) speed, calculated by WRF, as a function of the Egypt-Israel albedo difference. Also here the relation is linear and the mean wind speed increases as the albedo decreases. This is true in both seasons and during years with both relatively strong and weak winds.
A common measure for the wind sand drift potential (DP) was suggested by [49] and is defined as
where U is the wind speed (in knots: 1 knot = 0.514 m/s) measured at a standard height of 10 m, and is the minimal threshold velocity (=12 knots) necessary for sand transport. The “” represents the temporal mean. The units of DP are vector units (VU) and, based on DP the wind energy can be classified into three categories: (i) low energy with ; (ii) intermediate energy with ; and (iii) high energy with . Due to the cubic dependence of DP on the wind speed, extreme wind events are much more dominant, and the dependence of DP on the albedo difference is not necessarily similar to the dependence of the wind speed U on . As for the temperature and wind speed, DP also depends linearly on the albedo difference, with increased wind activity over the low albedo region (Figure 4a,b). The effect of the albedo difference on DP can be drastic, in some cases doubling the DP. Note that the DP was much larger during the winter months due to winter storms. In addition, storms were stronger in the 2002–2003 winter season than in the 2004–2005 winter season, while during the fall (September to November), the wind was stronger in 2004. Also note that DP can be larger than zero, even if the seasonal mean wind speed (shown in Figure 3e,f) is smaller than the threshold velocity , as the DP is based on the mean of the cube of the wind speed and not on the cube of the mean wind speed.
The DP ignores the direction variability of the wind and the Resultant Drift Potential (RDP) together with the Resultant Drift Direction (RDD) provide some information about the wind direction. RDP is defined in a similar way to the DP, where , where is the wind direction and . RDD is defined as the ratio between RDP and DP, such that when the wind direction is constant in time () while otherwise it is less than 1. Smaller RDD indicates greater variability in wind direction. Figure 4c,d depict the RDP, and, as expected, is smaller than the DP (shown in Figure 4a,b). There is a significant difference between September to November, 2002 and September to November, 2004, where for the former the wind power (expressed by DP) is lower as well as the RDP. In addition, wind direction variability was larger during 2002. As for the winter months, the wind power during December 2002 to February 2003 was significantly larger than that of December 2004 to February 2005. Moreover, wind direction is relatively uniform during the winter months.
In the above example, the albedo changed only within the innermost grid that spans a region of approximately 70 × 70 km; we refrain from altering the albedo over all grids as the coarser ones are not appropriate for albedo changes (especially the northern regions that lacks sand areas). However, winds can intensify when the region is larger. To validate the results obtained for the Israel-Egypt border case and to study the albedo difference effect in a large domain size, we considered the example of the Sahara/Sahel for which we prescribed the albedo in the northern and southern parts of the domains (grids), first in the inner grid only and then in all three grids, changing the land albedo over the entire domain. We considered a 10-day episode (17–27 January 1990) during which strong winds were observed. In Figure 5, we show the DP as a function of the difference in albedo between the southern and the northern parts. When the albedo was changed only in the inner grid, the DP depended linearly on the albedo difference and increased (decreased) in the lower (higher) albedo region. When the albedo was changed in all three grids, the DP was up to twice as large as the results obtained when the albedo was prescribed only in the inner grid. Here, DP varied linearly in the southern part but, surprisingly, remained roughly constant in the northern region. It is possible that a simulation over the entire season may yield different, more linear relations.
In summary, albedo changes across neighboring regions led to large changes in DP, where DP increased linearly in the lower albedo (vegetated/crusted) region and decreased in the higher albedo (bare) region as a function of the albedo difference.
4. The Effect of Albedo Difference across Regions on Vegetation Cover
After establishing the linear relation between the DP and the albedo difference across two neighboring regions, we then studied the ways that this increased/decreased DP affects the vegetation cover, which, in turn, affects the albedo and hence the DP. For this purpose, we used the vegetation cover model of Yizhaq et al [42,43]. For the sake of clarity and simplicity, we used the simplest model version, i.e., the spatially independent model with an ordinary differential equation for vegetation cover, ignoring the effect of biogenic crust [50,51] and spatial dynamics [44].
Here we briefly describe the model and its coupling to winds. We assumed (i) two neighboring regions with specific albedo values and that (ii) the local wind DP is composed of background wind (associated with, for example, synoptic scale activity) plus a linear deviation in DP due to changes in albedo. That is, where is the drift potential attributed to background wind, is the albedo difference between the two regions, and is a parameter that quantifies the effect of the albedo difference on DP. The albedo in each region is the weighted mean of the relative cover of sand and vegetation within the region and is
for (the index of the two regions) and where is the known albedo of vegetation and sand. Thus,
and
where the upper “+” sign refers to the first region (“1”) and the lower “-” sign refers to the second region.
Once the of each region was determined (as a function of the difference in albedo or the difference in relative vegetation cover), we used the model for relative vegetation cover on sand dunes suggested in [42,43]:
where if ; otherwise . In addition, . For more details regarding the model’s construction and parameters, see [43].
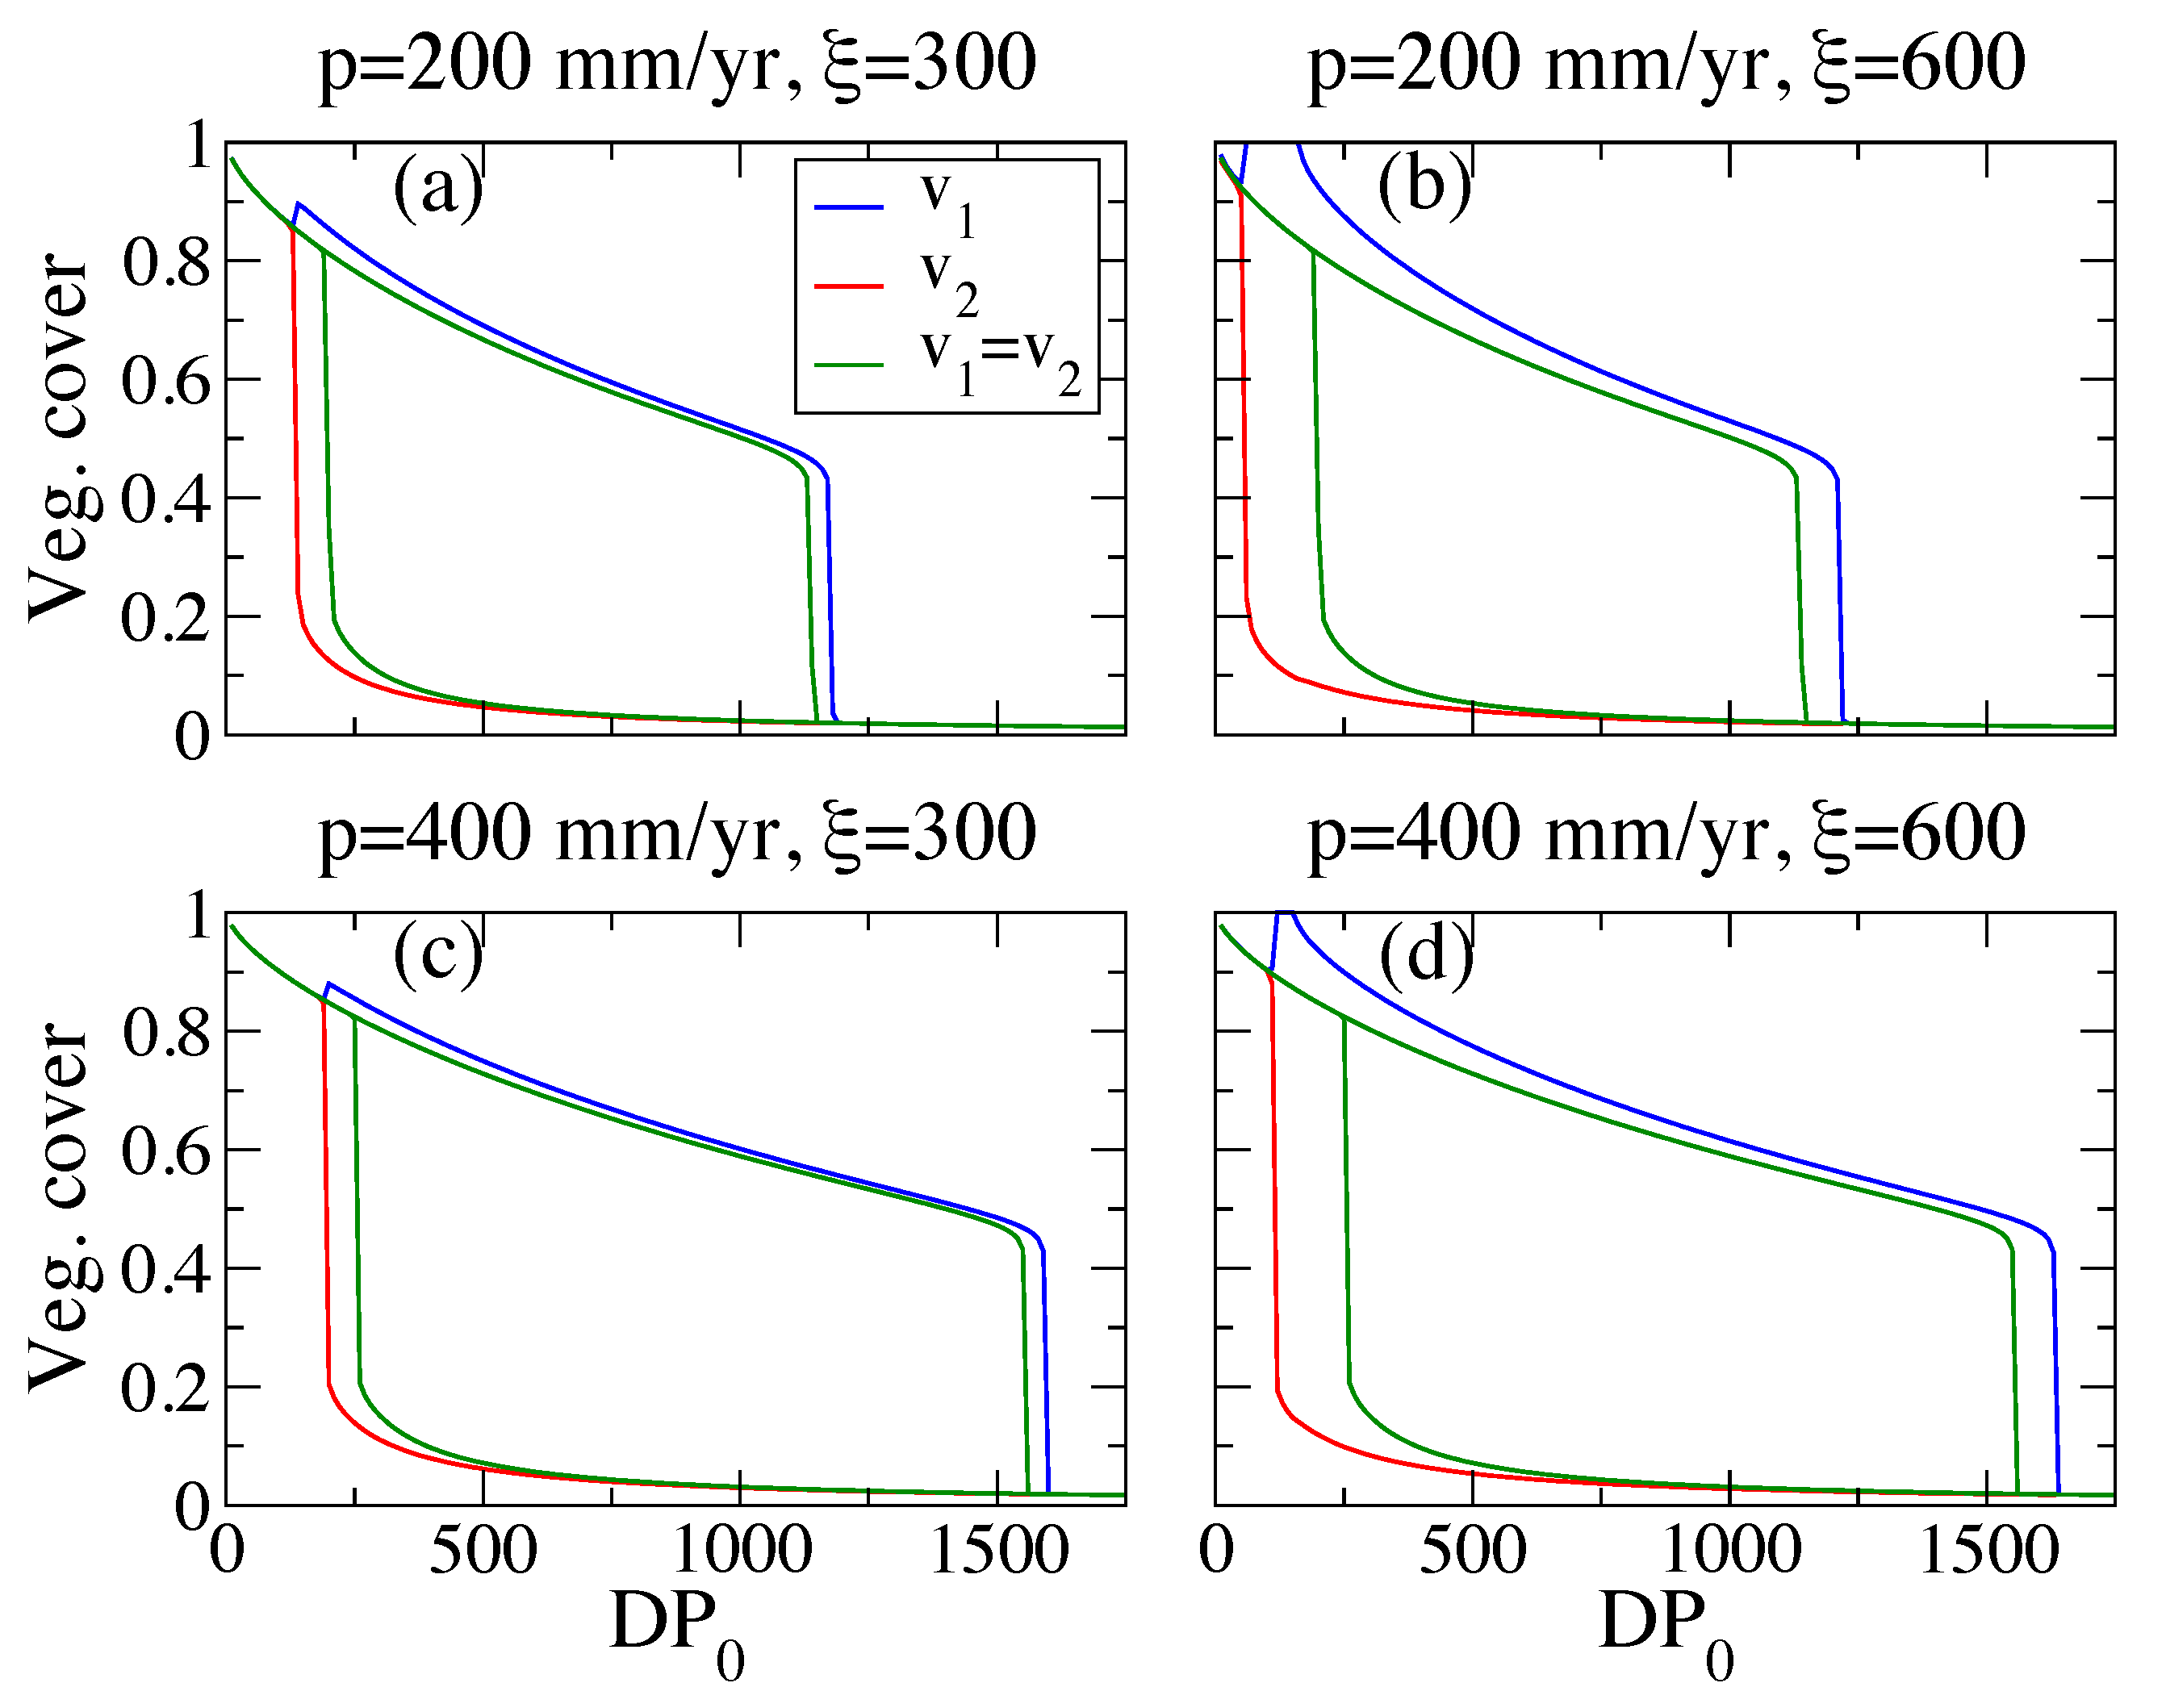
The coupling between the relative vegetation cover of the two areas, and , occurs through DP that depends on the vegetation cover difference, . Thus, when the vegetation cover in the two regions is equal (), one receives the steady state solution of one region. This solution is shown in Figure 6 (green curves) and exhibits bi-stability and hysteresis. Yet, other steady states do exist, and, as expected, these depend more on (see Equation (4)), the parameter that quantifies the effect of the albedo difference. The precipitation rate p affects the steady states less drastically (at least in the parameter regimes we examined). Basically, the coupling of the vegetation with the atmosphere (winds) “widens” the regime of hysteresis behavior, i.e., the range of bi-stability is larger; the vegetation cover of the fixed-dune (vegetated) state becomes larger while the bare-dune state becomes smaller. These new states are associated with the wind field that is different from the one obtained when the albedo difference feedback is ignored. They can also affect the surface temperature of these regions, altering the local climate.
With respect to the Egypt/Israel border case discussed in the previous section (shown in Figure 3 and Figure 4), the DP value are low (Figure 4a,b) and thus, under the current climate conditions, it is likely that the dunes there are associated with the fixed dune (more vegetated) state (see also, e.g., [43]).
5. Summary
Many places around the globe show regions of active bare dunes that border a region of fixed vegetated dunes (see, e.g., [42,43]). This difference in vegetation cover can lead to a difference in surface albedo that further enhances the wind activity on the vegetated side and weakens the wind activity on the bare side. This, in turn, can affect the vegetation cover, as vegetation can be suppressed (directly and indirectly) by the wind [42,43]. We studied this hypothesis in two steps. We first used a state-of-the-art atmospheric general circulation model, the WRF, to investigate how an albedo difference across regions affects local climate variables, such as surface wind and temperature; we found that surface temperature, wind speed, and wind drift potential (DP) in the lower albedo region increased linearly as a function of the albedo difference, and decreased linearly in the higher albedo region. We also found that this dependence intensified when the region in which the albedo changed was larger.
We then used this linear relation to study how the altered wind field affects the vegetation cover on sand dunes. For this purpose, we used a simple model for vegetation cover on sand dunes, and we found that the steady states of the model became more extreme (i.e., the vegetation cover of the vegetated state becomes larger while the vegetation cover of the bare state becomes smaller) and that the bi-stability and the hysteresis curve regime were extended. The altered vegetation cover states were associated with a new wind field.
We also examined the change in precipitation due to the albedo difference and found that it is not significant. In addition, for the sake of clarity, we restricted ourselves to a simple vegetation cover model and ignored spatial effects and biogenic crust dynamics. The inclusion of these effects may enrich and alter the dynamics of the front between vegetated and bare sand dune areas.
Local wind has a time scale that is much faster than the time scale of sand dunes. More specifically, winds converge to a statistical steady state (after altering the surface albedo) in a few days. Sand dunes have a much longer adjustment time, more than tens of years. This time scale separation allows us to easily couple the vegetation cover on sand dune model to the atmospheric winds, as in terms of the sand dune time scale, changes in dune cover instantly translated to changes in wind power (DP).
The coupled model we propose exhibits multiple steady states of active and fixed dunes. These were reported previously (e.g., [42]), but here, we link this bi-stability of sand dunes to the bi-stability of the local atmosphere. This atmospheric bi-stability influences and is influenced by the sand dune states, through the feedback mechanism we propose. We conjecture that such atmospheric bi-stability may have underlain past rapid changes in climate.
The mechanism we proposed here may be applicable to other climate systems. For example, a key component of the climate system is the high latitude sea ice, and many mechanisms in past and present day climate change were linked to sea ice dynamics (e.g., [52,53,54,55]). It is possible that the contrast between the open sea’s low albedo and the sea ice’s high albedo enhances the winds towards the sea, dragging the sea ice farther into the ocean. This mechanism may accelerate the rapid growth of the sea ice.
Acknowledgments
We thank the Israel Science Foundation (grants no. 156/16 and 75/12) for financial support. The code of the dune model is available upon request from the authors.
Author Contributions
Yosef Ashkenazy wrote the paper, prepare the figure, and constructed the simple vegetation cover model. Elad Shilo and Yosef Ashkenazy designed and run the WRF simulations.
Conflicts of Interest
The authors declare no conflict of interest.
References
- Bagnold, R.A. The Physics of Blown Sands and Desert Dunes; Chapmann and Hall: London, UK, 1941. [Google Scholar]
- Durán, O.; Herrmann, H.J. Vegetation against Dune Mobility. Phys. Rev. Lett. 2006, 97, 188001. [Google Scholar] [CrossRef] [PubMed]
- Nield, J.M.; Baas, A.C.W. Investigating parabolic and nebkha dune formation using a cellular automaton modelling approach. Earth Planet. Sci. Lett. 2008, 33, 724–740. [Google Scholar] [CrossRef]
- Danin, A. Plants of Desert Dunes; Springer: Berlin, Germany, 1996. [Google Scholar]
- Pye, K.; Tsoar, H. Aeolian Sand and Sand Dunes; Unwin Hyman: London, UK, 1990. [Google Scholar]
- Thomas, D.S.G.; Wiggs, G.F.S. Aeolian systems response to global change: Challenges of scale, process and temporal integration. Earth Surf. Process. Landf. 2008, 33, 1396–1418. [Google Scholar] [CrossRef]
- Knight, M.; Thomas, D.S.G.; Wiggs, G.F.S. Challenges of calculating dunefield mobility over the 21st century. Geomorphology 2004, 59, 197–213. [Google Scholar] [CrossRef]
- Dong, Z.; Chen, G.; He, X.; Han, Z.; Wang, X. Controlling blown sand along the highway crossing the Taklimakan Desert. J. Arid Environ. 2005, 57, 329–344. [Google Scholar] [CrossRef]
- Thomas, D.S.G.; Knight, M.; Wiggs, G.F.S. Remobilization of southern African desert dune systems by twenty-first century global warming. Nature 2005, 435, 1218–1221. [Google Scholar] [CrossRef] [PubMed]
- Tsoar, H. Sand dunes mobility and stability in relation to climate. Physica A 2005, 357, 50–56. [Google Scholar] [CrossRef]
- Ashkenazy, Y.; Yizhaq, H.; Tsoar, H. Sand dune mobility under climate change in the Kalahari and Australian deserts. Clim. Chang. 2012, 112, 901–923. [Google Scholar] [CrossRef]
- Charney, J.F. Dynamics of deserts and drought in the Sahel. Q. J. R. Meteorol. Soc. 1975, 101, 193–202. [Google Scholar] [CrossRef]
- Otterman, J.; Waisel, Y.; Rosenberg, E. Western Negev and Sinai ecosystems: Comparative study of vegetation, albedo, and temperatures. Agro-Ecosystems 1975, 2, 47–59. [Google Scholar] [CrossRef]
- Lauenroth, W.K. Grassland primary production: North American grasslands in perspective. In Perspective in Grassland Ecology; French, N.R., Ed.; Springer-Verlag: New York, NY, USA, 1979; Volume 32, pp. 3–24. [Google Scholar]
- Muhs, D.R.; Maat, P.B. The potential response of eolian sands to greenhouse warming and precipitation reduction on the Great Plains of the USA. J. Arid Environ. 1993, 25, 905–918. [Google Scholar] [CrossRef]
- Muhs, D.R.; Holliday, V.T. Evidence of active dune sand on the Great Plains in the 19th century from accounts of early explorers. Quat. Res. 1995, 43, 198–208. [Google Scholar] [CrossRef]
- Telfer, M.; Hesse, P. Palaeoenvironmental reconstructions from linear dunefields: Recent progress, current challenges and future directions. Quat. Sci. Rev. 2013, 78, 1–21. [Google Scholar] [CrossRef]
- Lancaster, N. Response of eolian geomorphic systems to minor climate change: Examples from the southern Californian deserts. Geomorphology 1997, 19, 333–347. [Google Scholar] [CrossRef]
- Marín, L.; Formana, S.L.; Valdez, A.; Bunch, F. Twentieth century dune migration at the Great Sand Dunes National Park and Preserve, Colorado, relation to drought variability. Geomorphology 2005, 70, 163–183. [Google Scholar] [CrossRef]
- Hugenholtz, C.H.; Wolfe, S.A. Biogeomorphic model of dunefield activation and stabilization on the northern Great Plains. Geomorphology 2005, 70, 53–70. [Google Scholar] [CrossRef]
- Watson, A.J.; Lovelock, J.E. Biological homeostasis of the global environment: The parable of Daisyworld. Tellus B 1983, 35, 286–289. [Google Scholar] [CrossRef]
- Otterman, J. Baring high-albedo soils by overgrazing: A hypothesized desertification mechanism. Science 1974, 186, 531–533. [Google Scholar] [CrossRef] [PubMed]
- Danin, A. Plant species diversity and plant succession in sandy area in the Northern Negev. Flora 1978, 167, 409–422. [Google Scholar] [CrossRef]
- Karnieli, A.; Tsoar, H. Spectral reflectance of biogenic crust developed on desert dune sand along the Israel-Egypt border. Int. J. Remote Sens. 1995, 16, 369–374. [Google Scholar] [CrossRef]
- Tsoar, H.; Goldsmith, V.; Schoenhaus, S.; Clarke, K.; Karnieli, A. Reversed desertification on sand dunes along the Sinai/Negev border. In Desert Aeolian Processes; Tchakerian, V.P., Ed.; Springer: Dordrecht, The Netherlands, 1995; pp. 251–267. [Google Scholar]
- Meir, A.; Tsoar, H. International borders and range ecology: The case of Bedouin transborder grazing. Hum. Ecol. 1996, 24, 39–64. [Google Scholar] [CrossRef]
- Sud, Y.; Molod, A. The roles of dry convection, cloud-radiation feedback processes and the influence of recent imrpovements in the parameterization of convection in the GLA GCM. Mon. Weather Rev. 1988, 116, 2366–2387. [Google Scholar] [CrossRef]
- Xue, Y.; Shukla, J. The influence of land surface properties on Sahel climate. Part 1: Desertification. J. Clim. 1993, 6, 2232–2245. [Google Scholar] [CrossRef]
- Balling, R.C. The climatic impact of a Sonoran vegetation discontinuity. Clim. Chang. 1988, 13, 99–109. [Google Scholar] [CrossRef]
- Bryant, N.A.; Johnson, L.F.; Brazel, A.J.; Balling, R.C.; Hutchinson, C.F.; Beck, L.R. Measuring the effect of overgrazing in the Sonoran Desert. Clim. Chang. 1990, 17, 243–264. [Google Scholar] [CrossRef]
- Otterman, J. Anthropogenic impact on the surface at the Earth. Clim. Chang. 1977, 1, 137–155. [Google Scholar] [CrossRef]
- Otterman, J. Satellite and field studies of man’s impact on the surface in arid regions. Tellus 1981, 33, 68–77. [Google Scholar] [CrossRef]
- Nicholson, S.E. Climatic and environmental change in Africa during the last two centuries. Clim. Res. 2001, 17, 123–144. [Google Scholar] [CrossRef]
- Nicholson, S.E.; Tucker, C.J.; Ba, M. Desertification, drought, and surface vegetation: An example from the West African Sahel. Bull. Am. Meteorol. Soc. 1998, 79, 815–829. [Google Scholar] [CrossRef]
- Claussen, M. Late Quaternary vegetation-climate feedbacks. Clim. Past Discuss. 2009, 5, 635–670. [Google Scholar] [CrossRef]
- Brovkin, V.; Bendtsen, J.; Claussen, M.; Ganopolski, A.; Kubatzki, C.; Petoukhov, V.; Andreev, A. Carbon cycle, vegetation, and climate dynamics in the Holocene: Experiments with the CLIMBER-2 model. Glob. Biogeochem. Cycles 2002, 16. [Google Scholar] [CrossRef]
- Schurgers, G.; Mikolajewicz, U.; Gröger, M.; Maier-Reimer, E.; Vizcaíno, M.; Winguth, A. Dynamics of the terrestrial biosphere, climate and atmospheric CO2 concentration during interglacials: A comparison between Eemian and Holocene. Clim. Past 2006, 2, 205–220. [Google Scholar] [CrossRef]
- Knorr, W.; Schnitzler, K.G. Enhanced albedo feedback in North Africa from possible combined vegetation and soil-formation processes. Clim. Dyn. 2006, 26, 55–63. [Google Scholar] [CrossRef]
- Claussen, M. On coupling global biome models with climate models. Clim. Res. 1994, 4, 203–221. [Google Scholar] [CrossRef]
- Claussen, M. Modeling biophysical feedback in the African and Indian Monsoon region. Clim. Dyn. 1997, 13, 247–257. [Google Scholar] [CrossRef]
- Skamarock, W.C.; Klemp, J.B.; Dudhia, J.; Gill, D.O.; Barker, D.M.; Duda, M.G.; Huang, X.Y.; Wang, W.; Powers, J.G. A Description of the Advanced Research WRF Version 3; NCAR Tech. Note NCAR/TN-475+STR; National Center for Atmospheric Research: Boulder, CO, USA, 2008. [Google Scholar]
- Yizhaq, H.; Ashkenazy, Y.; Tsoar, H. Why do active and stabilized dunes coexist under the same climatic conditions? Phys. Rev. Lett. 2007, 98, 188001. [Google Scholar] [CrossRef] [PubMed]
- Yizhaq, H.; Ashkenazy, Y.; Tsoar, H. Sand dune dynamics and climate change: A modeling approach. J. Geophys. Res. 2009, 114, F01023. [Google Scholar] [CrossRef]
- Yizhaq, H.; Ashkenazy, Y.; Levin, N.; Tsoar, H. Spatiotemporal model for the progression of transgressive dunes. Physica A 2013, 392, 4502–4515. [Google Scholar] [CrossRef]
- Wendler, G.; Eaton, F. On the desertification of the Sahel zone. Clim. Chang. 1983, 5, 365–380. [Google Scholar] [CrossRef]
- Hartmann, D. Global Physical Climatology; Academic Press: San Diego, CA, USA, 1994; p. 409. [Google Scholar]
- Goldreich, Y. The Climate of Israel: Observation, Research and Application; Kluwer Academic: New York, NY, USA, 2003. [Google Scholar]
- Alpert, P.; Osetinsky, I.; Ziv, B.; Shafir, H. Semi-objective classification for daily synoptic systems: Application to the eastern Mediterranean climate change. Int. J. Climatol. 2004, 24, 1001–1011. [Google Scholar] [CrossRef]
- Fryberger, S.G. Dune forms and wind regime. In A Study of Global Sand Seas; McKee, E.D., Ed.; U.S. Geological Survey: Washington, DC, USA, 1979; Volume 1052, pp. 137–169. [Google Scholar]
- Kinast, S.; Meron, E.; Yizhaq, H.; Ashkenazy, Y. Biogenic crust dynamics on sand dunes. Phys. Rev. E 2013, 87, 020701(R). [Google Scholar] [CrossRef] [PubMed]
- Yizhaq, H.; Ashkenazy, Y. Oscillations in biocrust-vegetation dynamics on sand dunes. Aeolian Res. 2016, 20, 35–44. [Google Scholar] [CrossRef]
- Gildor, H.; Tziperman, E. Sea ice as the glacial cycles climate switch: Role of seasonal and orbital forcing. Paleoceanography 2000, 15, 605–615. [Google Scholar] [CrossRef]
- Johannessen, O.M.; Bengtsson, L.; Miles, M.W.; Kuzmina, S.I.; Semenov, V.A.; Alekseev, G.V.; Nagurnyi, A.P.; Zakharov, V.F.; Bobylev, L.P.; Pettersson, L.H.; et al. Arctic climate change: Observed and modelled temperature and sea-ice variability. Tellus A 2004, 56, 328–341. [Google Scholar] [CrossRef]
- Ashkenazy, Y.; Tziperman, E. Are the 41 kyr glacial oscillations a linear response to Milankovitch forcing? Quat. Sci. Rev. 2004, 23, 1879–1890. [Google Scholar] [CrossRef]
- Li, C.; Battisti, D.; Schrag, D.; Tziperman, E. Abrupt climate shifts in Greenland due to displacements of the sea ice edge. Geophys. Res. Lett. 2005, 32, L19702. [Google Scholar] [CrossRef]
Figure 1.
(a) The surface albedo of the eastern Mediterranean region. This is the coarser grid region that was used in the Weather Research and Forecasting (WRF) simulation, whereas the other two finer inner grids are indicated by the inner black rectangles. (b) Same as (a) for the second WRF run, over the Sahara/Sahel region.

Figure 2.
Results of the WRF simulation (averaged over December 2002 to February 2003) over the finest (inner) grid (Figure 1a), for which the albedo on the Israeli side is 0.13, while the albedo on the Egyptian side is 0.37. (a) Surface albedo. (b) Surface temperature (color) and 10 m wind (vectors). (c) The difference between the results presented in panel (b) and a control run for which the surface albedo on both the Israeli and the Egyptian sides is equal to 0.25. (d) The difference in winter mean shear velocity between the simulation in which the albedo is 0.13 and 0.37 on the Israeli and Egyptian sides and the control run for which the albedo on both sides is equal to 0.25. Note the increased temperature and wind activity on the vegetated (Israeli) side and the decrease on the bare dune side.
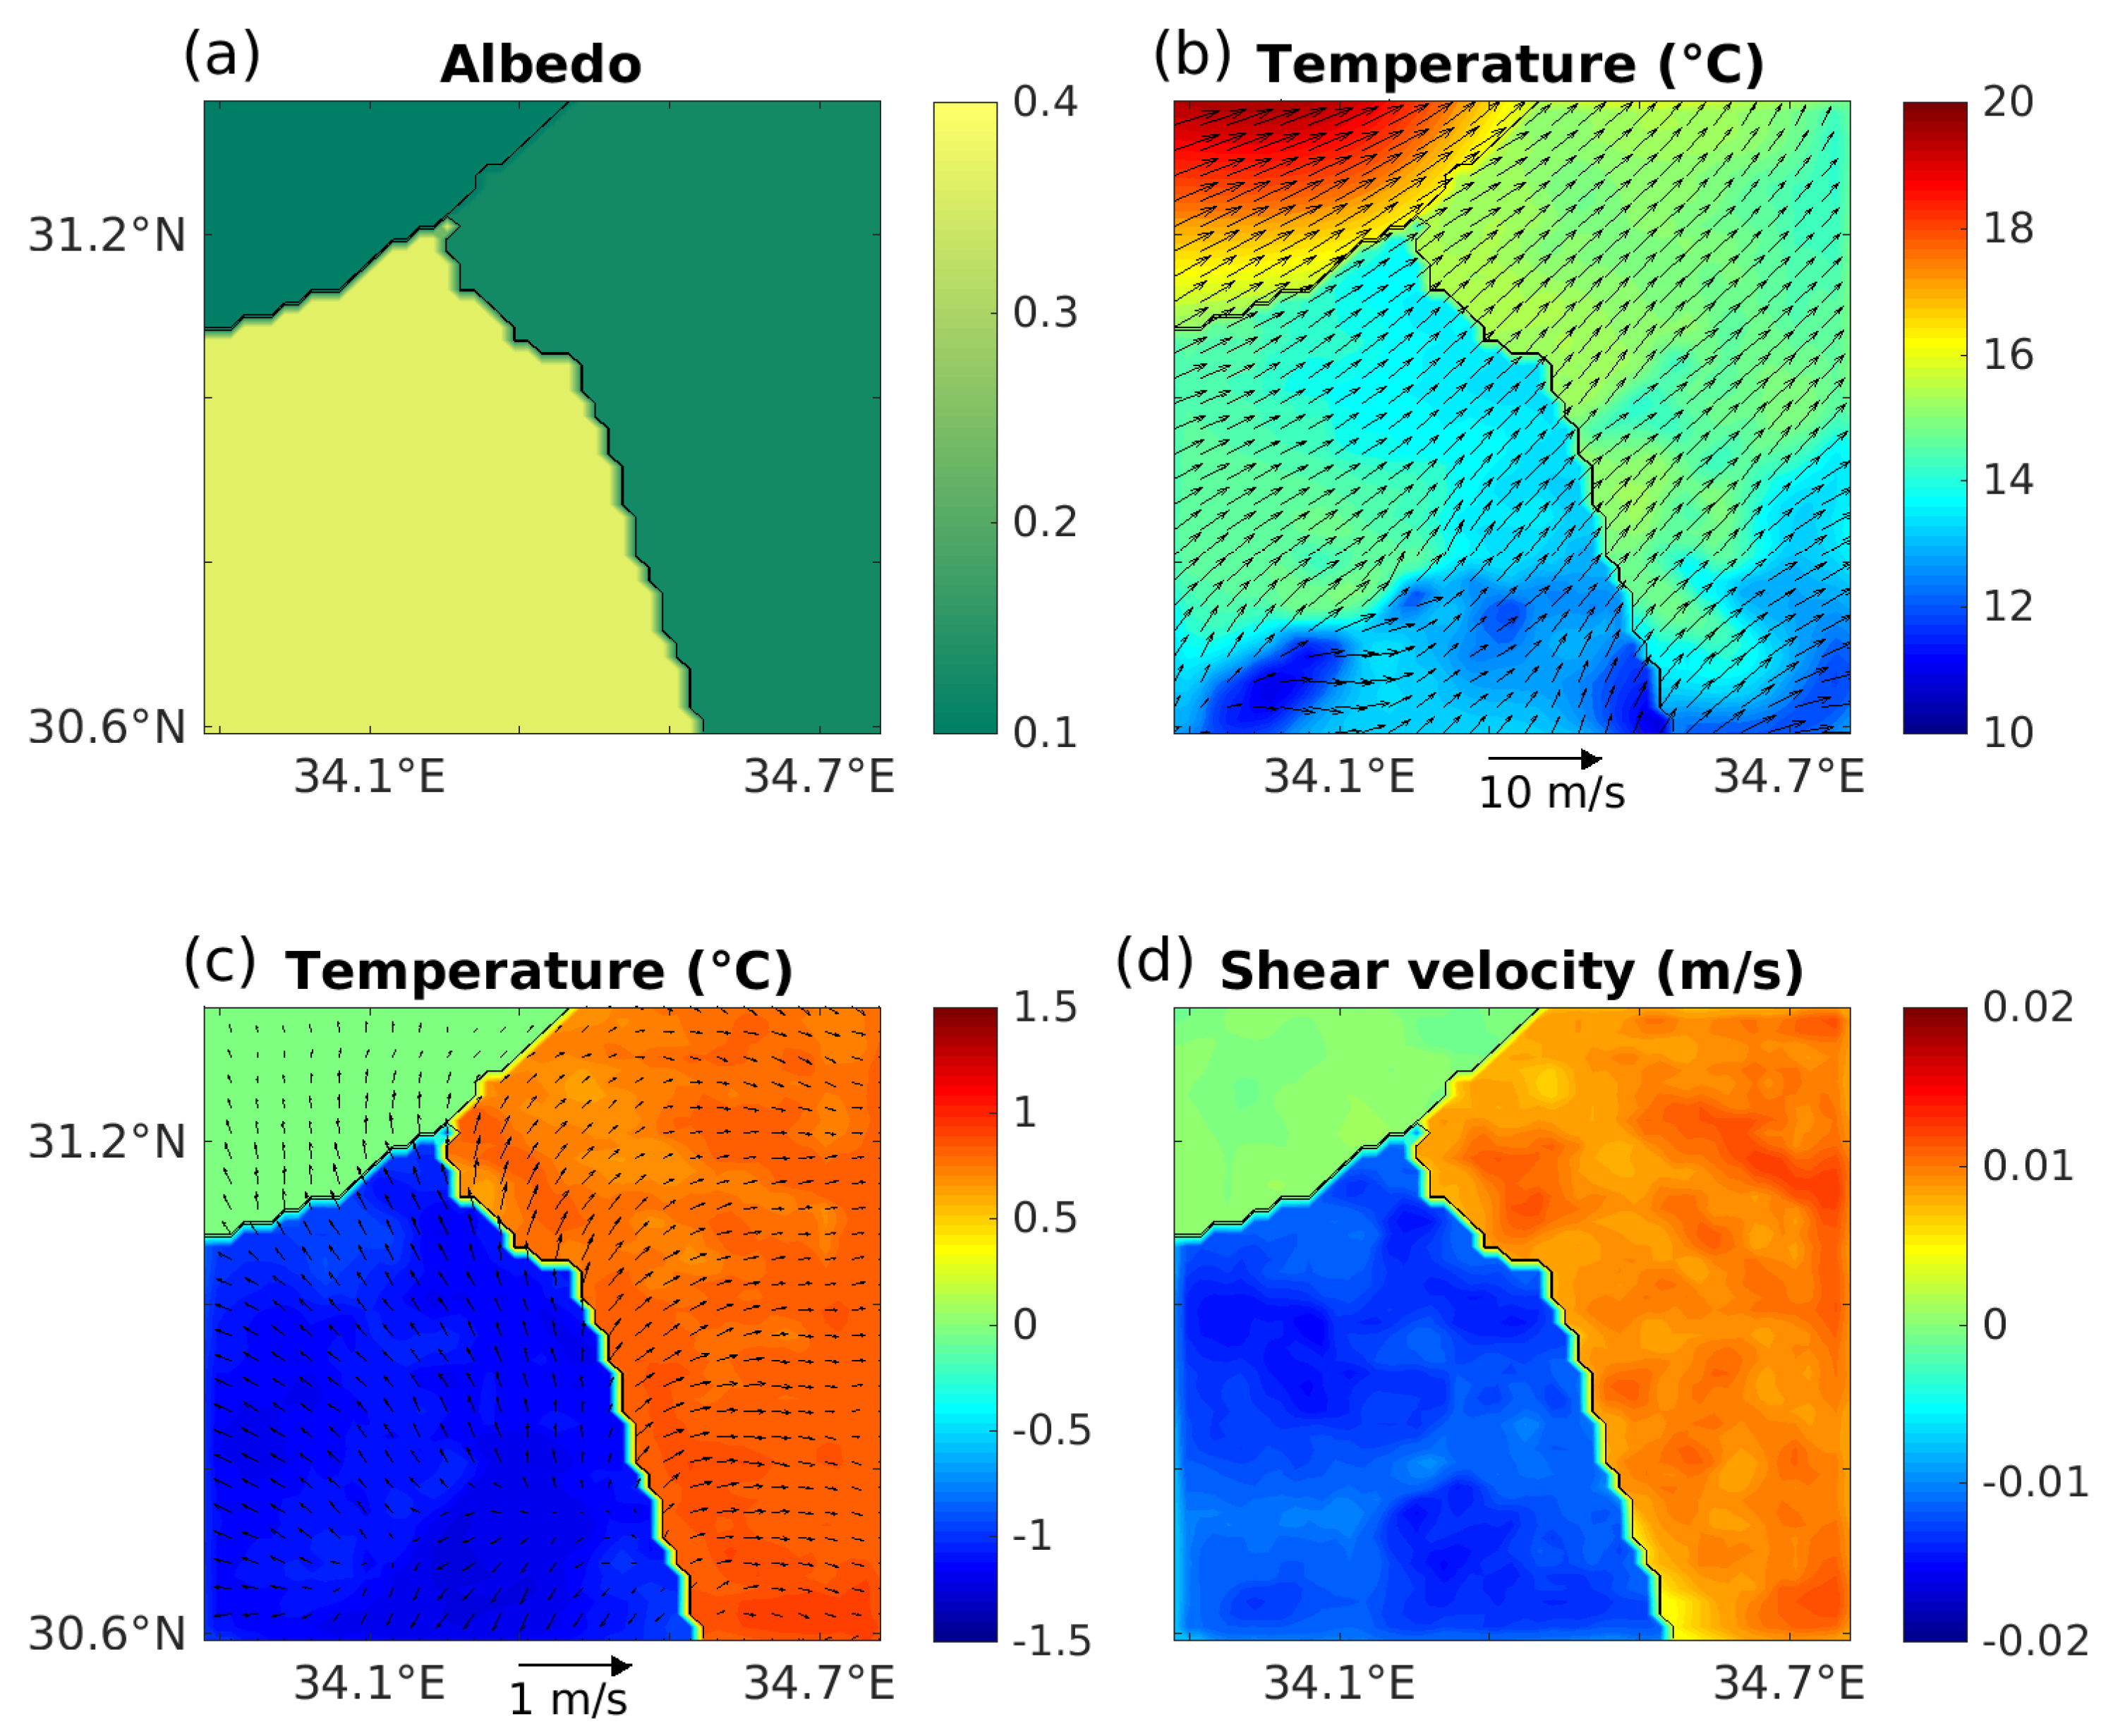
Figure 3.
Summary of the WRF simulations averaged spatially on the Egyptian (squares) and Israeli (circles) sides of the inner grid (Figure 1a) and averaged temporally over September to November (left panels) and December to February (right panels) for the years 2002 (red) and 2004 (black). The observed winds were relatively strong during 2002 and relatively weak during 2004. (a,b) Skin (ground) temperature; (c,d) Surface air (2 m height) temperature; and (e,f) 10 m wind speed as a function of the albedo difference between the Egyptian and Israeli sides. Note the almost linear relation in almost all curves, indicating a higher temperature and increased wind activity on the vegetated side.
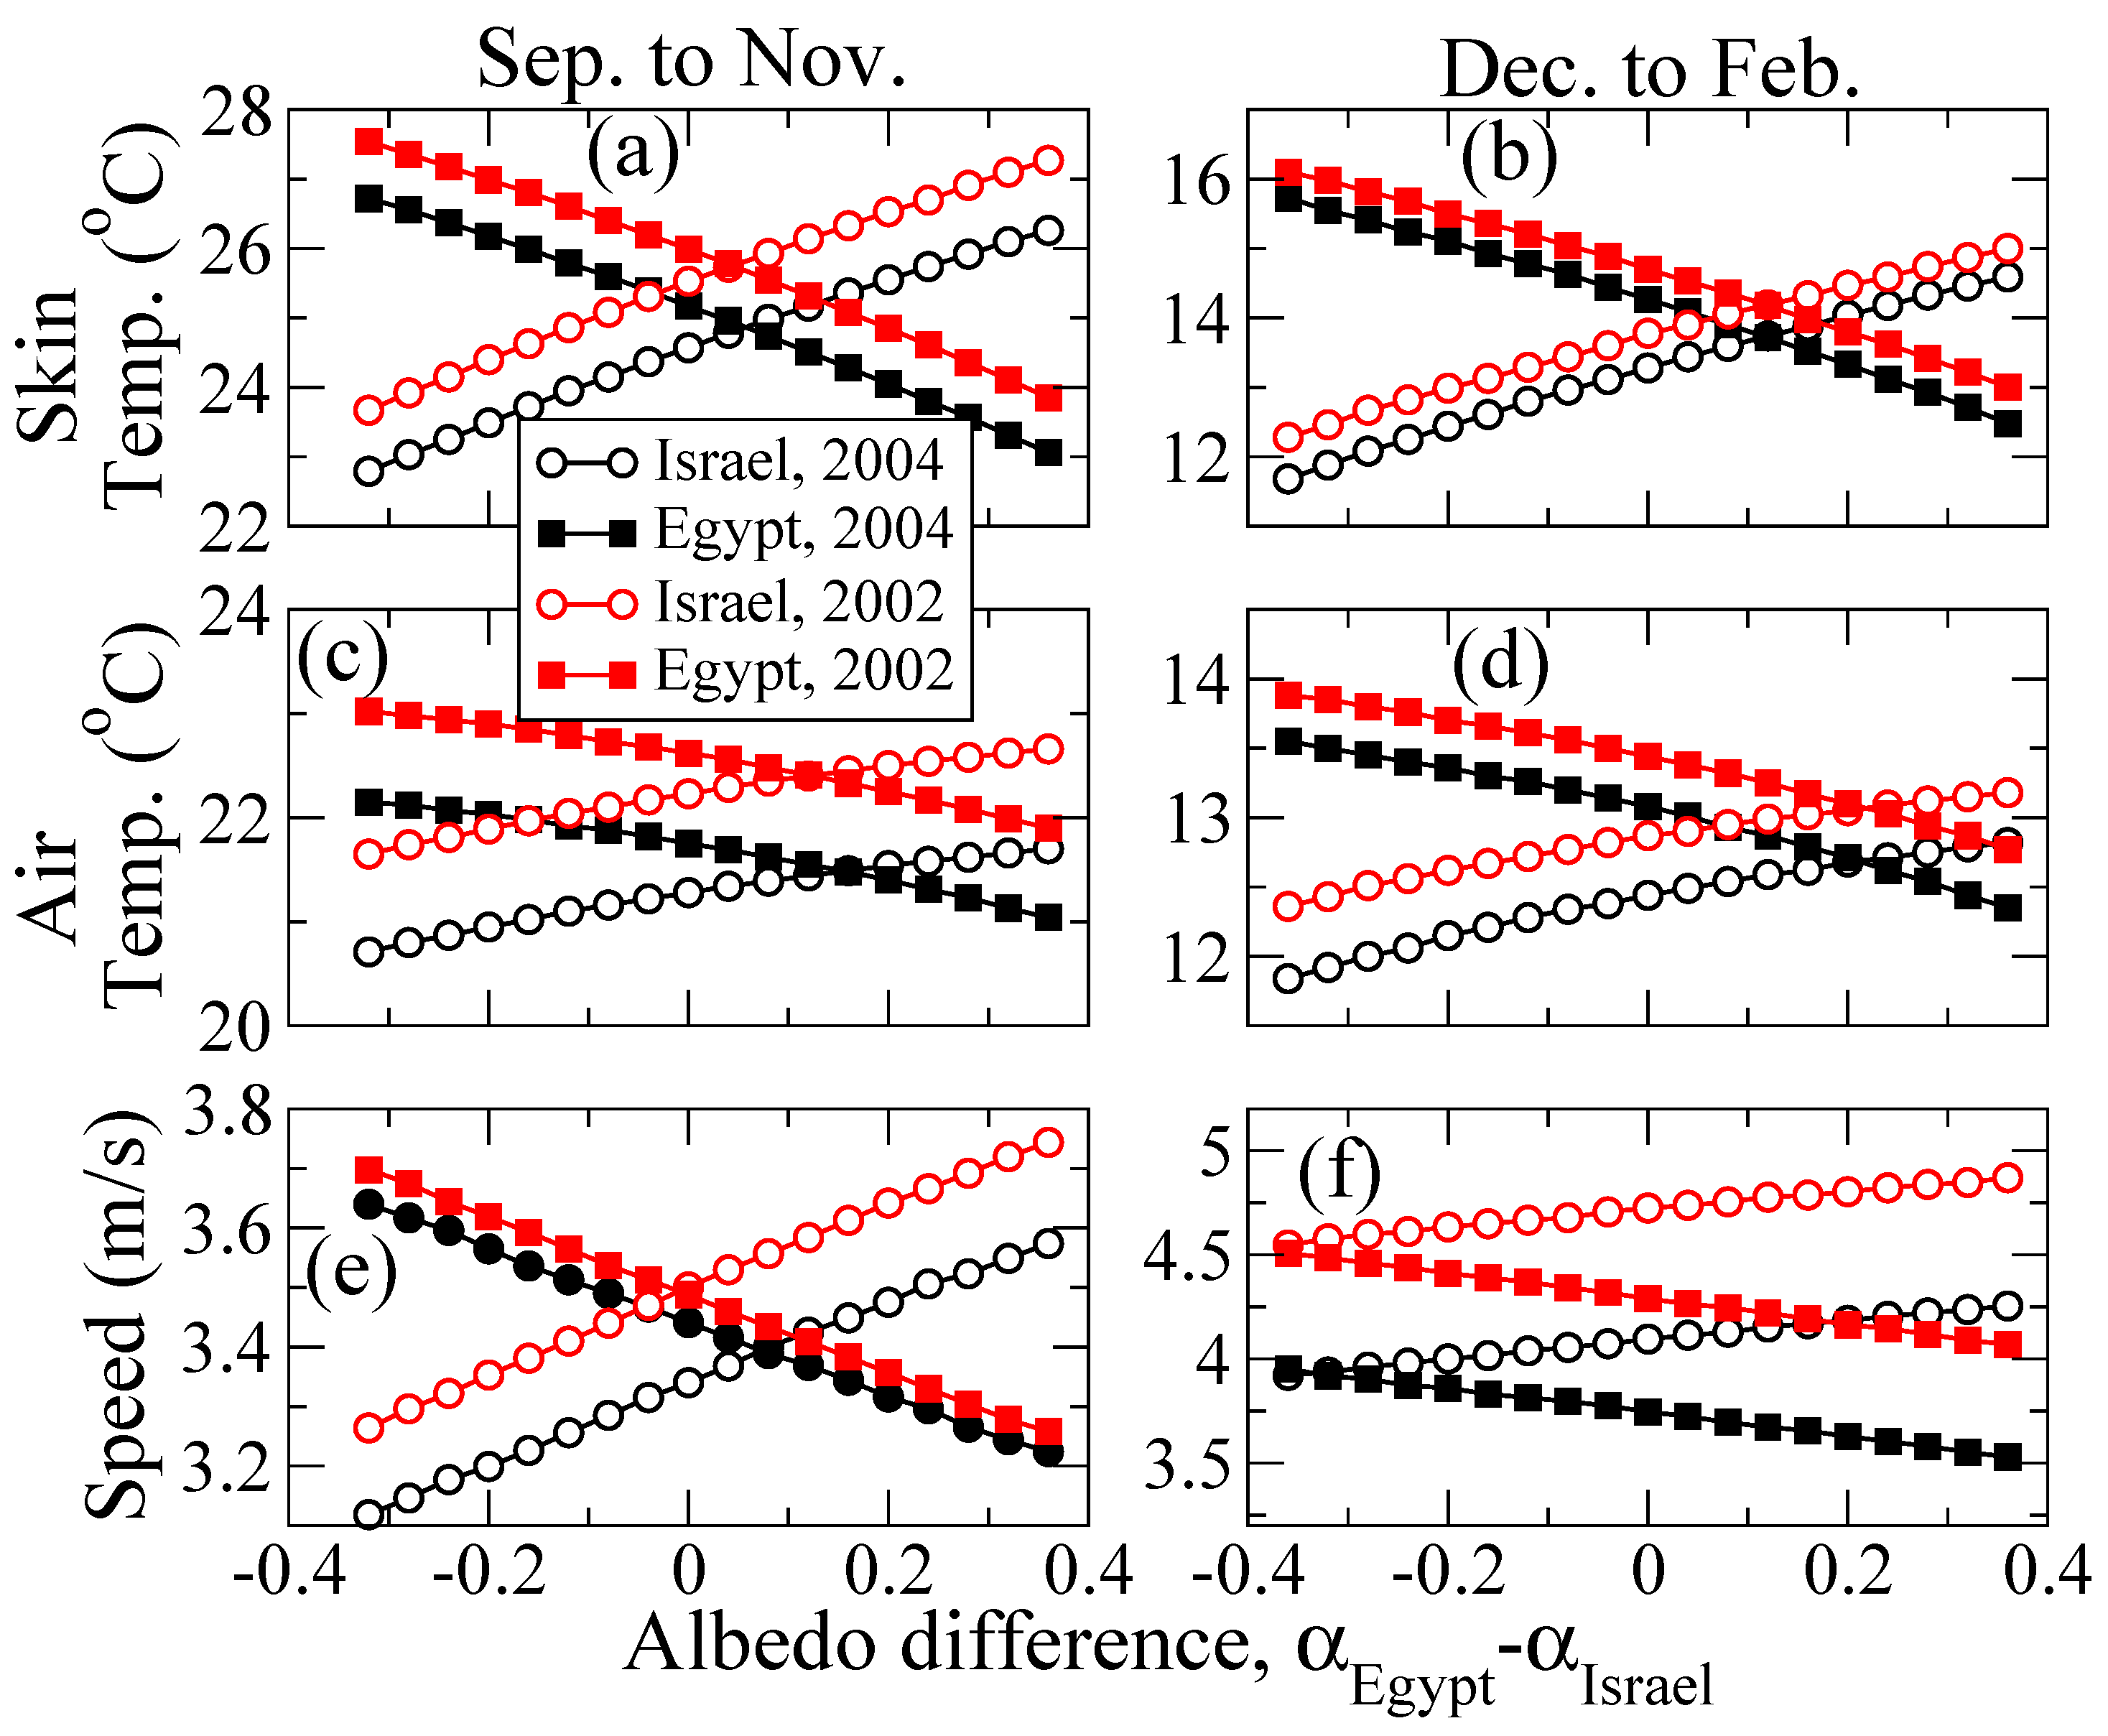
Figure 4.
Same as Figure 3 for the (a,b) wind drift potential (DP); (c,d) resultant drift potential (RDP), and (e,f) resultant drift direction (RDD).
Figure 4.
Same as Figure 3 for the (a,b) wind drift potential (DP); (c,d) resultant drift potential (RDP), and (e,f) resultant drift direction (RDD).
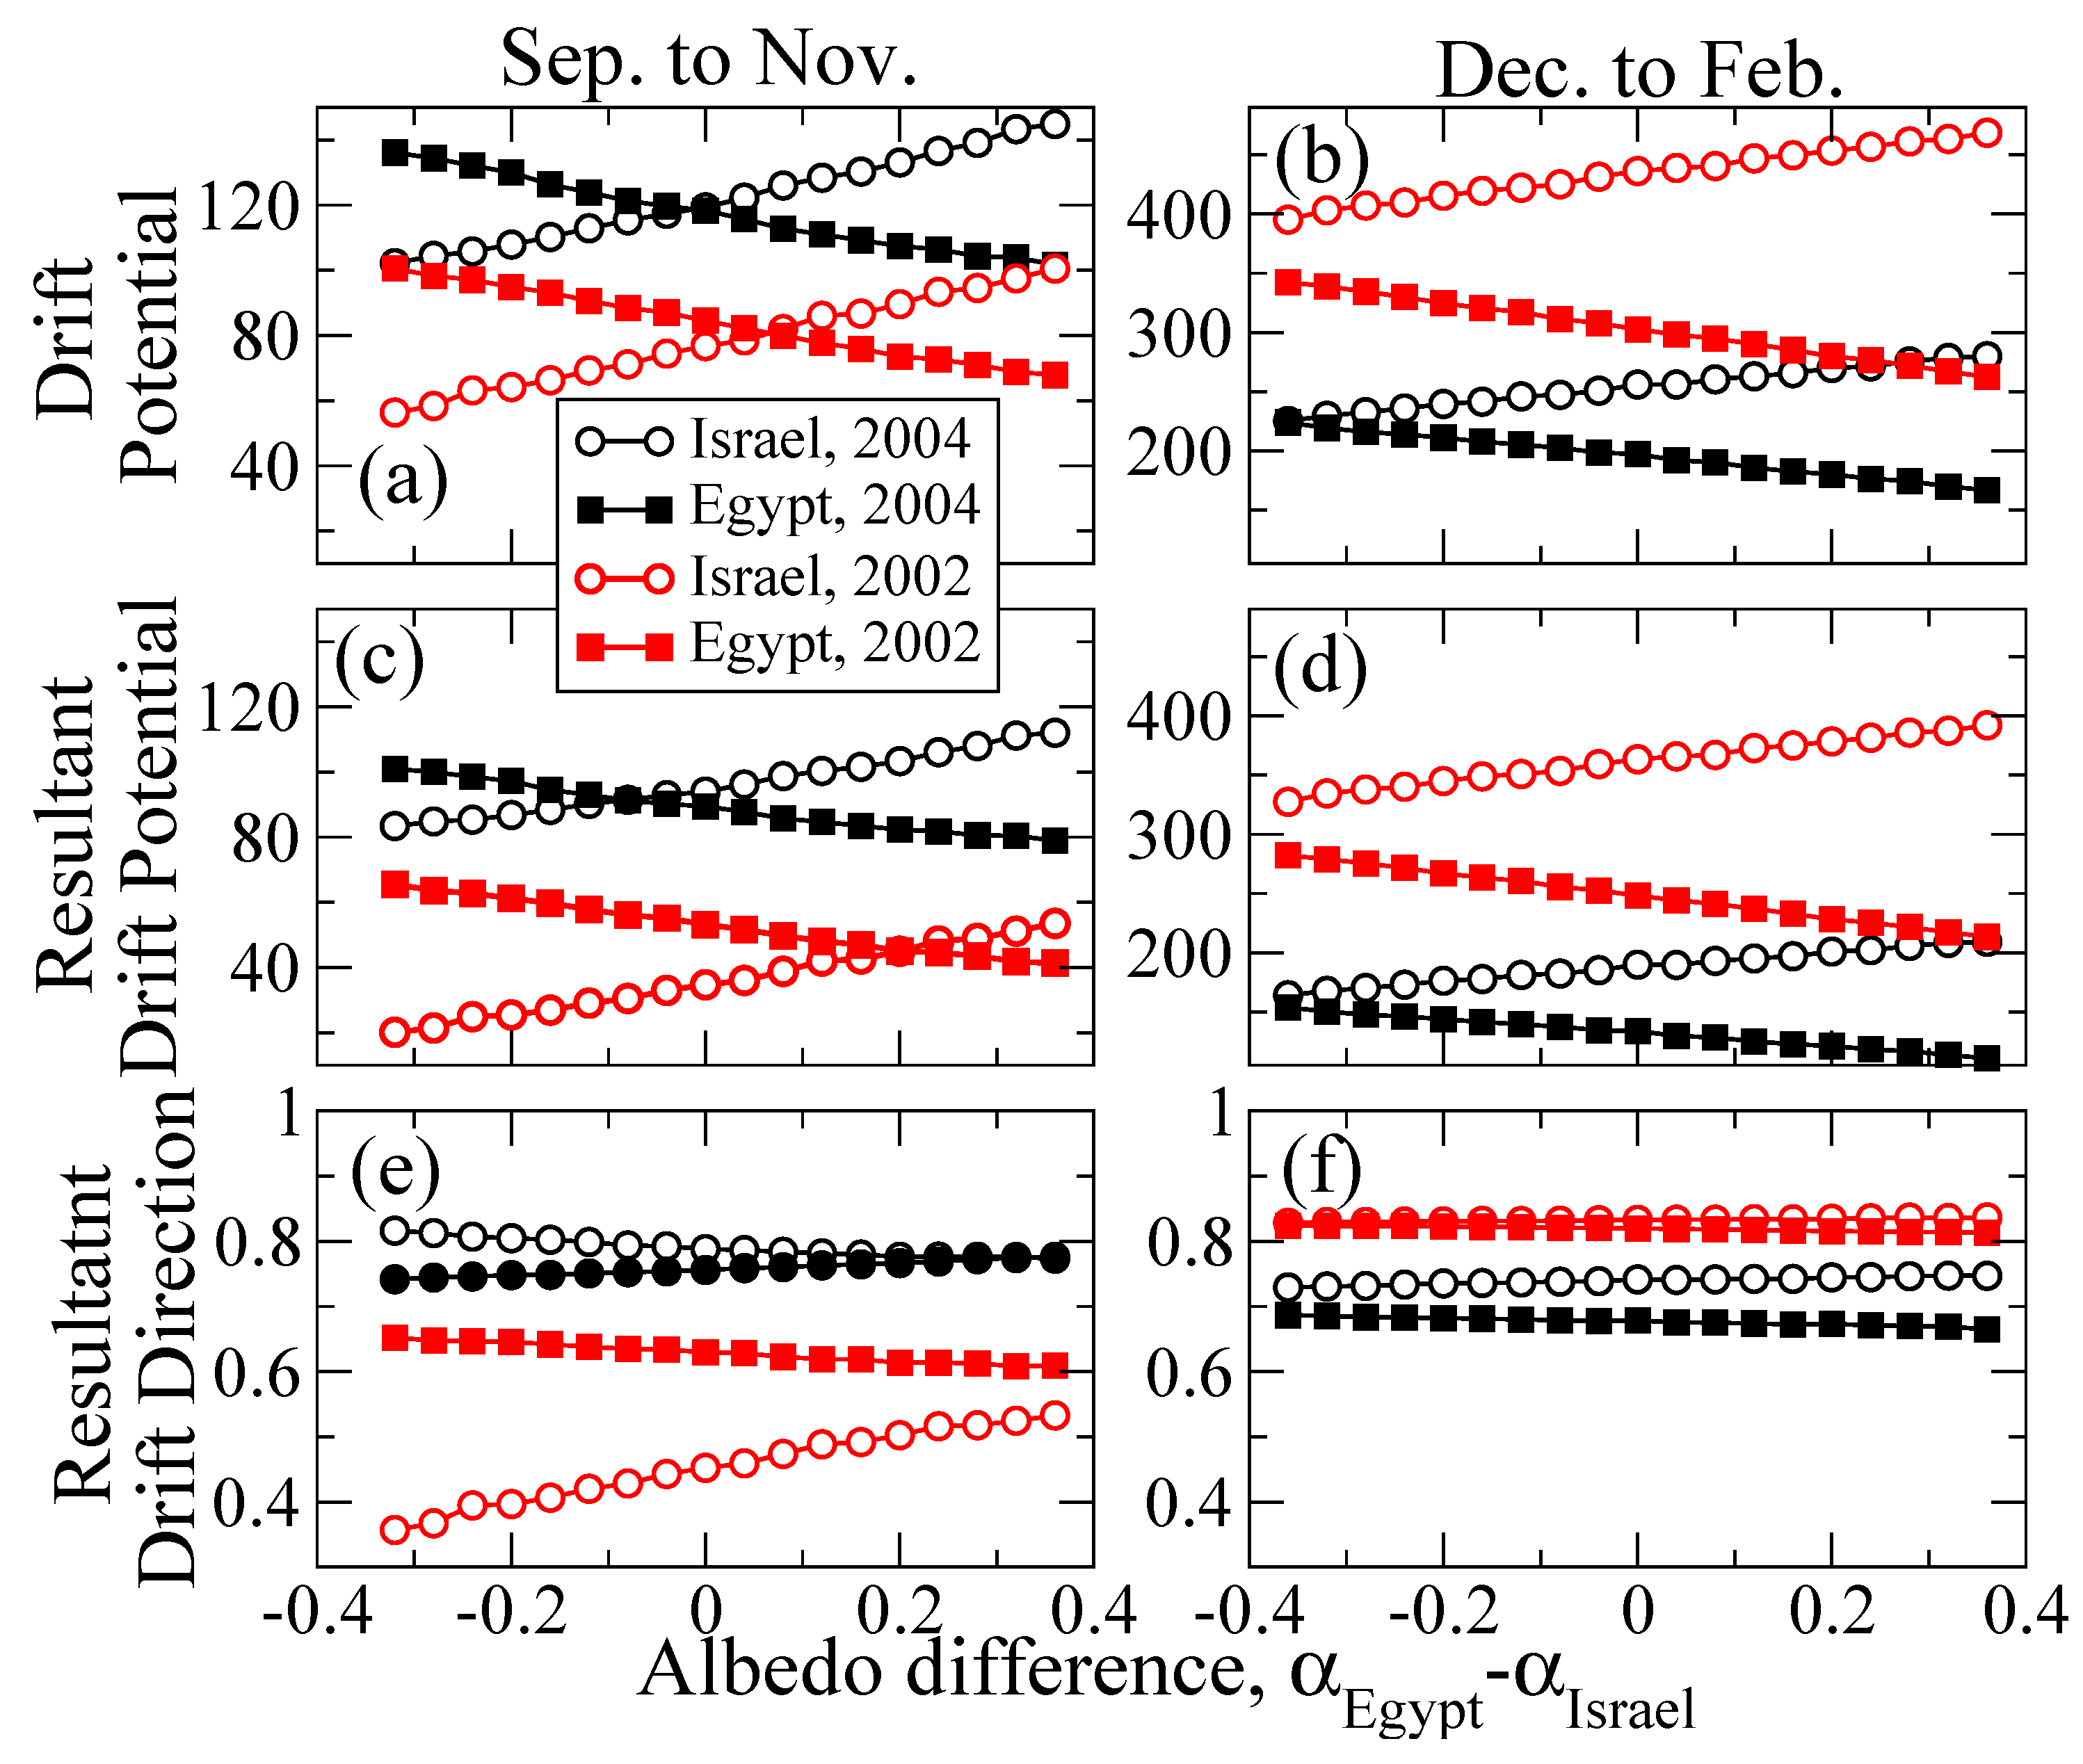
Figure 5.
Wind drift potential (DP) as a function of the prescribed albedo difference between the southern (Sahel, squares) and northern (Sahara, circles) regions (Figure 1b), when the albedo was changed only within the innermost grid (red) and when the albedo was changed in all three grids (black).
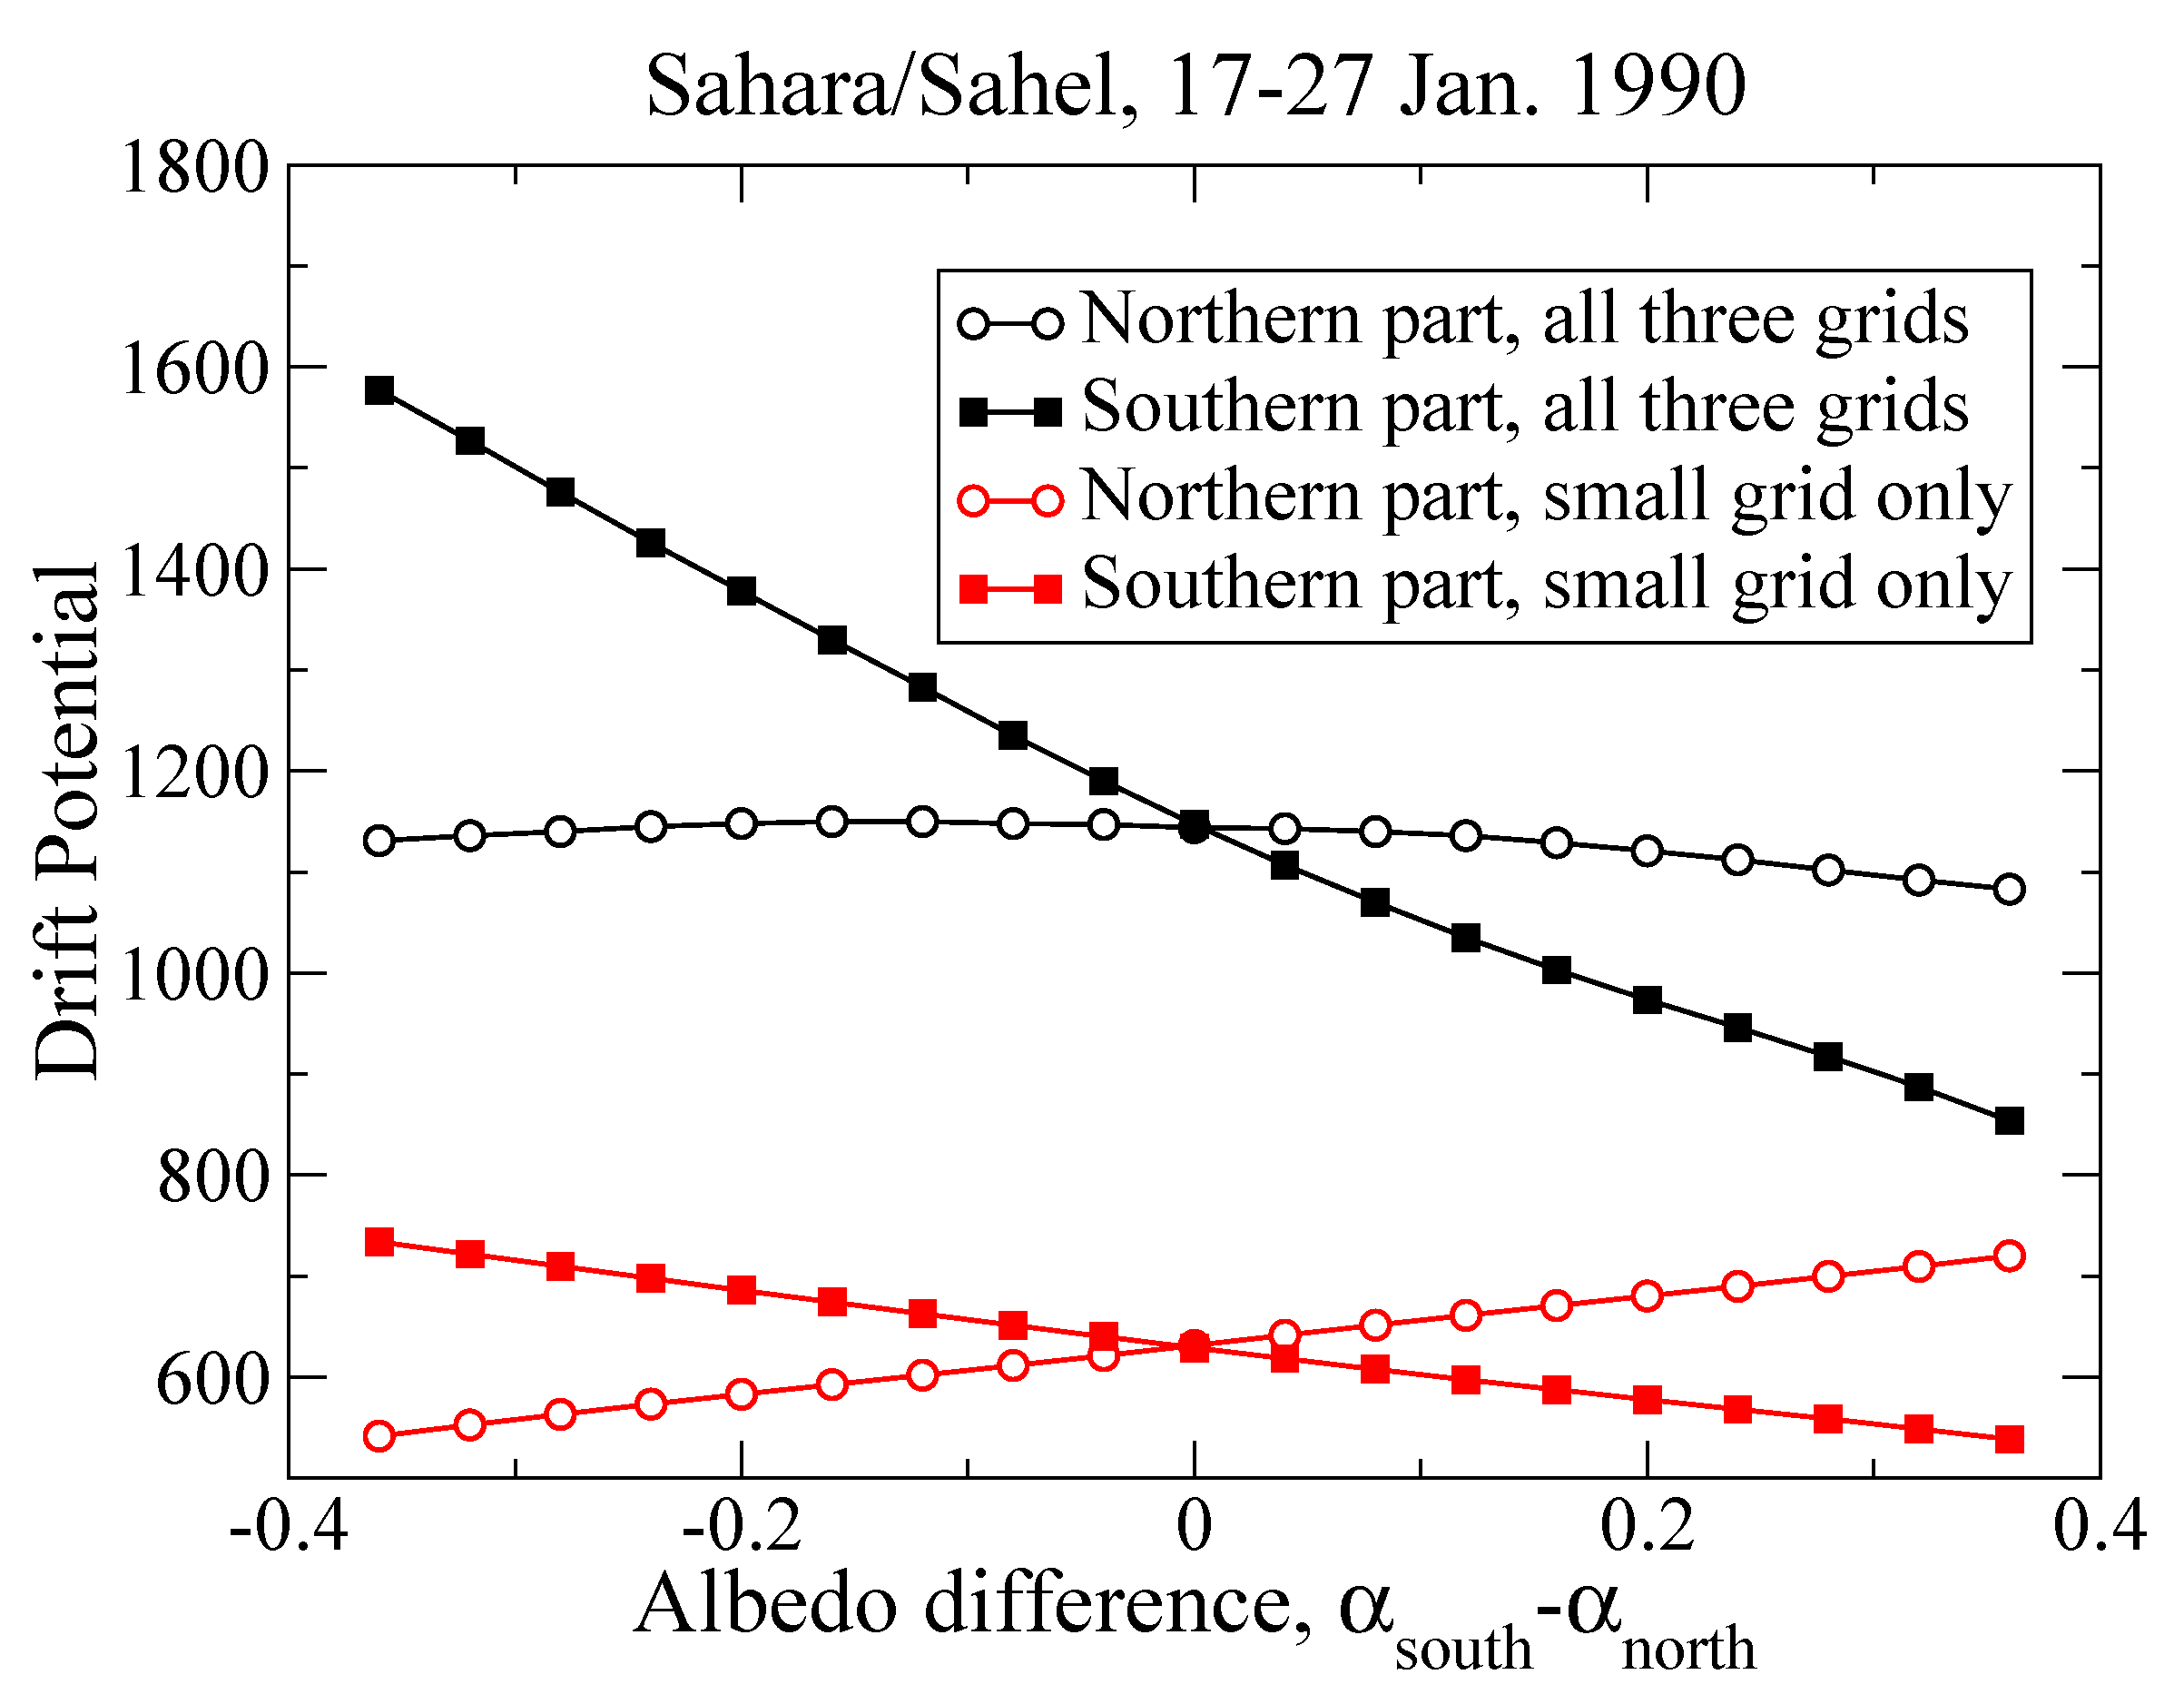
Figure 6.
Vegetation cover as a function of background drift potential, , obtained using the simple model for vegetation cover on sand dunes when the atmospheric (albedo) feedback was taken into account. The model’s steady states are plotted for different choices of precipitation, p, and albedo feedback, , parameters: (a) mm yr, , (b) mm yr, , (c) mm yr, , (d) mm yr, . Parameters values: , , , , , , mm yr, yr, , , (see, [43]).
© 2018 by the authors. Licensee MDPI, Basel, Switzerland. This article is an open access article distributed under the terms and conditions of the Creative Commons Attribution (CC BY) license (http://creativecommons.org/licenses/by/4.0/).
Share and Cite
MDPI and ACS Style
Ashkenazy, Y.; Shilo, E. Sand Dune Albedo Feedback. Geosciences 2018, 8, 82. https://doi.org/10.3390/geosciences8030082
AMA Style
Ashkenazy Y, Shilo E. Sand Dune Albedo Feedback. Geosciences. 2018; 8(3):82. https://doi.org/10.3390/geosciences8030082
Chicago/Turabian StyleAshkenazy, Yosef, and Elad Shilo. 2018. "Sand Dune Albedo Feedback" Geosciences 8, no. 3: 82. https://doi.org/10.3390/geosciences8030082
Note that from the first issue of 2016, this journal uses article numbers instead of page numbers. See further details here.