1. Introduction
The soil-water interaction is from decades the subject of several studies within the framework of many different disciplines as geochemistry, soil science, hydrogeology, agronomy, engineering geology and geotechnics. Although each discipline focuses on specific targets, the results of studies on clayey soils-water interaction broadly agree, leading to a largely shared clay behaviour model, which the following synthetic statement applies to: any physical process involving clayey soils and water implies the activation of chemical interactions among solid, liquid and gaseous phases, which have a feedback on the physical behaviour of the solid phase.
Moreover, the number of the involved variables and their combinations adds the complexity of the chemical processes to the, in and of itself, remarkable complexity of physical phenomena. The overall complexity determines a clear increase of difficulty in the study of the behaviour of clays and clayey soils. Such complexity can be reduced in laboratory studies by analysing the behaviour of a series of standard samples. However, the properties of natural (core) samples are different from those of any standard and are different among the different core samples: thus, due to the overlapping of several influencing factors, deriving general rules from such samples is much more difficult than in laboratory tests.
1.1. Clay Geotechnical Behaviour Related to Pore Fluid Characteristics
Several studies underline the importance of mineralogical properties of clays and of pore water chemical composition in determining their geotechnical behaviour [
1,
2,
3]. Just a few of these studies deal with the clay behaviour in relation to the variation of the chemical composition and salt content of pore fluids. Most of the results refer to laboratory experiments on pure natural clays, or on their mixtures, by using artificial saline solutions or organic fluids.
The alteration of the chemical properties of pore fluids (e.g., the change in the ion concentration or the cation valence, with the variation of dielectric constant by substitution of original pore fluids with other fluids), causes significant changes in the soil void index and, therefore, in the shear strength, compressibility and permeability of clays [
4,
5,
6,
7,
8,
9,
10,
11,
12,
13,
14,
15]. Sridharan and Venkatappa Rao [
16] exploring the modified effective stress concept, highlight the two components of the clay volume change: the shearing resistance at inter-particle level controls the volume change in non-expanding lattice type clays like kaolinite, while diffuse double layer repulsive forces operate in the case of expanding lattice-type clays like montmorillonite. These results relate to conventional oedometer tests on samples in chemical equilibrium with different organic pore fluids having different dielectric constant, which vary the inter-particle forces in the clays. Di Maio [
17] points out the reversibility of the volume decrease consequent to the contact of Na-montmorillonite in equilibrium with distilled water with a saturated solution of NaCl when specimens are re-exposed to distilled water, while consolidation due to saturated solutions of KCl and CaCl
2 proves irreversible.
Only few studies link the behaviour of natural clayey soils to the actual salt content and chemical composition of their pore waters, and to their long-lasting interaction with the hydro-geo-environment.
Early studies on the role of chemical and geo-environmental factors on the behaviour of natural soft clays go back to the fifties. First Bjerrum [
18] and Rosenquist [
19] attributed the development of marine quick clays to the leaching of marine sediments by fresh waters: those Norwegian clays, subject to disastrous landslides, had in fact very low pore-water salt content.
In a detailed geochemical study performed on clayey soils from the city of Drammen (Norway), Moum et al. [
20,
21] found that the variation of pore water chemistry is sufficient to explain the variations in the geotechnical behaviour of the leached marine clays.
In the investigation of a shallow coastal mudslide on the south coast of England, which included the monitoring of many geo-environmental parameters, Moore and Brunsden [
22] recognized that the temporal movement patterns of the mudslide coincided with the fluctuations in pore-water salinity.
1.2. Salinity Profiles and Chemical Composition of Pore Waters in Natural Clay Deposits
The salt content of pore waters of marine clays (and its variation in space and time), represents a key-factor in the understanding of their geotechnical behaviour, perfectly in line with a thermodynamic interpretation of the system.
Undisturbed marine clays host pore water (native or formation water), which originates with the seawater entrapped during sedimentation.
Samples from the top of exposed marine sediments may normally show pore waters with a salt content lower than that of the native saline pore water: this decrease of salt content goes with the change of chemical composition and relates to the action of natural waters present at the exposed top of the sediments. When permeability is very low, variations of salt content of pore waters can be induced by downward or upward diffusion and last for geological times [
23]; if the natural low clay permeability in the upper part of the soil mass is modified by fissures, it allows advective flow and variations occur in relatively short times. Some studies carried out to assess the suitability of clay deposits for waste burial [
24,
25], showed, indeed, that the decrease toward the surface of salt content and ion concentrations was due to the change from a dominant diffusive to a dominant advective flow, because of the presence and penetration of hydraulically active fissures in the upper surface of clay masses.
The chemical composition of pore waters of clays subject to diffusive or advective flows can be explained as a mixture of two end-members, the formation water (saline end-member) and a fresh (diluting) water. Due to diagenesis, the chemical composition of the saline end-member (formation water) mainly differs from that of seawater originally entrapped during sedimentation [
26,
27,
28], which is assumed to be constant starting from the Cambrian age [
29]. Formation waters normally show a decrease of sulphate contents and Mg/Ca ratio, an increase of Na/Cl ratio and bicarbonate concentrations, and an enrichment in minor constituents (as boron, strontium and lithium) [
30,
31,
32,
33]. The freshwater end-member is normally of calcium-bicarbonate type, with Total Dissolved Solids content (TDS) values lower than 0.5 g/L.
The chloride ion, considered the conservative (non-reactive) tracer of mixing, allows for calculating the percentage of dilution of the saline formation water with freshwater. Under conservative mixing TDS and chloride correlate, which is why TDS can give information on dilution processes. However, the mixing between fresh and saline waters activates water-soil interaction processes, which effects overlap to the dilution effects. In this case, chlorides and TDS do not show significant correlation and only chlorides should be used to infer the percentage of dilution.
The most important modifying processes involved in water-clay interaction are the cation exchange, the carbonate dissolution and the solution of salts: these processes occur simultaneously (depending on the availability of minerals and salts) and with different extent, affecting each other.
In clays in equilibrium with NaCl waters (saline waters of marine origin) the exchange sites are mostly occupied by sodium ions. When fresh waters, carrying predominantly calcium ions, leach saline sediments, the disequilibrium between fresh water (where calcium ions predominate) and resident pore waters activates a Ca/Na exchange process (direct exchange): this means that calcium ions displace sodium ions from the exchange complex until a new equilibrium is reached. This way, the dilution leads to equilibrium pore waters richer in sodium and poorer in calcium compared to the effect of a conservative mixing (i.e., without overlapping processes). A continuous dilution by fresh waters leads to the successive development of more and more fresh pore waters having characteristic facies, as NaCl, NaClHCO
3 and NaHCO
3, turning out to CaHCO
3 facies only when the leaching process is complete (all exchange sites are occupied by calcium ions) [
34,
35].
In some cases, natural clay soils can interact with waters of higher salt content than resident pore waters, as during sun-driven capillarity, inundation by seawater or interaction with brines. Depending on the initial chemical conditions, the exchange can invert its direction (inverse exchange) with the appearance of CaCl2 type facies.
As matter of fact, the hydrological and hydrogeological factors suitable to cause the leaching of clays vary according to natural causes, i.e., long-term or seasonal variation of climatic and hydrogeological conditions, sea level changes, or for human intervention, as during engineering works, with shortly or long delayed induced effects.
The interaction between free circulating waters and clay pore waters of different chemical composition determine an osmotic disequilibrium, which, according to the local stress field level or to the dimensional and volumetric constraints, normally leads to changes in the DDL structure and in the soil properties. The dielectric and the field of the electrical forces inside the double layer [
5,
8,
11,
26,
36,
37] together with its energetic content vary with the structure and composition of the DDL. For a soil sample, each point in the e-σ or e-lg σ plane, like in the oedometer test, defines a well specific energetic content, whose electrostatic component is conservative.
1.3. The Energy of the System and the Swelling
Starting from the study of a few damaged structures built on over-consolidated blue clays, Spilotro and Fidelibus [
38] recognized different geotechnical behaviour within the same clayey soils. The damages were explained as due to a differential swelling in the blue clays, caused by interaction of low salinity water with pore waters of higher salinity induced by excavation near the building foundation apparatus.
According to the Gouy–Chapman theory about the changes in the diffuse double layer (DDL) [
8,
39,
40,
41,
42,
43], previous studies on clay behaviour state that the volume changes of clays due to osmotic and diffusive phenomena arise from variations of the chemical composition of pore waters. Specifically, the DDL thickness increases with the decrease of the solution concentration and the charge of cations, and the increase of the hydrated cations radius.
As in the model of an electrical capacitor, the change of the dielectric properties of DDL and of the facing pore water changes the inner electrical field and the amount of the energy stored inside the capacitor. This change is possible only with an external energy contribution (with algebraic sign). The increase of the DDL thickness caused by the interstitial fluid variation is highlighted at the macro scale by a volume change until a new volumetric equilibrium is reached, or by the development of a swelling pressure, if no volumetric change is allowed.
The process of soil swelling is therefore primarily a thermodynamic state variation; in the applied science literature, it is generally associated to the presence of expansive clay minerals, which are subject to significant volume changes due to changes in water content. The swelling behaviour is dominated by a combination of factors, including soil composition and environmental conditions, and can be evaluated by the free-swell index, swelling percent and swelling pressure in laboratory. They represent the percent increase in height of the sample in one dimensional condition at zero surcharge, the swelling percent of a sample under 6.9 kPa surcharge that is compacted at optimum water content of standard compaction energy [
44], and the amount of pressure that prevents the soil sample from swelling [
45] respectively.
Several studies and investigations analyze the factors and parameters that can be related to the swelling of clayey soils [
46,
47,
48,
49]. Among them, the physical properties of soil, such as the initial water content, the initial dry density [
50,
51], the type and the amount of clay minerals or the clay content, and the Atterberg limits, are the best-researched and considered in relationship with the phenomenon. Due to the complexity of modelling and analysing, both deterministically or empirically, the swelling process, some authors [
52,
53,
54,
55] approach this topic by system analysis and cognitive methods. In particular, the Artificial Neural Networks have been widely used to predict the swelling pressure or swell percent on the basis of a set of soil parameters, such as clay fraction (CF), plasticity index (PI), dry unit weight (γ
d), water content (w), void ratio (e), and degree of saturation (S
r).
These approaches, in the aim of the system analysis or cognitive methods, can reveal useful to predict the soil behaviour, but are disrespectful of the physical essence of the problem: the swelling is the release of a previously stored energy and can perform work.
In a clayey soil system, as in thermodynamics, if the system is isolated, the external work done on the system changes its internal energy; in a field of conservative forces, the stored energy can be released, by performing work, so bringing the system to its previous energy state. In the clay case, the electrical field in the DDL is conservative.
This means that the rate of deformability of a clayey soil due to the osmotic behaviour is like that of a variable stiffness spring, where the stiffness variability is strictly linked to the pore water salt content (and chemical composition).
To analyze the energetic state of a soil sample, the one-dimensional confined compression (an oedometer test) is suitable. In this kind of test, a change in the internal energy is performed at each load or unload interval; that is equal to the integral of the infinitesimal work of the internal and external forces. Namely, if:
We is the external work,
Wc is the conservative work of elastic deformation of soil structure,
Wcs is the conservative work resulting from the nano-deformations at the level of DDL,
Wnc is the non-conservative work of permanent deformation of soil structure, of particle or inter-particles cement crushing, and the work to overcome the hydrodynamic resistance for pore water drainage,
the external work We will balance Wc, Wcs and Wnc.
So, the general energy balance equation applied to an oedometric test is:
Unfortunately, the oedometric test, normally performed in distilled water, does not permit the isolation of the clay system. In this case, the energetic content of the second term of the work balance, Wcs, i.e., the conservative work of the electric forces of the double layers associated to changes of the interparticle distance, should be released with the aim of reaching a less dense arrangement of the clayey soil. It happens for swelling samples in the first flat horizontal part of the loading curve in the oedometric test, when the value of the in situ effective pressures is exceeded. Note that Wcs has an algebraic sign, depending on the sense of the salinity gradient of pore waters vs external waters, and it is associated to an energy accumulation or release in the conservative field, in any case balanced by external energy.
1.4. Objective of the Study
According with all the above statements, a geological soil system, which has reached in a very long time the volumetric equilibrium as to the external forces (overburden, capillarity, or hydrogeological conditions, i.e., positive or negative water hydraulic heads and salt content), is also in equilibrium with the internal forces (as to osmotic pressures) and will not develop work (settlement or heave). At constant external forces (stress field), the system can be considered isolated until the chemical composition and the salt content of the water outside the system are the same as those of the pore water inside the system, or, if different, the waters do not interact. If waters circulating in the natural clay system are not in chemical equilibrium with pore water, the system is non-insulated, and work is done by or against the external forces.
This could explain why a clayey soil, under relatively insignificant loads, shows either a swelling, with a sudden work against the gravitational force, or (rarely) a settlement, depending on the sense of the salinity gradient between internal and external waters. This could explain as well: (i) why we can find clays of the same mineralogical and CF composition at same effective consolidation pressure under different volumetric (void ratio) states; (ii) why settlements or heaves can affect buildings years after the end of construction without any apparent change in the effective pressures; and (iii) why steep slopes are sometimes more stable than clayey flat hills.
Considering all the above relevant facts, this study aims at answering the following questions: (i) do geomorphological and hydrogeological border conditions influence pore-water salinity of clayey soils? (ii) do changes of pore water salinity affect the geotechnical behaviour of natural clayey soils? and (ii) if the previous hypotheses are correct, which parameters can be used as suitable indicators of such behaviour?
To reply to these questions the study considered a set of core samples of the blue clays, which are the main constituents of the Plio-Pleistocene Bradanic Foretrough (Southern Italy). Some aspects of their geotechnical behaviour are revised in the light of the chemical characteristics of their pore waters, squeezed out from the core samples by means of a special high-pressure cell. The variations of such last features with reference of the native interstitial saline solutions have been examined in the light of the geomorphological and hydrogeological border conditions, and the geological history of the studied sites. The study is performed on clay soils under Mediterranean (hot dry summers) environmental conditions, which may be relevant because the sun-driven capillarity introduces a very significant term in the energy balance of the soil system and is probably the most relevant consolidation factor in the studied soils.
This study deals with real clay samples, trying to capture, by using an inter-disciplinary and holistic view, the general behavior patterns from systems where this behavior depends on many interrelated variables (complex systems).
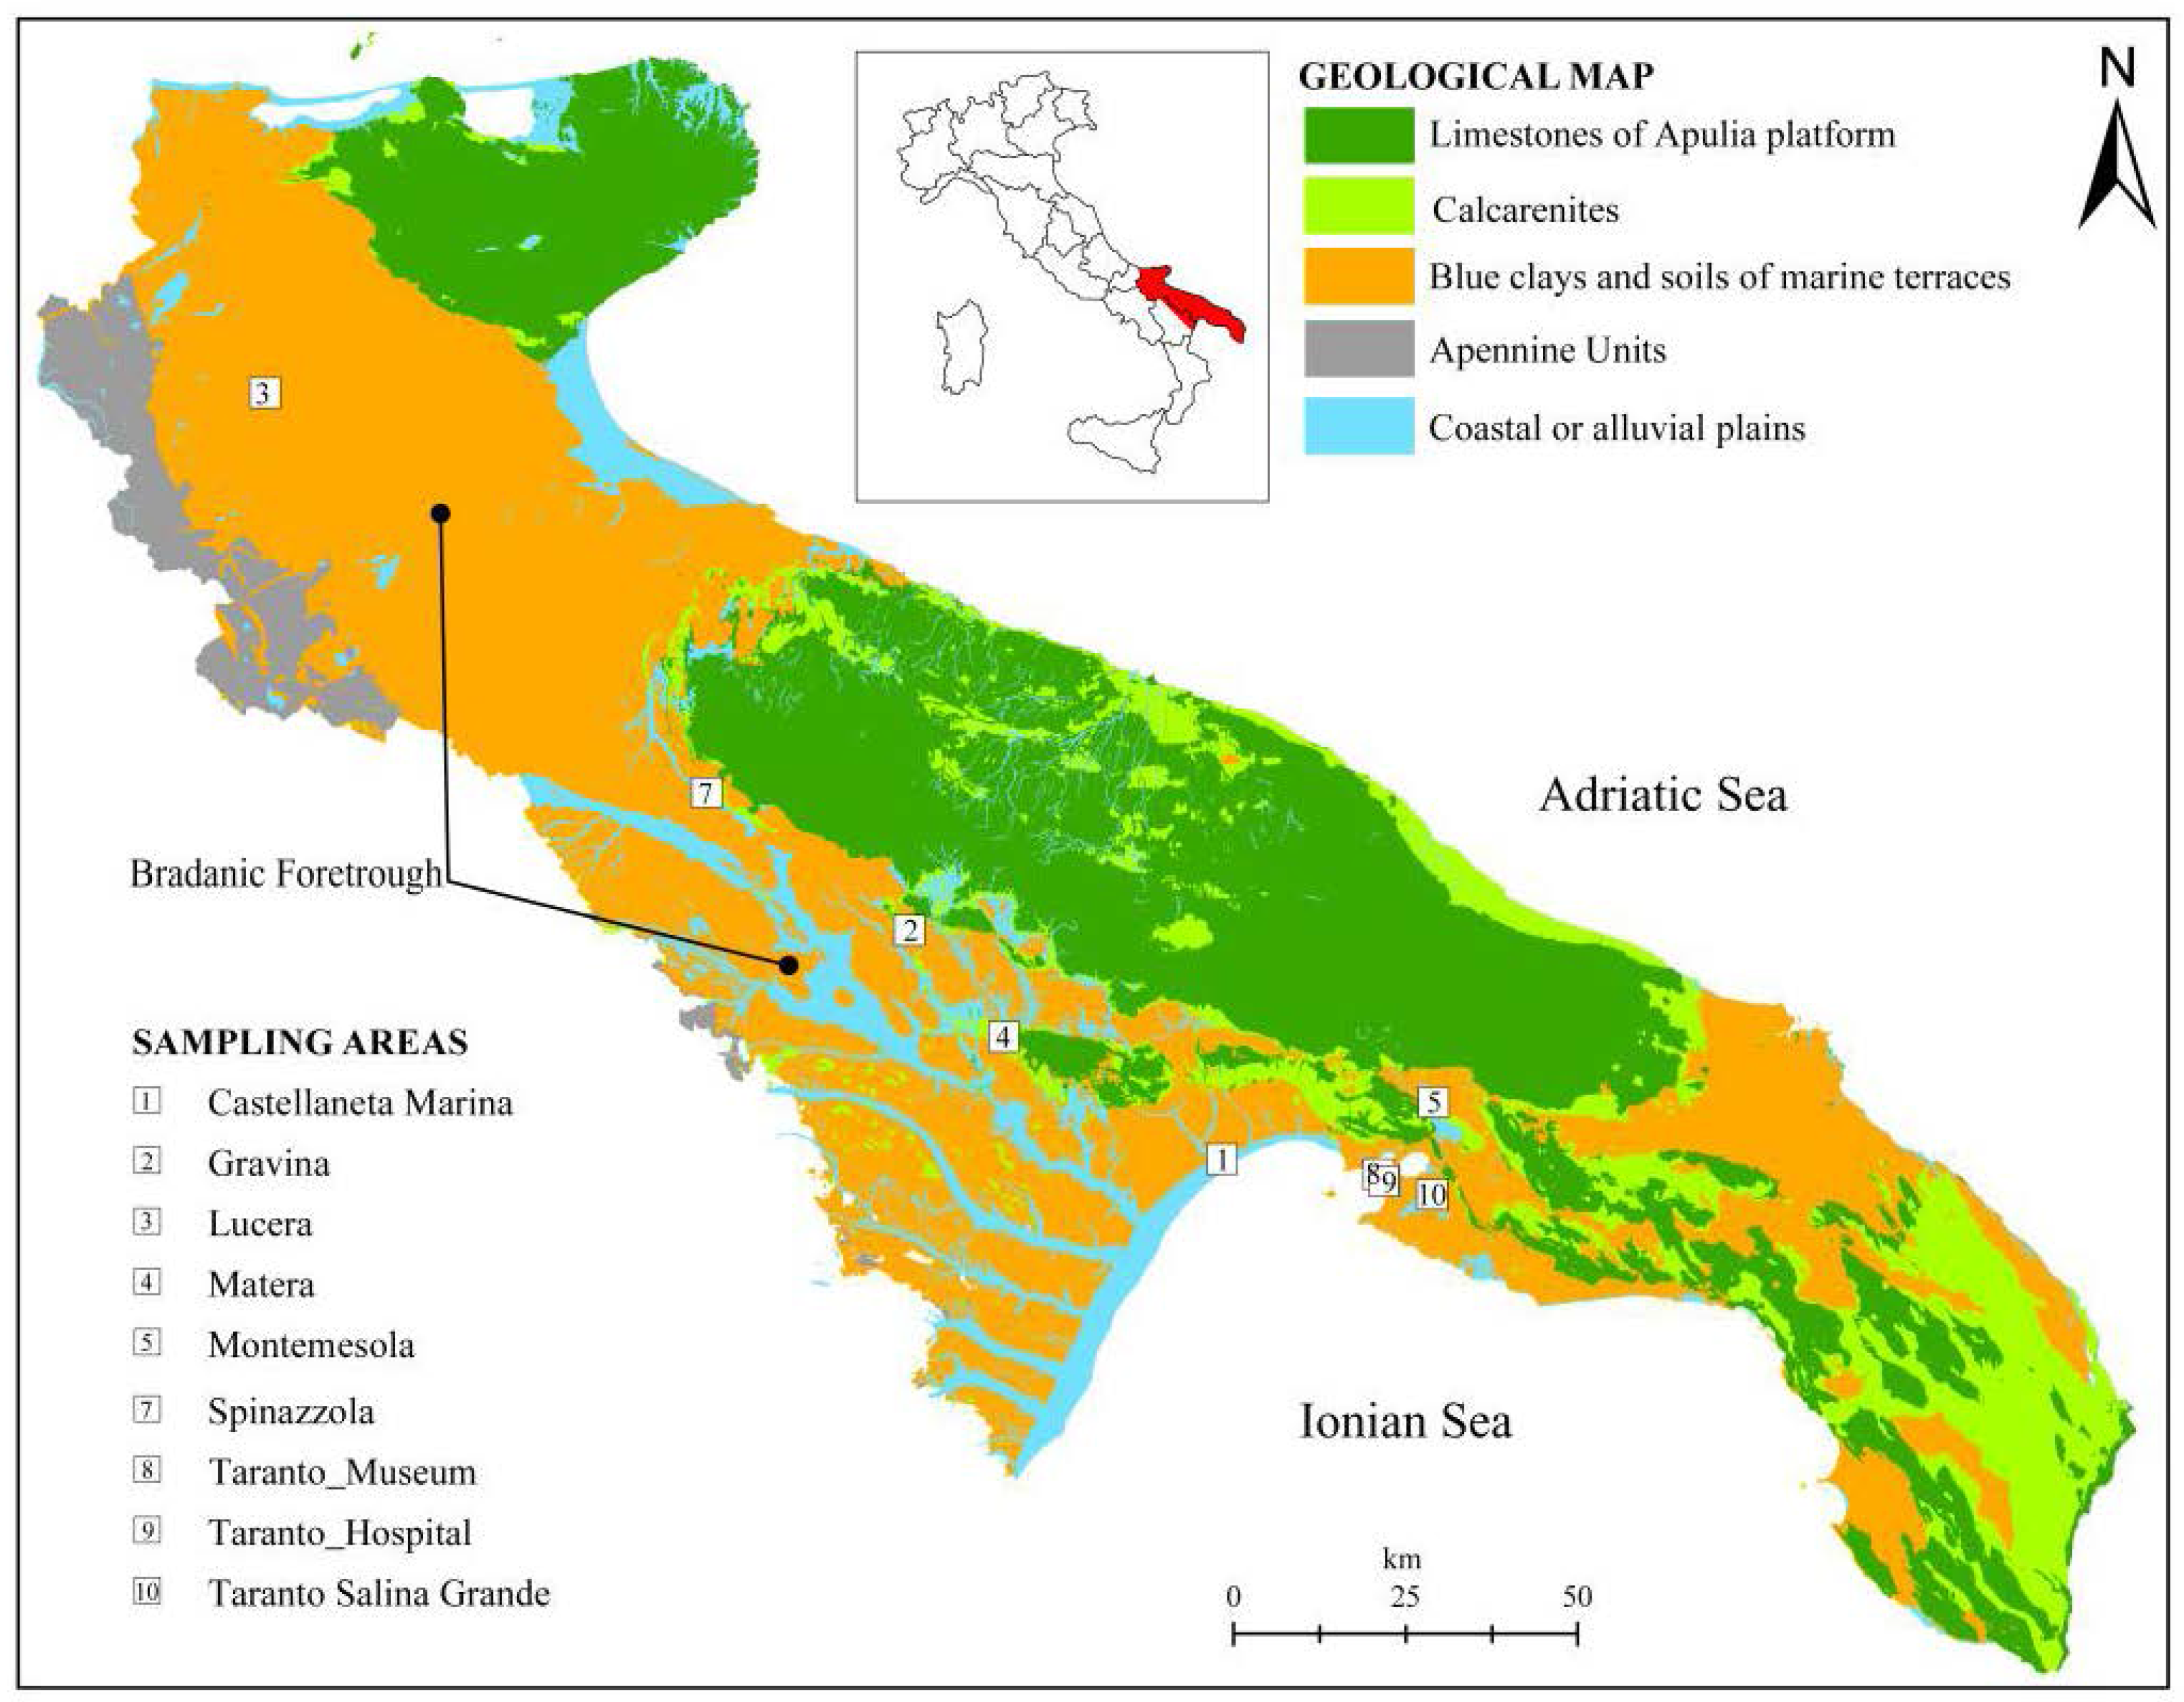
2. Geology, Geomorphology and Hydrogeology of the Study Area
The study is based on the sampling and analysis of stiff marine blue clays. The sampling has been carried out in 9 sites, distributed in the geological domain known as Bradanic Foretrough (southern Italy,
Figure 1) which extends from NW to SE between the Lucanian Apennines and the Apulia Foreland. The Bradanic Foretrough is a tectonic trough, filled by clayey deposits during the Pliocene and Pleistocene. The surface of deposits was modelled by marine terraces, regressive towards the Ionian Sea (current Taranto Gulf) [
56,
57]: however, tectonics and erosion tilted and erased most of them. The limestones of the Apulian platform plunge below the clastic filling up to 7 km below the present sea level.
Despite the great extension of the Bradanic Foretrough, the blue clays are substantially homogeneous regarding mineralogy, plasticity, typical range of strength and stiffness [
58,
59,
60], with some variations in grain size distribution only near the borders of the old sedimentary basin.
Although the clays in the study areas belong to the same geological formation, the local natural geomorphological conditions lead to different hydrogeological contexts, which are relevant to the long-term variations of clay pore water chemistry and, then, to the geotechnical behavior of the soils.
The geomorphologic/hydrogeological frameworks within which the sampling has been done can be schematized in four typical contexts (
Figure 2).
A: clays beneath flat marine terraces, sited at various elevations, with residual cover of sands and conglomerates or calcarenites; this enables, regarding the underlying impermeable marine clays, the long-term presence at their top of a fresh water-table aquifer;
B: coastal marine plains; this is like the previous case, with a terrace that is now shaping, with some dozens of meters of sands saturated with seawater over the top of the blue clays;
C: clays exposed on the deeply or gently dipping flanks of eroded terraces; fresh water does not lie over the clays, precipitation quickly runs off along the slope and capillary rise is dominant during the dry season;
D: clays lying beneath a marsh cover in a salt pad, a very singular geomorphic situation, at low elevations over present sea level.
In the A context, freshwater in the upper sands is stable from geological times; the sands are much older as higher is the elevation of the marine terrace, ranging from tens of ky at 20–30 m a.m.s.l. to some hundreds of ky at 300 m a.m.s.l. and more. It allowed the leaching of native formation waters through diffusion phenomena, which determined the progressive upward decrease of the pore water salt content of the blue clays and their contextual volumetric rebalance.
In the B context, seawater saturates the sands over the blue clays. This process lasted for at least six thousand years; the previous context is reasonably the C one (the sea level at Last Glacial Maximum was 120 m below the present level at the test site [
61]).
In the C context, the penetration of recent fresh water is restricted to no more than a few meters from the surface; the weathered soil cover represents a good protection against a deep penetration of the rain water, but not from the capillary rise during the dry season.
The D context applies to a salt pad, which is the result of the piping of the clay cover by seawater along previous karst pathways [
62,
63]. These peculiar conditions led to the impregnation of the marsh deposits by a high salinity brine, and, due to diffusion, to a deep and strong increase of the salt content of the old marine water trapped into the clay pores. This condition reveals a salinity gradient opposite to that of the A context.
The sampling areas (
Figure 1) are: Castellaneta Marina (1) (coastal plane, B context); Gravina (2), Lucera (3), Matera (4), Montemesola (5), Spinazzola (7), Taranto Museum (8) and Taranto Hospital (9) (clays under terraced deposits, A context, and on the flank of the exposed slope, C context); Taranto Salina Grande (10) (D Context).
The different test sites were involved in engineering problems, as building restoration or structural damage on buildings (sites 1, 4, 5, 8, 9), tunnelling (2), landslides (3, 7), and research (10).
3. Materials and Methods
3.1. Geotechnical Characterization
The geotechnical characterization of the blue clays from the study sites was performed by means of laboratory tests on undisturbed core samples from boreholes or the front of tunnel excavations. The depth of sampling varies from 4 to 63 m below ground level. From the 9 test sites a set of 49 samples have been selected. Geotechnical tests were carried out on the samples to determine their physical characteristics (γ
s, γ
t, γ
d, w), grain size analysis, Atterberg limits, carbonate content, strength and deformability properties (by means of triaxial compression test and oedometric test). All the values of the geotechnical parameters coming from the tests on the blue clays were organized in a data base (DB) and reordered in swelling and non-swelling samples according to the behavior in the oedometer tests (
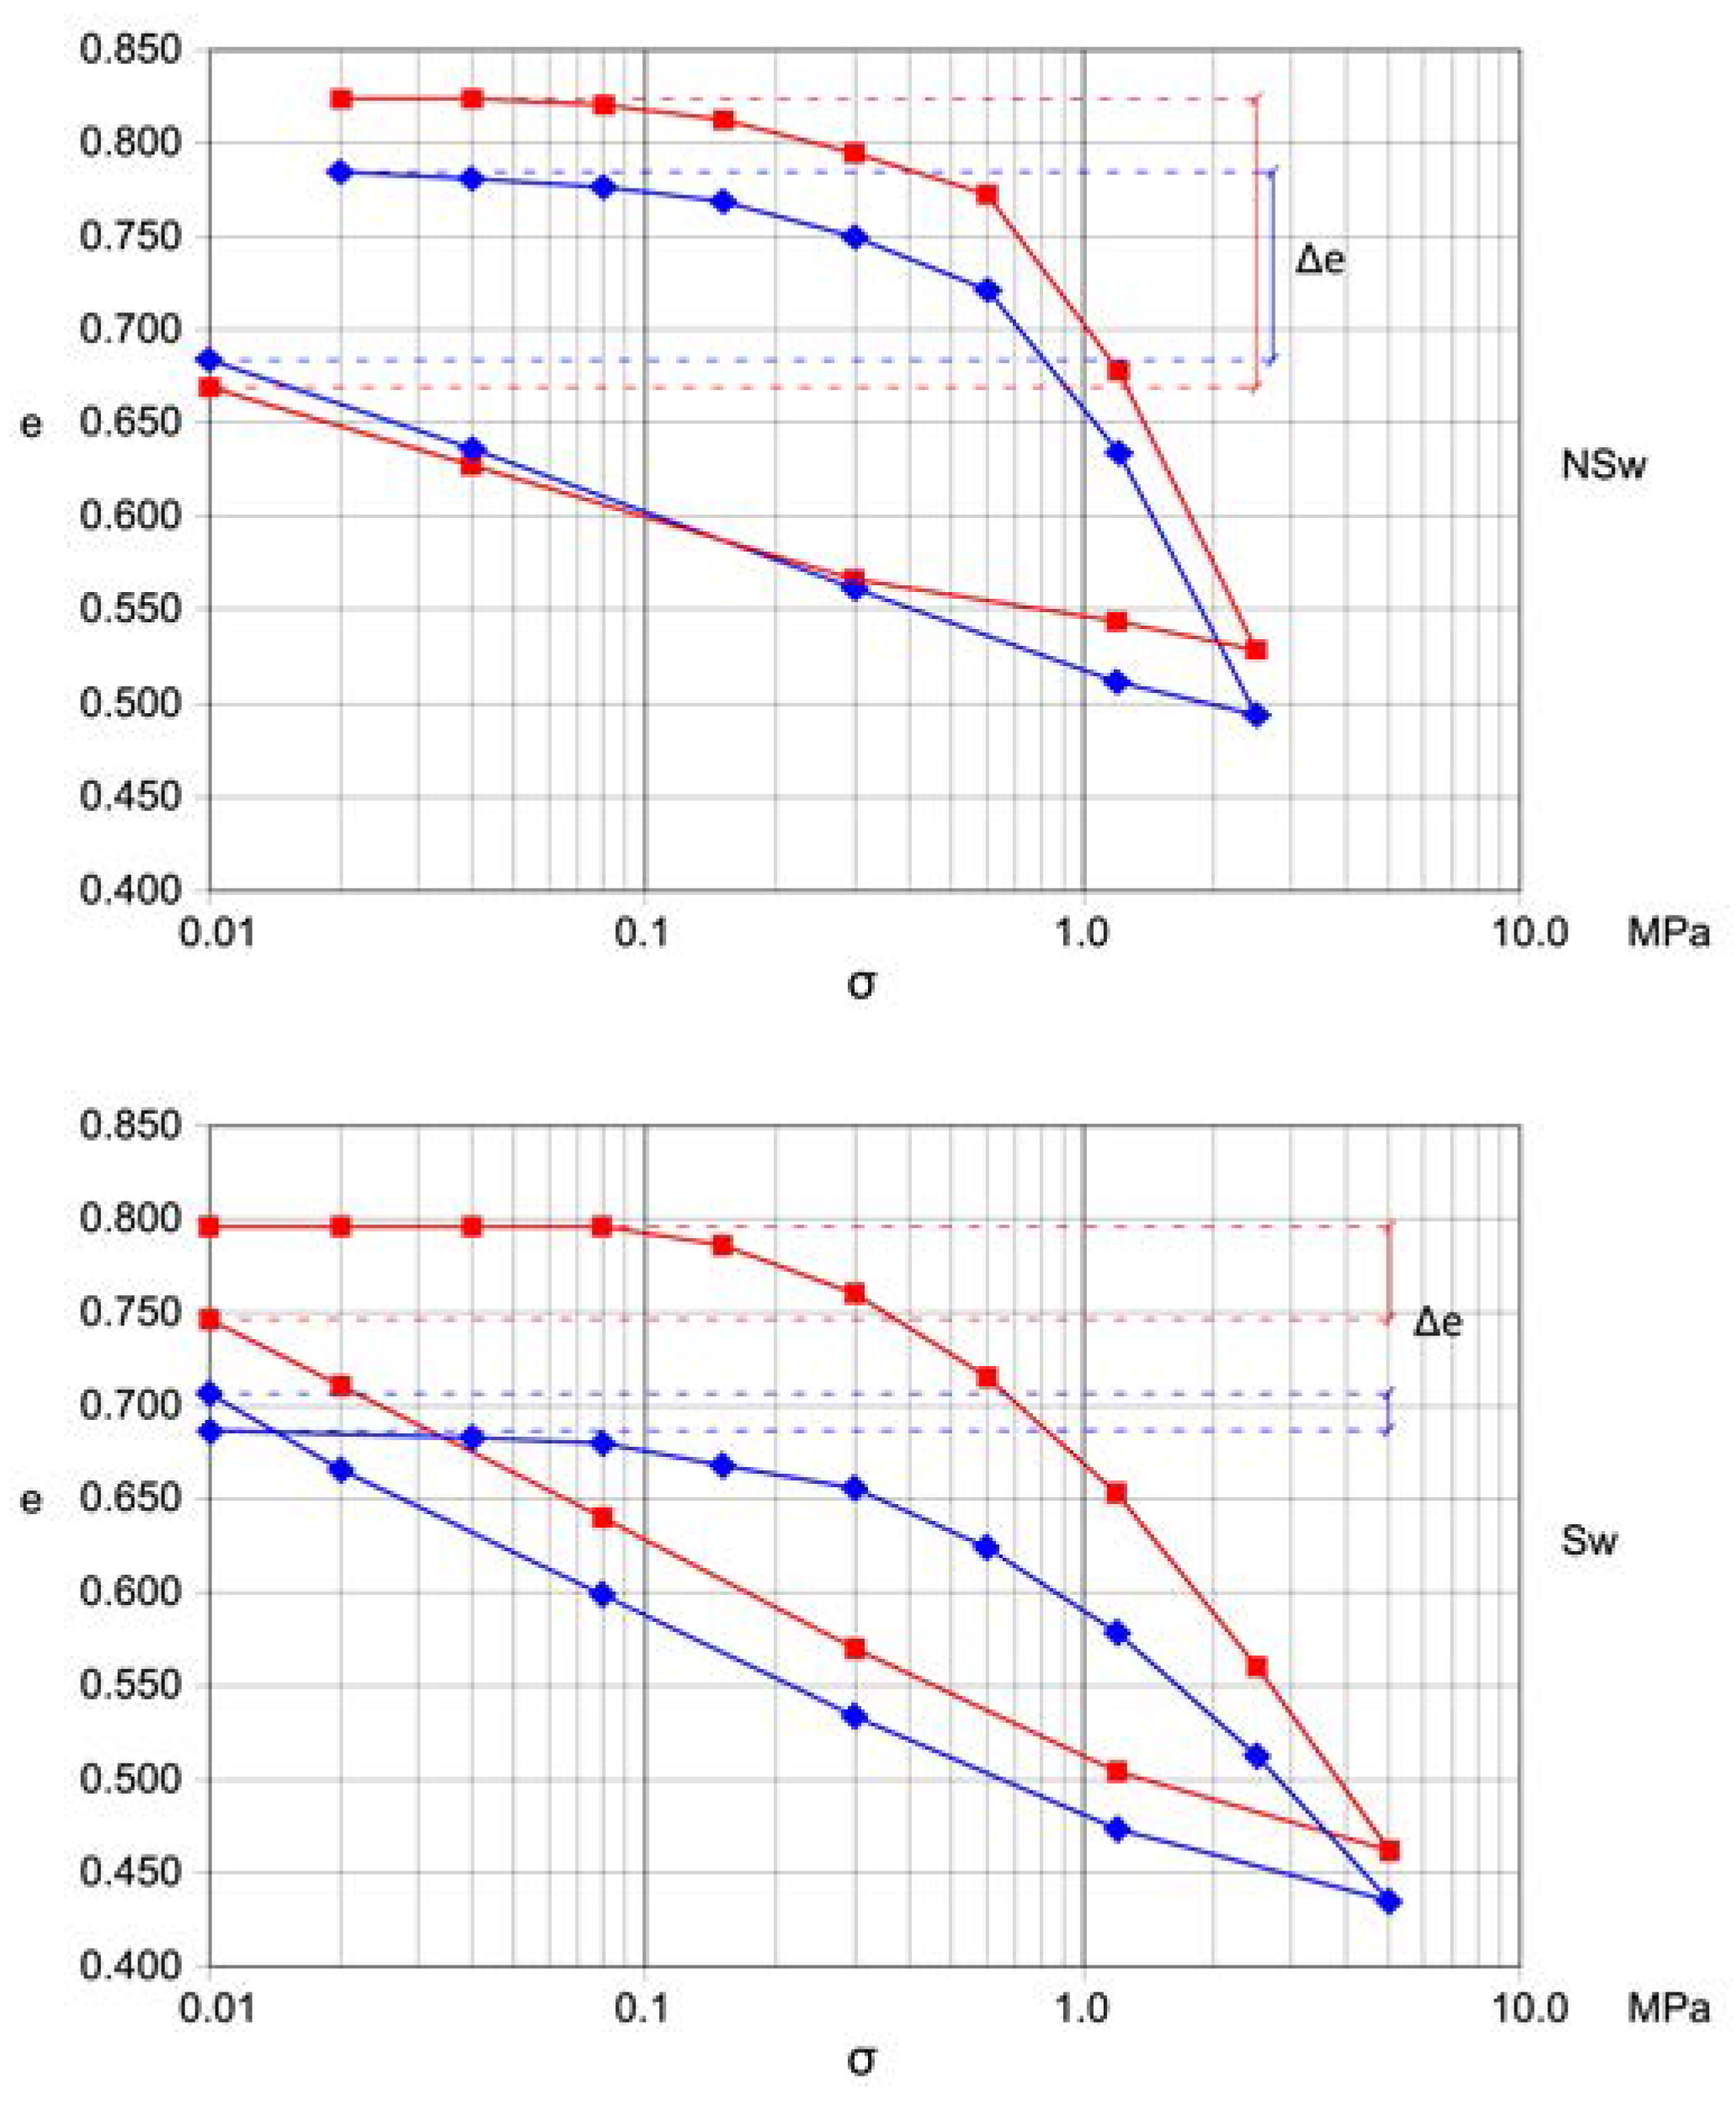
Figure 3). The classification has been made based on the difference between the initial and final void ratio (Δe) and on the flatness of the first part of the loading diagram.
Table 1 summarizes the average and the standard deviation (SD) of the values of each geotechnical parameter of interest for the whole DB and for the classes of swelling (Sw) and non-swelling (NSw) samples.
The average values of the most significant parameters of the whole data base are:
- -
unit weight of solid particles, γs = 26.8 kN/cm3
- -
dry unit weight, γd = 15.9 kN/cm3
- -
water content, w = 22.9%
The clay fraction ranges around 47%; the mean sand fraction (s) is 18% and may increase near the proximal part of the sedimentary basin. Plasticity (average) is defined by:
- -
Liquid Limit, LL = 54%
- -
Plasticity Index, PI = 30%
Thus, the blue clays, according to the Unified Soil Classification (USCS), place themselves in between the low and high plasticity. The mean undrained shear resistance from standard TRX-UU texts is 160 kPa. All analyzed samples were naturally saturated, and we suppose no thermal influence on the test results.
Table 1 includes, regarding the ordinary oedometer tests performed on specimen having 5.6 cm in diameter and 2 cm in height, the values of:
Δe, the difference between initial and final void ratio;
Wc25, the external work performed up to 2500 kPa loading;
Ws12, the negative external work performed in unloading from 1200 to 10 kPa.
Other data in the
Table 1 regard the average and the standard deviation of the Electrical Conductivity (EC) and the TDS of the pore waters squeezed out in the pressure range 0–12 MPa in 20 samples.
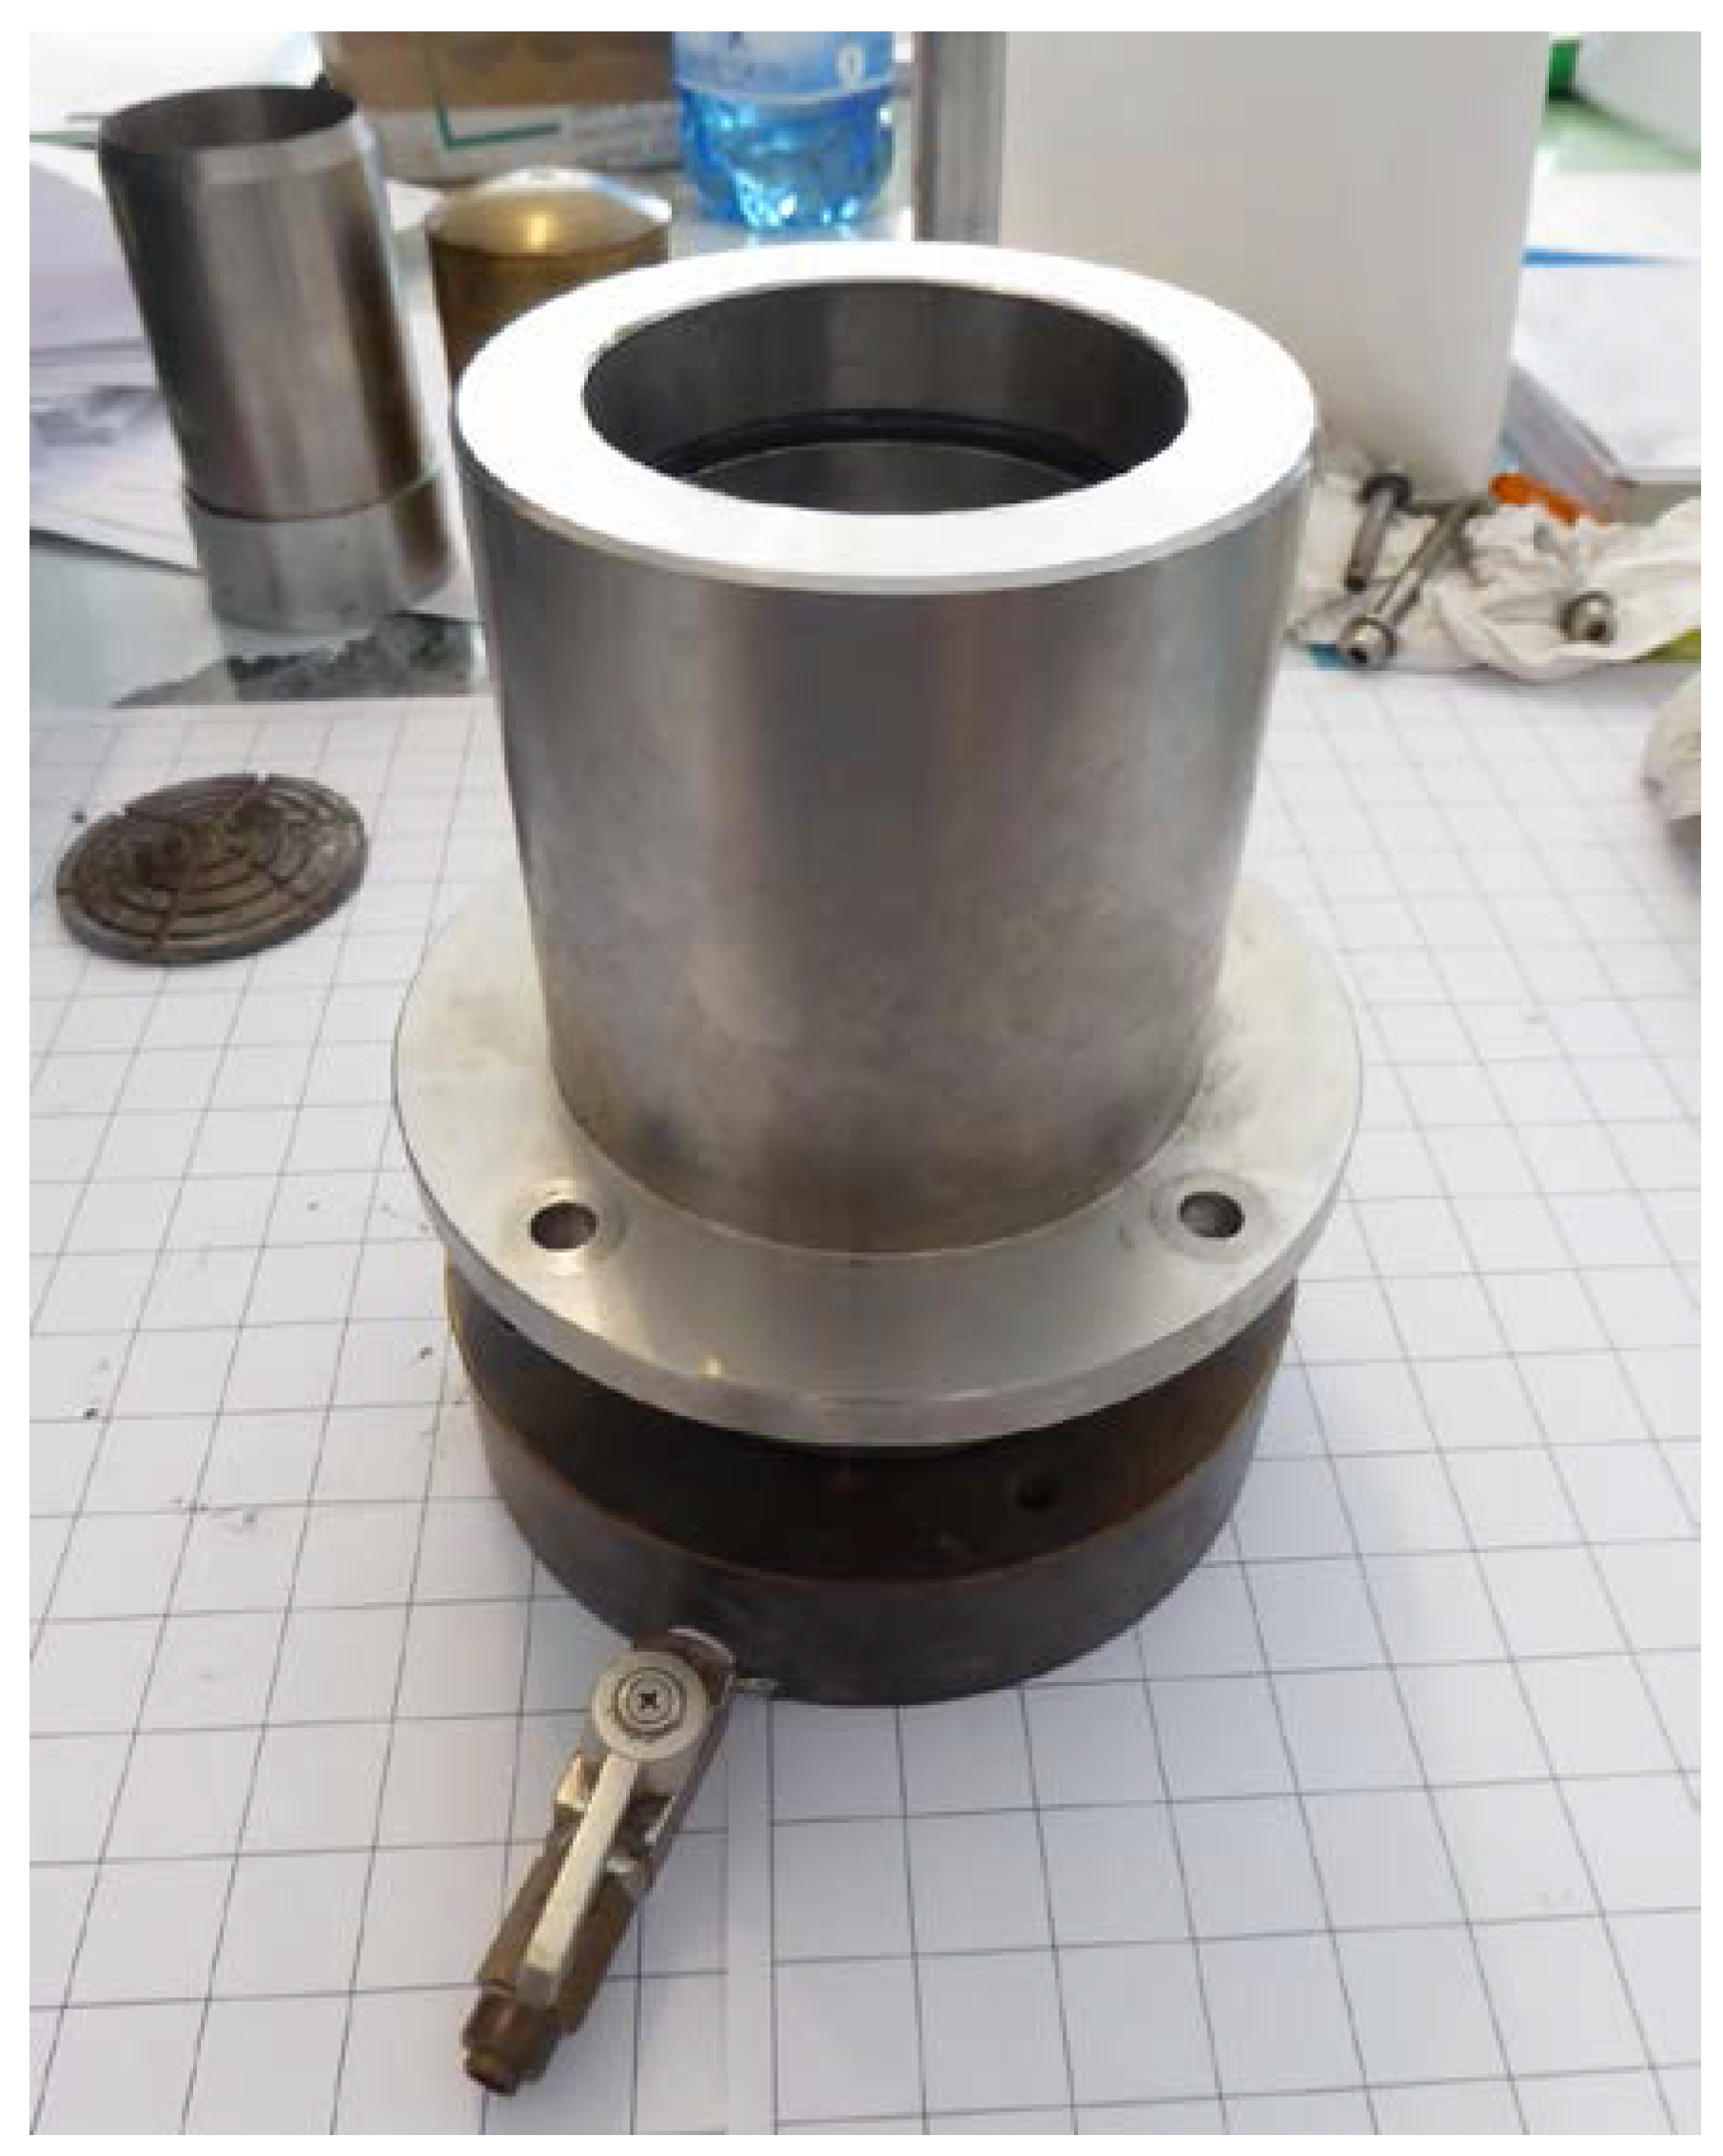
3.2. Squeezing Technique
The pore waters have been extracted from portions of core samples resized to the cell dimensions (7 cm of diameter and 10 cm of height) by means of a pressure squeezing technique. The squeezing methodology has been extensively used by numerous scientists to extract pore water from fine graded soils for several purposes (for example, to calibrate geophysical logs) [
64,
65,
66,
67,
68,
69,
70]. A review of squeezing methods and linked uncertainties is in Sacchi et al. [
71].
At present, the pressure squeezing used in this study is the most direct system for extracting and sampling the pore waters. It is preferable to the techniques based on leaching of soil samples: especially in case of stiff clays, leaching data would normally show higher ion contents than squeezing data, because of the dissolution of soluble salts, as carbonates and sulphates [
71].
The squeezing cell apparatus (
Figure 4) was purposely designed for the study: it allows the pore water extraction at pressures as high as 15 MPa. The extraction was performed at two different pressures, i.e., 6 and 12 MPa [
38]. The maximum squeezing pressure was four times higher than the pressures applied in the oedometer tests. Water samples corresponding to the two squeezing steps were separately collected by a syringe to recognize chemical differences in the composition and in the TDS of the respective pore waters. The volumes of squeezed pore waters were small, ranging from 4 to 16 mL. The loss in water content (w), indeed, ranged between 5 and 10%, which corresponds to the 20~30% of the total pore water mass.
The low sample volumes and the saline nature of the samples obliged to dilute them in variable proportions: consequently, analyses may be affected by unavoidable uncertainty between 10 and 25%. Major cations (Ca2+, Mg2+, Na+, K+) were determined by Inductively Coupled Plasma emission spectrometry (ICP-AES); major anions (Cl−, SO42+) were determined by ion chromatography. Bicarbonate concentrations were analyzed by titration of diluted samples. Electrical conductivity was measured by a micro-probe InLab® 751-4 mm (Mettler-Toledo Ltd, Port Melbourne, Australia) and TDS was evaluated by the chemical quantitative analysis.
The number of clay soil samples submitted to the squeezing procedure is 30, but only 20 are provided of oedometer tests and then entered in the general DB used in the present study.
4. Results and Discussion
4.1. Chemical Characteristics of Pore Waters
Excluding the pore waters of Salina Grande site (salt pad, site 10) and one sample of pore water from Castellaneta (site 1), the TDS of the remaining pore waters is lower than that of present seawater (around 40 g/L).
Pore waters from the 9 sites result differently characterized in accordance with the geomorphological and hydrogeological context. The freshest pore water samples (up to 2 g/L) belong to Gravina, Taranto Museum and Lucera sites, that are included in the A context. Pore waters with TDS from 2 to 10 g/L belong both to the B and C contexts (Lucera, Matera, Spinazzola, and Taranto Hospital) and to the A context (deeper samples). Pore waters with TDS between 20 and 47.9 g/L belong to the B context (Castellaneta) with one only sample from the D context (Salina Grande). Finally, pore waters with TDS between 93 and 136 g/L belong to the D context (Salina Grande). In the A contexts salinity normally increases from surface to depth.
A comprehensive description of the chemical features of analyzed pore waters and the water-rock interaction processes at their origin is out of the scope of present discussion. In synthesis, the chemical analyses show the effects of the ion exchange and the other processes brought about by the mixing between fresh waters and formation saline water. All pore waters have SO4/Cl (mole) ratios higher than seawater (0.05). The increase of sulphates is attributed to gypsum dissolution, in accordance with the widespread presence of gypsum crystals observed in the fissures of clay masses. The gypsum dissolution increases the TDS without changing the chloride concentration that defines the real percentage of dilution: thus, in presence of anomalous SO4/Cl ratios, the TDS does not correlate with chloride concentration and pore waters must be considered more diluted than indicated by TDS values.
4.2. Pore Water Salt Content vs. Geotechnical Properties
The experimental results, summarized in
Table 1 and differentiated in the Sw and NSw soil samples groups as well, show a good agreement with the previous theoretical statements on the role of chemistry and TDS of pore water in the control of the volume changes and of the energy balance in the soil system.
Grain size and plasticity of the Sw and NSw samples do not show appreciable differences in the mean characteristics: for the two classes of samples the CF is 48 and 46% and LL is 55 and 51% respectively. Conversely, the difference between the TDS and the electrical conductivity (EC) mean values of the pore waters of the two sets of samples is notable: 6.0 and 1.4 g/L, and 7280 µS/cm and 1910 µS/cm, respectively.
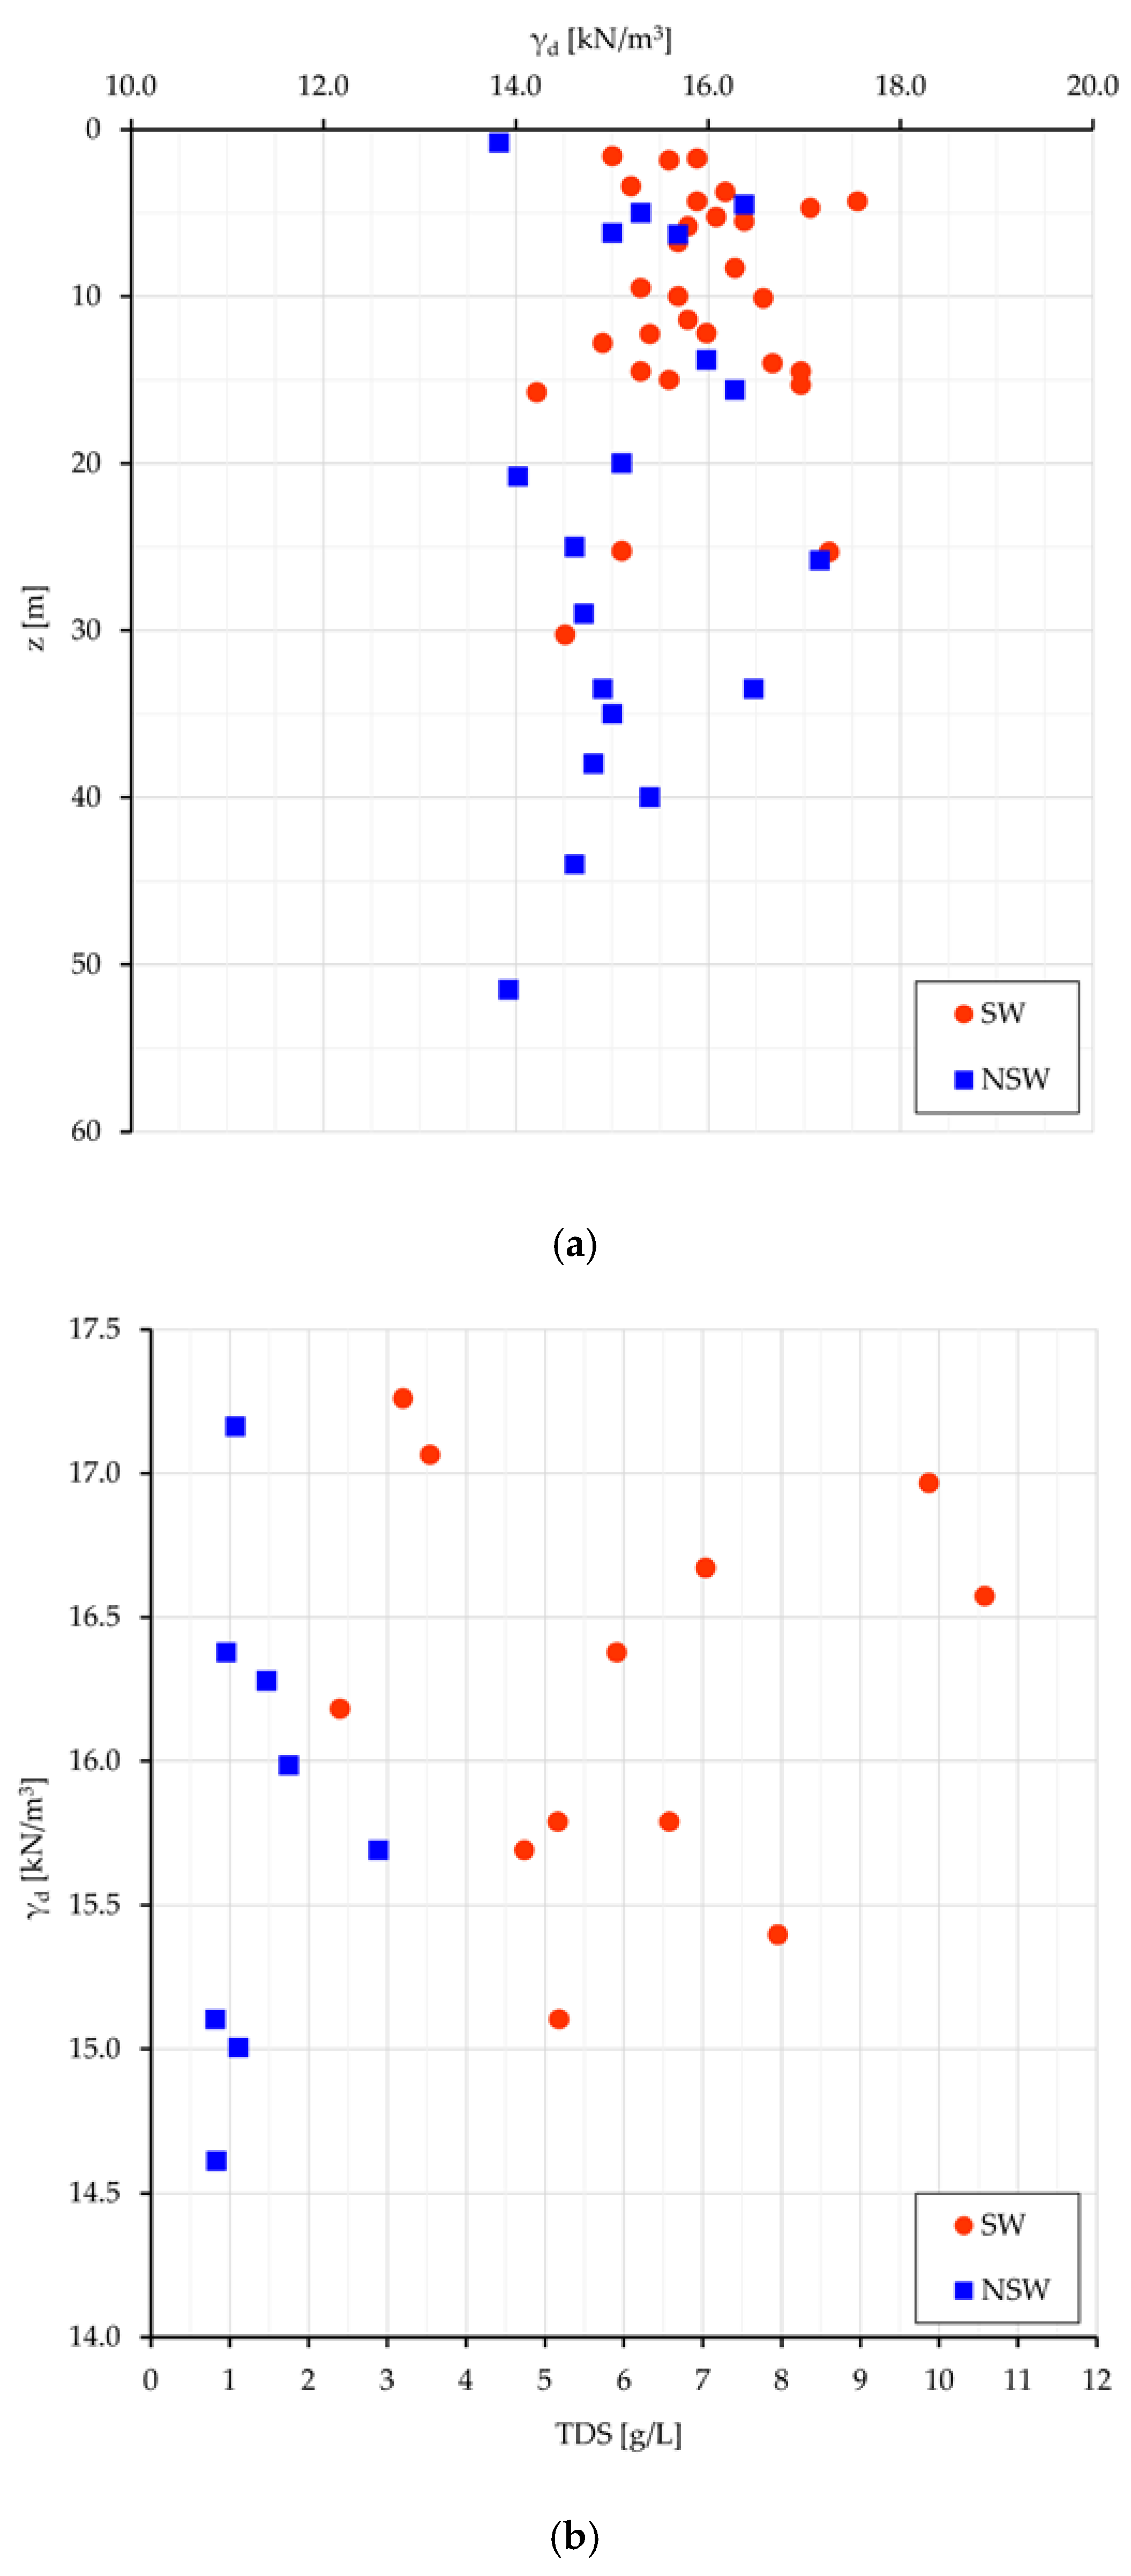
Some considerations can be made about the volumetric geological (long term) equilibrium. Since in the analyzed samples the specific gravity is quite constant (2.68 kN/cm
3), there is equivalence in the evaluation of the volumetric conditions among γ
d (unit dry weight), and e (void ratio). The most meaningful relationships are plotted for Sw and NSw samples in
Figure 5: γ
d vs. the depth from surface (z) (
Figure 5a), and γ
d vs. TDS (
Figure 5b).
If the depth from surface can be assumed as a raw representation of the consolidation stress field, the dot dispersion in
Figure 5a and the dot clustering in
Figure 5b point out that a higher density (consolidation) can be achieved neutralizing the swelling work (which leads to less dense soil arrangements and volumetric long-lasting equilibrium) with a higher salt concentration in the interstitial water (and then at nanoscale even more in the DDL). With some expected dispersion (
Figure 5b), a denser clay arrangement relates to more saline pore water and greater γ
d values in swelling than in non-swelling samples (15.9 vs. 15.2 kN/m
3). As better seen in next sections, more dense soil arrangements with high TDS values mean also high stored energy, suitable to perform work.
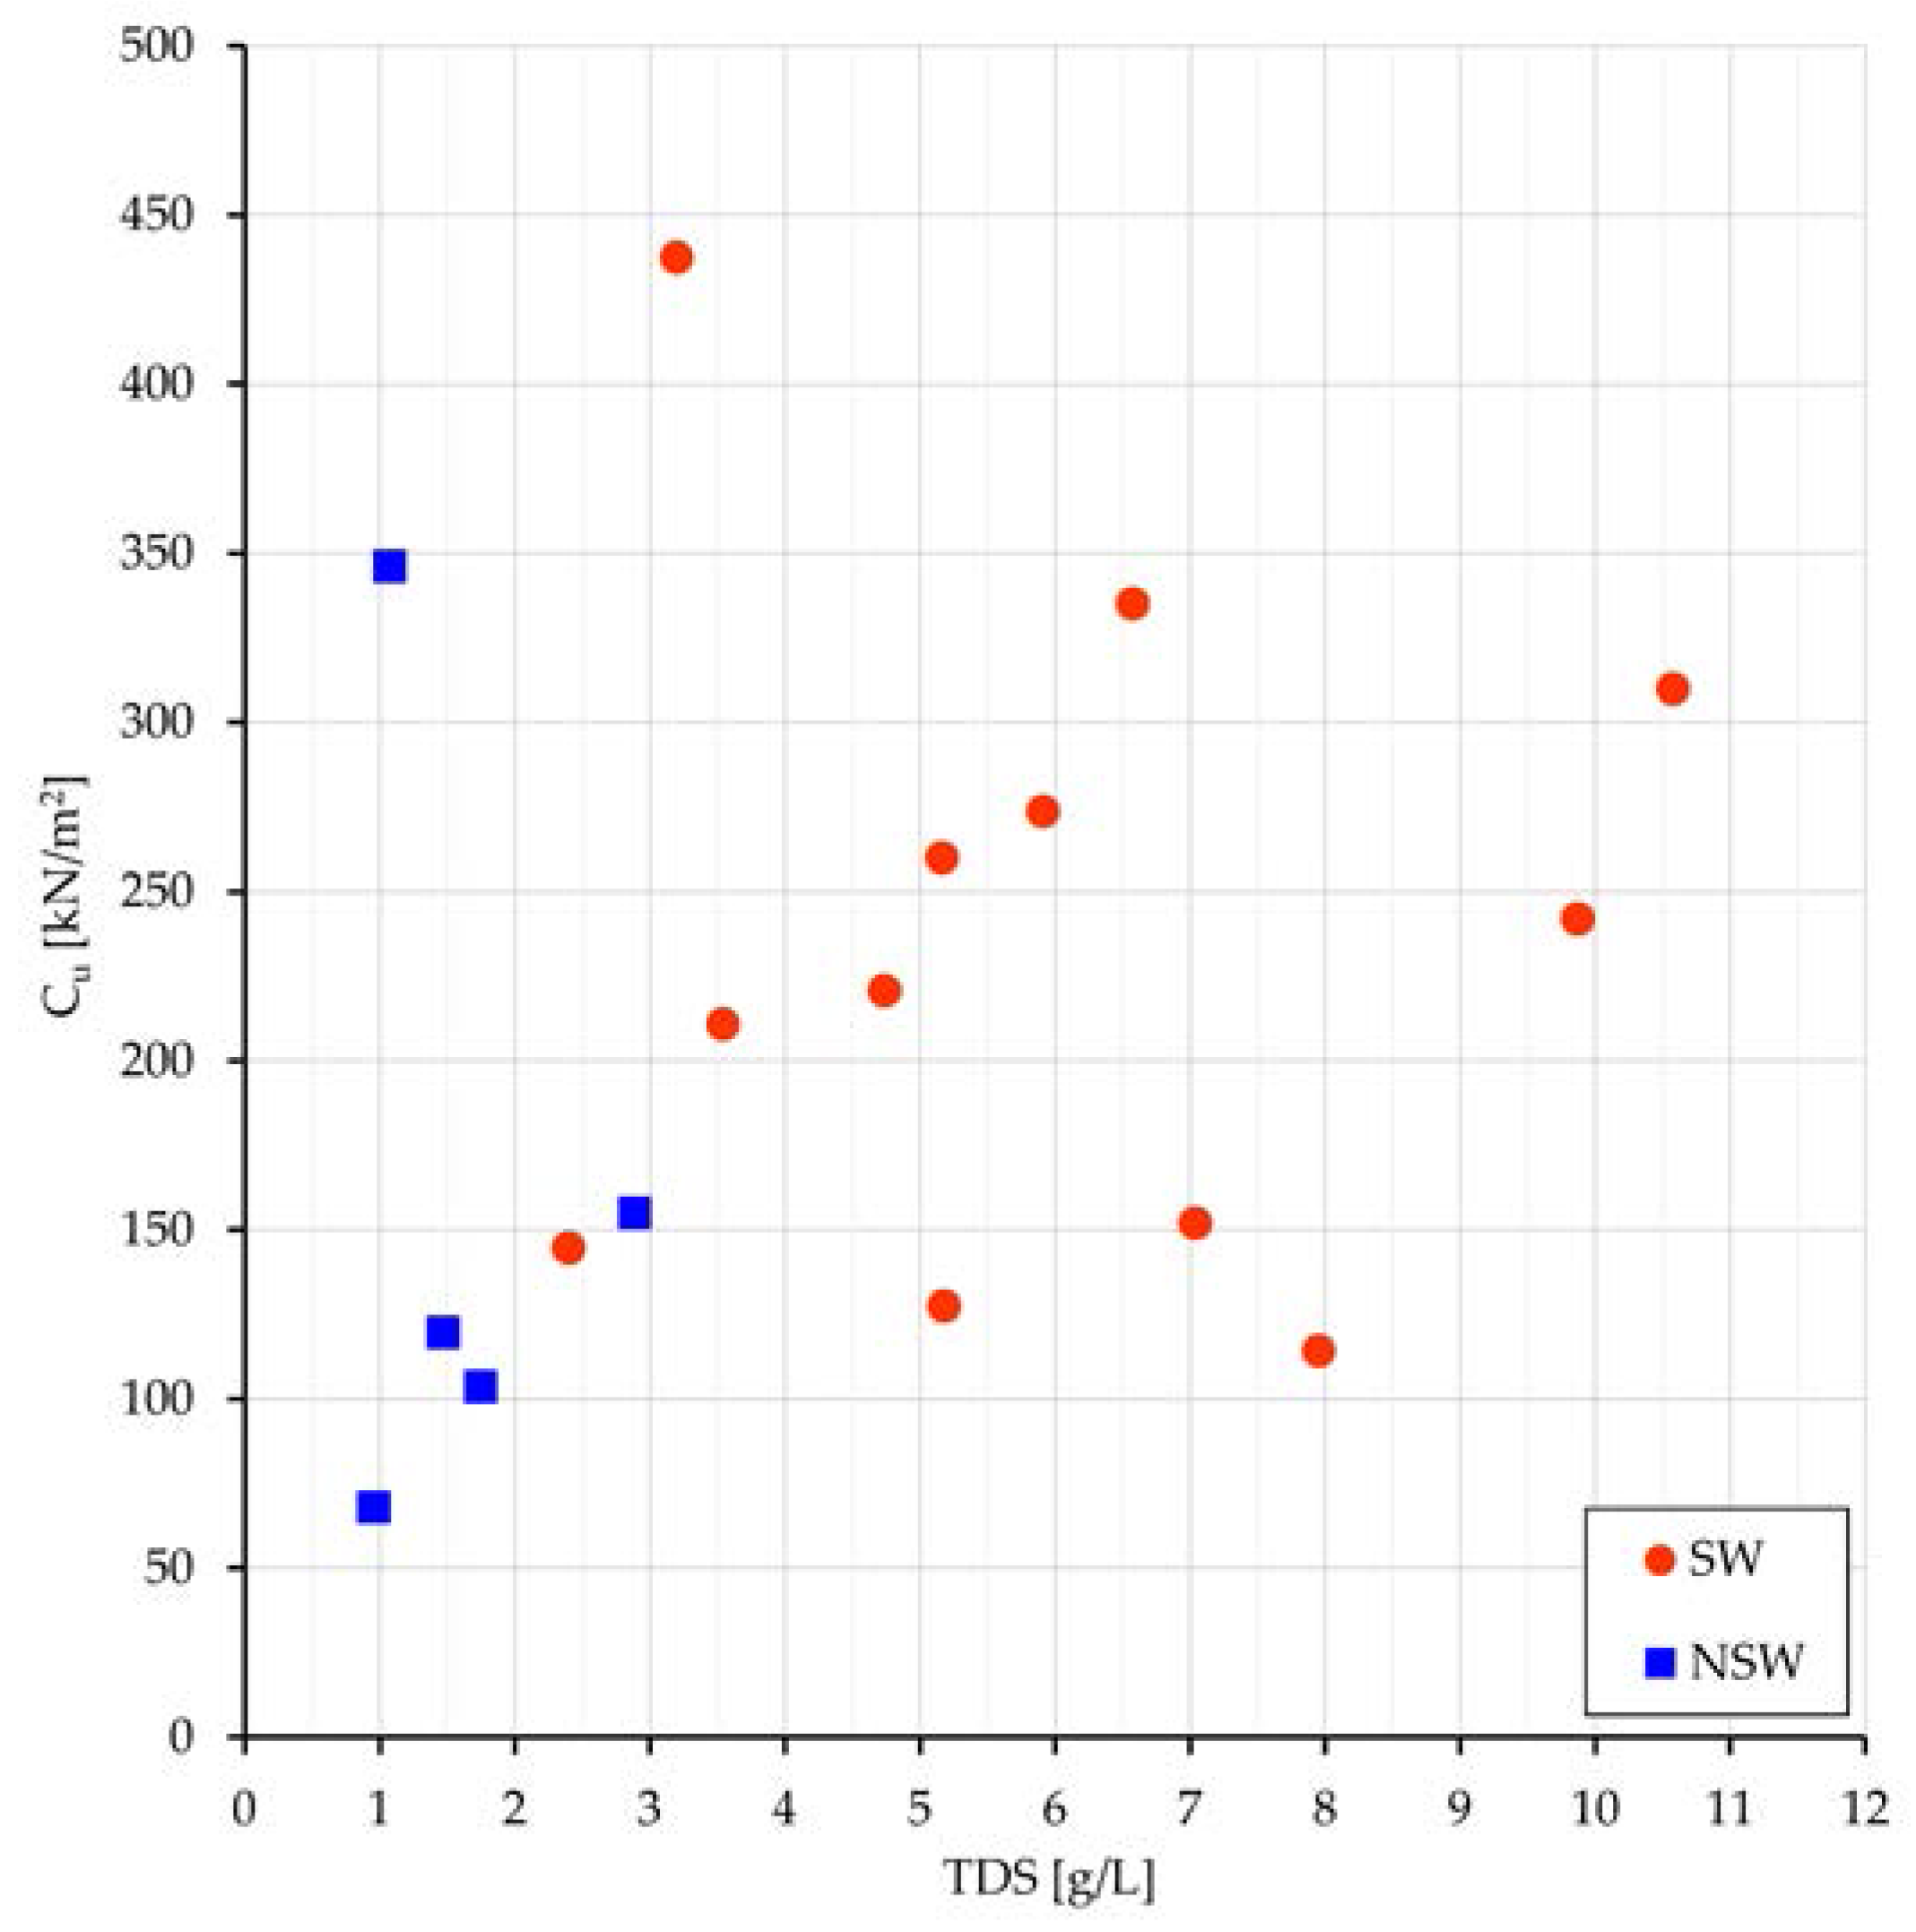
As to the undrained shear strength, the greater is γ
d or the lower is the void ratio e, the greater are normally strength and stiffness. Results of the tests show the increase of undrained cohesion(C
u) with TDS (
Figure 6) and greater values of C
u in Sw than in NSw samples (183 vs. 121 kPa).
4.3. External Work and Energy Release (Swelling)
With reference to the holistic model, the authors have introduced the mechanical work concept associated to the volume change, to better outline the clayey soil behavior, which is the algebraic result of several processes. So, in addition to the soil classification and strength parameters already cited, the synthesis of the geotechnical parameters (
Table 1) provides the values of W
c25, the loading work up to 2500 kPa, and of W
s12, which represents the negative work in the unloading from 1200 kPa to 10 kPa in a classical oedometer test. Those value limits have been chosen because in the loading phase, at lower pressures, the displacements are null or very small (and similarly the work) for the balancing of negative osmotic effects with positive mechanical compression. At higher pressure the authors suspect high probable biases introduced by soil crushing, with a synchronous increase of the amount of non-conservative work.
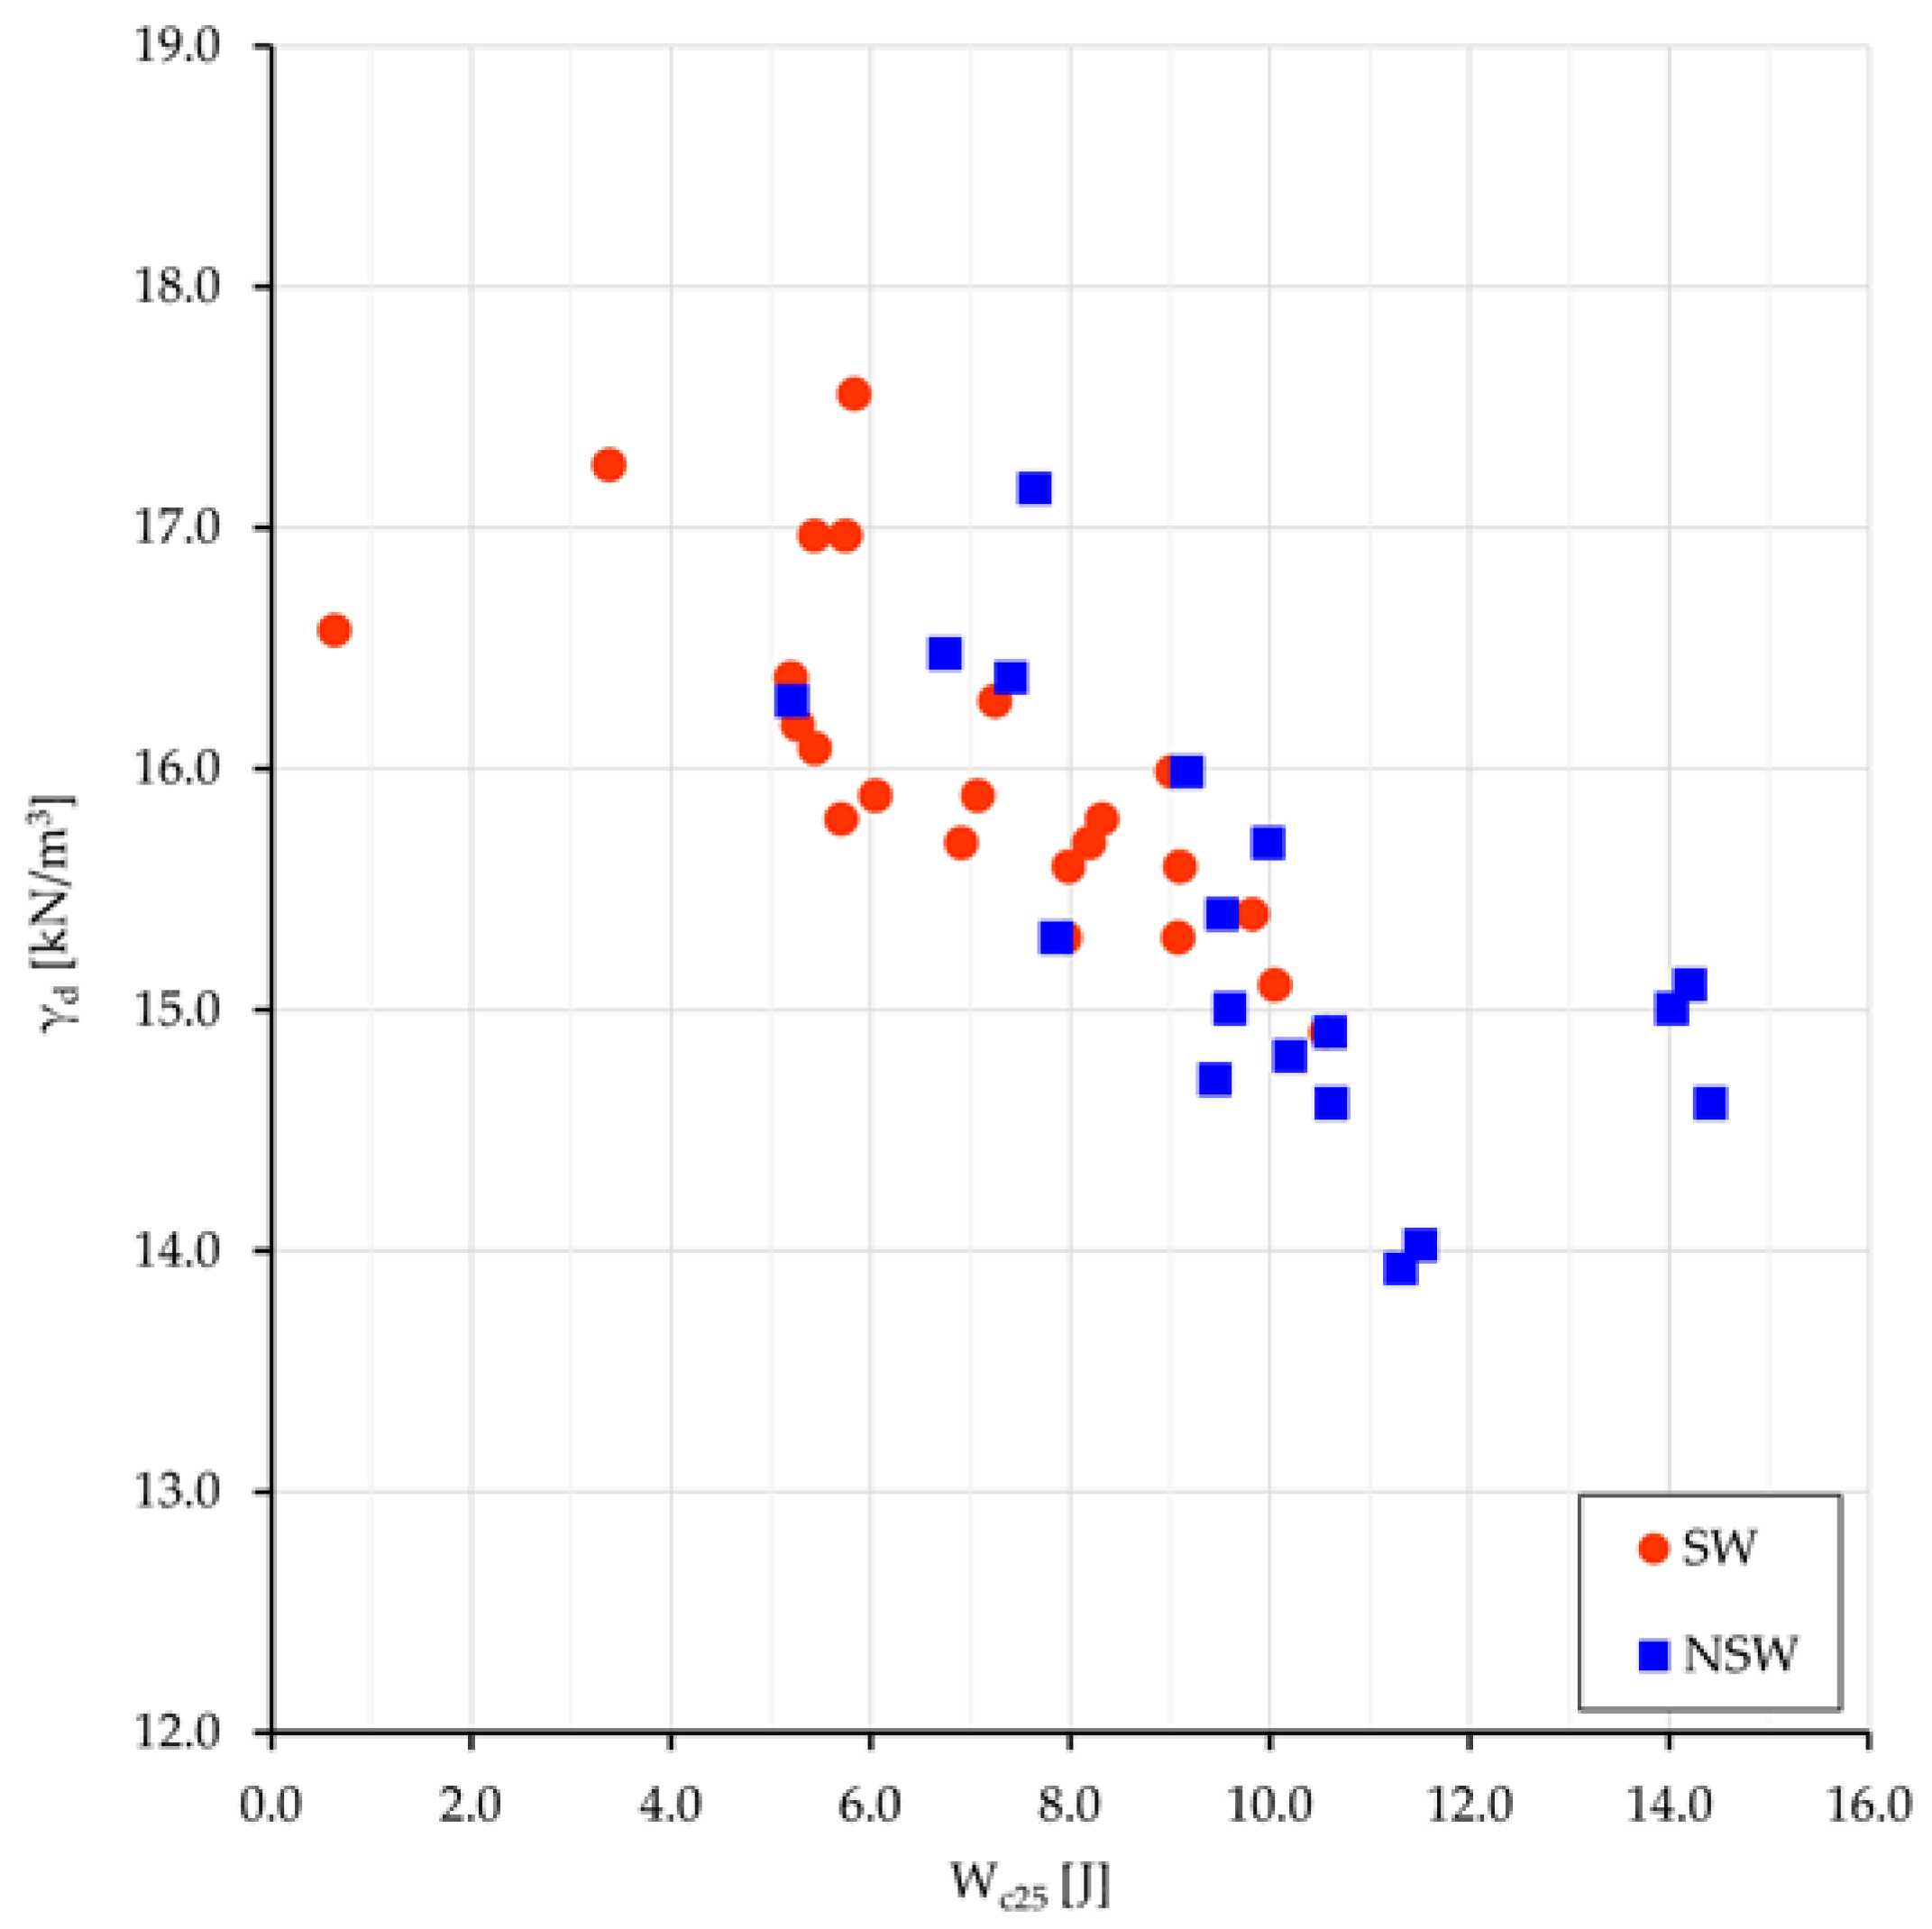
The mean values of the compression work W
c25 for the two groups, swelling and non-swelling samples, are 7.6 and 10.0 J, respectively; all values relate to the oedometer specimen size, i.e., 50 cm
3, and are comprehensive of the four terms of work (Equation (1)). The same external load performs a greater work onto NSw samples than onto Sw ones; the difference of 2.4 J must be almost entirely related to the different osmotic work W
s done under the different pore water salinity. Previous work difference, normalized to 1 m
3, gives 48 kJ. The values of γ
d vs. W
c25 are plotted in
Figure 7.
The geomorphological and associated hydrogeological border conditions influence the pore-water salinity of clayey soils. As expected, pore waters from A context (clays beneath flat marine terraces including fresh water-table aquifers) and C context (clays exposed on the deeply or gently dipping flanks of eroded terraces) are the result of the dilution of the original formation water; samples belonging to the B context (coastal marine plains) do not show dilution, while samples from the D context (salt pad) dramatically increase in salinity.
Some of these processes fall in the already well-known process of leaching; less stressed is the association of this process in clay soils to a contextual volume change deriving from an energetic balance involving at the nano-scale the variation of the dielectric properties of the DDL, its electric field and energetic conservative content. The differences in density achieved by clayey soils are the result of an energetic equilibrium under the in-situ stress field as well as under long term osmotic effects of the salt and chemical content in the pore waters.
In accordance with the volumetric changes, pore-water salinity affects, as expected, other geotechnical properties of natural clayey soils.
The stiffness and the strength increase with the increase of soil dry density, electrical conductivity or TDS; the same kind of blue clay can exhibit swelling or non-swelling behavior according to the magnitude of TDS of interstitial squeezed waters.
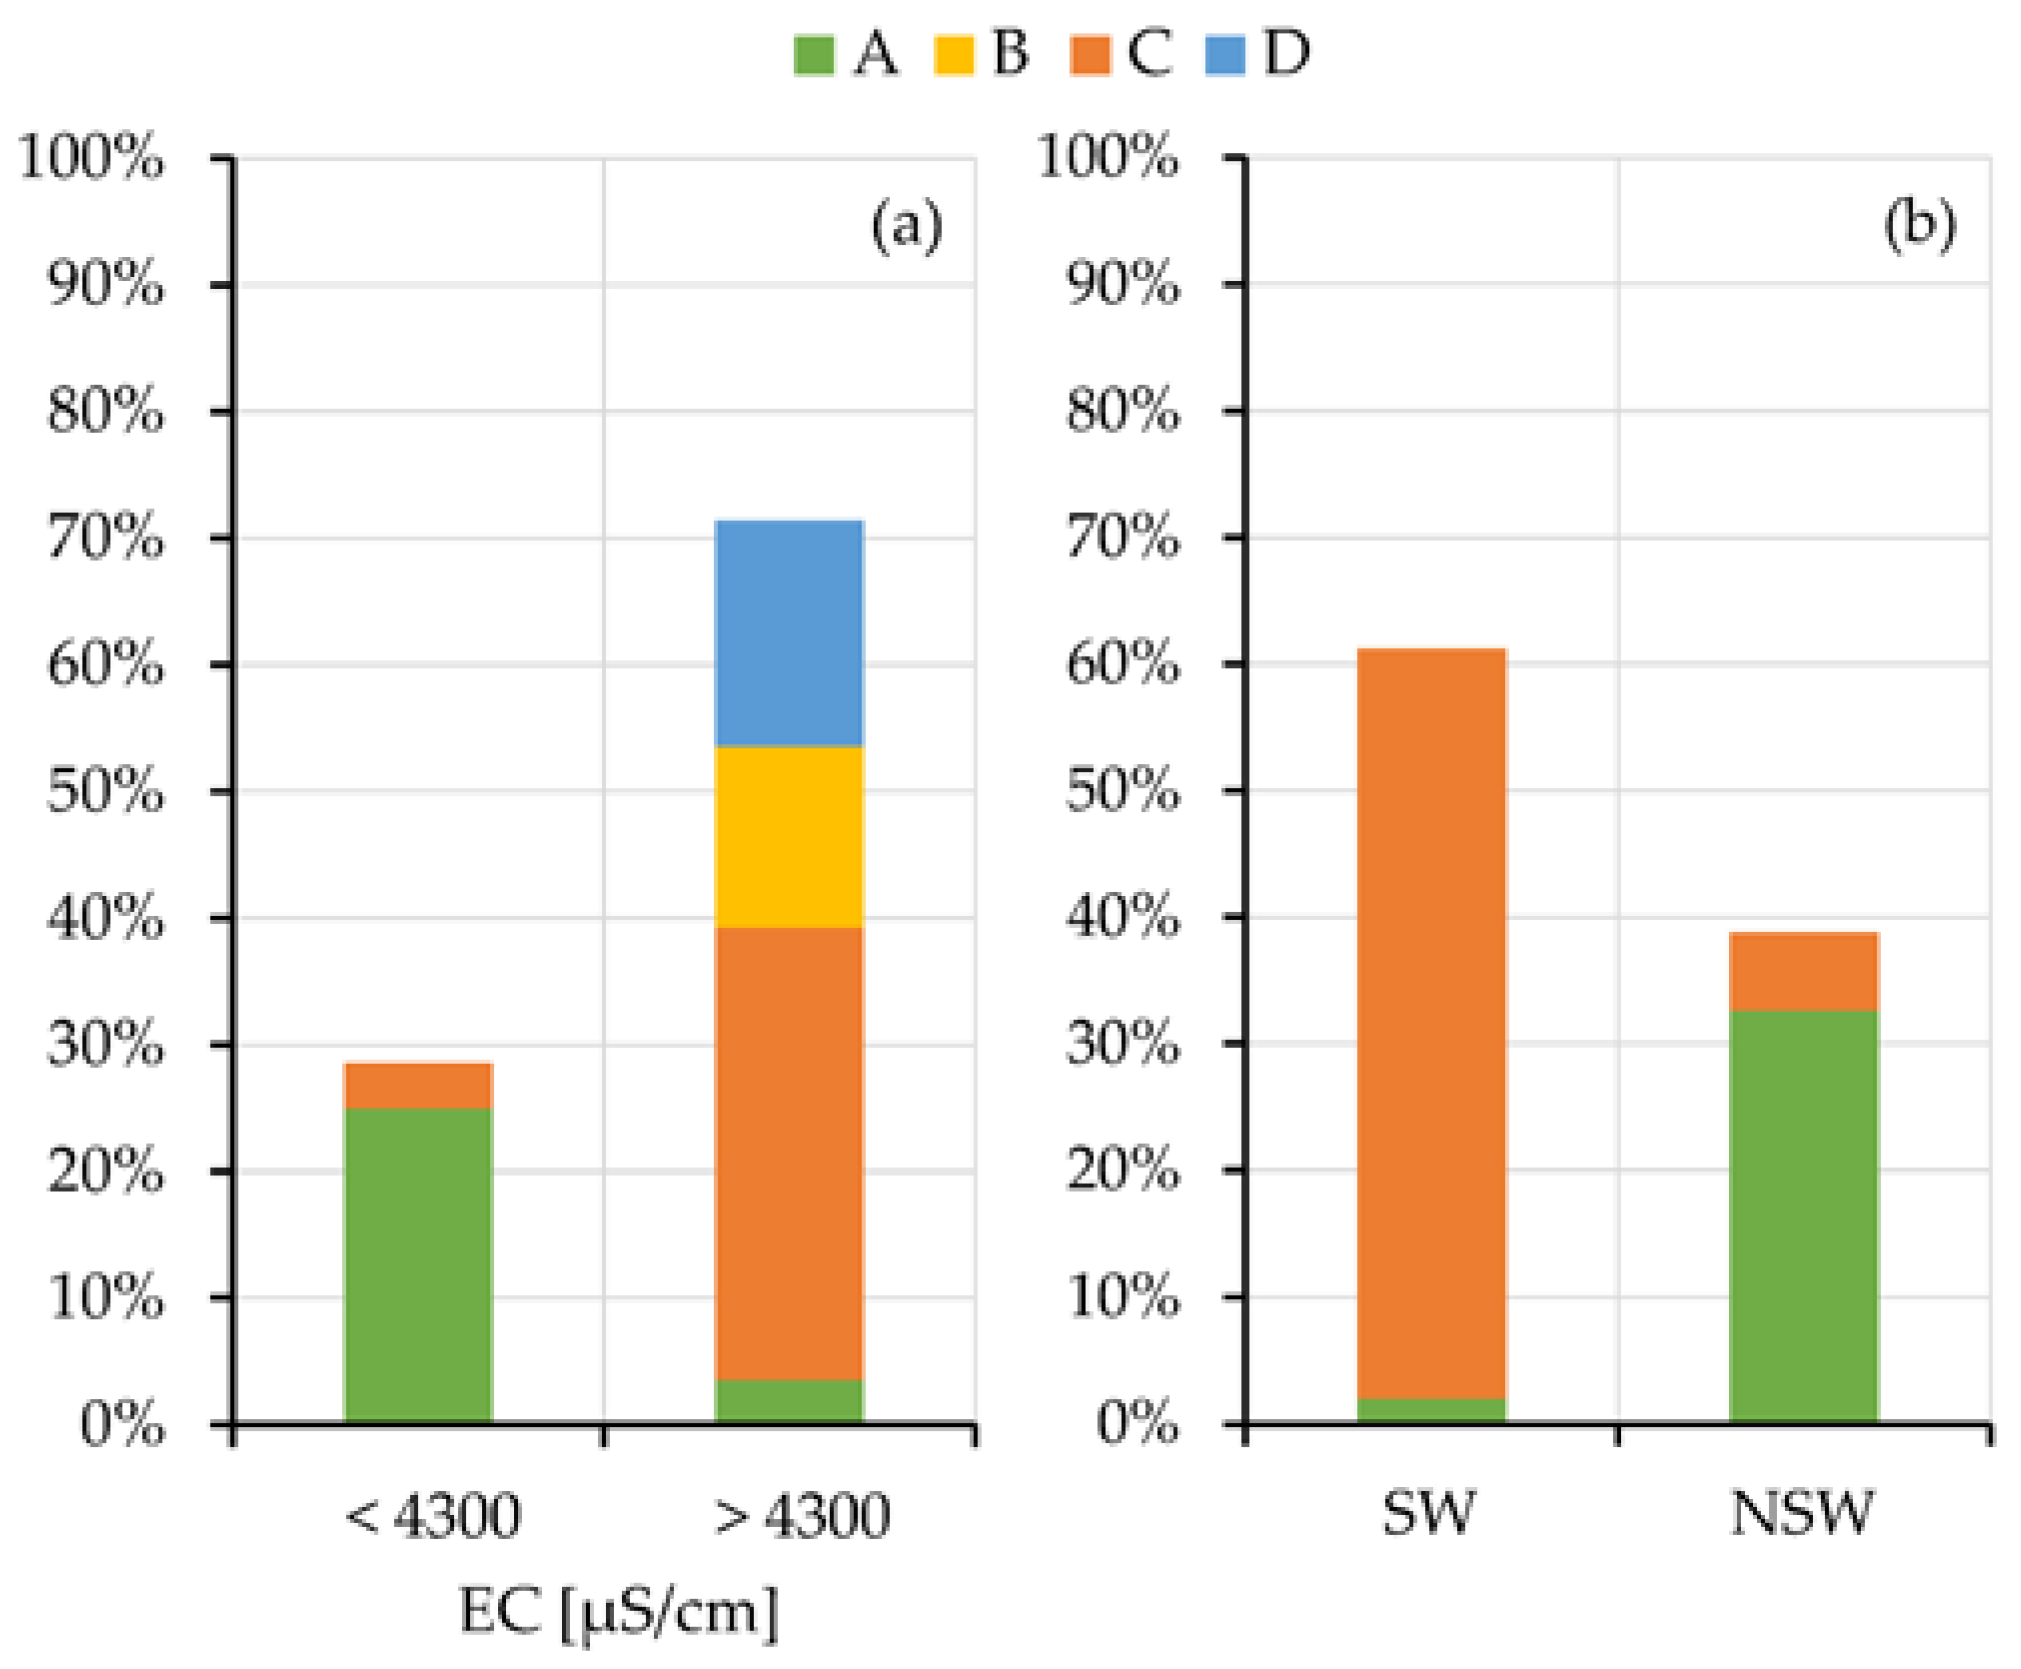
To better outline the relation of the salinity of the squeezed-out pore-waters and the swelling or non-swelling behavior with the geomorphological/hydrogeological contexts, their grouping is showed in
Figure 8. Histograms are separated because the oedometer tests and the chemical analyses of the pore-waters are not always together available for all the samples. The results clearly evidence the prevalent grouping of the low salinity (EC < 4000 µS/cm) and NSw samples in the A context.
Results summarized in
Figure 8, by linking the salinity of the pore water of the analyzed samples with the geomorphological contexts (a) and their attitude to the swelling (b), allow completing the evaluations carried out in the previous paragraphs.
Samples taken under relevant and ancient freshwater aquifers (A context) show low values of electrical conductivity and congruently fall into the NSw class. The samples from the other contexts, that is under the present sea level (B), on slopes (C) or in salt pads (D), show high electrical conductivity of the squeezed pore waters. Samples taken in these last contexts, where tests are available, mainly fall into the SW class.
5. Conclusions
The research was intended to answer to some questions. The first is about the influence of geomorphological and hydrogeological border conditions on pore-water salinity of clayey soils. The results of chemical analyses confirm that the TDS and chemical composition of squeezed pore waters vary (by dilution or concentration) compared to the native saline formation water according to the outlined geological contexts, which represent the most common frameworks in which clay formations can be found. Thus, we reasonably consider that the observed features of pore waters will be similar in similar contexts. Results suggest that both the present border conditions and the geological path at their origin allow predicting the possible variations of pore water salinity of a clay formation. A thorough outline of the geomorphology and hydrogeology features of a test site and the chemical analyses of pore waters completes the classical information on index and physical properties of clay samples.
To reply to the second question about the influence of pore water salinity on the geotechnical behavior of natural clayey soils, we examined the possible correlations between the results of geotechnical tests on core samples (physical state, classification, TRX and oedometric tests) and those related to chemical analysis of pore water (TDS and EC) squeezed from the same samples. Based on the behavior in the oedometer test, samples were classified in swelling (Sw) and non-swelling (NSw). Despite the large extent of the sampling area, the CF is slightly less than 50% and the LL is a little over the lower limit of high plasticity (CH); the main mineralogical constituent of the CF is the illite. After verifying the similarity of grain size, CF and plasticity values of all samples and the Sw and NSw grouping, good correlations have been found among unit dry density, mechanical work performed in selected stages of the one-dimensional confined compression test, swelling and non-swelling behavior, and TDS or EC of the squeezed pore waters. Thus, as to the second question we can state that the TDS (and the electrical conductivity) of pore waters influence the swelling behavior of natural clays: this swelling behavior, in turn, is definitively connected to the geomorphological and hydrogeological contexts and the geological paths of the test sites. These second findings strengthen the importance of the information on pore water salinity, which allows understanding changes in osmotic behavior of samples, either within a same site or belonging to different sites similar in index properties.
The third question, given the confirmation of previous hypotheses, deals with a practical question, viz. which parameters can be used as appropriate indicators of the osmotic component of the volumetric changes in the outlined contexts.
Really, the data acquisition on pore waters involves a more complex work, moreover specialised, compared to that required by normal laboratory tests. However, a holistic reading of the experimental data, especially oedometric tests, provides an energetic interpretation of the volumetric changes under external loading and the answers to the asked questions, even without a direct information on pore water features.
The external contribution of energy, work of overburden or sun driven capillarity, and long exposure to border low salinity waters can modify the concentration of the pore waters, which affects the DDL geometry, resulting in electric field and energy storage variations. The osmotic component of the swelling is the return of the energy previously stored in a system based on electrical fields, with an intensity depending on salt content, or concentration of specific ions, of water inside the DDL. The variations in the dielectric properties of the DDL change the intensity of the electric field and, if stress and constraint conditions allow it, there is a release of work: the final effect is a volumetric variation with the increase of the void ratio, and in a one-dimensional system, a heave.
The work of compression due to an external load of 2500 kPa measured in the oedometer resulted greater for non-swelling soils than for swelling ones, with a difference of about 2.4 J. The lower value of the mechanical work for the Sw samples is due to the osmotic process, which acts with an opposite sign in respect of the external loading. The oedometer test is performed in distilled water and does not assure the system to be thermodynamically isolated, so modifying the chemical composition and salt content of the pore waters. As a matter of fact, the work of the electrical field at the DDL scale provides an opposite contribution to the work of compressive external forces in the swelling soils.
Thus, in common predictive expert systems about soil swelling behavior some results of standard oedometer tests performed in distilled water are eligible: high values of swelling index (Cs), Ws12 or low or negative Δe must alert on the potential swelling danger.
Ultimately, the volumetric equilibrium (σ vs. e relationship) for a specific soil is also controlled by the salt content of pore fluids, which maintain native properties until new environmental or man-made hydrogeological conditions change them.

 ,
, 


