Article

Primary Producers and Anthropic Signs Related to the Flood Plain Soils of the Tablas de Daimiel Wetland

by
Francisco J. Garcia-Navarro
1,
Elvira Perona
2,
Sara Cubero
2,
Fernando Allende
3,
Sandra Bravo
1 and
Raimundo Jiménez-Ballesta
4,*
1
Department of Science and Technology Agroforestry and Genetics, Castilla-La Mancha University, 13071 Ciudad Real, Spain
2
Department of Biology, Autónoma University of Madrid, 28049 Madrid, Spain
3
Department of Geography, Autónoma University of Madrid, 28049 Madrid, Spain
4
Department of Geology and Geochemistry, Autónoma University of Madrid, 28049 Madrid, Spain
*
Author to whom correspondence should be addressed.
Geosciences 2018, 8(4), 106; https://doi.org/10.3390/geosciences8040106
Submission received: 26 January 2018 / Revised: 14 March 2018 / Accepted: 14 March 2018 / Published: 22 March 2018

Abstract

:
In the Tablas de Daimiel National Park (TDNP) wetlands, a semi-arid wetland system in Spain that is of international importance, it is believed that pollutants from a variety of sources accumulate. In the study reported here, we evaluated soils from the flooded part of this wetland in an effort to establish relationships between the abundance/structure of microbial communities (mainly cyanobacteria) and certain soil properties (redox potential, dissolved oxygen, organic matter, soil reaction, electrical conductivity, calcium carbonate, total nitrogen, soluble phosphorus and total phosphorus). This objective was achieved by establishing one transect from the entrance to exit of the flood plain, including sampling from potentially polluted sites. Substantial variations between sampling sites were found in soil in terms of salinity, dissolved oxygen (DO), organic matter (OM), total phosphorus (TP) and nitrogen (TN). The presence of primary producers was more evident in contaminated samples. In addition to calcium, high levels of oxidizable organic matter, traces of dissolved oxygen, and considerable amounts of nitrate and phosphates probably stimulated the growth of cyanobacteria, these latter characteristics can be explained as being due to the influence of wastewaters from urban, industrial and agricultural activities that run off directly into this unique wetland. In the future it will be necessary to understand the synergic effects of other soil properties.

1. Introduction

Despite the recently identified challenge of linking pedology and hydrology [1,2], wetland soils—particularly floodplain soils and their microbial diversity—have not been studied widely in comparison to terrestrial soils [3,4].
Wetlands are very important despite the fact that they cover only 6% of the Earth’s surface. These areas provide a significant number of ecosystem services; for instance, wetlands can mitigate the effects of floods, improve water quality through water purification (including denitrification and detoxification), recharge groundwater aquifers, provide habitat recreation services, sediment transfer and nutrient retention and export [5,6,7,8,9,10,11].
Cyanobacteria are common components within primary producers communities in most freshwater ecosystems (phytoplankton and phytobenthos) [12]. The results of recent studies on cyanobacteria have emphasized the important role that they play in ecosystems. Cyanobacteria can grow in any location and in any environment in which moisture and sunlight are available. Light penetration reaching the bottom of shallow lakes is influencing the development of benthic mats, frequently dominated by cyanobacteria [13]. Large proliferations of cyanobacteria are often caused by high nutrient loadings and therefore their presence can be an indicator of declining water quality (which can be associated with a range of problems such as low oxygen levels and the production of algal toxins [14,15].
Land use and soil chemistry have been shown to control microbial communities in several terrestrial systems [16]. The effects of pH on bacterial community composition and diversity have been noted in aquatic and terrestrial ecosystems [17,18]. In fact, pH is a significant factor that affects the growth, establishment and diversity of cyanobacteria, which have generally been reported to prefer neutral to slightly alkaline pH for optimum growth [19]. However, the environmental and anthropogenic factors that control the distribution and abundance of bacterial groups in wetland soils remain unknown [4]. Moreover, research on benthic cyanobacteria in temperate wetlands is scarce [13].
Wetlands that are close to agricultural, urban or industrial areas receive pollutants in the incoming waters and/or sediments, including high concentrations of trace metals and/or nutrient-rich leachates [20]. Proliferations of cyanobacteria are often caused by high nutrient loadings and their presence can serve as an indicator of declining water quality and general detrimental effects on the wetland ecosystem. The diversity of populations is reduced under eutrophication stress in rivers and lakes and the lower abundance of some organisms, mainly nitrogen-fixing cyanobacteria or species from the order Oscillatoriales, can increase or they can become dominant [21]. Heterocystous cyanobacteria are seldom found in highly enriched waters, although they can dominate in naturally high P/low N waters (e.g., Nostoc, Rivularia etc.) [22].
The Tablas de Daimiel National Park (TDNP) wetland is the most important wetland on the central plain of The Iberian Peninsula (Figure 1). This area is a rare system type, both in the Iberian Peninsula and in the world in general and the extent of this zone has diminished markedly in recent years [23]. The Tablas de Daimiel is a natural park generated by the confluence of the Guadiana and Cigüela rivers, which gives rise to a unique aquatic and underwater ecosystem. Within a semiarid area, the TDNP wetland, as has a high biodiversity, and it is included as Biosphere reserve and RAMSAR conservation ecosystem [24]. Phytoplankton diversity is also high, however, this ecosystem is undergoing an inexorable eutrophication process [25]. Results obtained to date have revealed a high eutrophication problem both during drought and at times when water is abundant [26].
The delicate balance between some performances of man and some wetlands, (included PNTD), was broken one or two decades ago due to a combination of factors, including irrigation in agriculture, potential contamination by contributions from urban sewage treatment plants and the intensive addition of fertilizers [27]. A number of anthropogenic activities could contribute to this phenomenon and as reported by [28], one of the causes of the deterioration of the TDNP could be the accumulation of sludge in the effluent beds.
Proliferations of cyanobacteria are often caused by high nutrient loadings and as such, they can serve as indicators of declining water quality and of wetland ecosystems in general. The need to understand the relationship between variations in soil quality in wetlands and cyanobacterial abundance is a prerequisite to develop strategies to prevent possible degradation of the wetland and further cyanobacterial proliferation in aquatic systems. Given that contaminated soils or sediments are known to be responsible for the decrease in water quality in natural waters, particularly in shallow and enclosed water systems [29]. It seems reasonable to evaluate sites where wetland hydrology and soil chemistry have been successfully modified by human activity to ascertain how soil environmental conditions can affect microbial community structure and activity. In this context, the aim of the study described here was to investigate the diversity and the relative abundance of primary producers in relationship to soil pH, Nitrogen (N), Phosphorus (P), Organic Matter (OM), redox potential (Eh), salinity, calcium carbonate and dissolved oxygen (DO) in the inundated area of the TDNP.

2. Materials and Methods
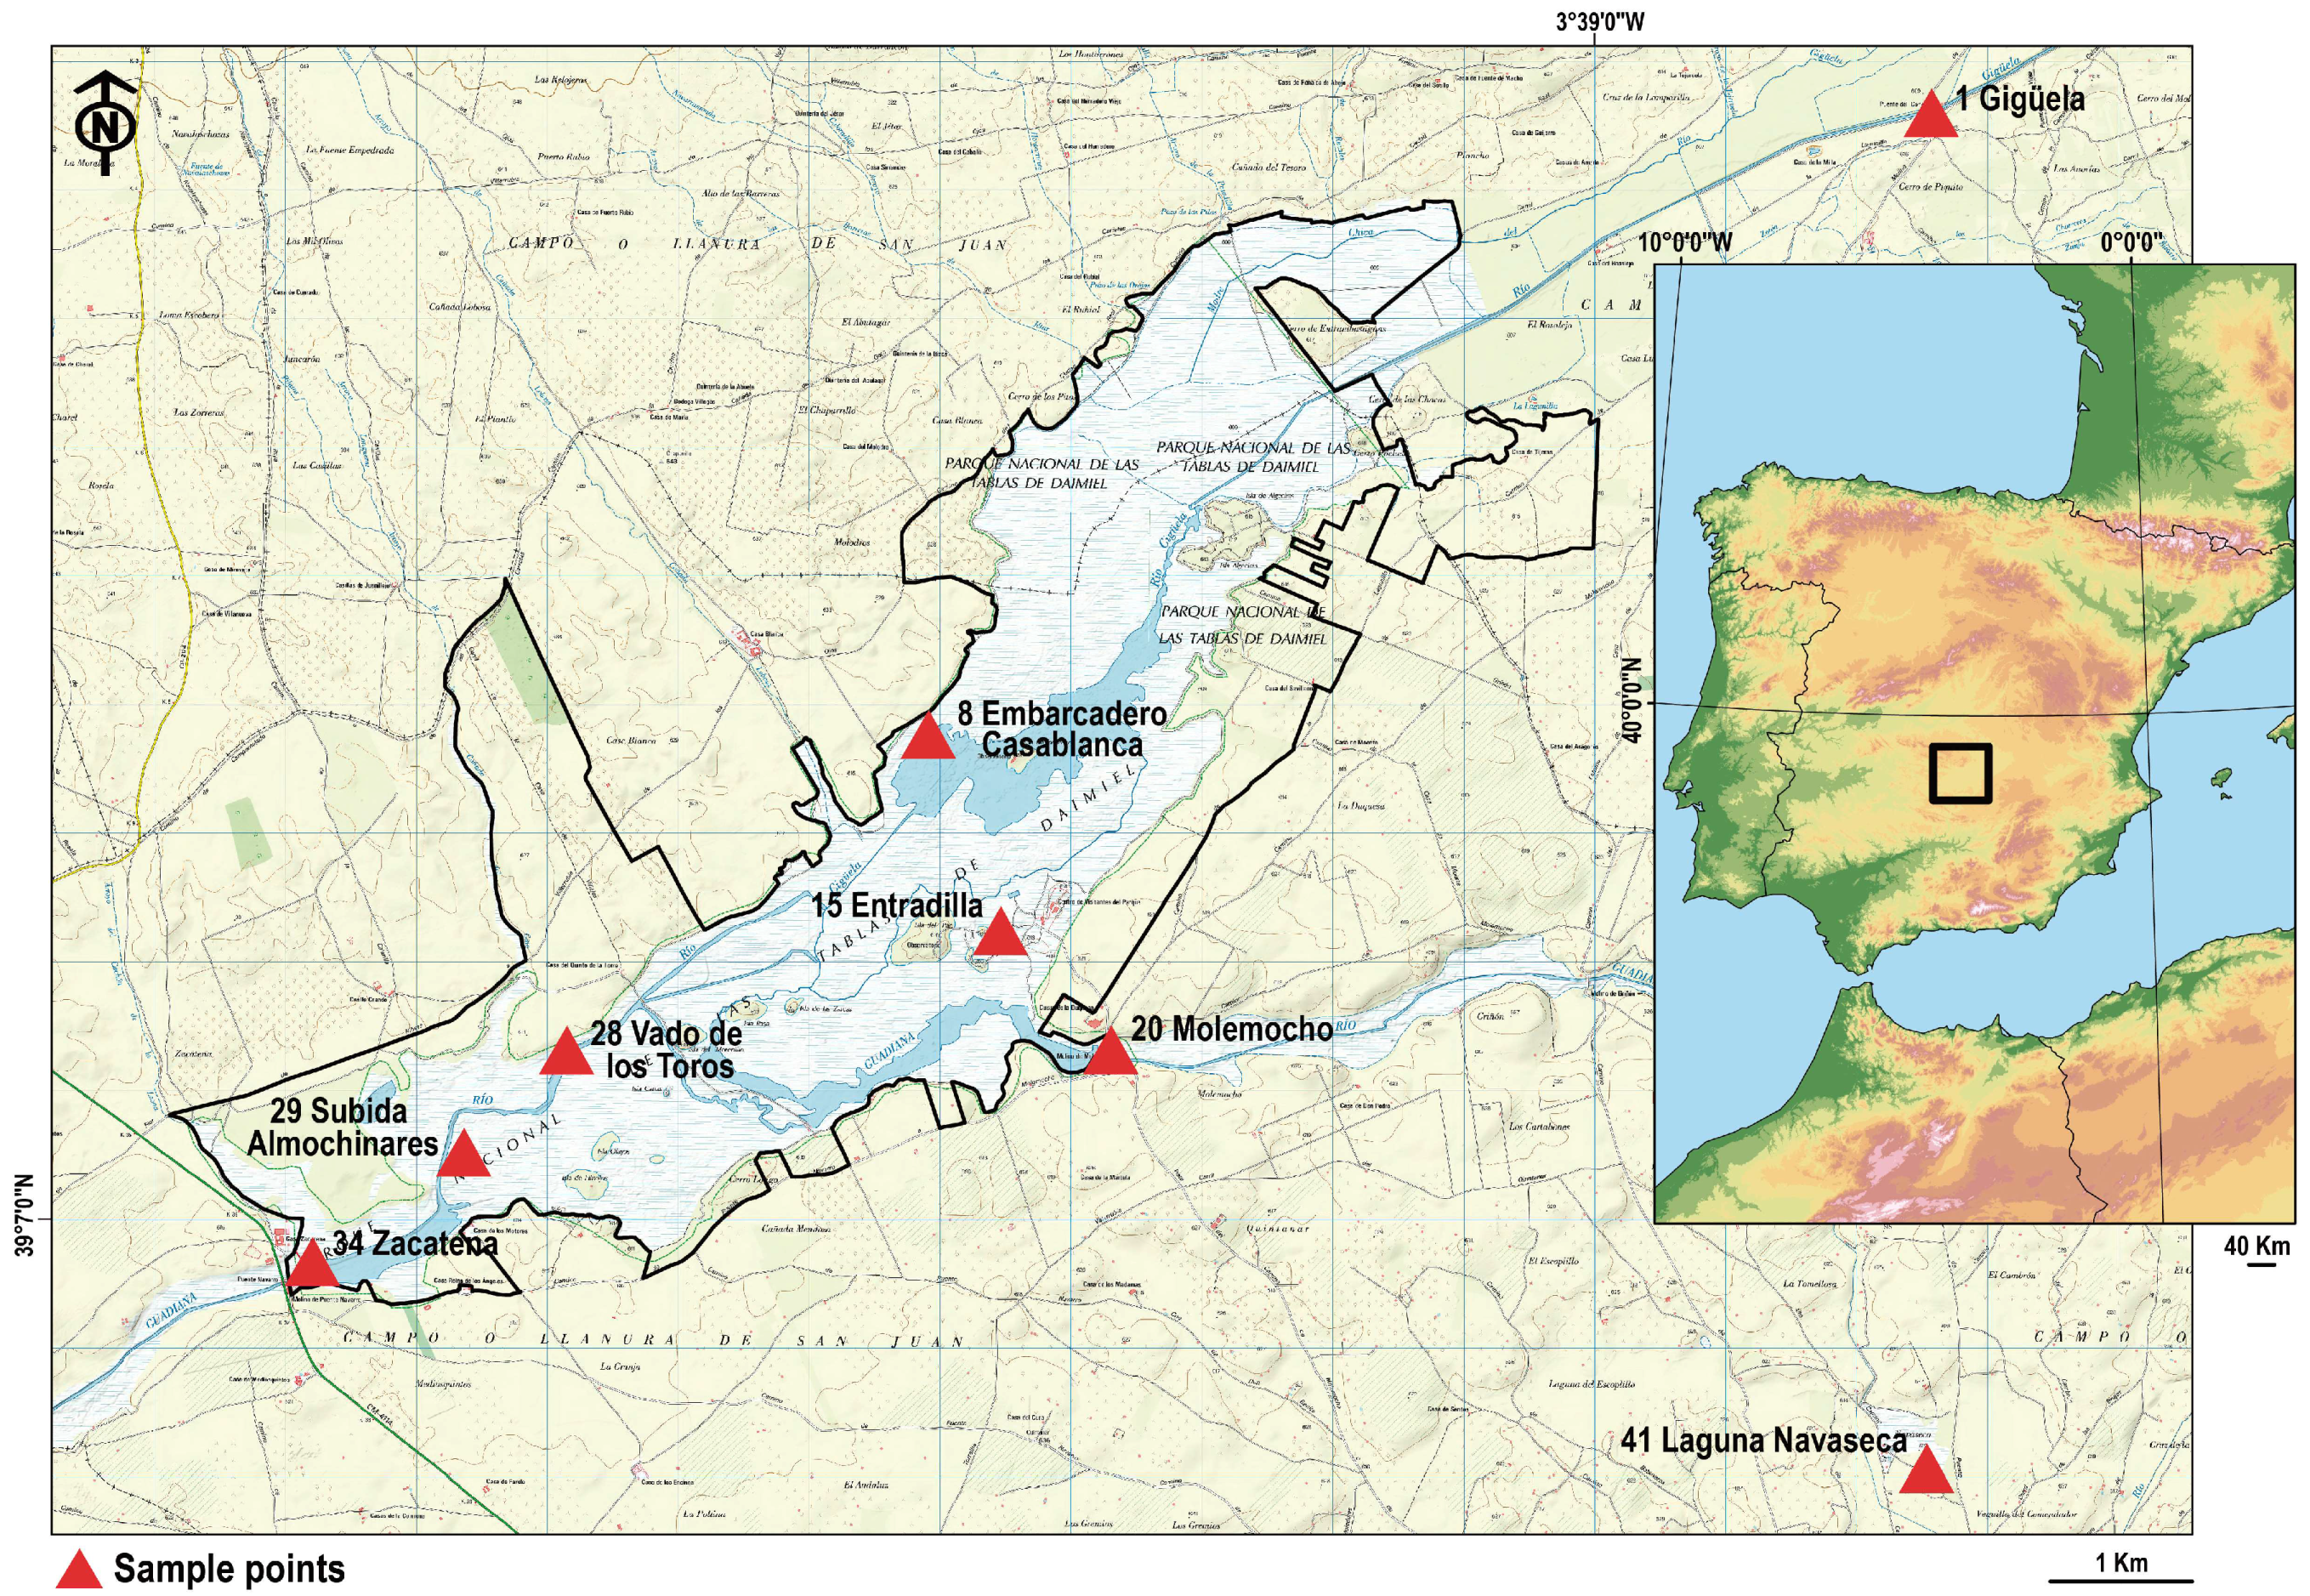
2.1. Study Site

The Tablas de Daimiel National Park represents a characteristic fluctuating Mediterranean floodplain (Figure 1). The wetland floodplain currently covers 1735 ha in the Park area and 285 ha in the Protected area [23].
In geological terms the TDNP is formed by tertiary materials that mainly consist of lacustrine carbonates, sand, gravel and alluvial conglomerates. The average annual rainfall is 370 mm and the average annual temperature is 14.4 °C. The most superficial part of the boards contains masseuse and enea, which is perhaps the most representative of the river tables; the main area of the wetland is covered by emerging macrophytic reed beds of Phragmites australis (Cav) Trin. ex Steud. and saw grass Cladium mariscus. Fish have been artificially introduced in this area and these include carp Cyprinus carpio (L.), mosquitofish Gambusia holbrooki (Gir.) and pumpkinseed Lepomis gibbosus (L.). These introduced fishes have displaced theoriginal fishes (native one) from the wetland. The flooded areas are covered by dense beds of charophytes (mainly Chara spp.) and these are affected due to the presence of invasive fish (Ciprinus carpio) and changes in water and sediment quality [30]. Soils in the flood zone are mainly Histosols [31,32] along with soils with redoximorphic features (Aquepts or Aquents by [31] or Gleysols by [32]) according to [27].

2.2. Soil Sampling

Fieldwork was carried out during November 2015 in the saturated or flood zone. Six sampling sites (numbers 8, 15, 20, 28, 29, 34) were selected in a transect oriented parallel to the shoreline, from downstream, in order to identify possible areas of the wetland affected by excessive nutrients or chemical elements pollutants; other two samples have been included as possible polluting sources (numbers 1 and 41), (Figure 1). Soil samples were collected using a Van Veen drag at each site at depths in the range 0 to 30 cm and the exact location was recorded by GPS (Table 1). The samples were placed in hermetically sealed closed plastic vials. The samples were kept at 4 °C and transported to the laboratory. Different aliquots were frozen and stored at −20 °C until soil analyses and samples for biological analyses were stored at 4 °C in the dark.

2.3. Soil Analysis

Samples were dried at 40 °C for 7 days and dry soil samples were sieved through a mesh filter with a pore size of 2 mm. The redox potential (Eh), dissolved oxygen (DO), pH, electrical conductivity (EC), calcium carbonate, total nitrogen (TN), total phosphorus (TP) and available phosphorus (SP) were determined for all samples. Eh and DO were analyzed in situ (two replicates) at each sampling site using a YSI Professional Plus Environmental probe. For dry samples the pH was determined in water in a 1:2.5 soil/water suspension; the electrical conductivity was determined on the aqueous extract with a soil/water ratio of 1:5. The total CaCO3 content was determined by the Bernard Calcimeter method using 4 M HCl. The organic matter (easily oxididable) was determined by the wet oxidation method [33]. The total nitrogen (TN) content was determined by the Kjeldahl method, which is based on the mineralization of organic nitrogen in the sample by digestion with concentrated sulfuric acid [34]. The available phosphorus was measured by the Olsen method [35], and total phosphorus was measured by FRX technique.
Standard microbiological methods were carried out on soil samples from the upper part (in contact with water). Total biomass was analyzed as the presence of organic matter and organisms by evaluating the fresh weight/dry weight ratio (FW/DW). The biomass of primary producers was estimated as the Chlorophyll a content using aliquots of fresh sample. Finally, the structure and composition of the primary producers were analyzed by microscopy in a formaline (4% final concentration) fixed sample necessary to maintain fluorescence of primary producers [36].
The biomass of primary producers in each sample was obtained estimating the concentration of Chlorophyll a by diluting 1 g of soil sample with 25 ml of distilled water. The concentration of Chlorophyll a (Chl a) was determined by acetone extraction to separate the cells and measuring absorbance of the extract at 665 and 750 nm for turbidity [37]. Data are presented as µg Chl a/g soil. Microscopic analysis of primary producers was carried out by direct observation and a semiquantitative quantification of these organisms with a focus on cyanobacteria. Optical daylight and epifluorescence microscopes (Olympus BH2) were used to identify the primary Cyanobacteria or green algae and diatoms were observed by fluorescence under green and blue filters respectively. Cells were classified using specific manuals [14,38,39,40]. The morphological parameters such as nature of filaments, the shape and size of vegetative cells, heterocysts and akinetes were taken into consideration during the identification of the cyanobacteria as primary producers.
A semiquantitative analysis of the abundance of each type of cyanobacteria was carried out by estimating the presence of each taxon (counting cells in a filaments or equal number of individual cells) using a Neubauer chamber according to protocols previously described by Douterelo et al. [36]. The abundance was classified as follows: scarce (<1%), rare (1–10%), moderate (10–40%), abundant (40–75%) and dominant (>75%).

3. Results

Soil physicochemical parameters are provided in Table 2. Soil colour (according to the Munsell Soil Color Chart [41]) is mainly 5Y, and in some cases 2.5Y, with values and chroma between 2–5/1–3. The soils are generally dark from olive, greyish or yellowish, which is typical of media affected by a layer of water and a relatively high proportion of organic matter. The soils are peat based and are characteristic of a submerged area in which saturation and reduction occur, thus showing redoximorphic features that are indicative of hydric soils.
The pH values range from 7.5 to 8.3 (Table 2) and this can be attributed mainly to the presence of abundant levels of calcium carbonate (7.60%–38.7%). The electrical conductivity values are in the range 0.68–3.41 dS/m. The soils are characterized by poor aeration and poor drainage and this causes large amounts of organic matter, at various stages of decomposition, being embedded in the soils. The relatively high organic matter content in the soils (in the range from 3.00% to 37.9%, Table 2) can be due to the large amount of wetland plants and slow decomposition rates in wet soils [42,43,44]. The accretion of nutrients and the low rates of decomposition are also modulated by the retention of floodwater, which in turn lead to the build-up of deep layers of soil [45]. The substrate, in flooded wetlands (temporarily or permanently), are sediments semi-terrestrial to sub-hydric or even water soils, in geological terms. However, in edaphic terms, the soils are formed by the accumulation and transformation of the organic residues from the marsh vegetation. Thus, thick organic horizons are generated with an organic matter content of up to 23.3%, which are considered to be Histosols [27]. If the organic matter content is low (some samples only contain 3%) then they are Gleysols. Therefore, in this case. the soils are hydromorphic with a turbid character, developed as Histosols or as Histic Gleysols. Given the abundance of poorly decomposed roots and high fiber content, we believe that these are fibrous peats. The natural formation of sulfuric acid has not been reported in these soils because they are not formed by the oxidation of sulfur compounds present in the area.
The nutrient concentrations of the soils are shown in Table 2. The nitrogen contents show a wide variation (from 0.075% to 0.604%) with a variability similar to that of organic matter or organic carbon. This trend could be due to the quality of the vegetal remains and especially to the effect of the resilience of the water layer. The C/N ratios indicate very divergent humific conditions with values varying between 20.5 and 84.3. This can be interpreted as a function of the nature of the plant material plus other environmental factors such as the depth of the water layer and the nature of the mineral media, amongst other factors. Soluble phosphorus (SP), expressed as P2O5, ranges from 12.1 to 54.3 mg/kg while the total P content (TP) reaches a maximum value in sample 41 (Navaseca lagoon) of 5.39 g/kg (a more contaminated sample) and a minimum of 0.26 g/kg in samples 15 and 29.
The floodplain hydrology is a crucial factor that influences the microbial community [46,47]. This influence is due to the fact that changes in the flood/dry periods cause fluctuating redox conditions [47,48]. The quantification of Eh is a particular benefit in periodically flooded soils; the Eh range varies from approximately −300 to +700 mV and these values are beyond those of either aerated (Eh > +400 mV) or permanently waterlogged (Eh < +350 mV) soils. Negative values indicate high electron activity and intense anaerobic conditions that are typical of permanently waterlogged soils.
The Eh values in the studied soils ranged between −171.9 and 25.4 mV (Table 2) which, according to Otero & Macıas [49,50], are indicative of variations from reduced (Eh < 100 mV) to suboxic (Eh 100–300 mV). These results reveal substantial variations that must be especially reflected in those processes in which the redox potential intervenes. However, it must be taken into account that when these measurements were carried out during a period of low rainfall, a lower concentration of dissolved oxygen and therefore a lower Eh value can be temporarily obtained.
A review of the literature revealed that many terms such as “flooded”, “saturated”, or “waterlogged” were used to describe oxygen-deficient root media. The percentage of Dissolved Oxygen Saturation (DO) showed good values in some samples (80%–120% are considered as excellent), but low values in others. The Dissolved Oxygen ranged from 143.3% to 15.4% (Table 2) and as a consequence, there are excellent values, around 100%, in samples 1 and 20indicating an equilibrium between photosynthesis and respiration; oversaturating values in sample 41, and in samples 28, 29 and 34, very low values, (below 50%), finally values for samples 8 and 15 are moderate (around 70%). The level of dissolved oxygen is controlled by salinity and probably by various other factors such as temperature and dissolved solids [51]. Low dissolved oxygen levels are common in aquatic systems, particularly in estuarine and marine systems, that have high nutrient loadings and are seasonally stratified into water with different densities. The influx of freshwater may be the cause of the high dissolved oxygen content while the lower level of dissolved oxygen may be due to the release of urban, agricultural or industrial effluents.
The organic matter biomass quoted as the weight ratio (FW/DW) and the biomass of primary producers as chlorophyll a content by dry weight (Chl a/DW) are represented in Figure 2. Different types of sample can be differentiated: two samples (samples 1 and 41, the most contaminated) showed the maximum biomass of primary producers due to the highest values of chlorophyll a and also high values for the FW/DW ratio. A second group of samples (samples 8 and 15) showed similar but lower values (with ratios of around 4 and 5) and it is therefore expected to find more abundant organisms. The rest of the samples had low values and the number of organisms is probably also low.
The taxonomic composition of soil primary producer assemblages varied greatly between sampled soils. The abundance of dominant groups was unexpectedly uniform among soils. The structure and abundance of organisms found are shown in Table 3. Cyanobacteria and diatoms were present with different proportions in all samples, while other groups only appear in one sample (such as green algae or fungi). These findings could be related to the different phosphorus concentrations reached in these reservoirs from agricultural or industrial activities, with such variations capable of modifying the abundance of cyanobacteria [52]. Generally, samples had a low biomass of organisms with the exception of samples 1, 8 and 41, in which the presence of primary producers was more evident. The structure of the cyanobacterial community is shown in Figure 2. Analysis of these data allows three groups of soil samples to be clearly differentiated and these are described below.
Group 1 includes samples 1, 8 and 41, and these had a high abundance of primary producer organisms (Table 3), which were mainly cyanobacteria and a wide variety of diatoms. Sample 8 is one of the richest samples in terms of variety and a greater abundance of cyanobacteria was observed, including filamentous cyanobacteria without heterocysts from the Oscillatoriales orders (Figure 3A) and some diatoms (Figure 3C), which are quite abundant in environments that have available nitrogen [53]. Unicellular cyanobacteria were also observed and these were easily visible using green epifluorescence analysis (Figure 3B,C,E). The cyanobacteria belonged to the genera Phormidium, Oscillatoria, Pseudanabaena and Leptolyngbya, all of which come from the LPP group that comprises the majority of filamentous cyanobacteria without heterocysts. However, the amount of cyanobacteria in samples 1 and 41 slightly lower levels than sample 8. Sample 1 contained abundant small-sized diatoms and some filamentous cyanobacteria of the Oscillatoriales order, e.g., Leptolyngybya (Figure 3D) and Phormidium. Furthermore, the presence of fungi (in a small proportion), organisms with saprophytic capabilities, have only very rarely been observed. Sample 41 contained the most diverse organisms in terms of diatoms and cyanobacteria and was a rich sample in variety and abundance. Furthermore, some unicellular and filamentous cyanobacteria, e.g., Pseudanabaena (Figure 3E) and Phormidium (Figure 3B), were also found in this sample. The presence of Anabaena and some other blooming cyanobacteria has been linked to low DO contents in eutrophic waterbodies [54,55].
Group 2 is formed by samples 15 and 20 and it is characterized by the moderate abundance of diatoms and cyanobacteria. Both of these soil samples gave similar results at the biological species level. These samples had a low abundance of diatoms. The cyanobacteria observed were filamentous morphotypes without heterocysts, such as Leptolyngbya type (Figure 3L) and unicellular types included in the Chroococcales order (Figure 3H) in sample 15 and some Phormidium (Figure 3I) and Pseudanabaena (Figure 3J,K) were found in sample 20.
Group 3 includes samples 28, 29 and 34. These samples have low biomass and poor biodiversity, with the sparse presence of diatoms and in some cases only frustules were visible (thus indicating dead forms of diatoms, Figure 3O). Limited filamentous cyanobacteria were observed and these included, for example, Leptolyngbya (Figure 3M) in sample 28 and Phormidium (Figure 3N) in sample 34. Sample 29 also contained fungi (Figure 3P), albeit to a lesser extent than samples discussed above and this could indicate a decomposition stage of the sample in relation with the samples of groups 1 and 2.
These results show that three different types of soils can be identified: soils that are well developed with good biological activity, characterized by a high proportion and variety of primary producer organisms, i.e., samples denoted as group 1 (samples 8, 1 and 41), in which sample 8 exemplifies the high abundance of filamentous species, probably due to the presence of a nitrogen source that favours the development of these species [56]. The other samples presented less biomass and low variability for all groups indicating that these samples have low biodiversity and low biological activity indicating that this samples are worth highlighting, particularly in group 3, where fungi and dead cells were observed. These characteristics could be influenced by some factors that affect the soil area or that were altered in the past.

4. Discussion

Several reactions are initiated during soil flooding which lead to reduced soil redox potential, influencing some physical, chemical and biological processes which have significant implications for the wetland. Moche et al. [57] found that the monthly changes of the soil microbial community structure were more influenced by soil and site properties (such as flood duration, drainage conditions and the magnitude of soil carbon) than by highly dynamic properties (soil temperature, soil moisture and temporal fluctuations of extractable carbon between others).
In many parts of the world, flowing waters receive substantial nutrient inputs, including both nitrogen (N) and phosphorus (P). The natural dynamics of the TDNP have been altered markedly, especially in the last few decades. The TDNP depends on the current existence of both the scarce contributions of the Guadiana and the Gigüela rivers as well as the contributions from the transfers and food derived from other sources, such as the sewage treatment plant purifiers of Villarrubia de los Ojos, Daimiel and Manzanares villages. The materials that enter into the TDNP are gradually sedimented and as such it is not surprising that there is a greater accumulation in certain zones.
High species diversity of any particular group of organisms in a natural habitat can be interpreted as being essentially the same as the system being a major biotic component. Histosols are unique wet soil habitats that are very suitable for blue-green algae to flourish according to Roger et al. [58]. In Histosol, the significant contributions to soil fertility in terms of the physico-chemical, biological and soil-water relationships are well known. Zancan et al. [59] noted that the roles of cyanobacteria in soil conditioning and as soil bio-indicators are also important. The highest levels of decomposing organic matter and nitrogen, which may be the reason for the high algal community parameters noted here, were mainly found in samples 8, 29 and 34. Cyanobacteria has clear preferences to grow in calcareous water systems [12], in general, calcaric (calcareous) soils such as those studied here are not considered to be stressed environments for cyanobacteria [60,61,62,63,64]. Similarly, Singh et al. [65] reported the abundant cyanobacterial populations in soils with a highly alkaline pH. However, the exact relationship between pH and the growth of specific cyanobacterial species in soils has yet to be confirmed, but our samples from group 1 had the highest pH analyzed and this would be consistent with the idea outlined above which could be also related with the photosynthesis processes. The availability of water is a primary factor in determining the abundance of algae in soils [66]. Contrary to our data, [67] considered that bacterial composition and diversity are strongly related with soil pH, land use, and restoration status, but less so to nutrient concentrations and not at all with wetland type or soil carbon.
The concentration and quality of nutrients are probably the more important factors which affect the cyanobacterial diversity [68]. The availability of phosphates and nitrates are important factors that favour the abundance of cyanobacteria in wetlands [59] and our sample with a high abundance and diversity of cyanobacteria is included in group 1 and had the highest concentration of P. The highest concentration of N appears to be related with the abundance of cyanobacteria from the Oscillatoriales order (filamentous without heterocyst). Increases of this type of cyanobacteria, filamentous without heterocysts (from Oscillatoriales order) were obtained in other aquatic systems like rivers, where diversity is clearly related to the nutrient concentration [69] indicating a clear relation of these cyanobacteria to high nitrogen concentrations.
Growth of cyanobacteria over other algae groups in this kind of aquatic system is related to high values of BOD, COD, phosphates and nitrates coupled with very low DO [70,71]. This could be the reason for the flourishing growth of cyanobacteria in some samples affected by the effluents from wastewater treatment plants. Among the soil properties, pH is certainly the most important factor that determines the diversity (flora and fauna). In culture media, the optimal pH for the growth of cyanobacteria is the range 7.5–10, with a lower limit close to 6.5–7.0 [63]. All of the soil samples from the TDNP fall within this range. The abundance of cyanobacteria is attributed to the favorable content of oxidizable organic matter and the lower levels of dissolved oxygen (Table 1), a similar observation was supported by Rao [72] and Venkateswarlu [73]. Phosphorus concentrations have been considered the main drivers of cyanobacterial growth [68,74,75,76]. Boominathan [61] and Vijayakumar et al. [62] suggested that environments rich in calcium cyanobacteria can grow prolifically. In addition to calcium, high levels of oxidizable organic matter, traces of dissolved oxygen, and considerable amounts of nitrate and phosphates present in all the effluents investigated [20] were probably the factors that stimulated the growth of cyanobacteria, as suggested by Vijayakumar et al. [62] and as found in industrialized wetlands in India [52].
The data referred to samples 1 and 41 help to contemplate that wastewater from urban activities and from agricultural and industrial run off are the only potential sources that would explain the high levels of P and N found. The heavy reliance on chemical fertilizers, pesticides, and herbicides, is widespread in modern agriculture [77,78]. Our field observations allow us to point out that soils and solid pollutants reach the channels and water transports them, in this case to Las Tablas, where they are deposited due to the slower water circulation. The vegetation can accumulate and retains these pollutants and there is usually only flow downstream of the TDNP. The only approach to neutralize or limitate the pollution damage is biomonitoring soil bioindicators, as Guerriero et al. [79] showed.

5. Conclusions

The conclusion of the study described here is that substantial variations between sampling sites were found in soils and these were related to salinity, dissolved oxygen (DO), organic matter (OM) and total phosphorus (TP) and nitrogen (TN). In contaminated samples (with high concentrations of N or P) the presence of primary producers was more evident. The presence of some blooming cyanobacteria has been linked to low DO content and the availability of phosphates and nitrates are important factors that favour the abundance of cyanobacteria. Considerable amounts of nitrogen and phosphorus probably stimulated the growth of cyanobacteria, along with calcium, high levels of oxidizable organic matter and traces of dissolved oxygen. The concentrations of N and P could be explained as being due to the influence of wastewaters from urban, industrial and agricultural activities, since some samples so testify.

Acknowledgments

The authors are grateful to the Autonomous Organism Parques Naturales of Spain (OAPN) for providing financial assistance. The authors are grateful to the management of OAPN: the Director of the OAPN Basilio Rada, the subdirector Montserrat Fernandez and the Director of the PNTD Carlos Ruiz.

Author Contributions

RJB and FJGN conceived and planned the work, SB and SC verified the analytical methods, RJB, FJGN and EP wrote the manuscript and finally FA assisted and helped carry out the manuscript, tables and figures.

Conflicts of Interest

The authors declare no conflict of interest.

References

  1. Lin, H.S.; Bouma, J.; Pachepsky, Y. Revitalizing pedology through hydrology and connecting hydrology to pedology. Geoderma 2006, 131, 255–256. [Google Scholar] [CrossRef]
  2. Kutilek, M.; Nielsen, D.R. Interdisciplinarity of hydropedology. Geoderma 2007, 138, 252–260. [Google Scholar] [CrossRef]
  3. Rinklebe, J.; Langer, U. Microbial diversity in three floodplain soils at the Elbe River (Germany). Soil Biol. Biochem. 2006, 38, 2144–2151. [Google Scholar] [CrossRef]
  4. Rinklebe, J.; Langer, U. Floodplain soils at the Elbe River, Germany, and their diverse microbial biomass. Arch. Agron. Soil Sci. 2008, 54, 259–273. [Google Scholar] [CrossRef]
  5. Mitsch, W.J.; Gosselink, J.G. Wetlands, 3rd ed.; Van Nostrand Reinhold: New York, NY, USA, 1993. [Google Scholar]
  6. Mitsch, W.J.; Gosselink, J.G. Wetlands; John Wiley & Sons: New York, NY, USA, 2000. [Google Scholar]
  7. USEPA; USDA-NRCS. A Handbook of Constructed Wetlands; Volume 1: General Considerations; USEPA Region III with USDA-NRCS: Washington, DC, USA, 1995.
  8. Cooper, P.F.; Job, G.D.; Green, M.B.; Shutes, R.B.E. Reed Beds and Constructed Wetlands for Wastewater Treatment; WRc Publications: Medmenham, Marlow, UK, 1996. [Google Scholar]
  9. Vymazal, J.; Brix, H.; Cooper, P.F.; Green, M.B.; Haberl, R. Constructed Wetlands for Wastewater Treatment in Europe; Backhuys Publishers: Leiden, The Netherlands, 1998. [Google Scholar]
  10. United States Environmental Protection Agency (EPA). Wetland Functions and Values OF Wetlands; EPA 843-F-01-002c; EPA: Washington, DC, USA, 2001.
  11. Russi, D.; ten Brink, P.; Farmer, A.; Badura, T.; Coates, D.; Förster, J.; Kumar, R.; Davidson, N. The Economics of Ecosystems and Biodiversity for Water and Wetlands; Ramsar Secretariat, Gland; IEEP: London, UK; Brussels, Belgium, 2013. [Google Scholar]
  12. Whitton, B.A. Diversity, ecology and taxonomy of cyanobacteria. In Photosynthetic Procaryotes; Mann, N.H., Carr, N.G., Eds.; Biotechnology Handbooks; Plenum Press: London, UK, 1992; Volume 6, pp. 1–51. [Google Scholar]
  13. Scott, J.T.; Marcarelli, A.M. Cyanobacteria in freshwater benthic environments. In The Ecology of Cyanobacteria; Springer: Dordrecht, The Netherlands, 2012. [Google Scholar]
  14. Komárek, J. Cyanobacterial taxonomy: Current problems and prospects for the integration of traditional and molecular approaches. Algae 2006, 21, 349–375. [Google Scholar] [CrossRef]
  15. Sejnohova, L.; Marsalek, B. Microcystis. In Ecology of Cyanobacteria II; Whitton, B.A., Ed.; Springer: Berlin, Germany, 2012; pp. 126–154. [Google Scholar]
  16. Kennedy, N.; Brodie, E.; Connolloy, J.; Clipson, N. Impact of lime, nitrogen and plant species on bacterial community structure in grassland microcosms. Environ. Microbiol. 2004, 6, 1070–1080. [Google Scholar] [CrossRef] [PubMed]
  17. Lindstrom, E.S.; Kamst-Van Agterveld, M.P.; Zwart, G. Distribution of typical freshwater bacterial groups is associated with pH, temperature, and lake water retention time. Appl. Environ. Microbiol. 2005, 71, 8201–8206. [Google Scholar] [CrossRef] [PubMed]
  18. Fierer, N.; Jackson, R.B. The diversity and biogeography of soil bacterial communities. Proc. Natl. Acad. Sci. USA 2006, 103, 626–631. [Google Scholar] [CrossRef] [PubMed]
  19. Kaushik, B.D. Algalization of rice in salt-affected soils. Ann. Agric. Res. 1994, 14, 105–106. [Google Scholar]
  20. Jiménez-Ballesta, R.; García-Navarro, F.J.; Bravo Martín-Consuegra, S.; Pérez-de-los-Reyes, C.; Amorós Ortíz-Villajos, J.A.; Fernández San Miguel, M. The impact of the Storage on Nutrients and Other Trace Elements on the Degradation of a Wetland. Int. J. Environ. Res. 2018. [Google Scholar] [CrossRef]
  21. Perona, E.; Bonilla, I.; Mateo, P. Spatial and temporal changes in wáter in a Spanish river. Sci. Total Environ. 1999, 241, 75–90. [Google Scholar] [CrossRef]
  22. Dodds, W.; Castenholz, R. Effects of grazing and light on the growth of Nostoc pruniforme (Cyanobacteria). Br. Phycol. J. 1988, 23, 219–227. [Google Scholar] [CrossRef]
  23. Mejías, M. Las Tablas y Los Ojos del Guadiana: Agua, Paisaje y Gente; Instituto Geológico y Minero, Organismo Autónomo Parques Naturales: Madrid, Spain, 2014; 360p. [Google Scholar]
  24. Troya, A.; Bernués, M. Humedales Españoles en la Lista del Convenio de Ramsar: ICONA Ministerio de Agricultura; Alimentación y Pesca: Madrid, Spain, 1990. [Google Scholar]
  25. Ortega-Mayagoitia, E.; Armengol, X.; Rojo, C. Structure and dynamics of zooplankton in a semi-arid wetland, the National Park Las Tablas de Daimiel (Spain). Wetlands 2000, 20, 629–638. [Google Scholar] [CrossRef]
  26. Rojo, C.; Ortega-Mayagoitia, E.; Rodrigo, M.A.; Alvarez-Cobelas, M. Phytoplankton structure and dynamics in a semiarid wetland, the National Park ‘Las Tablas de Daimiel’ (Spain). Arch. Hydrobiol. 2000, 148, 397–419. [Google Scholar] [CrossRef]
  27. Jiménez Ballesta, R. Los suelos del Parque Natural de Las Tablas de Daimiel; Universidad Autónoma de Madrid: Madrid, Spain, 2014; 104p. [Google Scholar]
  28. Sanchez-Ramos, D.; Sanchez-Emeterio, G.; Florin, M. Changes in water quality of treated effluents by their receiving environments in Tablas de Daimiel National Park, Spain. Environ. Sci. Pollut. Res. 2016, 23, 6082–6090. [Google Scholar] [CrossRef] [PubMed]
  29. Toluna, L.G.; Okaya, O.S.; Gainesb, A.F.; Tolayc, M.; Tuefekceia, H.; Koratlod, N. The pollution status and the toxicity of surface sediments in Izmit Bay (Marmara Sea), Turkey. Environ. Int. 2001, 26, 63–168. [Google Scholar]
  30. Laguna, C.; López-Perea, J.J.; Viñuela, J.; Florín, M.; Feliu, J.; Chicote, A.; Cirujano, S.; Mateo, R. Effects of invasive fish and quality of water and sediment on macrophytes biomass, and their consequences of a waterbird community of a Mediterranean floodplain. Sci. Total Environ. 2016, 551–552, 312–521. [Google Scholar] [CrossRef] [PubMed]
  31. Soil Survey Staff. Keys to Soil Taxonomy, 7th ed.; USDA-NCRS: Washington, DC, USA, 2006.
  32. FAO-ISRIC-ISSS. World Reference Base for Soil Resources. A Framework for International Classification, Correlation and Communication; World Soil Resources Reports 103; FAO: Rome, Italy, 2006; 132p. [Google Scholar]
  33. Anne, A. Sur le dosage rapid du carbone organique de sols. Ann. Agron. 1945, 2, 161–172. [Google Scholar]
  34. Bremner, J.M.; Mulvaney, C.S. Methods of soil analysis, part 2 chemical and microbiological properties. Soil Sci. Soc. Am. 1982, 1159, 595–624. [Google Scholar]
  35. Olsen, S.R.; Cole, C.V.; Watanabe, F.S.; Dean, L.A. Estimation of Available Phosphorus in Soils by Extraction with Sodium Bicarbonate; United States Department of Agriculture: Washington, DC, USA, 1954; Volume 939. [Google Scholar]
  36. Douterelo, I.; Perona, E.; Mateo, P. Use of cyanobacteria to assess water quality in running water. Environ. Pollut. 2004, 127, 377–384. [Google Scholar] [CrossRef] [PubMed]
  37. Marker, A.F.H. The use of acetone and methanol in the estimation of chlorophyll in the presence of phaeophytin. Freshw. Boil. 1972, 2, 361–385. [Google Scholar] [CrossRef]
  38. Komárek, J.; Anagnostidis, K. Nomenclatural novelties in Chroococcalean cyanoprokaryotes. Preslia 1995, 67, 15–23. [Google Scholar]
  39. Komárek, J.; Kaštovský, J. Coincidences of structural and molecular characters in evolutionary lines of cyanobacteria. Algol. Stud. 2003, 109, 305–325. [Google Scholar] [CrossRef]
  40. Komárek, J.; Komárkova-Legnerová, J. Taxonomic evaluation of cyanobacterial microflora from alkaline marshes of northern Belize. 1. Phenotypic diversity of coccoid morphotypes. Nova Hedwig. 2007, 84, 65–111. [Google Scholar] [CrossRef]
  41. Munsell Color Company. Munsell Soil Color Charts; Munsell Color Company: Baltimore, MD, USA, 1954. [Google Scholar]
  42. Rinklebe, J.; Heinrich, K.; Neue, H.U. Der umsetzbare Kohlenstoff als Indikator für die potentielle bodenmikrobielle Aktivit€at in Auenb€oden. In Projektbereich Naturnahe Landschaften und L€andliche R€aume; Scholz, M., Stab, S., Henle, K., Eds.; UFZ Bericht Nr: Leipzig, Germany, 2001; Volume 8, pp. 74–83. [Google Scholar]
  43. Jokic, A.; Cutler, J.N.; Ponomarenko, E.; van der Kamp, G.; Anderson, D.W. Organic carbon and sulphur compounds in wetland soils: Insights on structure and transformation processes using K-edge XANES and NMR spectroscopy. Geochim. Cosmochim. Acta 2003, 67, 2585–2597. [Google Scholar] [CrossRef]
  44. Hill, J.R.; O’Driscoll, N.J.; Lean, D.R. Size distribution of methylmercury associated with particulate and dissolved organic matter in freshwaters. Sci. Total Environ. 2009, 408, 408–414. [Google Scholar] [CrossRef] [PubMed]
  45. Wright, A.L.; Reddy, K.R. Heterotrophic microbial activity in northern Everglades wetlands soils. Soil Sci. Soc. Am. J. 2001, 65, 1856–1864. [Google Scholar] [CrossRef]
  46. Bossio, D.A.; Scow, K.M. Impact of carbon and flooding on the metabolic diversity of microbial communities in soils. Appl. Environ. Microbiol. 1995, 61, 4043–4050. [Google Scholar] [PubMed]
  47. Rinklebe, J.; Langer, U. Relationship between soil microbial biomass determined by SIR and PLFA analysis in floodplain soils. J. Soils Sediments 2010, 10, 4–8. [Google Scholar] [CrossRef]
  48. Frohne, T.; Rinklebe, J.; Diaz-Bone, R.A. Contamination of floodplain soils along the Wupper River, Germany, with As, Co, Cu, Ni, Sb, and Zn and the impact of pre-definite redox variations on the mobility of these elements. Soil Sediment Contam. 2014, 23, 779–799. [Google Scholar] [CrossRef]
  49. Shaheen, S.M.; Rinklebe, J.; Rupp, H.; Meissner, R. Lysimeter trials to assess the impact of different flood-dry-cycles on the dynamics of pore water concentrations of As, Cr, Mo and V in a contaminated floodplain soil. Geoderma 2014, 228–229, 5–13. [Google Scholar] [CrossRef]
  50. Otero, X.L.; Macías, F. Biogeochemistry and Pedogenetic Process in Saltmarsh and Mangrove Systems; New Science Publishers: New York, NY, USA, 2010. [Google Scholar]
  51. Patnaik, K.C.; Misra, P.M. Seasonal variation in the physiochemical properties of Rushikulya estuary and its effect on the occurrence of chanos fry. J. Indian Fish. 1990, 20, 69–71. [Google Scholar]
  52. Rani Deep, P.; Bhattacharyya, S.; Nayak, B. Cyanobacteria in wetlands of the industrialized Sambalpur District of India. Aquat. Biosyst. 2013, 9, 14. [Google Scholar] [CrossRef] [PubMed]
  53. Stancheva, R.; Sheath, R.G.; Read, B.A.; McArthur, K.D.; Schroepfer, C.; Kociolek, J.P.; Fetscher, A.E. Nitrogen-fixing cyanobacteria (free-living and diatom endosymbionts): Their use in southern California stream bioassessment. Hydrobiologia 2013, 720, 111–127. [Google Scholar] [CrossRef]
  54. Moss, B. Ecology of Freshwaters, Man and Medium, Past to Future; Blackwell Science Ltd.: Oxford, UK, 1998. [Google Scholar]
  55. Mbonde, A.S.E.; Shayo, S.; Sekadende, B.C.; Lyimo, T.J. Phytoplankton species diversity and abundance in the near shore waters of Tanzanian side of Lake Victoria. Tanzan. J. Sci. 2004, 30, 71–81. [Google Scholar] [CrossRef]
  56. Loza, V.; Perona, E.; Mateo, P. Specific responses to nitrogen and phosphorus enrichment in cyanobacteria: Factors influencing changes in species dominance along eutrophic gradients. Water Res. 2014, 48, 622–631. [Google Scholar] [CrossRef] [PubMed]
  57. Moche, M.; Gutknecht, J.; Schulz, E.; Langer, U.; Rinklebe, J. Monthly dynamics of microbial community structure and their controlling factors in three floodplain soils. Soil Biol. Biochem. 2015, 90, 169–178. [Google Scholar] [CrossRef]
  58. Roger, P.A.; Reynaud, P.A. Free Living Blue Green Algae in Tropical Soils. In Microbiology of Tropical Soils and Plant Productivity; Dommer-Gues, Y., Diem, H., Eds.; Martinus Nijhoff Publisher: La Hague, France, 1982; pp. 147–168. [Google Scholar]
  59. Zancan, S.; Trevisan, R. and Paoletti, M.G. Soil Algae Composition under Different Agro-Ecosystem in NorthEastern Italy. Agric. Ecosyst. Environ. 2006, 112, 1–12. [Google Scholar] [CrossRef]
  60. Lukesova, A. Soil Algae in Brown coal and Lignite Post mining areas in Central Europe (Czech Republic and Germany). Res. Ecol. 2001, 9, 341–350. [Google Scholar] [CrossRef]
  61. Boominathan, M. Bioremediation Studies on Dairy Effluent Using Cyanobacteria. Ph.D. Thesis, Bharathidasan University, Tiruchirapalli, Tamil Nadu, India, 2005. [Google Scholar]
  62. Vijayakumar, S.; Thajuddin, N.; Manoharan, C. Role of cyanobacteria in the treatment of dye industry effluent. Pollut. Res. 2005, 24, 69–74. [Google Scholar]
  63. Nayak, S.; Prasanna, R. Soil pH and Its Role in Cyanobacterial Abundance and Diversity in Rice Field Soils. Appl. Ecol. Environ. Res. 2007, 5, 103–113. [Google Scholar] [CrossRef]
  64. Selvi, T.K.; Sivakumar, K. Cynobacterial Diversity and Related Physico-Chemical Parameters in Paddy Fields of Cuddalore District, Tamil Nadu. Int. J. Res. Environ. Sci. Technol. 2011, 1, 7–15. [Google Scholar]
  65. Singh, P.K.; Kishore, S.; Prakash, S.; Singh, K. Cyanophycean Algae Inhabiting Sodic Soil Exhibit Diverse Morphology: An Adaptation to High Exchangeable Sodium. Ecoprint 2008, 15, 15–21. [Google Scholar] [CrossRef]
  66. Mataloni, G.; González, G.G.; Bolter, M.; Convey, P.; Fermani, P. What shapes edaphic communities in mineral and ornithogenic soils of Cierva Point, Antarctic Peninusula? Polar Sci. 2010, 4, 405–419. [Google Scholar] [CrossRef]
  67. Hartman, W.H.; Richardson, C.J.; Vilgalys, R.; Bruland, G.L. Environmental and anthropogenic controls over bacterial communities in wetland soils. Proc. Natl. Acad. Sci. USA 2008, 105, 17842–17847. [Google Scholar] [CrossRef] [PubMed]
  68. Mateo, P.; Leganés, F.; Perona, E.; Loza, V.; Fernández-Piñas, F. Cyanobacteria as bioindicators and bioreporters of environmental analyses in aquatic ecosystems. Biodivers. Conserv. 2015. [Google Scholar] [CrossRef]
  69. Loza, V.; Perona, E.; Mateo, P. Molecular fingerprinting of cyanobacteria from river biofilms as a water quality monitoring tool. Appl. Environ. Microbiol. 2013, 79, 1459–1472. [Google Scholar] [CrossRef] [PubMed]
  70. Singh, V.P.; Saxena, P.N. Preliminary studies on algal succession in raw and stabilized sewage. Hydrobiologia 1969, 34, 503–512. [Google Scholar] [CrossRef]
  71. Venkateshwarlu, V. Taxonomy and ecology of algae in the river Moosi. Hyderabad (India). Nova Hedwigia. 1976, 27, 661–676. [Google Scholar]
  72. Rao, C.B. On the distribution of algae in a group of six small ponds. II. Algal periodicity. J. Ecol. 1955, 43, 291–308. [Google Scholar] [CrossRef]
  73. Venkateshwarlu, V. An ecological study of the algae of the river Moosi. Hyderabad (India) with special reference to water pollution. II. Factors influencing the distribution of algae. Hydrobiologia 1969, 34, 352–362. [Google Scholar] [CrossRef]
  74. Moisander, P.H.; Steppe, T.F.; Hall, N.S.; Kuparinen, J.; Paerl, H.W. Variability in nitrogen and phosphorus limitation for Baltic Sea phytoplankton during nitrogenfixing cyanobacterial blooms. Mar. Ecol. Prog. Ser. 2003, 262, 81–95. [Google Scholar] [CrossRef]
  75. Tanaka, T.; Rassoulzadegean, F.; Thingstad, T.F. Orthophosphate uptake by heterotrophic bacteria, cyanobacteria, and autotrophic nanoflagellates in Villefranche Bay, northwestern Mediterranean: Vertical, seasonal, and short-term variations of the competitive relationship for phosphorus. Limnol. Oceanogr. 2004, 49, 1063–1072. [Google Scholar] [CrossRef]
  76. Rangel, L.M.; Silva, L.H.S.; Rosa, P.; Roland, F.; Huszar, V.L.M. Phytoplankton biomass is mainly controlled by hydrology and phosphorus concentrations in tropical hydroelectric reservoirs. Hydrobiologia 2012, 693, 13–28. [Google Scholar] [CrossRef]
  77. Santos, V.B.; Araujo, S.F.; Leite, L.F.; Nunes, L.A.; Melo, J.W. Soil microbial biomass and organic matter fractions during transition from conventional to organic farming systems. Geoderma 2012, 170, 227–231. [Google Scholar] [CrossRef]
  78. Pereg, L.; McMillan, M. Scoping the potential uses of beneficial microorganisms for increasing productivity in cotton cropping systems. Soil Biol. Biochem. 2015, 80, 349–358. [Google Scholar] [CrossRef]
  79. Guerriero, G.; D’Errico, G.; Di Giaimo, R.; Rabbito, D.; Olanrewaju, O.S.; Ciarcia, G. Reactive oxygen species and glutathione antioxidants in the testis of the soil biosentinel Podarcis sicula (Rafinesque 1810). Environ. Sci. Pollut. Res. Int. 2017. [Google Scholar] [CrossRef] [PubMed]
Figure 1. Location of sample points (topographic information from MTN25—Instituto Geográfico Nacional-; digital terrain model of Spain from Global Multi-Resolution Terrain Elevation Data 2010—United States Geological Survey-).
Geosciences 08 00106 g001
Figure 2. Biomass of the primary producers organisms expressed as fresh weight/dry weight (FW/DW) relation and as Chlorophyll a concentration µg Chl a/g DW.
Geosciences 08 00106 g002
Figure 3. Photomicrographs (daylight and green epifluorescence) showing the cyanobacteria and other organisms found in the three groups of samples. (AG) Group 1; (HL) Group 2 and (MP) Group 3. (A) Filamentous cyanobacteria, Phormidium (sample M8); (B) Phormidium with epifluorescence from sample M41; (C) Unicellular cyanobacteria from sample M8; (D) LPP cyanobacteria from M1; (E) Filamentous cyanobacteria type Pseudanabaena from sample M41; (F) Filamentous cyanobacteria type LPP and diatom in the sample M8; (G) Typical diatom found in sample M8; (H) Chroococal cyanobacteria with epifluorescence found in sample M15; (I) Phormidium found in sample M15; (J,K) short and long filaments of Pseudanabaena found in sample M20 using epifluorescence; (L) Cyanobacteria LPP type and diatom found in M15; (M) Leptolyngbya, cyanobacteria type LPP observed at sample M28; (N) Phormidium under epifluorescence in sample M34; (O) Frustule empty of diatom observed at sample M28 and (P) Filament of fungi found in the sample M29. Scale bar show 20 µm.
Geosciences 08 00106 g003
Table 1. List of sampling plots organize by number, name and coordinates (UTM Zone 30N).
Sample NºNameCoordenates
XY
1Gigüela04465724338602
8E. Casablanca04389104333770
15Entradilla04394614332245
20Molemocho04403044331318
28V. de los Toros04361494331316
29S. Almochinares04353634330524
34Zacatena04342064329673
41L. Navaseca04465364328067
Table 2. Physical and chemical properties of the soil samples studied in Las Tablas de Daimiel National Park. DO = dissolved oxygen (%), Eh = redox potential, OM = organic matter (%), N = total nitrogen, C/N = relation C to N, P2O5 = soluble phosphorous (mg/kg), P = total phosphorous (g/kg), EC = electrical conductivity (dS/m), CaCO3 = calcium carbonate (%).
Sample NºNameColourDOEhpHOMNC/NP2O5PECCaCO3
DryWet(%)(mV)(%)(%)(mg/kg)(g/kg)(dS/m)(%)
1Gigüela5Y 5/15 Y 2,5/190.1−171.98.011.80.23928.822.11.061.2737.9
8E. Casablanca2.5 Y 5/22.5 Y 3/174.2−73.87.523.30.44030.640.71.213.6133.8
15Entradilla2.5 Y 6/32.5 Y 4/267.8−23.58.119.30.53221.115.40.261.0572.4
20Molemocho2.5 Y 5/32.5 Y 3/3112.139.87.83.00.07523.042.60.890.487.60
28V. de los Toros5 Y 3/15 Y 2.5/215.4−169.47.921.30.60420.554.30.941.6128.0
29S. Almochinares5 Y 4/25 Y 3/249.3−168.37.937.90.26184.350.70.261.3837.4
34Zacatena5 Y 5/15 Y 2.5/236.8−163.47.710.60.24725.036.50.711.7037.9
41L. Navaseca5 Y 5/25 Y 3/2143.325.48.38.80.09056.812.15.391.3238.7
Table 3. Semiquantitative relative abundance of organisms observed in the soil samples.
Sample NºCyanobacteriaDiattomsGreen AlgaeFungi
1++++(+)-+
8+++++--
15+++--
20+++--
28++--
29+++-
34++-+
41+++++-
Note: Where: - means not observed, + very little abundant <10%, ++ less abundant, 10–30%, and +++ abundant >30.

