Three-Dimensional Growth of Flexural Slip Fault-Bend and Fault-Propagation Folds and Their Geomorphic Expression

1
Statoil ASA, Development and Production International, 2 Steers Cove, St. John’s, NL A1C 6J5, Canada
2
Institució Catalana de Recerca i Estudis Avançats (ICREA) and GGAC, Facultat de Geologia, Universitat de Barcelona, C/Martí i Franquès s/n, 08028 Barcelona, Spain
3
Department of Earth Science, Realfagbygget, Allégaten 41, 5007 Bergen, Norway
*
Author to whom correspondence should be addressed.
Geosciences 2018, 8(4), 110; https://doi.org/10.3390/geosciences8040110
Submission received: 6 February 2018
/
Revised: 13 March 2018
/
Accepted: 16 March 2018
/
Published: 24 March 2018
(This article belongs to the Special Issue Tectonics and Morphodynamics)
Abstract
:The three-dimensional growth of fault-related folds is known to be an important process during the development of compressive mountain belts. However, comparatively little is known concerning the manner in which fold growth is expressed in topographic relief and local drainage networks. Here we report results from a coupled kinematic and surface process model of fault-related folding. We consider flexural slip fault-bend and fault-propagation folds that grow in both the transport and strike directions, linked to a surface process model that includes bedrock channel development and hillslope diffusion. We investigate various modes of fold growth under identical surface process conditions and critically analyse their geomorphic expression. Fold growth results in the development of steep forelimbs and gentler, wider backlimbs resulting in asymmetric drainage basin development (smaller basins on forelimbs, larger basins on backlimbs). However, topographies developed above fault-propagation folds are more symmetric than those developed above fault-bend folds as a result of their different forelimb kinematics. In addition, the surface expression of fault-bend and fault-propagation folds depends both on the slip distribution along the fault and on the style of fold growth. When along-strike plunge is a result of slip events with gently decreasing slip towards the fault tips (with or without lateral propagation), large plunge-panel drainage networks are developed at the expense of backpanel (transport-opposing) and forepanel (transport-facing) drainage basins. In contrast, if the fold grows as a result of slip events with similar displacements along strike, plunge-panel drainage networks are poorly developed (or are transient features of early fold growth) and restricted to lateral fold terminations, particularly when the number of propagation events is small. The absence of large-scale plunge-panel drainage networks in natural examples suggests that the latter mode of fold growth may be more common. The advective component of deformation (implicit in kink-band migration models of fault-bend and fault-propagation folding) exerts a strong control on drainage basin development. In particular, as drainage lengthens with fold growth, more linear, parallel drainage networks are developed as compared to the dendritic patterns developed above simple uplifting structures. Over the 1 Ma of their development the folds modelled here only attain partial topographic equilibrium, as new material is continually being advected through active axial surfaces on both fold limbs and faults are propagating in both the transport and strike directions. We also find that the position of drainage divides at the Earth’s surface has a complex relationship to the underlying fold axial surface locations.
1. Introduction
Fault-related folds, and the blind faults they are associated with, are being increasingly recognised as extremely important both from a scientific and a socio-economic viewpoint [1,2,3,4,5,6]. Much research has been directed toward understanding the manner in which they grow over geological timescales to produce the topographic features observed today [7,8,9,10,11]. The kinematic development (in the transport direction) of individual structures is much debated, with growth strata associated with ancient examples being cited as evidence for kink-band migration (flexural slip) and/or limb rotation [4,12,13,14,15,16].
However, it is now appreciated that as they accumulate displacement, thrust faults propagate laterally and lengthen, perhaps linking up with other structures [9,11,17,18,19]. The manner in which thrust faults propagate and link is now being recognised as crucial to the structural and geomorphic development of fault-related folds [20,21]. It has been argued that such folds grow as a result of thrust faulting events with similar displacements along strike that are terminated abruptly at tear faults, displacement building up over many earthquake cycles until the fault propagates laterally to form a new tear fault [9]. Alternatively, the along-strike plunge of fault-related folds may be the result of slip events with gently decreasing displacement along strike with or without lateral propagation [9].
Tectonically active areas commonly show dramatic changes in relief, differential tectonic uplift, variations in river incision and channel gradient produced by ongoing deformation both at a regional and local scale [4,22]. Of specific interest here, the geomorphic expression of active fault-related fold structures provides a potential opportunity to decipher both fold kinematics and mechanisms of lateral growth, although data from natural examples is not abundant [4,6,15,19,23,24]. Recently, the geometry of drainage basins and river networks (including stream profile analysis) has been used to interpret the spatial and temporal evolution of fault-related structures in both extensional [25,26,27] and contractional settings [10,18,23,28,29,30,31,32] due to the strong control that fault- or fold-related uplift has on drainage basin development, stream initiation and diversion.
We report here results from a coupled kinematic and surface process model of fault-related folding in an effort to better define the geomorphic expression of two different conceptual models of flexural-slip fault-related fold growth. We consider flexural-slip fault-bend and fault-propagation folds that grow in both the transport and strike directions. We do not assert that all active fault-related folds grow by flexural slip/kink-band migration but rather choose to examine two models of fold growth that are frequently used to construct both local and regional sections, to analyse and derive uplift/slip data from active structures and to model growing folds [33,34,35,36,37]. Our structural models are linked to a landscape evolution model that includes bedrock channel development and hillslope diffusion, but, in order to isolate the fluvial response to fault-related fold kinematics, does not include landsliding or debris flows (cf. [38]). Similarly, we consider that the underlying lithologies being deformed and eroded are uniform, rather than deal with the effects of progressive unroofing of a stratigraphic sequence.
Our modelling is driven by the desire to answer the following questions derived from observations of natural structures: (a) Given the along-strike displacement and topographic gradient seen in many natural folds (Figure 1), why are plunge-panel (transport-perpendicular) drainage networks rarely seen in natural fault-related folds? (b) Is the displacement field the main control on drainage-basin form and topography across a fault-related fold?
We investigate suggested modes of fold growth under identical surface process conditions, and critically analyse their structural and geomorphic expression in order to attempt to address these questions.
2. Characteristics of Isolated Thrust Faults
2.1. Displacement-Length Relationships
It is now generally accepted that, as a fault accumulates a greater total displacement, it lengthens. Compilation of data from a variety of settings and different types of faults [39,40,41,42], suggests that there are predictable scaling relationships between the length of a fault (L) and the maximum displacement along it (D), but that these relationships vary between different settings and, perhaps, different types of faults. However, the compiled data suggest that D/L relationships have the general form:
where ε is related to the mechanical properties of the material. Some authors propose that the relationship is linear (n = 1; [40,43,44]) whilst others suggest a power scaling law (n = 2; [45]; n = 1.5; [46,47]). As regards to D/L, Scholz [39] proposed values of D/L = 0.01–0.10 for both normal and thrust faults, while Elliot [48] reported values of D/L = 0.07–0.12 in the Alberta Foothills and Front Ranges. Fermor [49] confirmed these values and suggested that they could be as high as 0.26, while Wilkerson [50] proposed values up to D/L = 0.42 in North American fold-thrust belts.
However, a simple universal law between fault length and maximum fault displacement has been challenged and individual structures often show much more complex relationships [51,52]. These authors propose that individual fault segments increase their lengths and maximum displacements by different proportions during their evolution, sometimes alternating between linear and power scaling relationships. In addition, Walsh et al. [53] and Morewood and Roberts [27] have addressed the evolution of D/L during the growth of a structure, suggesting that, due to the presence of neighbouring, interacting faults, Lmax is rapidly attained and is then near constant during much of fold growth until the final D/L is attained.
2.2. Lateral Displacement and Slip Distributions
The displacement profiles observed in natural structures arise from the combination of coseismic, postseismic and interseismic processes. The displacement profiles (in the strike direction) observed in natural contractional structures display bell-shaped [18,49,54], linear step-like [9], and box-shaped geometries [18]. The point of maximum displacement normally being near the center of the fault plane [39].
Various theoretical slip distributions on isolated faults have been proposed: Pollard and Segall [55] proposed a circular profile centered on the point of maximum displacement with displacement gradients becoming infinite at the tips of the fault. Cowie and Scholz [56] proposed that displacement gradually tapers to the fault tips. Willemse [57] proposed that an almost linear-taper slip distribution is plausible in some natural structures.
Slip distributions that occur during earthquake ruptures observed in natural contractional settings are similar to those obtained from theoretical models. The slip observed during the Northridge earthquake of 1994 displays an asymmetrical bell-shaped deformation with an abrupt termination of the deformation (high displacement gradient) near the ends of the fault [58]. The vertical component of the slip distribution of the 1999 Chi-Chi earthquake (MW 7.6) obtained from teleseismic data displays two different geometries along its 100-km long surface rupture zone. The south-western portion of the fault is characterised by a fairly constant value (block-shaped geometry), whilst the north-eastern portion is characterise by a bell-shaped geometry [59]. This slip distribution compares very well with the surface break observed along the rupture zone [60]. More recent studies have determined fault slip distribution using the observed GPS coseismic displacements as well as interferometric synthetic aperture radar (InSAR) data—e.g., the 1999 Mw 7.6 Chi-Chi Taiwan earthquake [61], the 2008 Mw 7.9 Wenchuan, China earthquake [62] and the 2016 Kumamoto earthquake [63]; and Lidar data e.g., the 1999 Mw 7.1 Hector Mine Earthquake, California [64]. All these studies have shown the variety and complexity of slip distribution during major earthquakes, ranging from estimated slip being highest in the epicentral region and tapers away [64], to much more complex distributions where fault rupture style changes along strike, fault slip peaks near the surface and peak slips are located around fault geometric complexities [62].
2.3. Rates of Displacement and Lateral Propagation
Rates of displacement and lateral propagation reported from natural compressional structures are typically an order of magnitude higher than associated slip or uplift rates [21]. For example, using in situ cosmogenic 10Be measurements in quartzites, Jackson et al. [28] obtained average uplift and propagation rates of 0.10–0.15 m/ka and 1.0–2.0 m/ka, respectively, over the last 450 ka for a Late Quaternary anticline forming above a blind reverse fault in Central Otago, New Zealand, whereas Chen et al. [24,65] reported shortening rates of 2.0–4.4 m/ka and lateral propagation rates of c. 15–40 m/ka from the Chinese Tien Shan.
3. Morphology of Fault-Related Folds
3.1. Three-Dimensional Geometry
Fault-related folds typically occur in many parts of foreland fold and thrust belts where they can be important geomorphological and seismological features. In general, at the Earth’s surface, active fault-related folds are elongate structures whose aspect ratio (width parallel to transport direction compared to length perpendicular to transport direction) is 1:5–10. The Pakuashan anticline in Taiwan (Figure 1a) is a good example. However, observed fold widths and lengths are typically smaller than the actual widths and lengths, as folds are often partially buried by alluvial/fluvial sediments (e.g., Wheeler ridge [9,23]; Figure 1d). They often present local relief of several hundred meters (although this can be up to several kilometers) which typically dies off towards the lateral terminations of the folds (see e.g., [18,66]). However, there is a surprising lack of studies detailing their geomorphology or structural geology in three dimensions [4,5,8,67]. In the subsurface, such structures are exploration targets and the technique of axial surface mapping has proven to be a powerful technique in understanding their three-dimensional geometry [68,69,70]. The geometry of the axial surfaces has a direct relationship with the slip along the associated fault [7,68] and can be considered as the equivalent for fault-related fold structures (where often the fault per se is not observed) of the displacement profiles discussed in Section 2. The Tunic anticline (interpreted to be a fault-bend fold) presented by Shaw et al. [68] is shown in Figure 1b. It displays straight inactive axial surfaces converging with the active axial surfaces in both the back and front limbs (Figure 1b). This geometry has been interpreted as a linear taper displacement distribution from a maximum at the center of the structure to a minimum at the boundaries.
3.2. River Networks Developed above Fault-Related Fold Structures
There are several general similarities in the orientation and geometry of river networks developed above contractional fault-related fold structures. Typically, active fault-related folds both divert local/regional drainage networks and develop their own consequent drainage networks above the growing structures [23,35,71]. In this contribution it is the consequent drainage networks that we are concerned with. As an example, the Pakuashan anticline, Taiwan (Figure 1a) has developed linear streams running parallel to the transport direction in both back and front limbs in the center and southeastern portions of the structure [67]. To the northwest, the structure shows a more radial drainage network pattern. All the structures of the fault and fold system in central Otago, New Zealand (Jackson et al. [8]; Figure 1c) show a very similar geometry to that observed in Taiwan. In addition, the anticlines in New Zealand have formed small drainage basins at the boundaries of the structures with rivers oriented almost parallel to the strike of the anticlines. Linear rivers that flow parallel to the transport direction, where bifurcation of the streams increases towards the drainage divide (crest), and small sub-basins that form at the boundaries of the structures with rivers running almost parallel to the strike direction are also observed in other contractional structures such as the Wheeler Ridge anticline ([23,72]; Figure 1d), Santa Monica mountains [73], and Oak Ridge anticline [74] in California; East Bourland mountain, Marathon fold and thrust belt [75], and anticlines in the La Rioja basin, Argentina [76] and Nepalese Himalaya [35].
4. Three Dimensional Modelling of Fault-Related Folding and Surface Processes
4.1. Model Rationale
Our modelling is driven by the desire to answer the following questions derived from observations of natural fault-related folds: (a) Given the along-strike displacement and topographic gradient seen in many natural folds (Figure 1), why are plunge panel drainage networks rarely seen in natural structures? (b) Is the displacement field the main control on drainage-basin form and topographic symmetry across a fault-related fold?
4.2. Model Overview
In this contribution we report on experiments that use a coupled structural and surface process numerical model of flexural-slip fault-related fold growth.
Here we restrict our structural analysis to flexural-slip models of fault-bend [77]) and fault-propagation [78] fold growth. We are aware that several other approaches to modelling fault-related folding have been proposed and documented–such as elastic-dislocation models [79], elastic-plastic finite element models [80,81], and kinematic models such as trishear [82,83], the fault-propagation fold model of Chester and Chester [84] or detachment folding [85]. However, we choose these kink-band models to drive the tectonic component of our coupled model as: (1) they are widely used to construct both regional and local balanced sections in regions of active compressive deformation [86], (2) they are commonly used as the tectonic model when calibrating slip and/or erosion rates from geomorphic indicators on active folds [33,34,36], (3) they have been widely and successfully used to simulate the evolution of structures growing by kink-band migration in the upper crust [14,20,86], (4) they have well-specified velocity (deformation) fields allowing the advective component of deformation to be easily isolated and its effects clearly understood [37,86] as compared to unspecified velocity distributions in elastic dislocation models. At the scale of the fault-related folds that we are considering here (approx 5 km × 20 km) we consider that isostasy and mass redistribution are second order effects whose influence is much more regional than a single fault-related fold and can be expressed via regional subsidence/baselevel changes (cf. [20,86]).
We combine these kinematic models of fault-related folding with surface process models of bedrock channel development and hillslope diffusion (Figure 2). We have taken this approach because in many tectonically active regions topographic evolution can be argued to be dominated by the rates and patterns of bedrock-channel incision [29,87]. Bedrock channel networks transmit the tectonic signal in actively uplifting regions and bedrock incision appears to be the rate limiting process in many landscapes, influencing gradients on adjacent hillslopes and being closely coupled with landsliding [38,88]. Analysis of bedrock channel incision has the potential to be a powerful tool in the analysis of actively deforming regions [32,89]. We have chosen not to include processes such as landsliding and debris flows in our model in an effort to clearly isolate the effects on bedrock channel network development of fold growth. Clearly, the inclusion of landsliding and debris flows in our model would affect the development of our model, and thus our predicted morphologies can only be thought of as first-order and most applicable to settings in which bedrock channel incision is the dominant process. The development of bedrock channels is modelled using a stream-power approach and hillslope evolution is modelled using a linear diffusion equation.
4.3. Structural Modelling and Parameters
As discussed above, we have chosen simple flexural-slip/kink-band kinematics as the tectonic forcing responsible for uplift, and implemented it in three dimensions (see Bernal and Hardy [90]), tectonic transport being parallel to the x direction. The velocity description of deformation (derived from the original geometric models) of both the fault-bend and fault-propagation fold models used here is given in detail in Hardy and Poblet [86]. It is important to note that we include explicitly not only the vertical component (v) of displacement above the thrust ramp (and in the fold) but also the horizontal component (u), leading to advection of topography (h) and thus also the developing stream networks and drainage basins, thus the rate of change of height in an Eulerian coordinate system is given by:
In both the fault-bend (FBF) and fault-propagation (FPF) models the thrust ramp angle is set at 29° and has a length of 4.0 km, with the ground surface initially set to be 1.6 km above the level of the upper decollement. The maximum slip rate on the faults in both models is set at 2.0 m/ka, consistent with values reported in the literature (see Section 2), allowing both fault-related folds to grow laterally at the same rate and achieve the same D/L ratio over the same timescale. As such, the rate of creation of structural relief for fault-propagation fold models is twice that of fault-bend fold models (see Hardy and Poblet [86]). However, as fault-propagation folds are often considered to be precursors to fault-bend folds, a comparison of model results for the same shortening rate is appropriate. The maximum displacement (D) on the faults after a run time of 1.0 Ma is 2.0 km, creating 4–6 km wide structure (depending on the fault-related fold model).
We consider a fault (flat-ramp system) that propagates laterally (see Figure 3). After each episode of lengthening, the fault accumulates displacement until the center of the fault attains a maximum displacement (Dmax) associated with a specific Dmax/L value, the fault then lengthens again and starts to accumulate further displacement (Figure 3). This process continues until the fault reaches a maximum length of 20 km, a value typical of isolated contractional structures [9,18,68,70,91,92]. Lengthening either occurs instantaneously, where the structure attains its maximum length before the onset of displacement accumulation, or in 40 steps of 500 m, where the structure grows quasi-continuously both in the strike and transport direction. The value for each episode of lateral propagation is representative of the range of values cited for natural contractional structures [8,9,92]. For the sake of completeness, in this contribution we are going to consider both the linear (n = 1) and the power law (n = 2) relationships between maximum fault displacement and fault length. Structures with a linear relation between fault length and fault maximum displacement growth self-similarly whilst those with a quadratic relation (the D/L value increases through time) do not. The constants of proportionality for the linear and power laws are 0.1 (D/L = 0.1) and 5 × 10⁻³ (D/L2 = 0.005), respectively, similar to the values reported from natural examples ([93]).
Two slip distributions will be considered: the linear-taper slip distribution has a linear decrease of slip from the center of the structure to the boundaries whilst the block-taper slip distribution has a constant slip along the fault with an abrupt termination (infinite displacement gradient) at the boundaries (Figure 4). Both the linear-and block-taper slip distributions represent the end members of the slip distributions observed in nature and theoretical models (see Section 2.2 above).
4.4. Surface Process Modelling and Parameters
In this contribution we consider that the elevation drop in growing anticlines is controlled mainly by bedrock-channel incision with minor hillslope diffusion, consistent with studies of topographic evolution in tectonically active regions where it appears that the elevation drop on bedrock-channels comprises 80–90% of drainage basin relief [29,89,94,95,96]. The model of detachment-limited, bedrock channel evolution used here is only one of many (see [97]). We have chosen to use a stream power incision law due to its simplicity, ability to capture the behaviour of many river networks, and in order that direct comparison can be made with the recent voluminous literature on its application to natural landscapes [32,94,95,98]. The stream power model is based on the notion that the rate bedrock channel incision is a power law function of unit stream power (or shear stress) given by:
where h is the height of the Earth’s surface (m), t is time (yr), K is an erosion coefficient (m1−2m yr−1), A is upstream drainage area (m2), S is local channel gradient, and m and n are exponents related to basin hydrology, erosion process and channel geometry [89]. The ratio of m/n is theoretically predicted to lie in a narrow range around 0.5 [89]. This, and related approaches, have been used by many authors to model bedrock channel development [94,98,99,100]. The model is strictly only applicable to small, mountainous catchments such as those that are commonly found in tectonically active regions and where bedrock channels can be expected to be the dominant channel type. The model is not appropriate for transport-limited fluvial systems that are an important component of many larger catchments. We consider that the underlying lithologies being deformed and eroded are uniform, rather than deal with the effects of progressive unroofing of a stratigraphic sequence, as such there are no temporal variations in K, m, or n.
In order to model hillslope processes, a simple three-dimensional linear diffusion equation is used, where the sediment flux is assumed to be proportional to local slope and directed down slope [99,101,102,103]. It has also been suggested that non-linear diffusion models are perhaps more appropriate for modelling hillslope evolution particularly when landsliding becomes an important process [104]. However, given that we are not including landsliding in our modelling scheme and are focussing on landscapes dominated by fluvial erosion we use a standard linear version. The rate of change of height in three dimensions due to diffusive processes is given by:
where h = height of the surface; t is time (yr), x and y are horizontal co-ordinates, and αx = αy is the diffusion coefficient (m2 a−1). This approach has previously been applied in two [86] and three-dimensions [90], to model the effects of erosion, transport and deposition associated with fault-related folds. Published estimates of the diffusion coefficient vary enormously, from 9 × 10⁻⁴ m2 a−1 for arid fault scarps [105] to 5.6 × 10⁵ m2 a−1 for a prograding delta [101].
For our surface process modelling parameters, the exponents m and n in Equation (3) are set to 0.46 and 1.0 respectively, and K is set at 4.0 × 10⁻⁵ m0.08 yr−1. The values of m and n used are chosen in order that direct comparisons can be made with recent calibrations of the stream power incision law reported from tectonically active regions [34,94,95], while the value of K is chosen to lie within the range of reported or suggested values (see [34,99]). We use a diffusion coefficient (α) of 5 × 10⁻³ m2/yr, a value chosen to lie in the range of derived values associated with degrading active fault-related folds in semi-arid/arid environments [106,107], to allow comparison with previous studies and also to produce geomorphic features that are not overly smoothed by diffusive processes.
4.5. Modelling Scheme
The evolution of the model surface at a particular location in the model is thus governed by three separate and competing processes (Equations (2)–(4)) which can be combined in the following partial differential equation in an Eulerian coordinate system:
where h is the height of the Earth’s surface (m), t is time (yr), u and v are horizontal and vertical velocities respectively (m/yr) of the fault-related fold models (see [86]), x and y are horizontal co-ordinates, α is the diffusion coefficient (m2/yr), K is a dimensional erosion coefficient (m1−2m yr−1), A is upstream drainage area (m2), S is local channel gradient, and m and n are exponents related to basin hydrology, erosion process and channel geometry [89].
We use an explicit finite difference solution scheme to solve this equation, with a spatial sampling interval in both x and y directions of 25 m and a time-step of 500 years. This time-step is consistent with proposed recurrence intervals (100–500 years) of moderate to large earthquakes [108,109,110]. An initial perturbation is imposed on the system by adding a differential elevation (up to 1 m) randomly to the top surface of all models. We illustrate model results as both surfaces and cross-sections; when illustrating model results as surfaces we use greyscale, shaded-relief images to emphasise their geomorphic expression.
5. Evolution of River Networks above a Simple Uplifting Structure
We first consider the evolution of river networks above a simple (but perhaps, one might say, unrealistic) structure that grows vertically without a horizontal component of displacement (advection) but whose dimensions are equivalent to the fault-bend and fault-propagation folds discussed subsequently in this paper. The “fold” attains its maximum length before the onset of vertical displacement (instantaneous lateral propagation) and experiences a constant uplift rate equal to the vertical component of deformation (0.97 m/ka) above a 29 degree ramp with a slip rate of 2.0 m/ka. This allows us to investigate the temporal and spatial evolution of stream networks in a simple tectonic scenario without advection and then compare it with fault-bend and fault-propagation fold models in which advection plays an important role in geomorphic evolution. In this manner, we use it as a baseline model to isolate the key geomorphic features expressed in models that are a result specifically of fault-related fold growth.
The spatial and temporal evolution of the upper surface of this simple uplifting model is shown in Figure 5. It can be seen that, as a result of the continual block uplift, stream networks initiate at the boundaries and propagate towards the central part of the structure, developing a classical dendritic drainage pattern (see Figure 5a–f). A main drainage divide develops in the center of the structure separating two large drainage systems to the left (West) and the right (East), with streams incised perpendicular to the divide. The topography and stream networks that develop are approximately symmetric with respect to the main drainage divide. Note that the drainage divide and drainage basins do not change their position or geometry dramatically after they are formed (see Figure 5d–f). Stream profiles on both sides of the drainage divide have an exponential geometry typical of bedrock-channels (Figure 5g). To the upper (North) and lower (South) boundaries of the structure, smaller sub-basins are observed with drainage divides forming an internal angle of approximately 20° with the main drainage divide in the center of the structure, this angle is a geometric effect of the aspect ratio of the uplifting block. In these sub-basins, stream channels are incised parallel to the main drainage divide and also have an exponential geometry similar to that described above (Figure 5g). These simple tectonic uplift results are very similar to those described from analogue experiments under conditions of simple tectonic uplift by Lague et al. [111].
6. River Networks above Growing Fault-Bend and Fault-Propagation Folds
We now model a series of fault-bend and fault-propagation folds using the different slip distributions, scaling relationships and modes of lateral propagation discussed in Section 4. This approach allows us to create a matrix of the geomorphologic and structural expression of the different fault-bend and fault-propagation fold structures. Figure 6 and Figure 7 summarise the morphology of the fault-bend and fault-propagation folds, respectively, at the end of the total model run time (1.0 Ma), with and without surface processes. In Figure 8 we show cross sections across a subset of final models in Figure 6 and Figure 7 which illustrate the relationship between structural position, axial surfaces and drainage divides. We will firstly examine the final geometries of the river networks; we then examine the spatial and temporal evolution of a subset of the models, in order that some of the key features that develop can be explained in more detail, before more generally discussing and contrasting the final geometries of the different models.
6.1. Final Geometries of River Networks
Key differences in the final geometries of the river networks developed above the fault-bend and fault-propagation fold models under the different experimental conditions are compared in Figure 6 and Figure 7.
As compared to the simple uplifting model where the main drainage divide was located parallel to the strike of, and was approximately symmetric with respect to, the structure (Figure 5), the main drainage divide is now displaced to the East (the transport direction) in all the fold models and has a more complex form (Figure 6 and Figure 7). This is a primary effect of the kinematics of fault-bend and fault-propagation fold growth in which backlimb and forelimb lengthening are achieved at the expense of flat, crestal regions. The growth of steep, narrow forelimbs and gentler, wider backlimbs results in asymmetric drainage basin development (small basins on “forelimb”, larger on “backlimb”). Drainage networks in these basins are dominantly parallel as a result of continuous limb lengthening due to kink-band migration, as compared to the characteristic dendritic patterns developed above the simple uplifting structure (cf. Figure 5). A particular feature of all the fold backpanels is that the lowest parts of the drainage networks are the youngest and least evolved. This arises because kink-band migration results in the addition of new material into the fold limb at the basin outlet. This leads to a distinctive geomorphic feature: smooth facets, sometimes almost triangular, are observed at the lowest parts of backlimb drainage basins (highlighted in Figure 6 and Figure 7). This is in stark contrast to the simple uplifting structure in which networks grow in a normal manner and where the tips of the drainage networks are the youngest parts of the drainage basin.
When the fault-bend or fault-propagation folds undergo instantaneous lateral propagation and grow with a constant slip distribution the main drainage divide that is developed separates drainage basins with linear, parallel bedrock-channels running perpendicular to the drainage divide (Figure 6d and Figure 7d). The sub-basins on the western side (backpanel) have a bigger catchment area than those in the eastern side (forepanel) in both models. Minor drainage basins develop at the lateral terminations of the folds with networks running parallel to the strike of the structure. However, if the structures grow with a linear-taper slip distribution the drainage networks that develop are remarkably different (Figure 6a and Figure 7a)—important river networks develop in the lateral plunge panels of both fold models and occupy a significant proportion of the fold surface area. The streams in these lateral sub-basins have a linear to curvilinear form and run from curvilinear drainage divides. Note that for both the linear-taper and constant slip distributions, the sub-basins in the forepanel of the fault-bend fold model are small whilst the sub-basins in the fault-propagation fold model are much more fully developed.
Folds that propagate laterally whilst accumulating slip develop somewhat different final morphologies. For the same slip distribution (either linear-taper or constant slip), the river networks on the lateral plunge panels in both the fault-bend and fault-propagation fold models are more fully developed if the structure propagates with many episodes of lengthening (Figure 6b,c,e,f and Figure 7b,c,e,f) than the instantaneous case. In addition, the linear-taper slip distribution promotes greater development of these basins, while the constant slip distribution restricts their development to more lateral parts of the folds. It is noticeable that the scaling law used (either quadratic or linear) does not have a great effect upon the final fold geomorphology.
6.2. Final Geometries of Axial Surfaces and Relationship to Drainage Divides
When the fault-bend or fault-propagation folds undergo instantaneous lateral propagation, the geometry of the axial surfaces directly reflects the corresponding slip distributions, particularly on the backlimbs of the structures (Figure 6a,d and Figure 7a,d). Inactive axial surfaces converge linearly toward the active axial surfaces for the linear-taper slip distribution whilst both active and inactive axial surfaces are parallel for the constant slip distribution.
However, when structures propagate laterally the geometries of the axial surfaces are markedly different and, while they clearly must depend on the underlying slip distribution, they do so in a more complex manner. For structures growing with the linear-taper slip distribution, all the inactive axial surfaces display a concave geometry to the transport direction regardless of the scaling law used (Figure 6b,c and Figure 7b,c). In contrast, fault-bend and fault-propagation fold models growing with the constant slip distribution display lateral (tear) faults symmetrically distributed along the strike of the structures, which delimit narrow flat areas (mesas) (Figure 6e,f and Figure 7e,f), and display inactive axial surfaces which are linear or convex in the transport direction depending on the scaling law considered (Figure 6e,f and Figure 7e,f).
The drainage divides on the backpanels of the fault-propagation fold models coincide closely with the position of an active axial surface (see Figure 6, Figure 7 and Figure 8), along which a change in the magnitude of uplift occurs [78,86]. This precise correlation breaks down slightly in the central parts of the models, although across the whole of the fold the form of this drainage divide still clearly reflects the displacement distribution along the underlying fault. In the fault-bend fold models the drainage divide on the backpanel does not coincide with the position of the backlimb inactive axial surface, however the form of the drainage divide strongly reflects the displacement distribution along the underlying fault.
In the forepanels of the fault-bend and fault-propagation fold models the orientation and location of the active axial surfaces can be inferred from the trace of the topographic breaks (scarps) at the front of the fold structures. These abrupt topographic breaks at the front (East) of the fold structures represent the intersection of the forelimb active axial surfaces with the ground surface, and separate a region of uplift from a region of translation in the case of the fault-bend fold and mark the end of the region of uplift in the case of the fault-propagation fold (see Figure 8). The drainage divide lies to the West of this scarp and therefore does not separate forelimb from backlimb drainage basins (sensu stricto) but represents the boundary between opposing drainage basins developed above the uplifting region (Figure 8a,c).
6.3. Temporal Evolution
6.3.1. Instantaneous Lateral Propagation-Constant Slip Distribution
The evolution of the fault-bend and fault-propagation fold models that undergo instantaneous lateral propagation and then grow with a constant slip distribution is shown in Figure 9. The growth of the folds results in the development of several distinct drainage domains with stream networks that propagate inwards from the edges of the structures (Figure 9a–d). It can be seen that the dominant drainage divides that develop are perpendicular to the transport direction and only a small proportion of the drainage is directed towards the fold noses. At no stage during fold growth are major transport-perpendicular drainage networks developed (see Figure 9a–d), and the growth of drainage networks on the steep backpanels (transport-opposing) and forepanels (transport-facing) of the structure rapidly erodes any flat, fold-crest regions. The final folds display forepanel drainage basins that are small, whereas backpanel drainage basins are larger and more elongate. In both cases, once formed (~500 ka), the geometry of the drainage divide does not change dramatically through time but it is translated in the transport direction.
The growth of the folds by kink-band migration results in lengthening of the backlimbs, a decrease in the width of the crests and forelimb lengthening (as we are neither modelling the crestal-widening stage of fault-bend fold evolution or the propagation of the fault to surface in fault-propagation folds). In both the fault-bend and fault-propagation folds this leads to backpanel drainage basins that grow through time (see drainage basins A indicated on Figure 9). However, the growth of the forepanel drainage basins is quite different: in the fault-bend fold forepanel drainage basins decrease in size with time as they are advected and eroded (see drainage basin B in Figure 9). In contrast, in the fault-propagation fold the forepanel drainage basins remain approximately the same size during the growth of the structure. Drainage networks in these basins are dominantly parallel as a result of continuous limb lengthening due to kink-band migration. A particular feature of both fold backpanels is that the lowest parts of the drainage networks are the youngest and least evolved, often presenting “flatirons”. This arises because kink-band migration results in the addition of new material into the fold limb at the basin outlet (cf. [37,86]).
We have used the terms backpanel and forepanel instead of backlimb and forelimb here because the relationship between drainage divides and structural position in the models is complex. For example, for the set of parameters used here, drainage basins that are truly on the forelimb of the fault-bend fold structures have little geomorphic expression as the forelimb has no component of uplift (only translation/advection of material at the top of the forelimb), and thus erosion removes their topographic expression almost immediately. However, forelimb drainage basins are present in the fault-propagation fold as the forelimb undergoes a component of uplift and thus is topographically much more evident. However, these drainage basins are not solely developed on the forelimb - they include crestal parts of the structure. Similarly, “backlimb” drainage basins are often composed of both backlimb and crestal regions of the structure. This point is emphasised in Figure 8 where a series of transport-parallel and perpendicular cross-sections (structure and topographic profiles) derived from the models is shown illustrating the relationships between drainage divides and structural position (for location and orientation of sections see Figure 6 and Figure 7).
6.3.2. Instantaneous Lateral Propagation-Linear-Taper Slip Distribution
The evolution of the fault-bend and fault-propagation folds that undergo instantaneous lateral propagation and then grow with a linear-taper slip distribution is shown in Figure 10. These models produce remarkably different drainage networks and fold topographies to the equivalent constant slip cases (cf. Figure 9). A key difference is that, at all stages of fold growth, transport-perpendicular drainage networks are an important component of the evolving topography and drain a significant proportion of the fold surface area (Figure 10a–d). The occurrence of transport-perpendicular drainage networks is a natural consequence of the lateral variation in slip/uplift from fault center to fault tips, which creates a large strike-parallel topographic gradient along which stream networks can easily develop. These drainage networks develop early in the growth history of the folds (Figure 10a) as they have access to a large contributing area on the fold plunge panels. However, forepanel and backpanel drainage networks are still important components of the folds’ surficial expression. As before, it can be seen that drainage networks in the backpanel are long and elongate compared to the small forepanel drainage basins. The backpanel and forepanel drainage basins partly grow by capturing contributing area from the transport-perpendicular drainage networks (Figure 10a–d) resulting in a progressive decrease in the surficial area of the transport-perpendicular networks through time.
6.3.3. Progressive Lateral Propagation-Constant Slip Distribution
We show now the evolution of fault-bend and fault-propagation folds that undergo 40 episodes of lateral propagation leading to the progressive lengthening of the structures through the 1 Ma runtime (Figure 11). We examine the evolution of the power law scaling relationship models–the results of the linear scaling relationship models are very similar. After each episode of lengthening (250 m at each side of the anticline), the structure accumulates displacement until it reaches, in the center of the structure, a maximum value specified by the particular scaling relationship. In can be seen that, despite having a constant slip distribution, plunge panels develop in these models and become important elements in the surficial expression of these folds (Figure 11a–d). The reason that these plunge panels develop is quite simple: after each episode of lateral propagation, flat mesas develop at the fold terminations but are subsequently eroded by bedrock channel networks (see Figure 11a,b). As the mesas are narrow compared to the width of the structure, it is comparatively easy for lateral drainage networks to develop and link across them. With many episodes of lateral propagation, the plunge of the structure is developed across each of these narrow mesas (see Figure 11a–d). Once more, the backpanel and forepanel drainage basins are an important component of the folds, with forepanel drainage basins being best developed in the fault-propagation fold where the forelimb undergoes active uplift. In both cases it can be seen that the growth of forepanel and backpanel drainage networks is at the expense of the lateral drainage networks, and as a result lateral drainage networks are transient features that are progressively restricted to the fold terminations (Figure 11a–d).
7. Discussion
This paper has investigated, through numerical modelling, the geomorphic and structural expression of some key aspects of the three-dimensional growth of flexural-slip fault-bend and fault-propagation folds. We will now discuss the main results of the modelling, our assumptions/model limitations and improvements that could be undertaken in the modelling approach.
7.1. Geomorphology of Flexural-Slip Fault-Related Folds
Why are plunge-panel (transport-perpendicular) drainage networks rarely seen in natural fault-related folds? We suggest two alternative explanations: that plunge panel drainage networks are not developed naturally due to a lack of a sufficient topographic (structural) gradient in the strike direction, or that, if developed, they are subsequently consumed during fold growth by rapid forelimb and backlimb drainage basin growth. Our modelling has shown that when along-strike fold plunge is developed by slip events with linearly decreasing slip towards the fault tips (with or without lateral propagation), large “plunge-panel” drainage networks are developed at the expense of forepanel and backpanel drainage basins (see e.g., Figure 6a and Figure 7a). These plunge-panel drainage basins drain a significant proportion of the fold surface area in both fault-bend and fault-propagation folds. In contrast, we find that if folds grow as a result of slip events with similar displacements along strike that are terminated abruptly at tear faults, plunge panel drainage networks are less well developed and restricted to fold noses, particularly when the number of propagation events is small (see e.g., Figure 6d and Figure 7d). In addition, the growth of the fault-related folds by kink-band migration results in limb-lengthening at the expense of crestal regions, and the modelling suggests that, even if developed, plunge-panel drainage networks are transient features that are important during the early growth of structures but whose prominence decreases with continued fold growth (see e.g., Figure 11). The geomorphology developed above these folds is much more akin to that observed in natural examples (cf. Figure 1a,c), with forepanel and backpanel drainage networks dominating the structures. The lack of large-scale plunge-panel drainage networks, or their restriction to fold noses, in natural examples with a significant variation in displacement/topography from centre to tips, suggests that this latter mode of fold growth may provide an explanation for their absence.
Is the displacement field the main control on drainage-basin form and topographic symmetry across a fault-related fold? We find that, for our flexural-slip fault-bend and fault-propagation folds, the displacement field is a major control on drainage basin form and topographic development. In particular, the advective component of deformation and the manner in which it changes from the backlimb, through the crest, to the forelimb of the folds is extremely important (see Figure 12). The displacement field causes the growth of steep, narrow forelimbs and gentler, wider backlimbs resulting in asymmetric drainage basin development (small basins on “forelimbs”, larger on “backlimbs”). Drainage networks in these basins are dominantly parallel as a result of continuous limb lengthening due to kink-band migration, as compared to the dendritic patterns developed above the simple uplifting structure (cf. Figure 5). A particular feature of all the fold backpanels (and forepanels in fault-propagation folds) is that the lowest parts of the drainage networks are the youngest and least evolved. This arises because kink-band migration (limb-lengthening) results in the addition of new material into the fold limb at the basin outlet. This is in stark contrast to the simple uplifting structure in which networks grow in a “normal” manner where the tips of the drainage networks are the youngest parts of the drainage basin.
Furthermore, the influence of the displacement field is demonstrated by the observation that topographies developed above (single-step) fault-propagation folds are more symmetric than those developed above equivalent fault-bend folds as a result of their different forelimb kinematics (Figure 12). The forelimb of a fault-propagation fold, which undergoes active uplift and translation, and is topographically much more evident than that of the fault-bend fold which undergoes passive translation. Thus, it has little geomorphic expression as erosion removes its topographic expression almost immediately, resulting in a more symmetric topographic profile across the fold (Figure 12).
Analysis of model results indicate that, over the 1 Ma of their development, the modelled folds only partially attain topographic equilibrium (steady state), as new material is continually being advected through active axial surfaces on both fold limbs and faults propagate in both the transport and strike directions (Figure 12). This is clearly less the case for folds which undergo instantaneous lateral propagation than for those which propagate laterally. Interestingly, what we see is that there is little difference in the topographic expression of the two very different fault-related folds (Figure 12), despite the fact that the crest of a fault-propagation fold experiences an uplift rate twice that of a fault-bend fold. However, topographies developed above (single-step) fault-propagation folds are more symmetric than those developed above equivalent fault-bend folds as a result of their different forelimb kinematics (Figure 12). The forelimb of a fault-propagation fold undergoes active uplift and translation and thus is topographically much more evident than that of the fault-bend fold which undergoes passive translation and thus has little geomorphic expression as erosion removes its topographic expression almost immediately (Figure 12). Overall, we find that because of the forward-propagating fault (causing the folding in the forelimb of a fault-propagation fold), boundary conditions are continually being reset and steady state is not achieved.
In general, there is only a qualitative relationship between the location of axial surfaces and drainage divides in the modelled folds. Detection of the position of axial surfaces above fault-related fold structures from drainage divides, in the absence of field, seismic or other data, is problematic. We find that the position and orientations of axial surfaces rarely correlate directly with the major drainage divides seen at the Earth’s surface and while the drainage divides may provide an approximate indication of the form of the axial surfaces, there is often no direct spatial correspondence-particularly in the central parts of the structures. The drainage divides correspond closely with the axial surfaces only on the backlimb of the fault-propagation fold models. In the other cases we suggest that use of drainage divides as indicators of axial surface position be done with care. The frontal fold “scarp” is a much more reliable indicator of the position of the forelimb active axial surface in both fault-bend and fault-propagation folds.
7.2. Comparison with Natural Examples
Whilst the purpose of these experiments was not to model any specific fault-related fold observed in the field, it is clearly useful to provide an overview of how the drainage networks generated compare with those observed in nature. There are 3 basic observations that provide insight into fold growth in the models and their comparison with those seen in nature. Firstly in nature, apart from the lateral terminations of folds, the drainage networks that develop above fault-related folds are generally linear and parallel to the tectonic transport direction; under certain configurations this is also what is seen in our models (cf. Figure 1, Figure 6d and Figure 7d), typically under condition of instantaneous lateral propagation. In addition, the growth of steep, narrow forelimbs and gentler, wider backlimbs results in asymmetric drainage basin development (small basins on “forelimb”, larger on “backlimb”). Secondly in nature, as discussed previously, large drainage networks perpendicular to the transport direction are not observed (see Figure 1), they are common in model with wither gently tapering slip distributions or lateral propagation (cf. Figure 6 and Figure 7). This may reflect either that very rapid lateral propagation occurs in nature or perhaps that the angular, kink-band fault-related fold models used here do not capture the smoother form of the surface expression of fault-related folds with rounded hinge zones seen in nature (See Hubert-Ferrari et al., [4]). Thirdly, particularly on the backlimbs of both fold models (Figure 6 and Figure 7) the movement of flat-lying material through the active axial surface leads to the production of large facets. Very similar large-scale triangular fold scarp facets have been described by Hubert-Ferrari et al. [4] from the Southern Front of Quilitak Anticline, southern Tien Shan in China. In both the models and in nature, these are perhaps the most characteristic indicators of flexural-slip fold growth.
7.3. Limitations, Assumptions and Improvements
We have chosen to examine a system in which fluvial erosion (bedrock channel incision) and tectonic uplift are the dominant processes contributing to the geomorphology above the growing fold. In doing so, we acknowledge that we are simplifying a very complex system by making several assumptions and restrictions that may limit the model’s general applicability.
First, the model is strictly only applicable to small, mountainous catchments such as those that are commonly found in tectonically active regions and where bedrock channels can be expected to be the dominant channel type [89]. The model is not appropriate for transport-limited fluvial systems that are an important component of many larger catchments. Second, we do not include processes such as landsliding and debris flows in our model (cf. [38,112]). These are clearly important processes which contribute to both topographic development and sediment supply, but we have chosen to focus on a bedrock channel/hillslope diffusion landscape evolution model in order to isolate the response of the fluvial network to imposed tectonic perturbations. We have taken this approach because in many tectonically active regions topographic evolution can be argued to be dominated by the rates and patterns of bedrock-channel incision [29]. Bedrock incision appears to be the rate limiting process in many landscapes, influencing gradients on adjacent hillslopes and being closely coupled with landsliding [38,88]. Clearly, the inclusion of landsliding in our model would affect the morphology of our models, thus our morphologies can be thought of as first-order that will clearly be modulated and altered by contributions from landsliding and other processes. Third, the model of detachment-limited, bedrock channel evolution used here is only one of many (see Veneziano and Niemann [97]). We have chosen to use a stream power incision law due to its simplicity, ability to capture the behaviour of many river networks, and to reproduce the characteristics of real landscapes. Our choice of the exponents m and n in the stream power erosion law limits the scope of our analysis, but a more full investigation of the effects of different exponent values (e.g., m = 1/3, n = 2/3, erosion rate linearly proportional to shear stress) is underway.
In this contribution we have provided simple templates for the geomorphic expression of isolated flexural-slip fault-related folds dominated by bedrock fluvial incision, and we acknowledge that fold growth is much more complicated in nature. For example, it has recently been recognised that many fault-related folds perhaps evolve in a manner more similar to the trishear kinematic model, with forelimb dips steepening through time [83]. This distinct deformation field will have a profound influence on drainage network development above the fold forelimb. In addition, clearly, there are a whole variety of additional styles (or models) fault-fold interactions that occur in fold and thrust belts-folds with rounded hinges, detachment folds, wedges etc [4,113,114,115]. Each of these will have their own specific kinematics which will have an expression in the resulting geomorphic expression. In addition, discrete element models have been shown to produce folds with more realistic rounded hinges [114], which would be perhaps lead to more realistic looking drainage patterns without the sharp divides that are seen in the simple angular models presented here. In addition, many fault-related folds and their drainage systems are linked to more regional basinal processes which can result in them being rapidly buried by foreland sediments. Clearly individual structures link and have a profound effect on more regional drainage networks, and the manner in which structures grow laterally is undoubtedly more complex than our simple fold-lengthening scheme. However, we feel that our model results provide useful information about the behaviour of some end-member scenarios.
8. Conclusions
This paper has investigated, through numerical modelling, the geomorphic and structural expression of some key aspects of the three-dimensional growth of flexural-slip fault-bend and fault-propagation folds.
We find that the surface expression of fault-bend and fault-propagation folds depends on both the slip distribution along the fault and on the style of fold growth. When along-strike plunge is a result of slip events with linearly decreasing slip towards the fault tips (with or without lateral propagation), large plunge-panel drainage networks are developed at the expense of forelimb and backlimb drainage basins. In contrast, if the fold grows as a result of slip events with similar displacements along strike that are terminated abruptly at tear faults (coupled with lateral propagation), plunge panel drainage networks are poorly developed (or are later captured by forelimb and backlimb drainage) and restricted to fold noses, particularly when the number of propagation events is small. The absence of large-scale plunge-panel drainage networks in natural examples suggests that this latter mode of fold growth may be common.
We find that the advective component of deformation (implicit in kink-band migration models of fault-bend and fault-propagation folding) exerts a strong control on drainage basin development. In particular, limb-lengthening promotes the development of more linear, parallel drainage networks as compared to the dendritic patterns developed above simple uplifting structures. Topographies developed above (single-step) fault-propagation folds are more symmetric than those developed above equivalent fault-bend folds as a result of their different forelimb kinematics. Over the 1 Ma of their development, the modelled folds only attain partial topographic equilibrium, as new material is continually being advected through active axial surfaces on both fold limbs and faults are propagating in both the transport and strike directions. We also find that the position of drainage divides at the Earth’s surface has a complex relationship to the underlying fold axial surface locations.
Acknowledgments
Financial and logistical support for the study came from ICREA (Institució catalana de recerca i estudis avançats) and the Facultat de Geologia, Universitat de Barcelona to SH, Norsk Hydro (RLG) and PDVSA-INTEVEP (AB), whose support is gratefully acknowledged.
Author Contributions
S.H., A.B. and R.L.G. conceived and designed the experiments; A.B. performed the experiments; S.H. and A.B. analyzed the data; A.B., S.H. and R.L.G. wrote the paper.
Conflicts of Interest
The authors declare no conflicts of interest.
References
- Grant, L.B.; Mueller, K.J.; Gath, E.M.; Cheng, H.; Edwards, R.L.; Munro, R.; Kennedy, G.L. Late Quaternary uplift and earthquake potential of the San Joaquin Hills, southern Los Angeles basin, California. Geology 1999, 27, 1031–1034. [Google Scholar] [CrossRef]
- Rivero, C.; Shaw, J.H.; Mueller, K. Oceanside and Thirtymile Bank blind thrust: Implications for earthquakes hazards in coastal southern California. Geology 2000, 28, 891–894. [Google Scholar] [CrossRef]
- Allmendinger, R.W.; Shaw, J.H. Estimation of fault propagation distance from fold shape: Implications for earthquake hazard assessment. Geology 2000, 28, 1099–1102. [Google Scholar] [CrossRef]
- Hubert-Ferrari, A.; Suppe, J.; Gonzalez-Mieres, R.; Wang, X. Mechanisms of active folding of the landscape (southern Tian Shan, China). J. Geophys. Res. 2007, 112, B03S09. [Google Scholar] [CrossRef]
- Delcaillau, B.; Carozza, J.-M.; Laville, E.; Amrhar, M.; Sheikholeslami, R. New geomorphic criteria on lateral propagation of blind thrust-related fold growth accommodating oblique convergence. Ann. Geomorphol. 2007, 51, 141–163. [Google Scholar] [CrossRef] [Green Version]
- Talebian, M.; Copley, A.C.; Fattahi, M.; Ghorashi, M.; Jackson, J.A.; Nazari, H.; Sloan, R.A.; Walker, R.T. Active faulting within a megacity: The geometry and slip rate of the Pardisan thrust in central Tehran, Iran. Geophys. J. Int. 2016, 207, 1688–1699. [Google Scholar] [CrossRef]
- Wilkerson, M.S.; Medwedeff, D.A.; Marshak, S. Geometrical modelling of fault-related folds: A pseudo-three-dimensional approach. J. Struct. Geol. 1991, 13, 801–812. [Google Scholar] [CrossRef]
- Jackson, J.; Norris, R.; Youngson, J. The structural evolution of active fault and fold systems in central Otago, New Zealand: Evidence revealed by drainage patterns. J. Struct. Geol. 1996, 18, 217–234. [Google Scholar] [CrossRef]
- Mueller, K.; Talling, P. Geomorphic evidence for tear faults accommodating lateral propagation of an active fault-bend fold, Wheeler Ridge, California. J. Struct. Geol. 1997, 19, 397–411. [Google Scholar] [CrossRef]
- Delcaillau, B.; Deffontaines, B.; Floissac, L.; Angelier, J.; Deramond, J.; Souquet, P.; Chu, H.T.; Lee, J.F. Morphotectonic evidence from lateral propagation of an active frontal fold; Pakvashan anticline, foothills of Taiwan. Geomorphology 1998, 24, 263–290. [Google Scholar] [CrossRef]
- Collignon, M.; Fernandez, N.; Kaus, B.J.P. Influence of surface processes and initial topography on lateral fold growth and fold linkage mode. Tectonics 2015, 34, 1622–1645. [Google Scholar] [CrossRef]
- Poblet, J.; Hardy, S. Reverse modelling of detachment folds; application to the Pico del Aguila anticline in the South Central Pyrenees (Spain). J. Struct. Geol. 1995, 17, 1707–1724. [Google Scholar] [CrossRef]
- Ford, M.; Williams, E.; Artoni, A.; Vergés, J.; Hardy, S. Progressive evolution of a fault-related fold pair from growth strata geometries, Sant Llorenç de Morunys, SE Pyrenees. J. Struct. Geol. 1997, 19, 413–441. [Google Scholar] [CrossRef]
- Suppe, J.; Sabat, F.; Munoz, J.A.; Poblet, J.; Roca, E.; Verges, J. Bed-by-bed fold growth by kink-band migration: Sant Llorenc de Morunys, eastern Pyrenees. J. Struct. Geol. 1997, 19, 443–461. [Google Scholar] [CrossRef]
- Suppe, J.; Mueller, K. Growth of the Wheeler Ridge anticline, California: Geomorphic evidence for fault-bend folding behaviour during earthquakes. J. Struct. Geol. 1997, 19, 383–396. [Google Scholar]
- Casas-Sainz, A.M.; Cortes, A.L.; Maestro, A. Sequential limb rotation and kink-band migration recorded by growth strata, Almazán Basin, North Spain. Sediment. Geol. 2002, 146, 25–45. [Google Scholar] [CrossRef]
- King, G.C.P.; Stein, R.; Rundle, J. The growth of geological structures by repeated earthquakes, 1: Conceptual framework. J. Geohys. Res. 1988, 93, 13307–13318. [Google Scholar] [CrossRef]
- Burbank, D.W.; McLean, J.K.; Bullen, M.; Abdrakhmatov, K.Y.; Miller, M.M. Partitioning of intermontane basins by thrust–related folding, Tien Shan, Kyrgyzstan. Basin Res. 1999, 11, 75–92. [Google Scholar] [CrossRef]
- Keller, E.A.; Gurrola, L.; Tierney, T.E. Geomorphic criteria to determine direction of lateral propagation of reverse faulting and folding. Geology 1999, 27, 515–518. [Google Scholar] [CrossRef]
- Champel, B.; van der Beek, P.; Mugnier, J.-L.; Leturmy, P. Growth and lateral propagation of fault-related folds in the Siwaliks of western Nepal: Rates, mechanisms, and geomorphic signature. J. Geophys. Res. 2002, 107. [Google Scholar] [CrossRef]
- Cooper, K.; Hardy, S.; Gawthorpe, R.L. Stratigraphic and structural expression of the lateral growth of fault-propagation folds: Results and implications from kinematic modelling. Basin Res. 2003, 15, 165–182. [Google Scholar] [CrossRef]
- Gaidzik, K.; Ramirez-Herrera, M.T. Geomorphic indices and relative tectonic uplift in the Guerrero sector of the Mexican forearc. Geosci. Front. 2017, 8, 885–902. [Google Scholar] [CrossRef]
- Talling, P.J.; Sowter, M.J. Drainage network on progressively tilted surfaces with different gradients, Wheeler ridge, California. Earth Surf. Process. Landf. 1999, 24, 809–824. [Google Scholar] [CrossRef]
- Chen, J.; Heermance, R.; Burbank, D.W.; Scharer, K.M.; Miao, J.; Wang, C. Quantification of growth and lateral propagation of the Kashi anticline, southwest Chinese Tian Shan. J. Geophys. Res. 2007, 112, B03S16. [Google Scholar] [CrossRef]
- Ellis, M.A.; Densmore, A.L.; Anderson, R.S. Evolution of mountainous topography in the Basin and Range Province. Basin Res. 1999, 11, 21–42. [Google Scholar] [CrossRef]
- Gawthorpe, R.L.; Leeder, M.R. Tectono-sedimentary evolution of active extensional basins. Basin Res. 2000, 12, 195–218. [Google Scholar] [CrossRef]
- Morewood, N.C.; Roberts, G.P. Surface observations of active normal fault propagation: Implications for growth. J. Geol. Soc. Lond. 2002, 159, 263–272. [Google Scholar] [CrossRef]
- Jackson, J.; Ritz, J.-F.; Siame, L.; Raisbeck, G.; Yiou, F.; Norris, R.; Youngson, J.; Bennett, E. Fault growth and landscape development in Otago, New Zealand, using in situ cosmogenic 10Be. Earth Planet. Sci. Lett. 2002, 195, 185–193. [Google Scholar] [CrossRef]
- Snyder, N.P.; Whipple, K.X.; Tucker, G.E.; Merrits, D.J. Landscape response to tectonic forcing: Digital elevation model analysis of stream profiles in the Mendocino triple junction region, northern California. Geol. Soc. Am. Bull. 2000, 112, 1250–1263. [Google Scholar] [CrossRef]
- Ahmadi, R.; Ouali, J.; Mercier, E.; Mansy, J.L.; Van Vliet Lanoe, B.; Launeau, P.; Hekhiss, F.; Rafini, S. The geomorphologic imprints of hinge migration in the fault-related folds. A case study in southern Tunisian Atlas. J. Struct. Geol. 2006, 28, 721–728. [Google Scholar] [CrossRef]
- Bretis, B.; Bartl, N.; Grasemann, B. Lateral fold growth and linkage in the Zagros fold and thrust belt (Kurdistan, NE Iraq). Basin Res. 2011, 23, 615–630. [Google Scholar] [CrossRef]
- Kirby, E.; Whipple, K.X. Expression of active tectonics in erosional landscapes. J. Struct. Geol. 2012, 44, 54–75. [Google Scholar] [CrossRef]
- Lave, J.; Avouac, J.P. Active folding of fluvial terraces across the Siwalik Hills, Himalayas of central Nepal. J. Geophys. Res. 2000, 105, 5735–5770. [Google Scholar] [CrossRef]
- Kirby, E.; Whipple, K.X. Quantifying differential rock-uplift rates via stream profile analysis. Geology 2001, 29, 415–418. [Google Scholar] [CrossRef]
- Van der Beek, P.; Champel, B.; Mugnier, J.L. Control of detachment dip on drainage development in regions of active fault-propagation folding. Geology 2002, 30, 471–474. [Google Scholar] [CrossRef]
- Thompson, S.C.; Weldon, R.J.; Rubin, C.M.; Abdrakhmatov, K.; Molnar, P.; Berger, G.W. Late Quaternary slip rates across the central Tien Shan, Kyrgyzstan, central Asia. J. Geophys. Res. 2002, 107, 2203. [Google Scholar] [CrossRef]
- Miller, S.; Slingerland, R.L. Topographic advection on fault-bend folds: Inheritance of valley positions and the formation of wind gaps. Geology 2006, 34, 769–772. [Google Scholar] [CrossRef]
- Densmore, A.L.; Ellis, M.A.; Anderson, R.S. Landsliding and the evolution of normal-fault-bounded mountains. J. Geophys. Res. 1998, 103, 15203–15219. [Google Scholar] [CrossRef] [Green Version]
- Scholz, C.H. The Mechanics of Earthquakes and Faulting; Cambridge University Press: Cambridge, MA, USA, 1990; p. 439. [Google Scholar]
- Cowie, P.A.; Scholz, C.H. Displacement-length scaling relationship for faults: Data synthesis and discussion. J. Struct. Geol. 1992, 14, 1149–1156. [Google Scholar] [CrossRef]
- Schultz, R.A.; Okubo, C.H.; Wilkins, S.J. Displacement-length scaling relations for faults on the terrestrial planets. J. Struct. Geol. 2006, 28, 2182–2193. [Google Scholar] [CrossRef]
- Bergen, K.J.; Shaw, J.H. Displacement profiles and displacement-length scaling relationships of thrust faults constrained by seismic-reflection data. GSA Bull. 2010, 122, 1209–1219. [Google Scholar] [CrossRef]
- Dawers, N.H.; Anders, M.H.; Scholz, C.H. Growth of normal faults: Displacement-length scaling. Geology 1993, 21, 1107–1110. [Google Scholar] [CrossRef]
- Clark, R.M.; Cox, S.J.D. A modern regression approach to determining fault displacement-length scaling relationships. J. Struct. Geol. 1996, 18, 147–152. [Google Scholar] [CrossRef]
- Walsh, J.; Watterson, J. Analysis of the relationship between displacement and dimensions of faults. J. Struct. Geol. 1988, 10, 239–247. [Google Scholar] [CrossRef]
- Marrett, R.; Allmendinger, R. Estimates of strain due to brittle faulting: Sampling of fault population. J. Struct. Geol. 1991, 13, 735–738. [Google Scholar] [CrossRef]
- Gillespie, P.A.; Walsh, J.J.; Watterson, J. Limitations of dimension and displacement data from single faults and the consequences for data analysis and interpretation. J. Struct. Geol. 1992, 14, 1157–1172. [Google Scholar] [CrossRef]
- Elliott, D. The energy balance and deformation mechanisms of thrust sheets. Philos. Trans. R. Soc. Lond. A 1976, 283, 289–312. [Google Scholar] [CrossRef]
- Fermor, P. Aspects of the three-dimensional structure of the Alberta Foothills and Front Ranges. Geol. Soc. Amer. Bull. 1999, 111, 317–346. [Google Scholar] [CrossRef]
- Wilkerson, S. Differential transport and continuity of thrust sheets. J. Struct. Geol. 1992, 14, 749–751. [Google Scholar] [CrossRef]
- Mansfield, C.; Cartwright, J. Fault growth by linkage: Observations and implications from analogue models. J. Struct. Geol. 2001, 23, 745–763. [Google Scholar] [CrossRef]
- Ackermann, R.V.; Schlische, R.W.; Withjack, M.O. The geometric and statistical evolution of normal fault systems: An experimental study of the effects of mechanical layer thickness on scaling laws. J. Struct. Geol. 2001, 23, 1803–1819. [Google Scholar] [CrossRef]
- Walsh, J.J.; Nicol, A.; Childs, C. An alternative model for the growth of faults. J. Struct. Geol. 2002, 24, 1669–1675. [Google Scholar] [CrossRef]
- Alvarez, W. Drainage on evolving fold-thrust belts: A study of transverse canyons in the Apennines. Basin Res. 1999, 11, 267–284. [Google Scholar] [CrossRef]
- Pollard, D.D.; Segall, P. Theoretical displacement and stress near fractures in rocks: With application to faults, joints, veins, dikes, and solution surfaces. In Fracture Mechanics of Rocks; Atkinson, B.K., Ed.; Academic Press Geology Series; Academic Press: London, UK, 1987. [Google Scholar]
- Cowie, P.A.; Scholz, C.H. Physical explanation for the displacement-length relationship of faults using a post-yield fracture mechanics model. J. Struct. Geol. 1992, 14, 1133–1148. [Google Scholar] [CrossRef]
- Willemse, E.J.M. Segmented normal faults: Correspondence between three-dimensional mechanical models and field data. J. Geophys. Res. 1997, 102, 675–692. [Google Scholar] [CrossRef]
- Souter, B.J.; Hager, B.H. Faul propagation fold growth during the 1994 Northridge, California, earthquake? J. Geophys. Res. 1997, 112, 11931–11942. [Google Scholar] [CrossRef]
- Ma, K.-F.; Song, T.-R.; Lee, S.-J.; Wu, H.-I. Spatial slip distribution of the September 20, 1999, Chi-Chi, Taiwan, earthquake (Mw 7.6)—Inverted from teleseismic data. Geophys. Res. Lett. 2000, 27, 3417–3420. [Google Scholar] [CrossRef]
- Lin, A.; Ouchi, T.; Chen, A.; Maruyama, T. Co-seismic displacements, folding and shortening structures along the Chelungpu surface rupture zone occurred during the 1999 Chi-Chi (Taiwan) earthquake. Tectonophysics 2001, 330, 225–244. [Google Scholar] [CrossRef]
- Zhang, L.; Wu, J.C.; Ge, L.L.; Ding, X.L.; Chen, Y.L. Determining fault slip distribution of the Chi-Chi Taiwan earthquake with GPS and InSAR data using triangular dislocation elements. J. Geodyn. 2008, 45, 163–168. [Google Scholar] [CrossRef]
- Wan, Y.; Shen, Z.K.; Bürgmann, R.; Sun, J.; Wang, M. Fault geometry and slip distribution of the 2008 Mw 7.9 Wenchuan, China earthquake, inferred from GPS and InSAR measurements. Geophys. J. Int. 2017, 208, 748–766. [Google Scholar] [CrossRef]
- Fukahata, Y.; Hashimoto, M. Simultaneous estimation of the dip angles and slip distribution on the faults of the 2016 Kumamoto earthquake through a weak nonlinear inversion of InSAR data. Earth Planets Space 2016, 68, 204. [Google Scholar] [CrossRef]
- Chen, T.; Akciz, S.O.; Hudnut, K.W.; Zhang, D.Z.; Stock, J.M. Fault-Slip Distribution of the 1999 Mw 7.1 Hector Mine Earthquake, California, Estimated from Postearthquake Airborne LiDAR Data. Bull. Seismol. Soc. Am. 2015, 105, 776–790. [Google Scholar] [CrossRef]
- Chen, J.; Burbank, D.W.; Scharer, K.M.; Sobel, E.; Yin, J.; Rubin, C.; Zhao, R. Magnetochronology of the Upper Cenozoic strata in the Southwestern Chinese Tian Shan: Rates of Pleistocene folding and thrusting. Earth Planet. Sci. Lett. 2002, 195, 113–130. [Google Scholar] [CrossRef]
- Daeron, M.; Avouac, J.P.; Charreau, J.; Dominguez, S. Modeling the shortening history of a fault-tip fold using structural and geomorphic records of deformation. J. Geophys. Res. 2007, 112, B03S13. [Google Scholar] [CrossRef]
- Delcaillau, B. Geomorphic response to growing fault-related folds: Example from the foothills of central Taiwan. Geodin. Acta 2001, 14, 265–287. [Google Scholar] [CrossRef]
- Shaw, J.; Hook, S.; Suppe, J. Structural trend analysis by axial surface mapping. Am. Assoc. Pet. Geol. Bull. 1994, 78, 700–721. [Google Scholar]
- Rowan, M.G.; Linares, R. Fold-evolution matrices and axial surfaces of fault-bend folds: Application to the Medina anticline, Eastern Cordillera, Colombia. Am. Assoc. Pet. Geol. Bull. 2000, 84, 741–763. [Google Scholar]
- Gallango, O.; Novoa, E.; Bernal, A. The petroleum system of the central Perijá fold belt, western Venezuela. Am. Assoc. Pet. Geol. Bull. 2002, 86, 1263–1284. [Google Scholar]
- Goode, J.K.; Burbank, D.W. Kinematic implications of consequent channels on growing folds. J. Geophys. Res. 2011, 116, B04407. [Google Scholar] [CrossRef]
- Keller, E.A.; Zepeda, R.L.; Rockwell, T.K.; Ku, T.L.; Dinklage, W.S. Active tectonics at Wheeler Ridge, southern San Joaquin Valley, California. Geol. Soc. Am. Bull. 1998, 10, 298–310. [Google Scholar] [CrossRef]
- Meigs, A.J.; Brozovic, N.; Johnson, M.L. Steady balanced rates of uplift and erosion of the Santa Monica mountains, California. Basin Res. 1999, 11, 59–73. [Google Scholar] [CrossRef]
- Azor, A.; Keller, E.A.; Yeats, R.S. Geomorphic indicators of active fold growth: South Mountain-Oak Ridge anticline, Ventura basin, southern California. Geol. Soc. Am. Bull. 2002, 114, 745–753. [Google Scholar] [CrossRef]
- Bilotti, F.; Shaw, J.H.; Brennan, P.A. Quantitative structural analysis with stereoscopic remote sensing imagery. Am. Assoc. Pet. Geol. Bull. 2000, 84, 727–740. [Google Scholar]
- Fisher, N.D.; Jordan, T.E.; Brown, L. The structural and stratigraphic evolution of the La Rioja basin, Argentina. J. South Am. Earth Sci. 2002, 15, 141–156. [Google Scholar] [CrossRef]
- Suppe, J. Geometry kinematics of fault-bend folding. Am. J. Sci. 1983, 283, 684–721. [Google Scholar] [CrossRef]
- Suppe, J.; Medwedeff, D.A. Geometry Kinematics of Fault-Propagation Folding. Eclogae Geol. Helvetiae 1990, 83, 409–454. [Google Scholar]
- Stein, R.S.; King, G.C.P. Seismic potential revealed by surface folding: The 1983 Coalinga, California, earthquake. Science 1984, 224, 869–872. [Google Scholar] [CrossRef] [PubMed]
- Niño, F.; Philip, H.; Chery, J. The role of bed-parallel slip in the formation of blind thrust faults. J. Struct. Geol. 1998, 20, 503–516. [Google Scholar] [CrossRef]
- Cardozo, N.; Bhalla, K.; Zehnder, A.T.; Allmendinger, R.W. Mechanical models of fault propagation folds and comparison to the trishear kinematic model. J. Struct. Geol. 2003, 25, 1–18. [Google Scholar] [CrossRef]
- Hardy, S.; Ford, M. Numerical modelling of trishear fault-propagation folding. Tectonics 1997, 16, 841–854. [Google Scholar] [CrossRef]
- Allmendinger, R.W. Inverse and forward numerical modelling of trishear fault propagation folds. Tectonics 1998, 17, 640–656. [Google Scholar] [CrossRef]
- Chester, J.S.; Chester, F.M. Fault-propagation folds above thrust with constant dip. J. Struct. Geol. 1990, 12, 903–910. [Google Scholar] [CrossRef]
- Hardy, S.; Poblet, J. Geometric and numerical model of progressive limb rotation in detachment folds. Geology 1994, 22, 371–374. [Google Scholar] [CrossRef]
- Hardy, S.; Poblet, J. The velocity description of deformation. Paper 2: Sediment geometries associated with fault-bend and fault-propagation folds. Mar. Pet. Geol. 1995, 12, 165–176. [Google Scholar] [CrossRef]
- Whipple, K.X.; Kirby, E.; Brocklehurst, S.H. Geomorphic limits to climate-induced increases in topographic relief. Nature 1999, 401, 39–43. [Google Scholar] [CrossRef]
- Burbank, D.W.; Leland, J.; Fielding, E.; Anderson, R.S.; Brozovic, N.; Reid, M.R.; Duncan, C. Bedrock incision, rock uplift and threshold hillslopes in the northwestern Himalayas. Nature 1996, 379, 505–510. [Google Scholar] [CrossRef]
- Whipple, K.X.; Tucker, G.E. Dynamics of the stream-power river incision model: Implications for height limits of mountain ranges, landscape response timescales, and research needs. J. Geophys. Res. 1999, 104, 17661–17674. [Google Scholar] [CrossRef]
- Bernal, A.; Hardy, S. Syn-tectonic sedimentation associated with three-dimensional fault-bend fold structures: A numerical approach. J. Struct. Geol. 2002, 24, 609–635. [Google Scholar] [CrossRef]
- Bernal, A.; Hardy, S.; Gawthorpe, R.L.; Finch, E. Stratigraphic expression of the lateral propagation and growth of isolated fault-related uplifts. Basin Res. 2004, 16, 221–238. [Google Scholar] [CrossRef]
- Bennedetti, L.; Tapponier, P.; King, G.C.P.; Meyer, B.; Manighetti, I. Growth folding and active thrusting in the Montello region, Veneto, northern Italy. J. Geophys. Res. 2000, 105, 739–766. [Google Scholar] [CrossRef]
- Kim, Y.-S.; Sanderson, D.J. The relationship between displacement and length of faults: A review. Earth Sci. Rev. 2005, 68, 317–334. [Google Scholar] [CrossRef]
- Stock, J.D.; Montgomery, D.R. Geologic constraints on bedrock river incision using the stream power law. J. Geophys. Res. 1999, 104, 4983–4993. [Google Scholar] [CrossRef]
- Whipple, K.X.; Snyder, N.P.; Dollenmayer, K. Rates and processes of bedrock incision by the Upper Ukak River since the 1912 Novarupta ash flow in the Valley of Ten Thousand Smokes, Alaska. Geology 2000, 28, 835–838. [Google Scholar] [CrossRef]
- Whipple, K.X.; Hancock, G.S.; Anderson, R.S. River incision into bedrock: Mechanics and relative efficacy of plucking, abrasion, and cavitation. Geol. Soc. Am. Bull. 2000, 112, 490–503. [Google Scholar] [CrossRef]
- Veneziano, D.; Niemann, J.D. Self-similarity and multifractality of fluvial erosion topography, 1, Mathematical conditions and physical origin. Water Resour. Res. 2000, 36, 1923–1936. [Google Scholar] [CrossRef]
- Montgomery, D.R. Predicting landscape-scale erosion rates using digital elevation models. C. R. Geosci. 2003, 335, 1121–1130. [Google Scholar] [CrossRef]
- Howard, A.D. A detachment-limited model of drainage basin evolution. Water Resour. Res. 1994, 30, 2261–2285. [Google Scholar] [CrossRef]
- Hardy, S.; Gawthorpe, R. Normal fault control on sediment supply to extensional basins: Insights from numerical modelling. J. Geophys. Res. 2002, 107. [Google Scholar] [CrossRef]
- Kenyon, P.M.; Turcotte, D.L. Morphology of a delta prograding by bulk sediment transport. Geol. Soc. Am. Bull. 1985, 96, 1457–1465. [Google Scholar] [CrossRef]
- Leeder, M. Sedimentology and Sedimentary Basins: From Turbulence to Tectonics; Blackwell Science Ltd.: Hoboken, NJ, USA, 1999. [Google Scholar]
- Leeder, M.R. Denudation, vertical crustal movements and sedimentary fill. Geol. Rundsch. 1991, 80, 441–458. [Google Scholar] [CrossRef]
- Roering, J.J.; Kirchner, J.W.; Sklar, L.S.; Dietrich, W.E. Hillslope evolution by nonlinear creep and landsliding: An experimental approach. Geology 2001, 29, 143–146. [Google Scholar] [CrossRef]
- Colman, S.M.; Watson, K. Ages estimated from a diffusion equation model for scarp degradation. Science 1983, 221, 263–265. [Google Scholar] [CrossRef] [PubMed]
- Avuoac, J.P.; Tapponnier, P.; Bai, M.; You, H.; Wang, G. Active thrusting and folding along the Northern Tien Shan and Late Cenozoic Rotation of the Tarim Relative to Dzungaria and Kazakhstan. J. Geophys. Res. 2001, 98, 6755–6804. [Google Scholar] [CrossRef]
- Martin, Y. Modelling hillslope evolution: Linear and nonlinear transport relations. Geomorphology 2001, 34, 1–21. [Google Scholar] [CrossRef]
- Swan, F.H. Temporal clustering of Paleoseismic events on the Oued Fodda fault, Algeria. Geology 1988, 16, 1092–1095. [Google Scholar] [CrossRef]
- Stein, R.S.; Yeats, R.S. Hidden Earthquakes. Sci. Am. 1989, 260, 48–57. [Google Scholar] [CrossRef]
- Kelson, K.I.; Simpson, G.D.; Vanarsdale, R.B.; Haraden, C.C.; Lettis, W.R. Multiple late Holocene earthquakes along the Reelfoot fault, central New Madrid seismic zone. J. Geophys. Res. 1996, 101, 6151–6170. [Google Scholar] [CrossRef]
- Lague, D.; Crave, A.; Davy, P. Laboratory exp0eriments simulating the geomorphic response to tectonic uplift. J. Geophys. Res. 2003, 108. [Google Scholar] [CrossRef]
- Rigon, R.; Rinaldo, A.; Rodriguez-Iturbe, I. On landscape self-organization. J. Geophys. Res. 1994, 99, 11971–11985. [Google Scholar] [CrossRef]
- Hardy, S.; McClay, K.; Muñoz, J.A. Deformation and fault activity in space and time in high-resolution numerical models of doubly vergent thrust wedges. Mar. Pet. Geol. 2009, 26, 232–248. [Google Scholar] [CrossRef]
- Hardy, S.; Finch, E. Discrete-element modelling of detachment folding. Basin Res. 2005, 17, 507–520. [Google Scholar] [CrossRef]
- Hardy, S. Cover deformation above steep, basement normal faults: Insights from 2D discrete element modeling. Mar. Pet. Geol. 2011, 28, 966–972. [Google Scholar] [CrossRef]
Figure 1.
Cross-sections, drainage networks and axial surface maps developed above fault-related fold structures: (a) Pakuashan anticline, Taiwan (after Delcaillau et al. [10] and Delcaillau [67]), (b) the Tunic anticline (modified from Shaw et al. [68]), (c) Folds from central Otago, New Zealand (after Jackson et al. [8]), (d) Wheeler Ridge anticline, California (after Mueller and Talling [9], Talling and Sowter [23]).

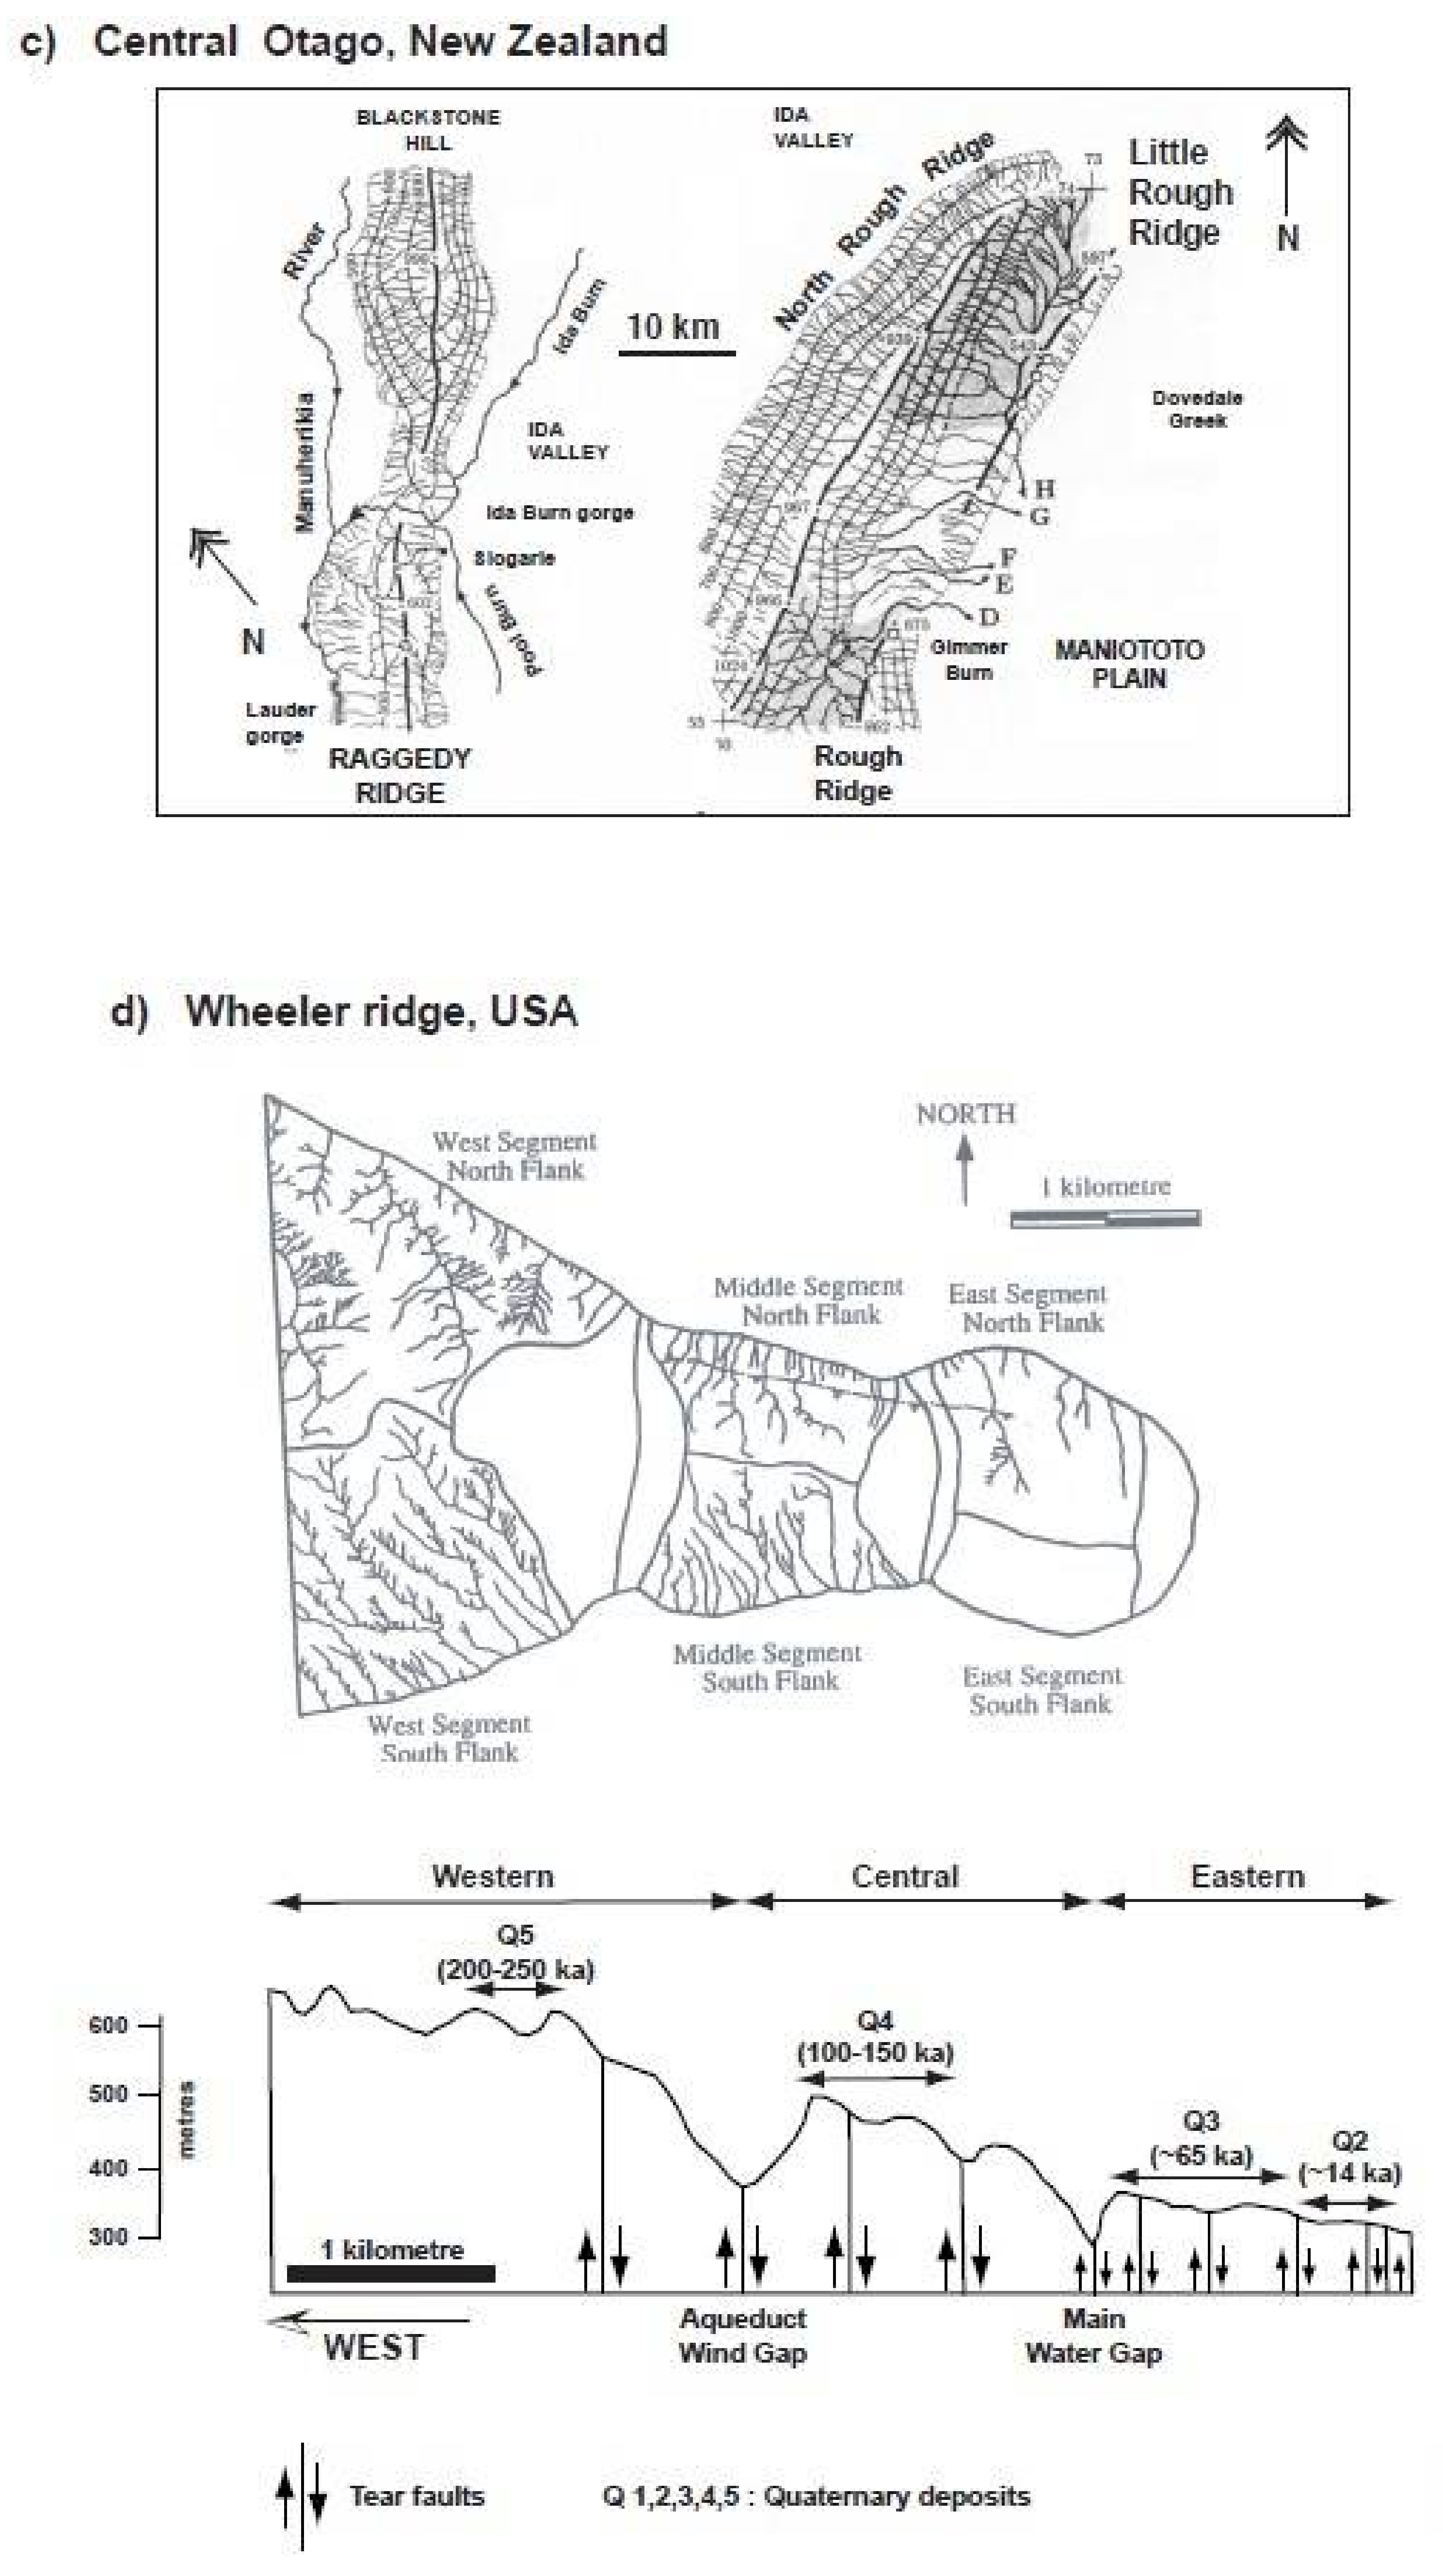
Figure 2.
(a) Surface processes and (b) example structural template included in the numerical modelling approach. Two key surface processes are considered: bedrock channel development and diffusive erosion, transport and deposition. Tectonic deformation (fault-bend or fault-propagation folding) is modelled using kink-band kinematics where both active an inactive axial surfaces are present. See text for discussion.
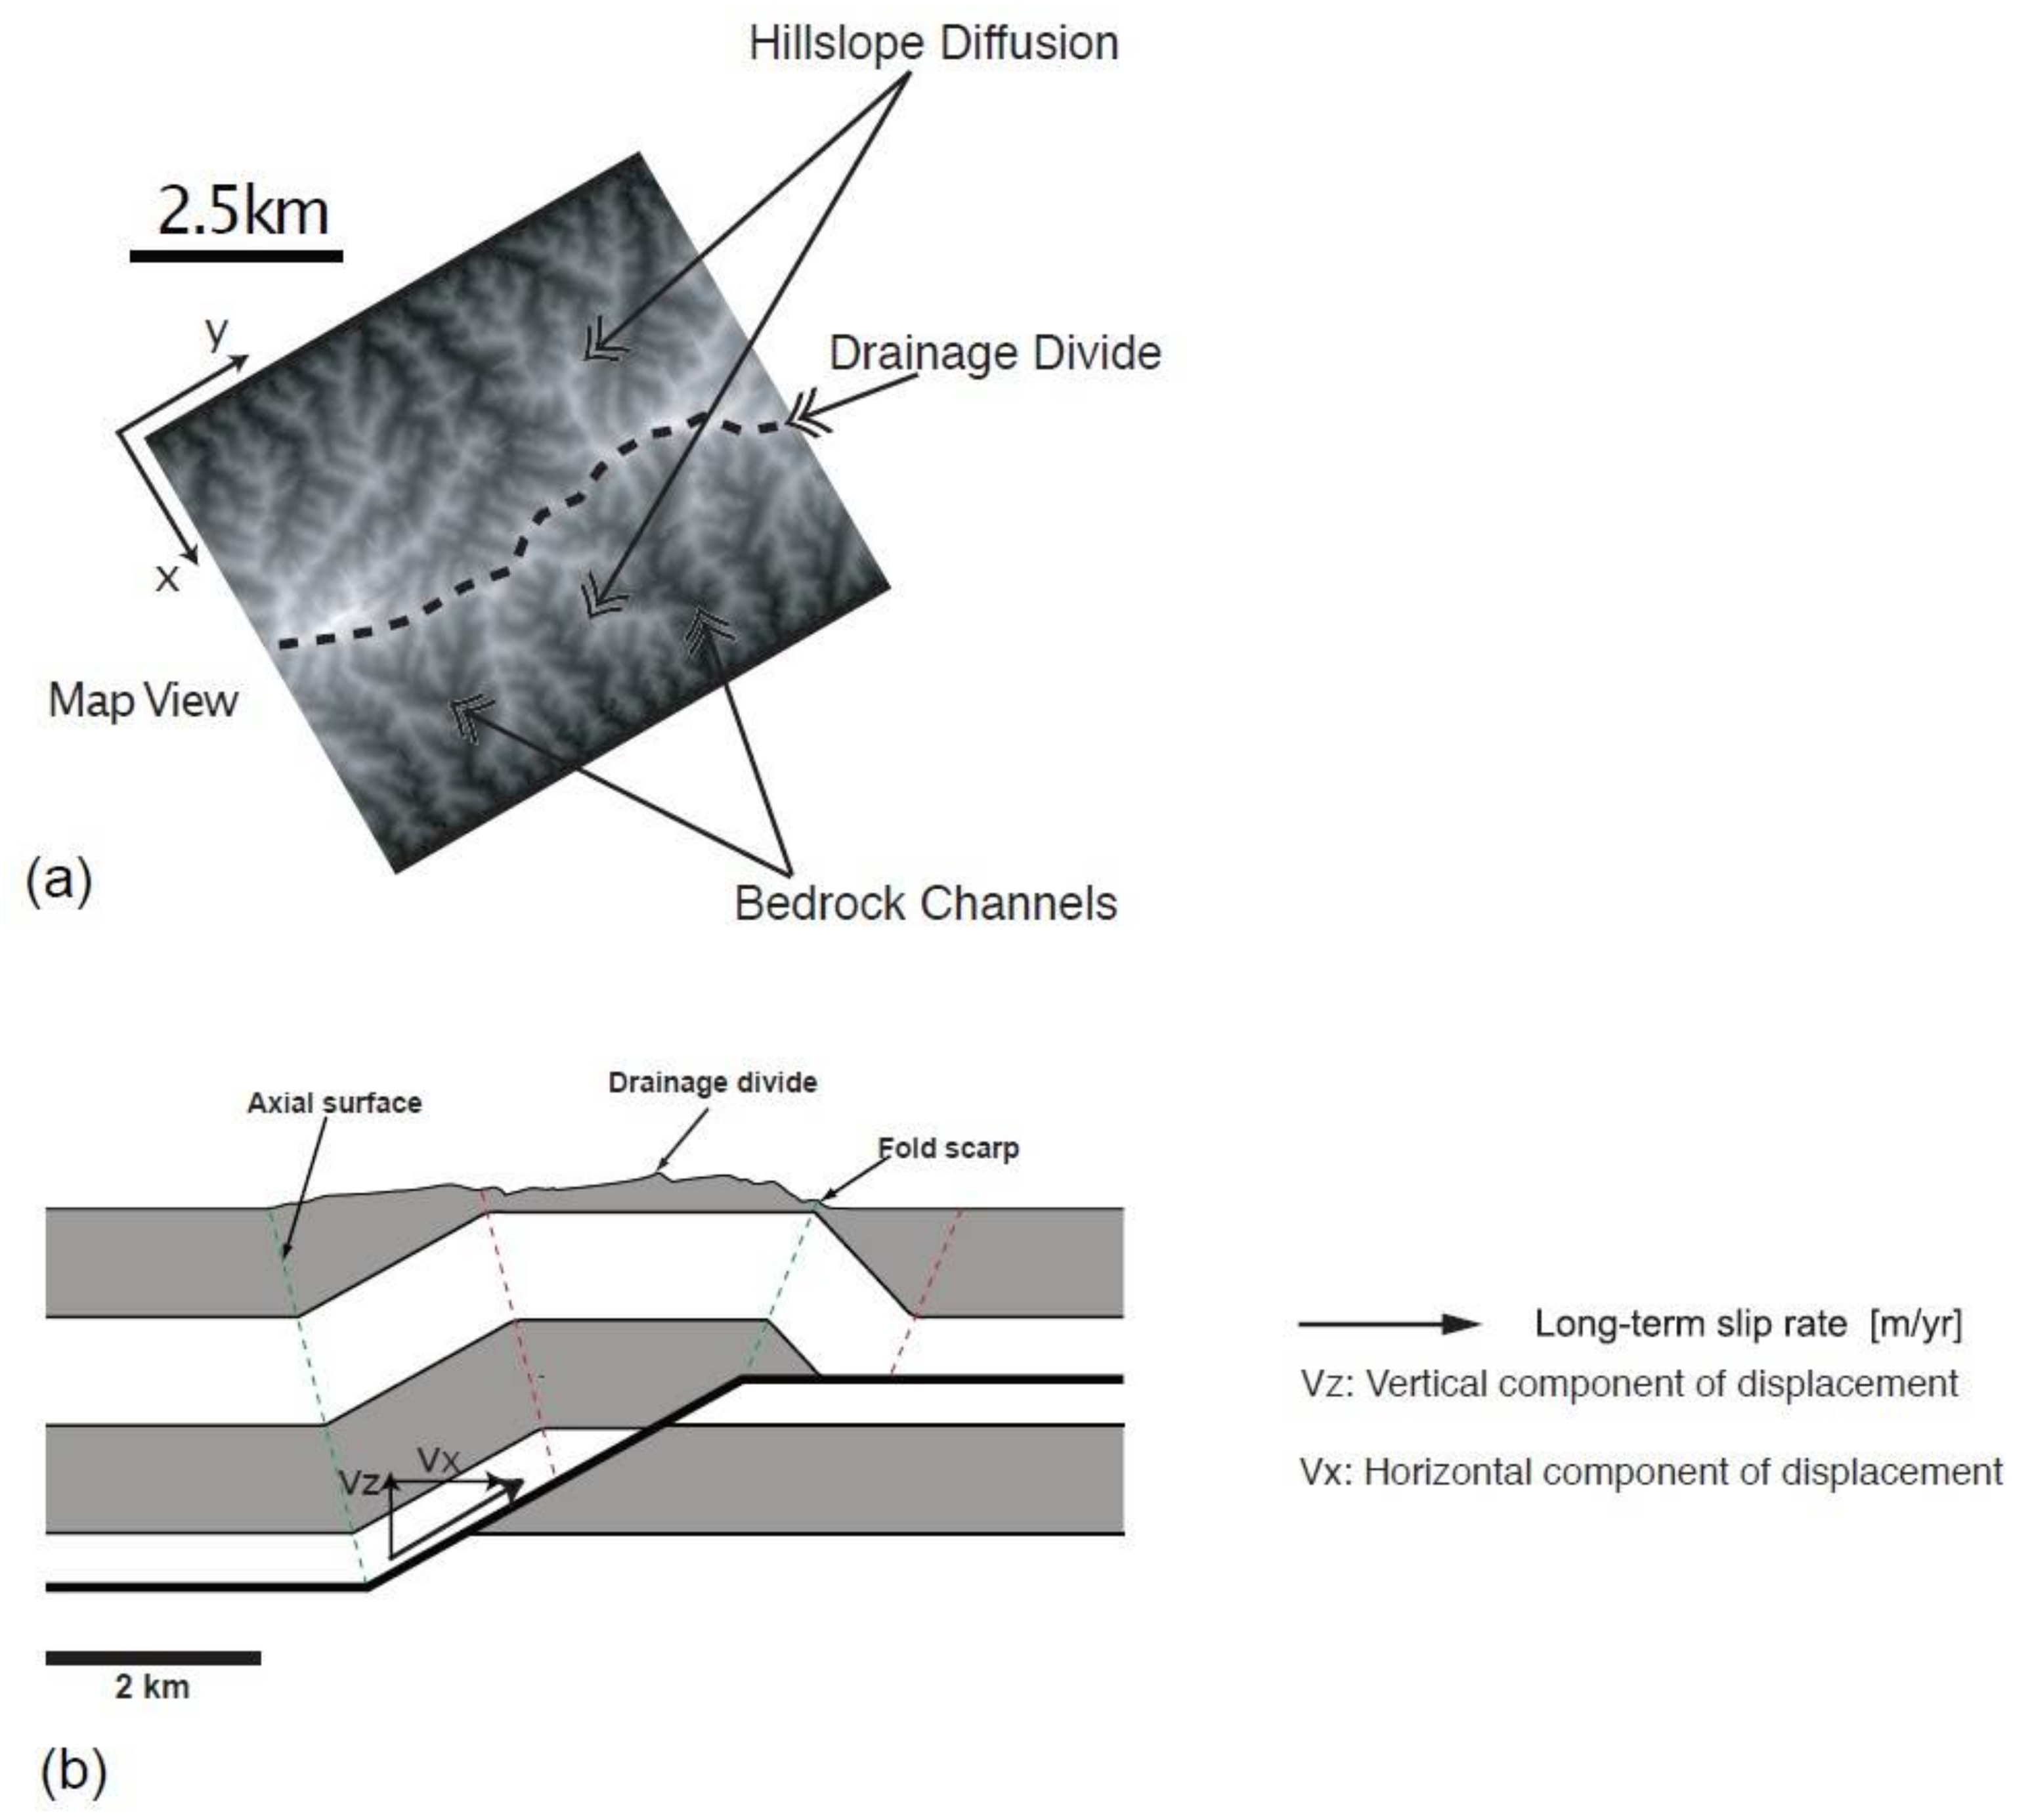
Figure 3.
Illustration of the manner in which the modelled faults and folds grow in the modelling scheme, after Bernal et al. [91].
Figure 3.
Illustration of the manner in which the modelled faults and folds grow in the modelling scheme, after Bernal et al. [91].

Figure 4.
Illustration of the two different slip distributions considered, after Bernal et al. [91].
Figure 4.
Illustration of the two different slip distributions considered, after Bernal et al. [91].

Figure 5.
(a–f) Evolution of the upper surface of a simple uplifting structure over 1 Ma, and (g) illustration of final stream profiles indicated (vertical exaggeration 10:1).
Figure 5.
(a–f) Evolution of the upper surface of a simple uplifting structure over 1 Ma, and (g) illustration of final stream profiles indicated (vertical exaggeration 10:1).


Figure 6.
Final morphology of the fault-bend fold model under different slip distributions, (a–c) top row linear slip distribution, (d–f) bottom row constant slip distribution and for styles of lengthening (columns). Greyscale shaded relief images with illumination from NW, azimuth is 30 degrees.
Figure 6.
Final morphology of the fault-bend fold model under different slip distributions, (a–c) top row linear slip distribution, (d–f) bottom row constant slip distribution and for styles of lengthening (columns). Greyscale shaded relief images with illumination from NW, azimuth is 30 degrees.

Figure 7.
Final morphology of the fault-propagation fold model under different slip distributions, (a–c) top row linear slip distribution, (d–f) bottom row constant slip distribution and for styles of lengthening. Greyscale shaded relief images with illumination from NW, azimuth is 30 degrees.
Figure 7.
Final morphology of the fault-propagation fold model under different slip distributions, (a–c) top row linear slip distribution, (d–f) bottom row constant slip distribution and for styles of lengthening. Greyscale shaded relief images with illumination from NW, azimuth is 30 degrees.
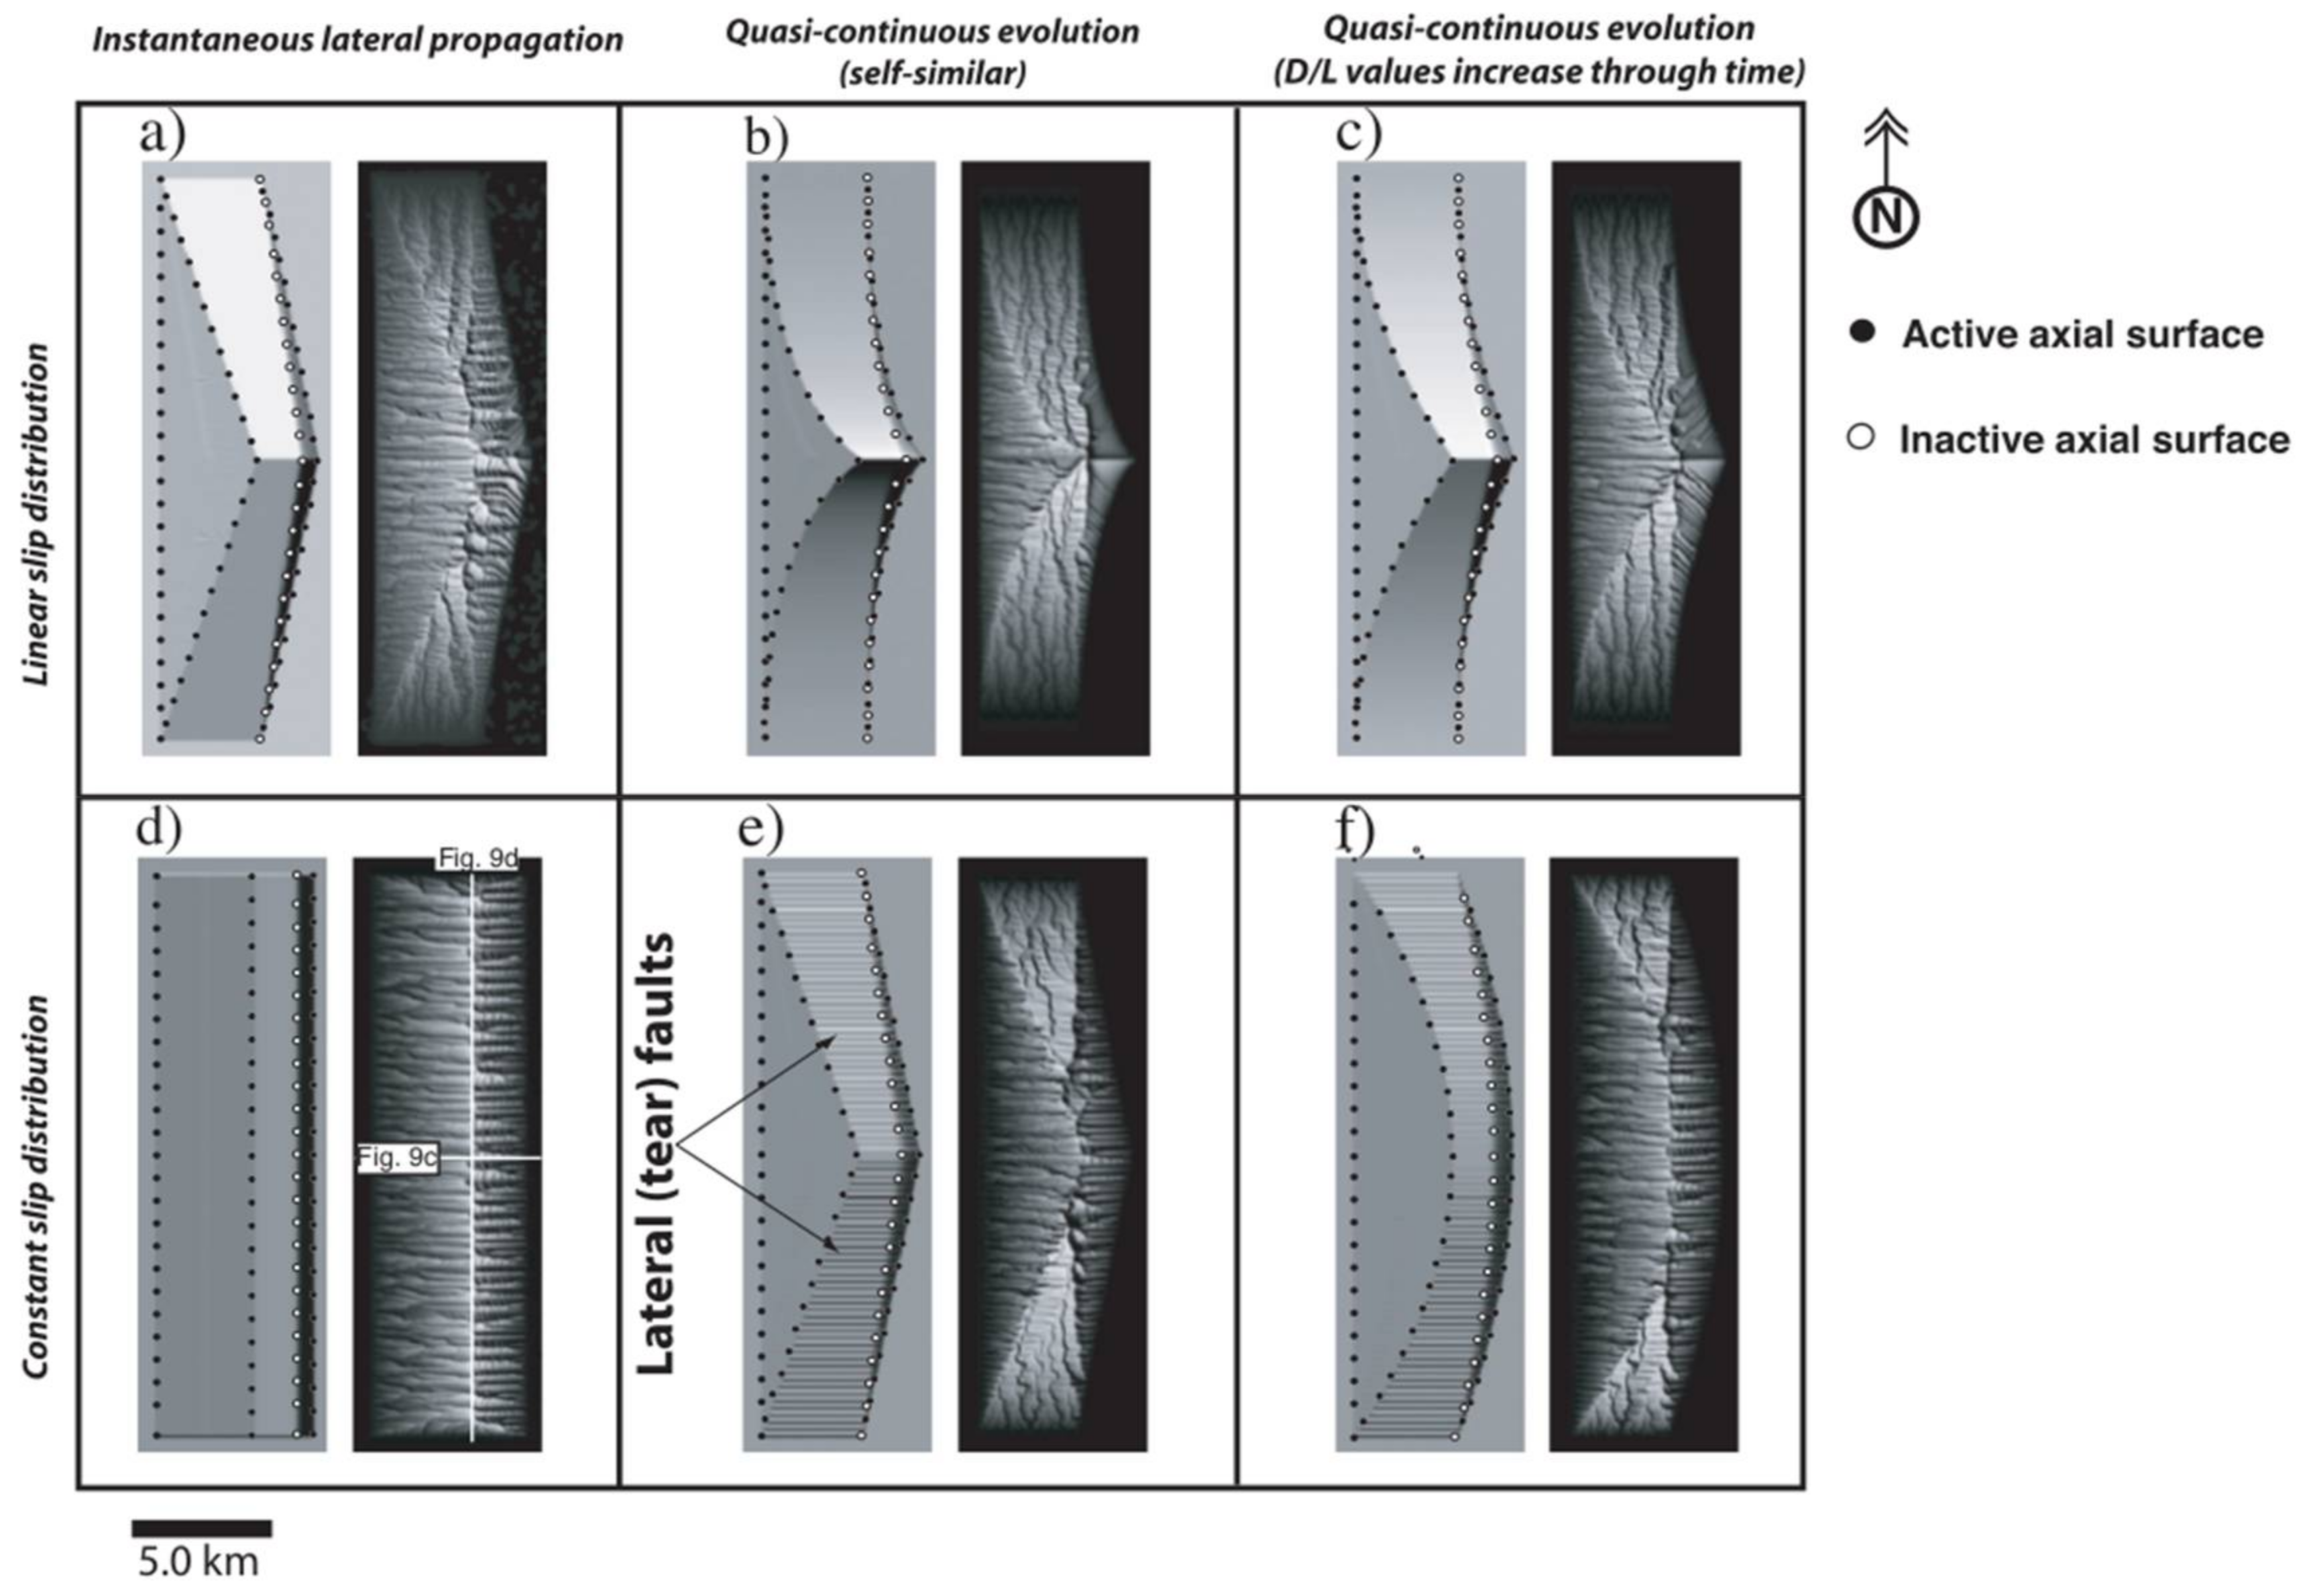
Figure 8.
Cross sections (A,B) across final models of Figure 6 and Figure 7 illustrating the relationship between structural position and drainage divides for instantaneous lateral propagation and constant slip distribution and (C,D) lateral elevation profiles. Location and orientation of the cross sections is indicated in Figure 6 and Figure 7, elevation profiles have a vertical exaggeration of approx 40:1.

Figure 9.
Evolution of the fault-propagation and fault-bend fold models under conditions of instantaneous lateral propagation and constant slip distribution, (a) 200 kyr, (b) 400 kyr, (c) 800 kyr and (d) 1000 kyr. Greyscale shaded relief images with illumination from NW, azimuth is 30 degrees. A and B are drainage basins discussed in text.

Figure 10.
Evolution of the fault-propagation and fault-bend fold models under conditions of instantaneous lateral propagation and linear slip distribution. (a) 200 kyr, (b) 400 kyr, (c) 800 kyr and (d) 1000 kyr. Greyscale shaded relief images with illumination from NW, azimuth is 30 degrees. A and B are drainage basins discussed in text.
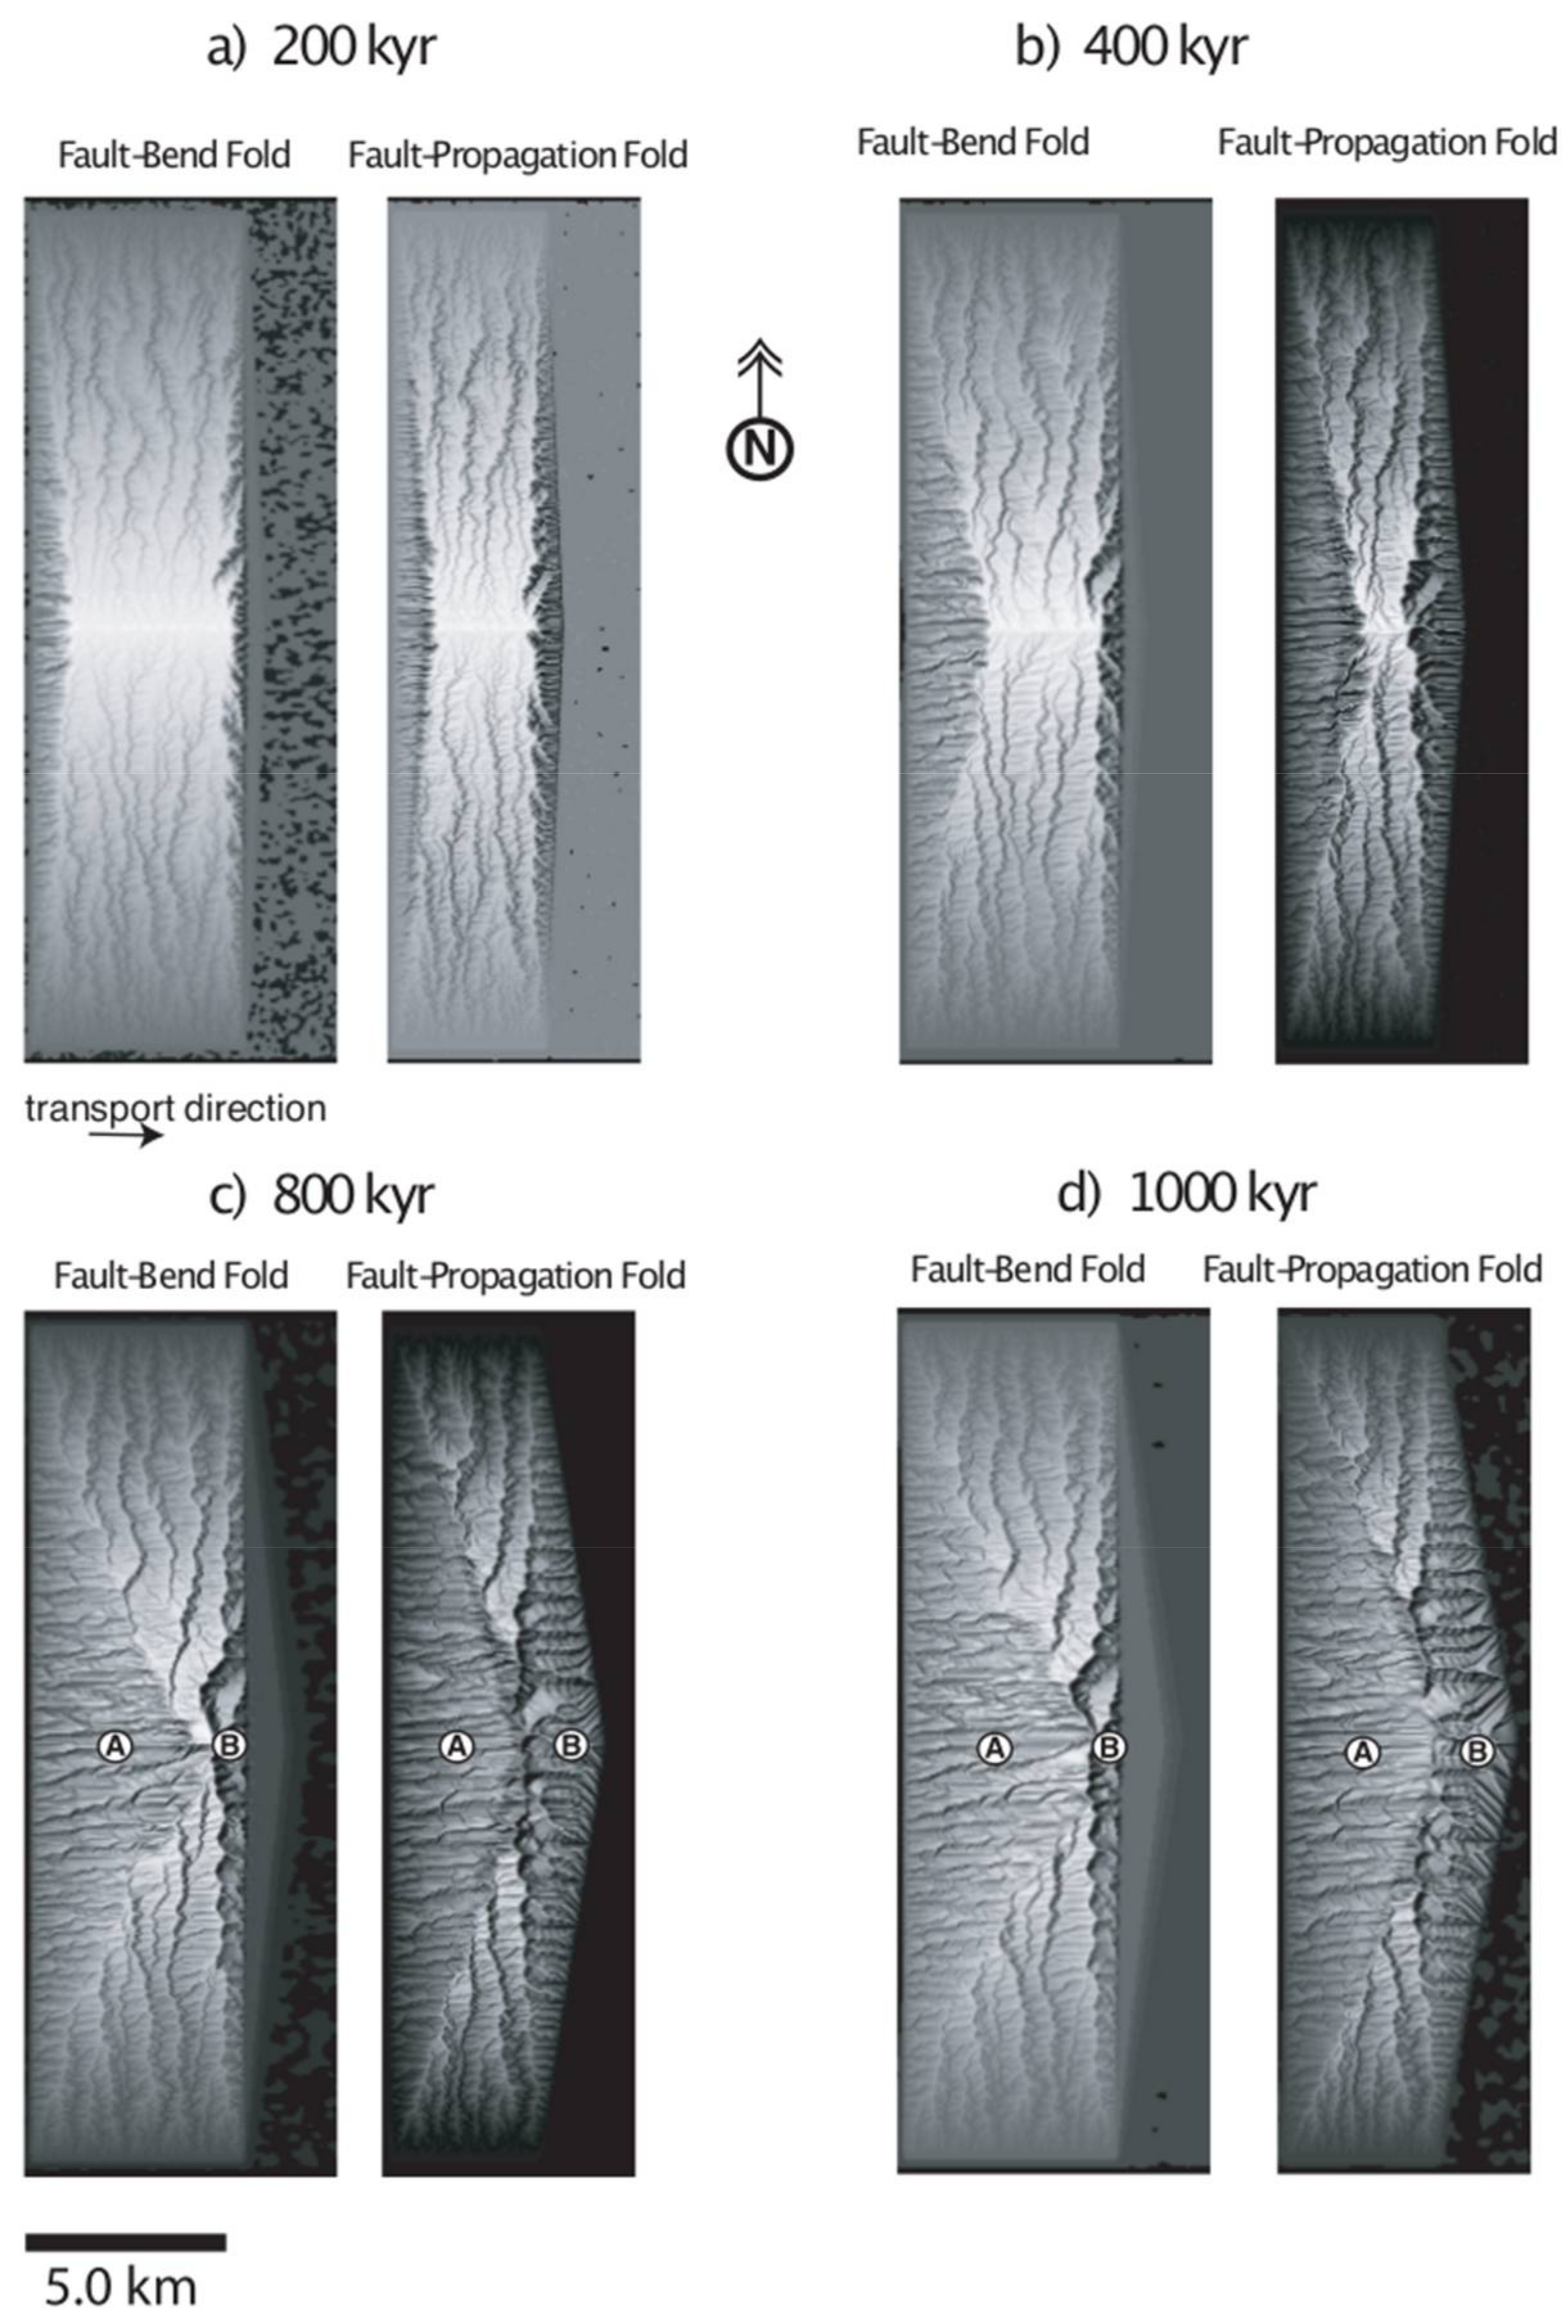
Figure 11.
Evolution of the fault-propagation and fault-bend fold models under conditions of lateral propagation, power law D/L relation, and constant slip distribution. (a) 200 kyr, (b) 400 kyr, (c) 800 kyr and (d) 1000 kyr. Greyscale shaded relief images with illumination from NW, azimuth is 30 degrees. A and B are drainage basins discussed in text.

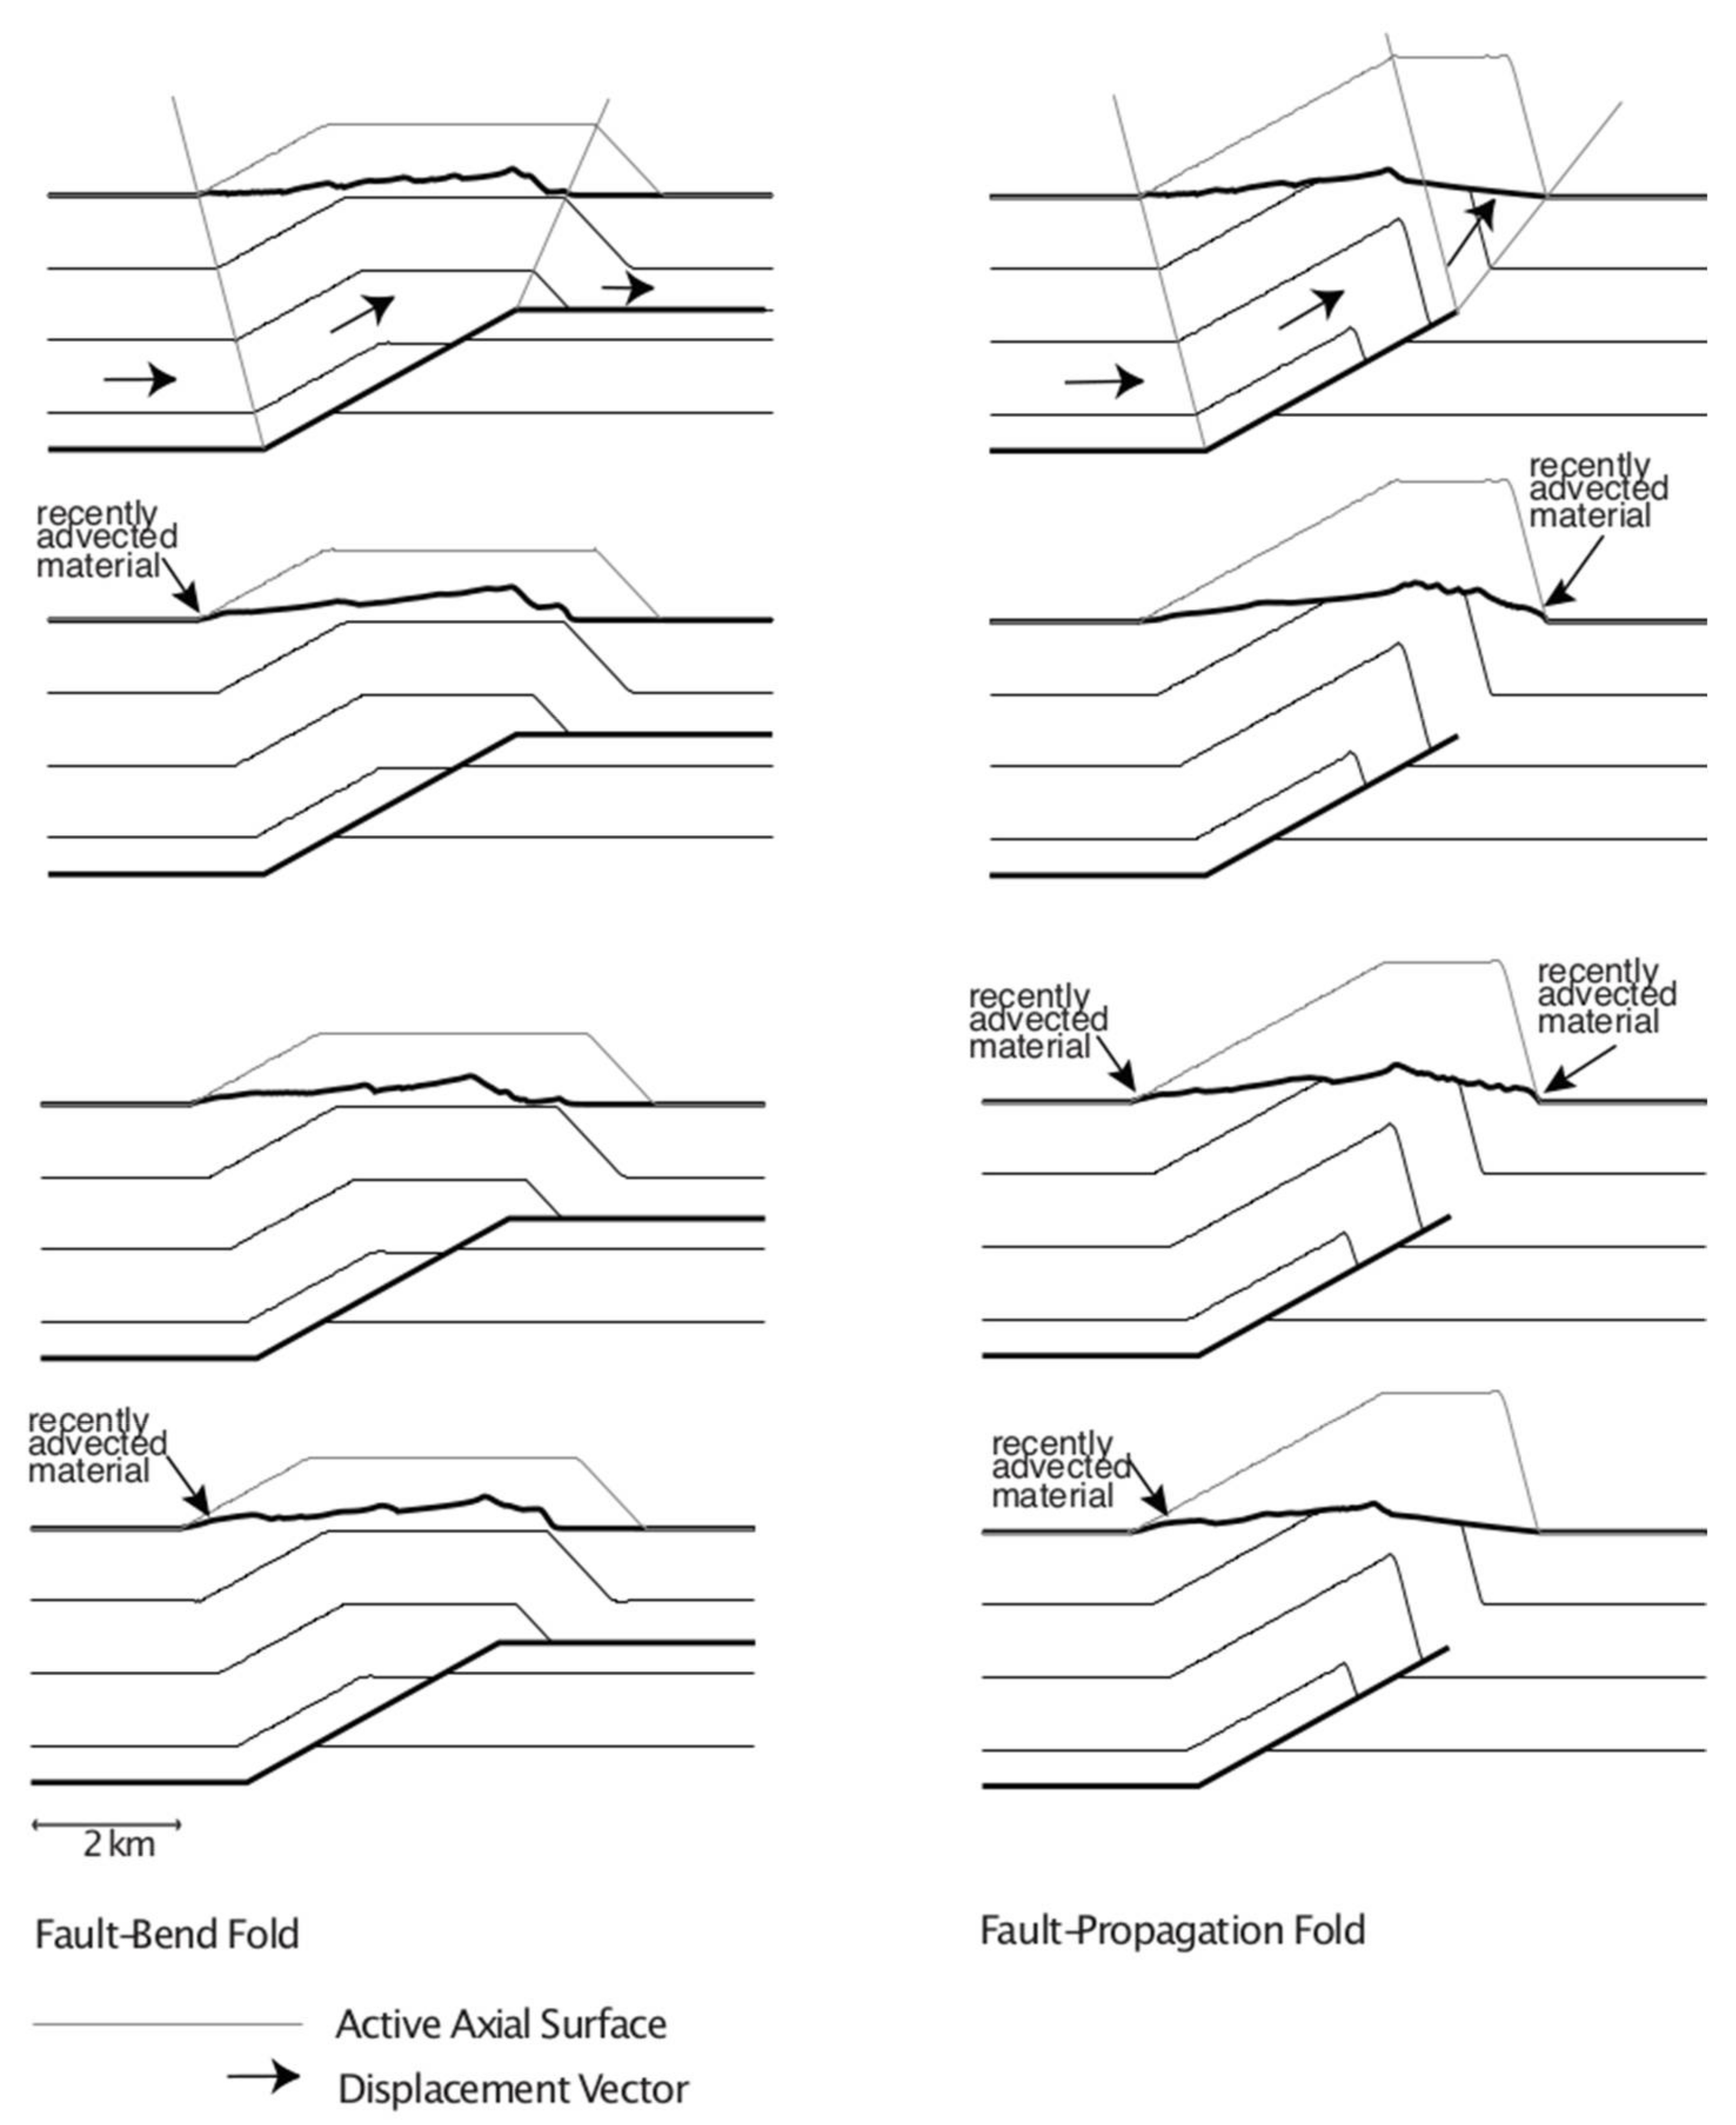
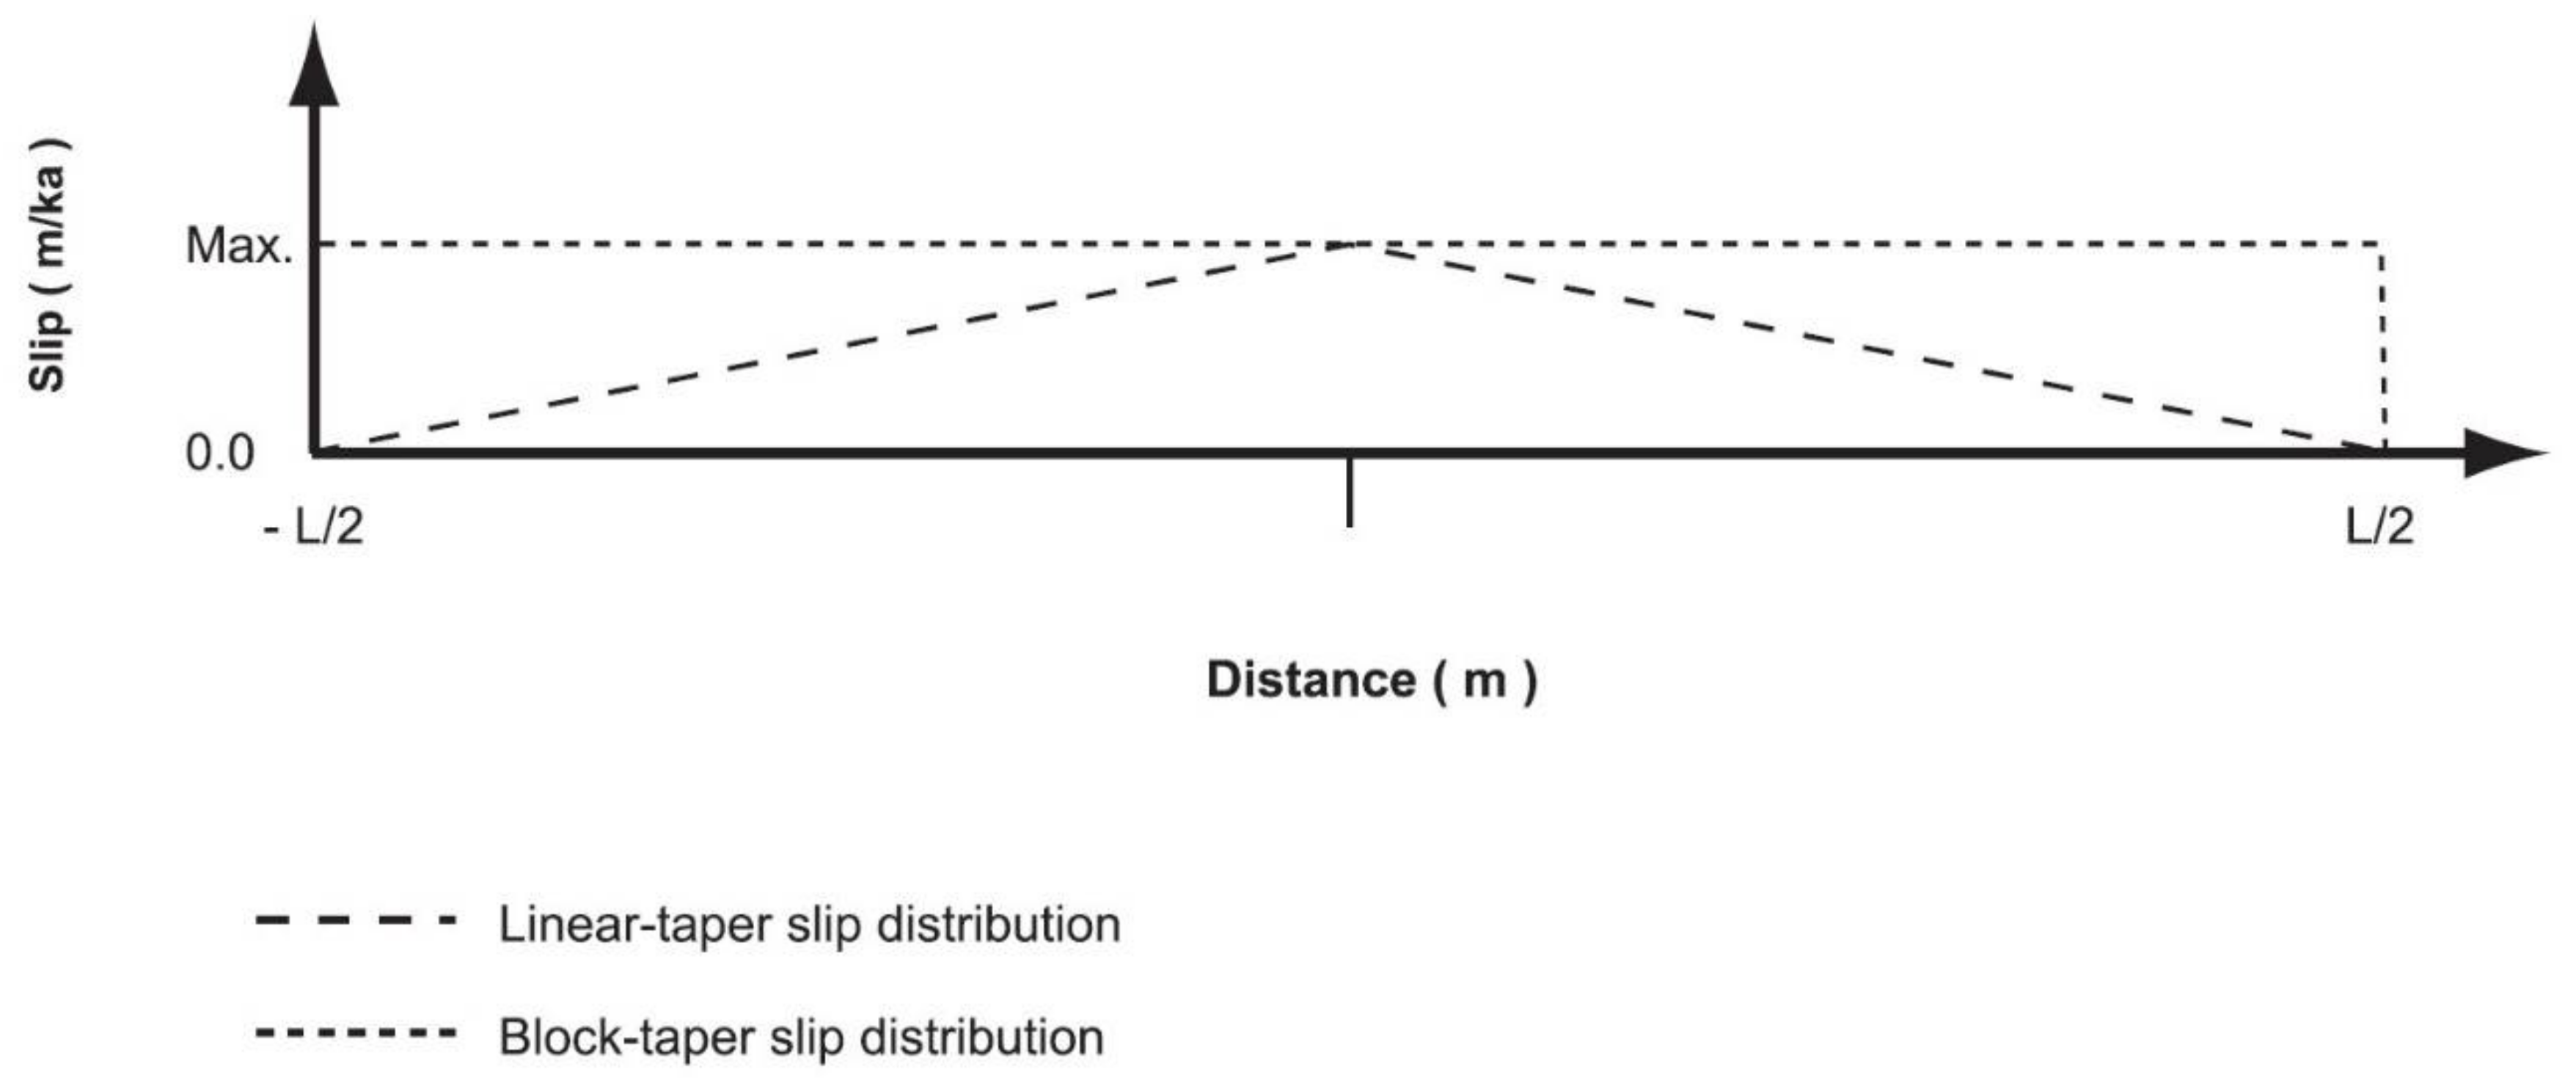
© 2018 by the authors. Licensee MDPI, Basel, Switzerland. This article is an open access article distributed under the terms and conditions of the Creative Commons Attribution (CC BY) license (http://creativecommons.org/licenses/by/4.0/).
Share and Cite
MDPI and ACS Style
Bernal, A.; Hardy, S.; Gawthorpe, R.L. Three-Dimensional Growth of Flexural Slip Fault-Bend and Fault-Propagation Folds and Their Geomorphic Expression. Geosciences 2018, 8, 110. https://doi.org/10.3390/geosciences8040110
AMA Style
Bernal A, Hardy S, Gawthorpe RL. Three-Dimensional Growth of Flexural Slip Fault-Bend and Fault-Propagation Folds and Their Geomorphic Expression. Geosciences. 2018; 8(4):110. https://doi.org/10.3390/geosciences8040110
Chicago/Turabian StyleBernal, Asdrúbal, Stuart Hardy, and Robert L. Gawthorpe. 2018. "Three-Dimensional Growth of Flexural Slip Fault-Bend and Fault-Propagation Folds and Their Geomorphic Expression" Geosciences 8, no. 4: 110. https://doi.org/10.3390/geosciences8040110
Note that from the first issue of 2016, this journal uses article numbers instead of page numbers. See further details here.