Fatalities Caused by Hydrometeorological Disasters in Texas


Department of Civil and Environmental Engineering, University of Texas at San Antonio, San Antonio, TX 78249, USA
*
Author to whom correspondence should be addressed.
Geosciences 2018, 8(5), 186; https://doi.org/10.3390/geosciences8050186
Submission received: 20 April 2018
/
Revised: 6 May 2018
/
Accepted: 15 May 2018
/
Published: 18 May 2018
(This article belongs to the Special Issue Hydrological Hazard: Analysis and Prevention)
Abstract
:Texas ranks first in the U.S in number of fatalities due to natural disasters. Based on data culled from the National Oceanic and Atmospheric Administration (NOAA) from 1959 to 2016, the number of hydrometeorological fatalities in Texas have increased over the 58-year study period, but the per capita fatalities have significantly decreased. Spatial review found that non-coastal flooding is the predominant hydrometeorological disaster in a majority of the Texas counties located in “Flash Flood Alley” and accounts for 43% of all hydrometeorological fatalities in the state. Flooding fatalities occur most frequently on “Transportation Routes” followed by heat fatalities in “Permanent Residences”. Seasonal and monthly stratification identifies Spring and Summer as the deadliest seasons, with the month of May registering the highest number of total fatalities dominated by flooding and tornado fatalities. Demographic trends of hydrometeorological disaster fatalities indicated that approximately twice as many male fatalities occurred from 1959-2016 than female fatalities, but with decreasing gender disparity over time. Adults are the highest fatality risk group overall, children are most at risk to die in flooding, and the elderly at greatest risk of heat-related death.
1. Introduction
Hydrometeorological disasters can result in tremendous damage to infrastructure, significant loss to the economy, and, very often, loss of life. In terms of the human loss, natural disasters resulted in approximately 1.7 million fatalities between 1980 and 2016. More than 49% of these fatalities were due to geophysical events (earthquake, tsunami, volcanic activity), 26% were due to meteorological events (tropical storm, extratropical storm, convective storm, local storm), 14% were due to hydrological events (flood, landslides), and 11% were due to climatological events (extreme temperature, drought, forest fire). Slightly less than 80% of the 16,500 disaster events that caused fatalities were hydrological or meteorological (39%) [1].
Although more research is beginning to shift to multi-hazard analysis [2,3], much of the available natural disaster research focuses on a particular type of disaster (e.g., floods, hurricanes, lightning, earthquakes) or disaster event (e.g., Hurricane Harvey, Northridge Earthquake). The focus on key disaster events is advantageous in that a deeper dive can benefit the preparation and mitigation strategies in the affected areas. Flooding is an exemplary disaster type that is responsible for high fatality rates and has been extensively investigated on a global [4,5,6,7] and national scale including the U.S. [8], India [9], Pakistan [10], and Australia [11]. It is also of value to focus at the regional level or the effects of one type of hazard to provide a basis for better allocation of resources to prepare for high risk hydrometeorological disasters with high probability of impact to a specific region.
This study analyzes fatality rates resulting from multiple hydrometeorological disasters that affect the state of Texas at the county level. Texas has a long history of devastation by natural disaster (especially hydrometeorological disasters). The most lethal natural disaster in United States history occurred in Galveston Island, Texas in 1900 in which an estimated 6000–12,000 people died as a result of the “Great Galveston Hurricane”. From January 1960 to December 2016, Texas had the highest number of fatalities in the nation in which natural disasters killed an average of 40 people per year [12]. During this period, Texas accounted for 7.4% of all U.S. fatalities (32,289). Flood, heat, and tornado accounted for 60% of all fatalities in Texas during this period. Texas also ranks highest in fatalities per capita (15 fatalities per 100,000 people). During this period two Texas counties ranked in the top ten across all states for the occurrence of disaster events: Harris County (1088 events) and Tarrant County (1009 events). Dallas County, Texas, ranked eighth in the number of fatalities in the U.S. Extensive research has been conducted to investigate the quantitative and qualitative aspect of flooding in the state of Texas [12,13].
Hurricanes are also a critical hydrometeorological disaster that claim many lives in Texas. In 2005, Hurricane Katrina struck the Louisiana coast causing $96 billion in damages and 1833 fatalities. Two-thirds of the fatalities were directly related to more than fifty breaches of the levee and floodwall systems [14]. Most recently in August 2017, Hurricane Harvey made the landfall near Port Aransas on the Gulf Coast as a category-4 storm with wind gusts up to 212 kph (132 mph) and resulted in $200 billion in damages and 103 confirmed deaths in Texas, primarily due to flooding across 11 counties. Thirty-six of the total 68 direct fatalities caused by the hurricane winds and flooding occurred in Harris County (Houston Metropolitan area) [15].
Tornadoes were responsible for 14% of the total number of natural disaster-related fatalities in the U.S. from 1960 to 2015 [16]. Texas leads the nation in the average number of tornadoes between 1991 and 2010 with 155 tornadoes per year followed by Kansas (96), Florida (66) and Oklahoma (62) [17]. Analysis of tornado-induced fatalities and damage in the U.S. between 1880 and 2005 in 2007 identified 1812 tornado-related fatalities caused by 366 fatal tornado events mostly along the northeastern border of the state [18]. The normalized fatality rate per tornado event in Texas is in line with the national normalized averages (2.7 fatalities and 0.54 events).
The impact of disastrous extreme weather to society is a function of both the climatic and local setting. For example, although both the fatality rate and the extent of damage to infrastructure have increasing trends from the 1960′s to the present, some studies suggest that population growth and demographic shifts play a greater role in the degree of increase than the increase in intensity and/or frequency of the extreme weather that the Earth has been experiencing in the last several decades [19]. This would suggest that even without any detrimental climate changes, the shifts in U.S. economic development patterns and growth will result in ever increasing losses caused by hydrometeorological disasters. Therefore, it is necessary to recognize spatial and temporal trends of natural disasters to allow for the allocation of resources to the higher risk disasters and their locations.
Supplemental to the intensity of such hazards is the exposure of people in the affected areas. In the last several decades, the U.S. has experienced steady increases in population shifts in rural and coastal development patterns, and economic growth, which have positioned more people in disaster-prone areas [20]. Research on the October 2015 flood event in Columbia, SC, indicated that considerations for public safety were sometimes secondary to profitable land development [21]. Hurricane research that was published in 2018 analyzed the decision biases of persons affected by hurricanes and found that temporal band spatial myopia is a major issue that places a lower priority on long-term decisions (e.g., preparation) than short term routine tasks with the failed intention of addressing the long term need when the disaster event is closer in time [22].
The purpose of this paper is to analyze the fatality rates caused by hydrometeorological disasters in Texas for the period 1959–2016 in an effort to identify counties and metropolitan areas in Texas that have a greater risk for particular hydrometeorological disasters. The hydrometeorological disasters were categorized into “Flooding”, “Heat”, “Cold Weather”, “Tornado”, “Lightning”, and “Wind Events”. Fatalities due to “Tropical Events” (hurricanes and tropical storms) were either classified as flooding or wind events depending on the cause of fatality. The study examines temporal trends, spatial variations, and demographic characteristics of the victims. The paper concludes with a discussion and commentary of considerations that may influence the fatality rate with the goal of providing information and perspectives that would help reduce hydrometeorological disaster fatalities.
2. Materials and Method
2.1. Study Area
Texas is the second largest state in the U.S., both in terms of population and area, with a population of 27,862,596 and a land area of 695,662 km2. The southeast of Texas shares 591 km (367 miles) of coastline with the Gulf of Mexico and is susceptible to hurricanes and coastal flooding. A major topographical feature that affects the number of hydrometeorological disasters in Texas is the Balcones Escarpment that consists of a series of cliffs dropping from the Edwards Plateau to the Balcones Fault Line. As noted in an article from the Texas Hill Country magazine published in 2016, “This outer rim of the Hill Country is the formation point for many large thunderstorms, which frequently stall along the uplift and then hover over this region” [23]. The “Flash Flood Alley” includes counties having the fastest population growth rates in Texas.
2.2. Data Source
The Texas hydrometeorological disaster fatality information reviewed in this study was culled from the National Oceanic and Atmospheric Administration (NOAA) Storm Data reports for the period January 1959 through December 2016 [24]. From 1959–1995, the data were only available via PDF files. Disaster data from 1996–2016 were available via the NOAA searchable database. The data in the Storm Data Publication relies on self-reporting from individual states and counties and is dependent upon the verification and validation of the reporting agency. The Storm Data had some inconsistencies from year to year and county to county in the classification of the causes of fatalities. For example, deaths by lightning are classified as either electrical deaths or lightning deaths. Similarly, wild fires or prairie fires are listed under either wind events or wildfire events in the database. Heat-related deaths from the homeless or illegal immigrants in rural counties also have a potential to be under-reported since the location of the victims may remain undetected. As an example of a potential under-reporting condition, the Storm Data indicates that before 2008 there were no deaths due to heat exposure discovered along the border of Texas and Mexico. This is unlikely given that the U.S. Customs and Border Protection indicate that 7216 people have died from exposure attempting to cross the U.S./Mexico border between 1998 and 2017 [25]. In 2005 alone, more than 500 people died attempting to across the U.S./Mexico border [26]. Fatality information was also reviewed from the Hazards Vulnerability Research Institute (HVRI), U.S Hazard Losses Summary Report (1960–2015), to provide perspective for large scale comparisons of trends between Texas and the national fatality rate [16]. The HVRI data was not used in the numerical analysis of spatial and temporal trends forming the basis of this paper.
2.3. Methodology
Differences in the terminology exists across varying literature sources as it pertains to the effects of natural hazards and disasters on people and the land. This study defines a hazard as a natural event that has the potential to cause harm and a disaster as the effect of the hazard on humanity. Hydrometeorological disasters are defined as “natural processes or phenomena of atmospheric, hydrological or oceanographic nature” [27]. The Texas fatality data used in this study were all caused by hydrometeorological disasters. If the disaster did not result in at least one fatality it was not included. The fatalities also did not have to result from a disaster that was classified through a formal disaster declaration. The definitions of the descriptors and disaster types used in this study for the database files (1996 onward) and the manually aggregated fatality data prior to 1996 are in agreement with the NWS Directive 10-1605 [28].
Only fatalities that were classified as being directly caused by the incident are included in the study. Storm Data lists each incident with the date, time, the number of people who died in the incident, the number of people injured, and a brief description of the event. The descriptive narratives provided along with each event were used to get information related to the gender, age, activity, mode of transport, and location of the individual who died. In 1996 and after, the database provided an accompanying chart of the victims. The chart listed the victim’s age, gender, and location. If there was a disparity between the description and the accompanying table, the information in the description was used since the descriptions were often retrieved from the police report that was filed with the death.
The data analysis includes temporal and spatial trending using linear trendlines and correlation analysis to verify statistical significance. Moving 10-year averages were also included to in the temporal distribution to support the linear trending. Spatial analysis by county used the ArcGIS (v.10.4) (Esri, Redlands, CA, USA) to generate thematic maps. Fatality rates were normalized by annual population for temporal trends and by the study period median population for the spatial distribution by county. Percentages were generally rounded to the nearest whole number unless otherwise necessary for comparative analysis.
3. Results
3.1. Types of Hydrometeorological Disasters
The Storm Data reports 55 disaster event types. For purposes of this study the disaster fatalities reported in Texas from 1959 to 2016 were categorized into one of the following nine hydrometeorological disaster types based on the information provided in the incident report or the NOAA database (Table 1). The definitions are consistent with the general classifications of weather disasters as defined by the National Weather Service.
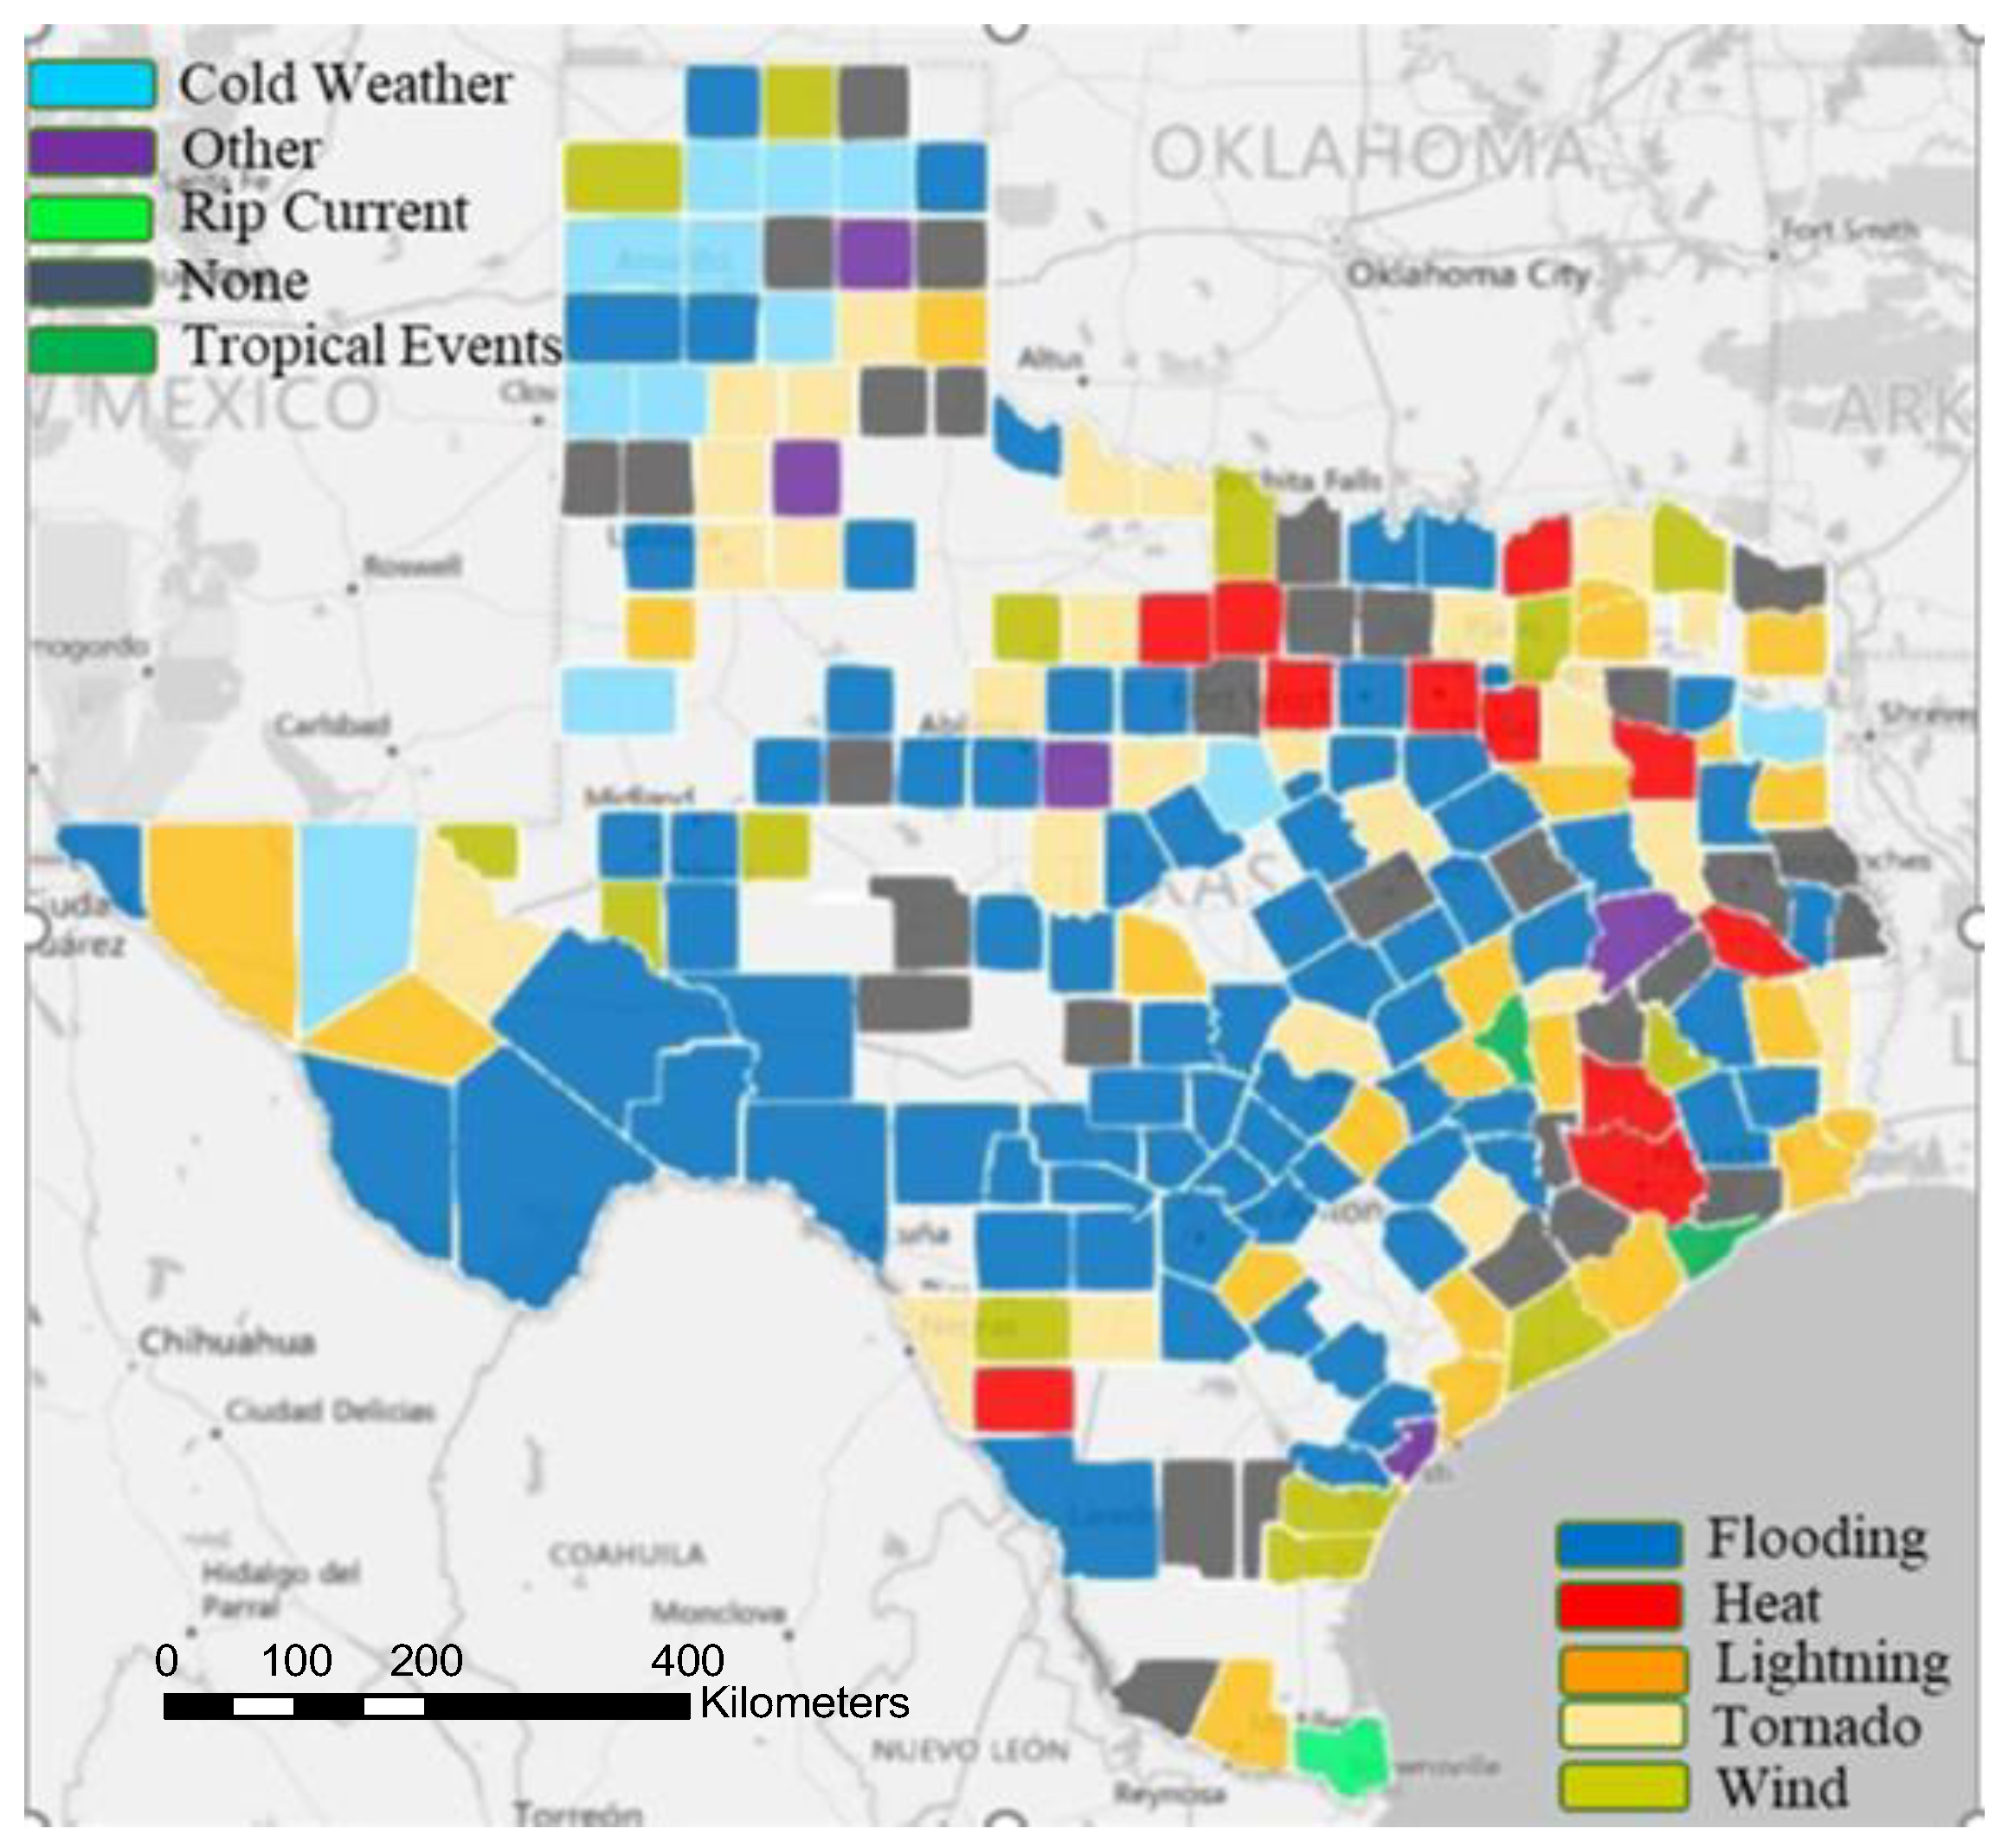
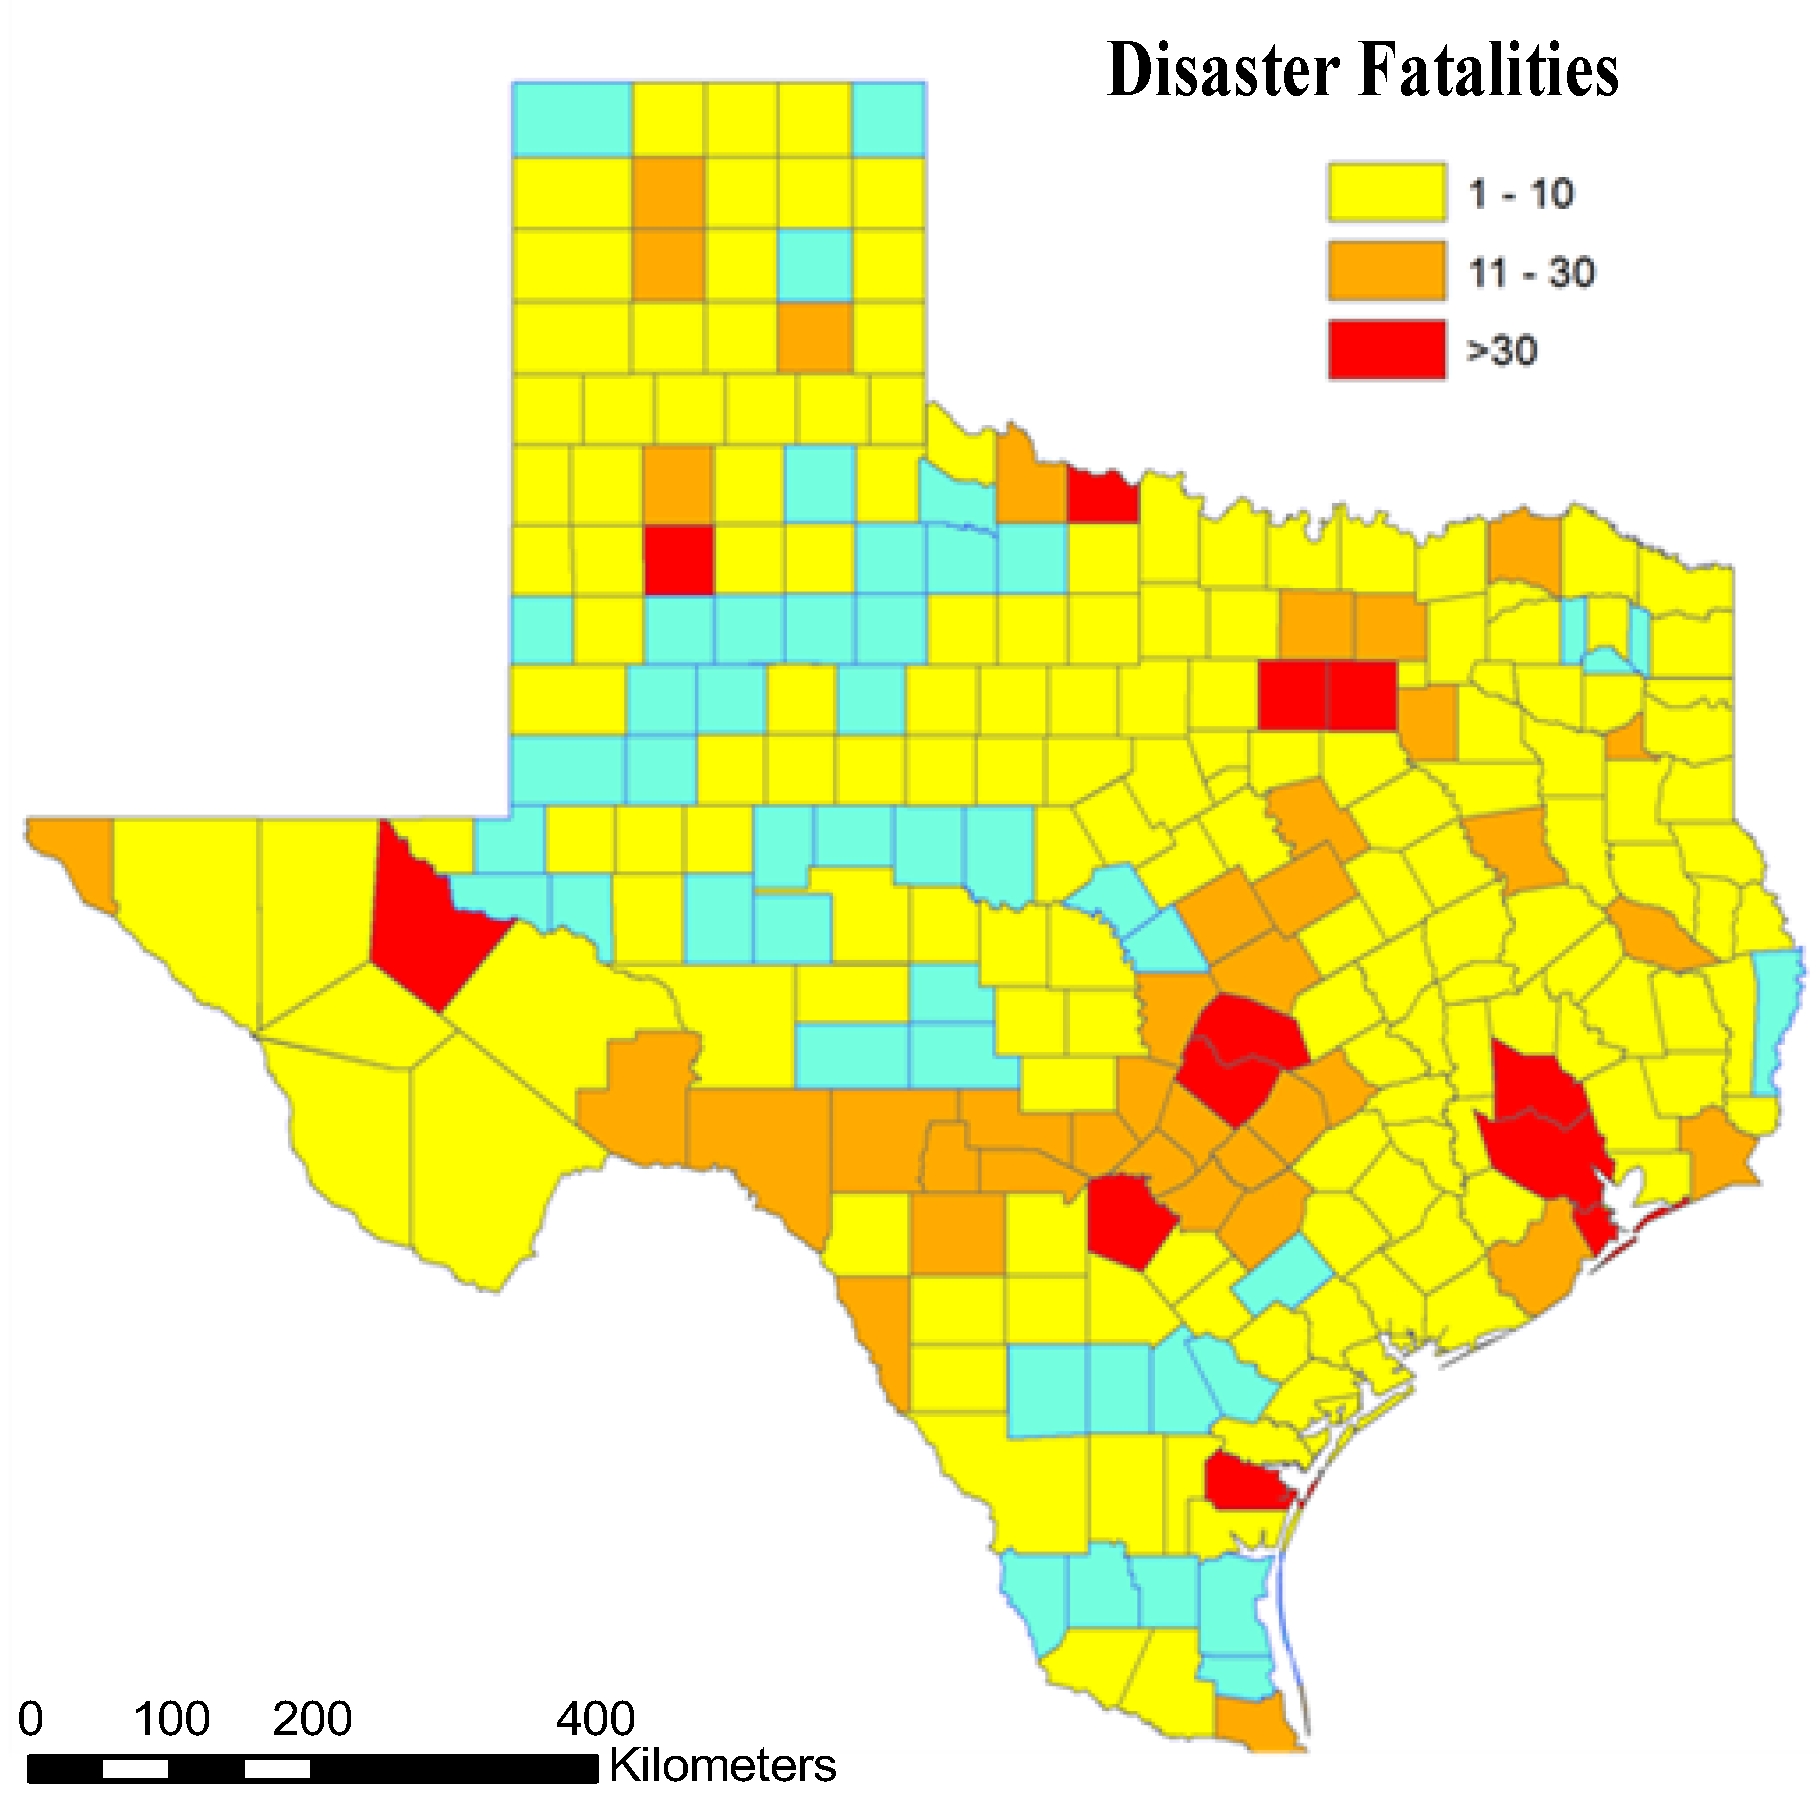
Approximately 80% (205 of the 254) of the counties in Texas reported hydrometeorological fatalities in at least one year during the 58-year study period. Figure 1 shows the primary type of disaster that resulted in fatalities for each Texas county. Seventy-seven of the 205 counties that reported fatalities indicated that flooding was the primary disaster in their county. Thirty-one counties had more than one predominant cause of fatality and so were not categorized as primary disaster.
Counties that reported deaths due to flooding as the predominant hydrometeorological disaster are clustered towards the central region of the state and extend west towards Mexico/New Mexico in the region known as Flash Flood Alley. The disasters that caused the greatest number of fatalities along the Gulf Coast of Texas were wind events and lightning (Figure 1). Heat-related fatality counties were scattered in 11 counties across Texas and 75% of the cold weather fatality counties were in the northwest of Texas (Texas Panhandle) above the 34° N latitude. Fatalities due to tropical events (hurricanes and tropical storms) were all determined to be a result of subsequent flooding and therefore classified as flood-related fatalities. Death due to heat-related events was predominant in Harris County, the most populated county in Texas.
A total of 2330 natural disaster-related fatalities occurred in Texas from 1959 to 2016 with 43% due to flooding (991 fatalities) as shown in Table 2. The second most frequent cause of fatalities was extreme heat (16%) followed by tornados (14%) and lightning (10%). The single most fatal natural disaster event during this 58-year period was the tornado of April 1979 that struck Wichita and Wilbarger counties killing 54 people and injuring 1807. This was an EF-4 (Enhanced Fujita scale) tornado with a maximum width of 2.5 km that killed four people along it’s northeastern track through the states of Oklahoma (3 deaths) and Indiana (1 death). Seventy-nine percent (79%) of the total tropical storm-related fatalities were caused by hurricanes (108 deaths).
3.2. Temporal Distribution
3.2.1. Annual Distribution of Fatalities
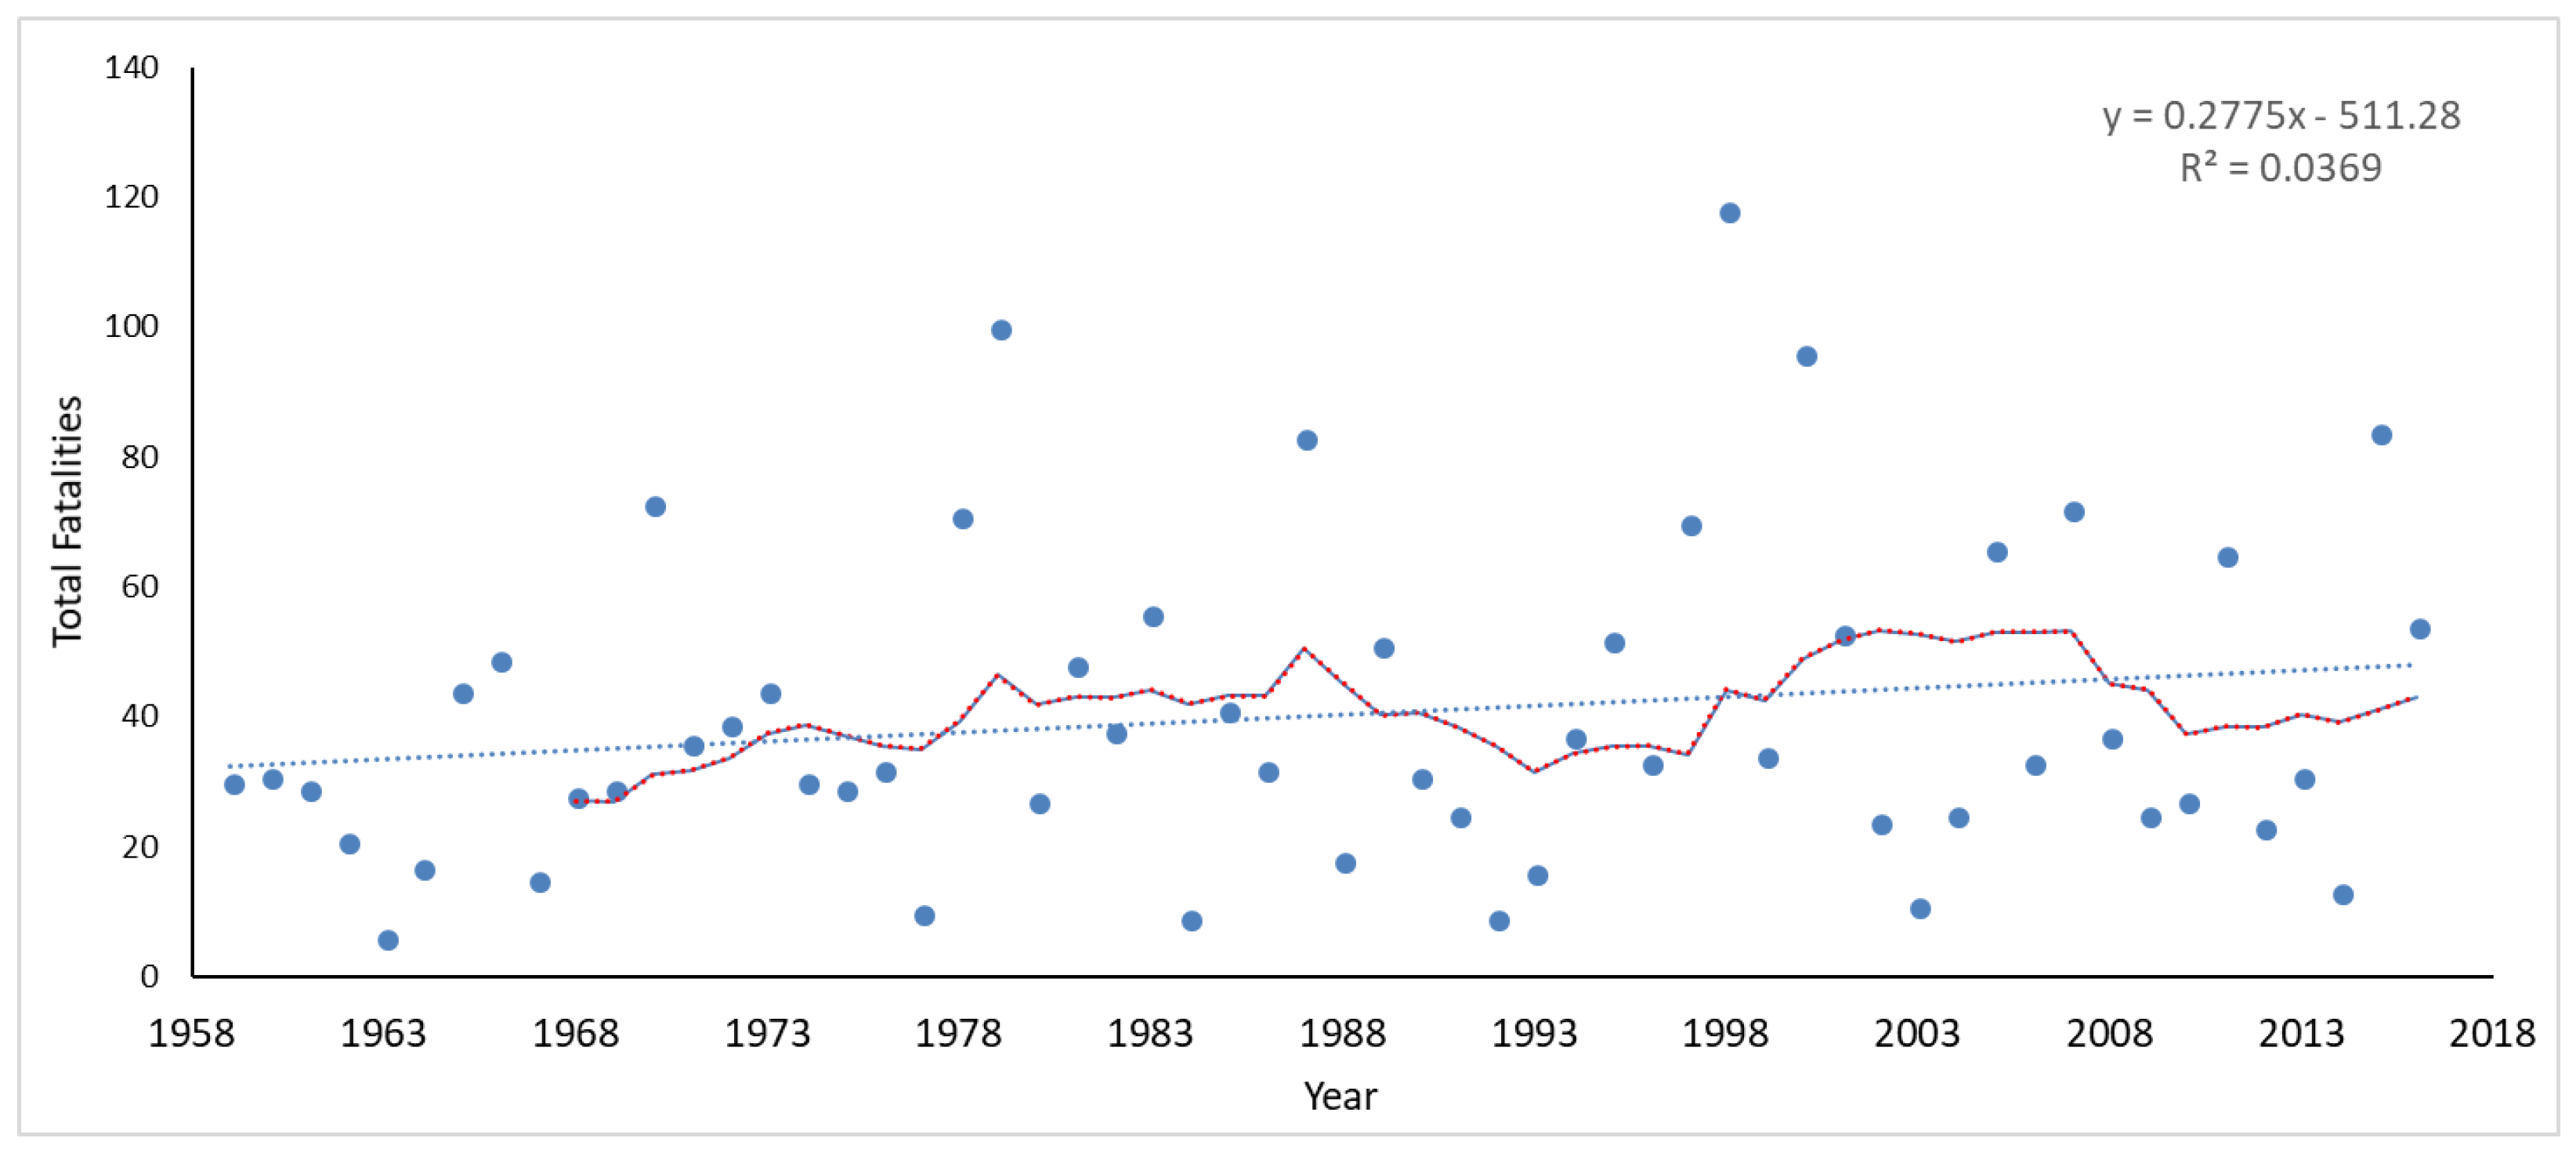
An average of 42 fatalities per year occurred in Texas from 1959 to 2016 with a median of 33 fatalities per year and a total of 2330 hydrometeorological fatalities. The difference between the mean and the median indicates that the annual distribution is positively skewed with long tail in the right direction (towards higher numbers). Although, the raw number of fatalities exhibits a slight increasing trend during the study period, the trend has low linearity (R2 = 0.0369, p = 0.233) and the relationship of fatalities over time is statistically weak (Spearman’s p = 0.16). The lowest number of fatalities (6) occurred in 1963 and the highest number of fatalities (118) occurred in 1998 (Figure 2). Eleven of the 58 years had an annual number of fatalities greater than the 58-year mean plus one standard deviation (40 ± 24).
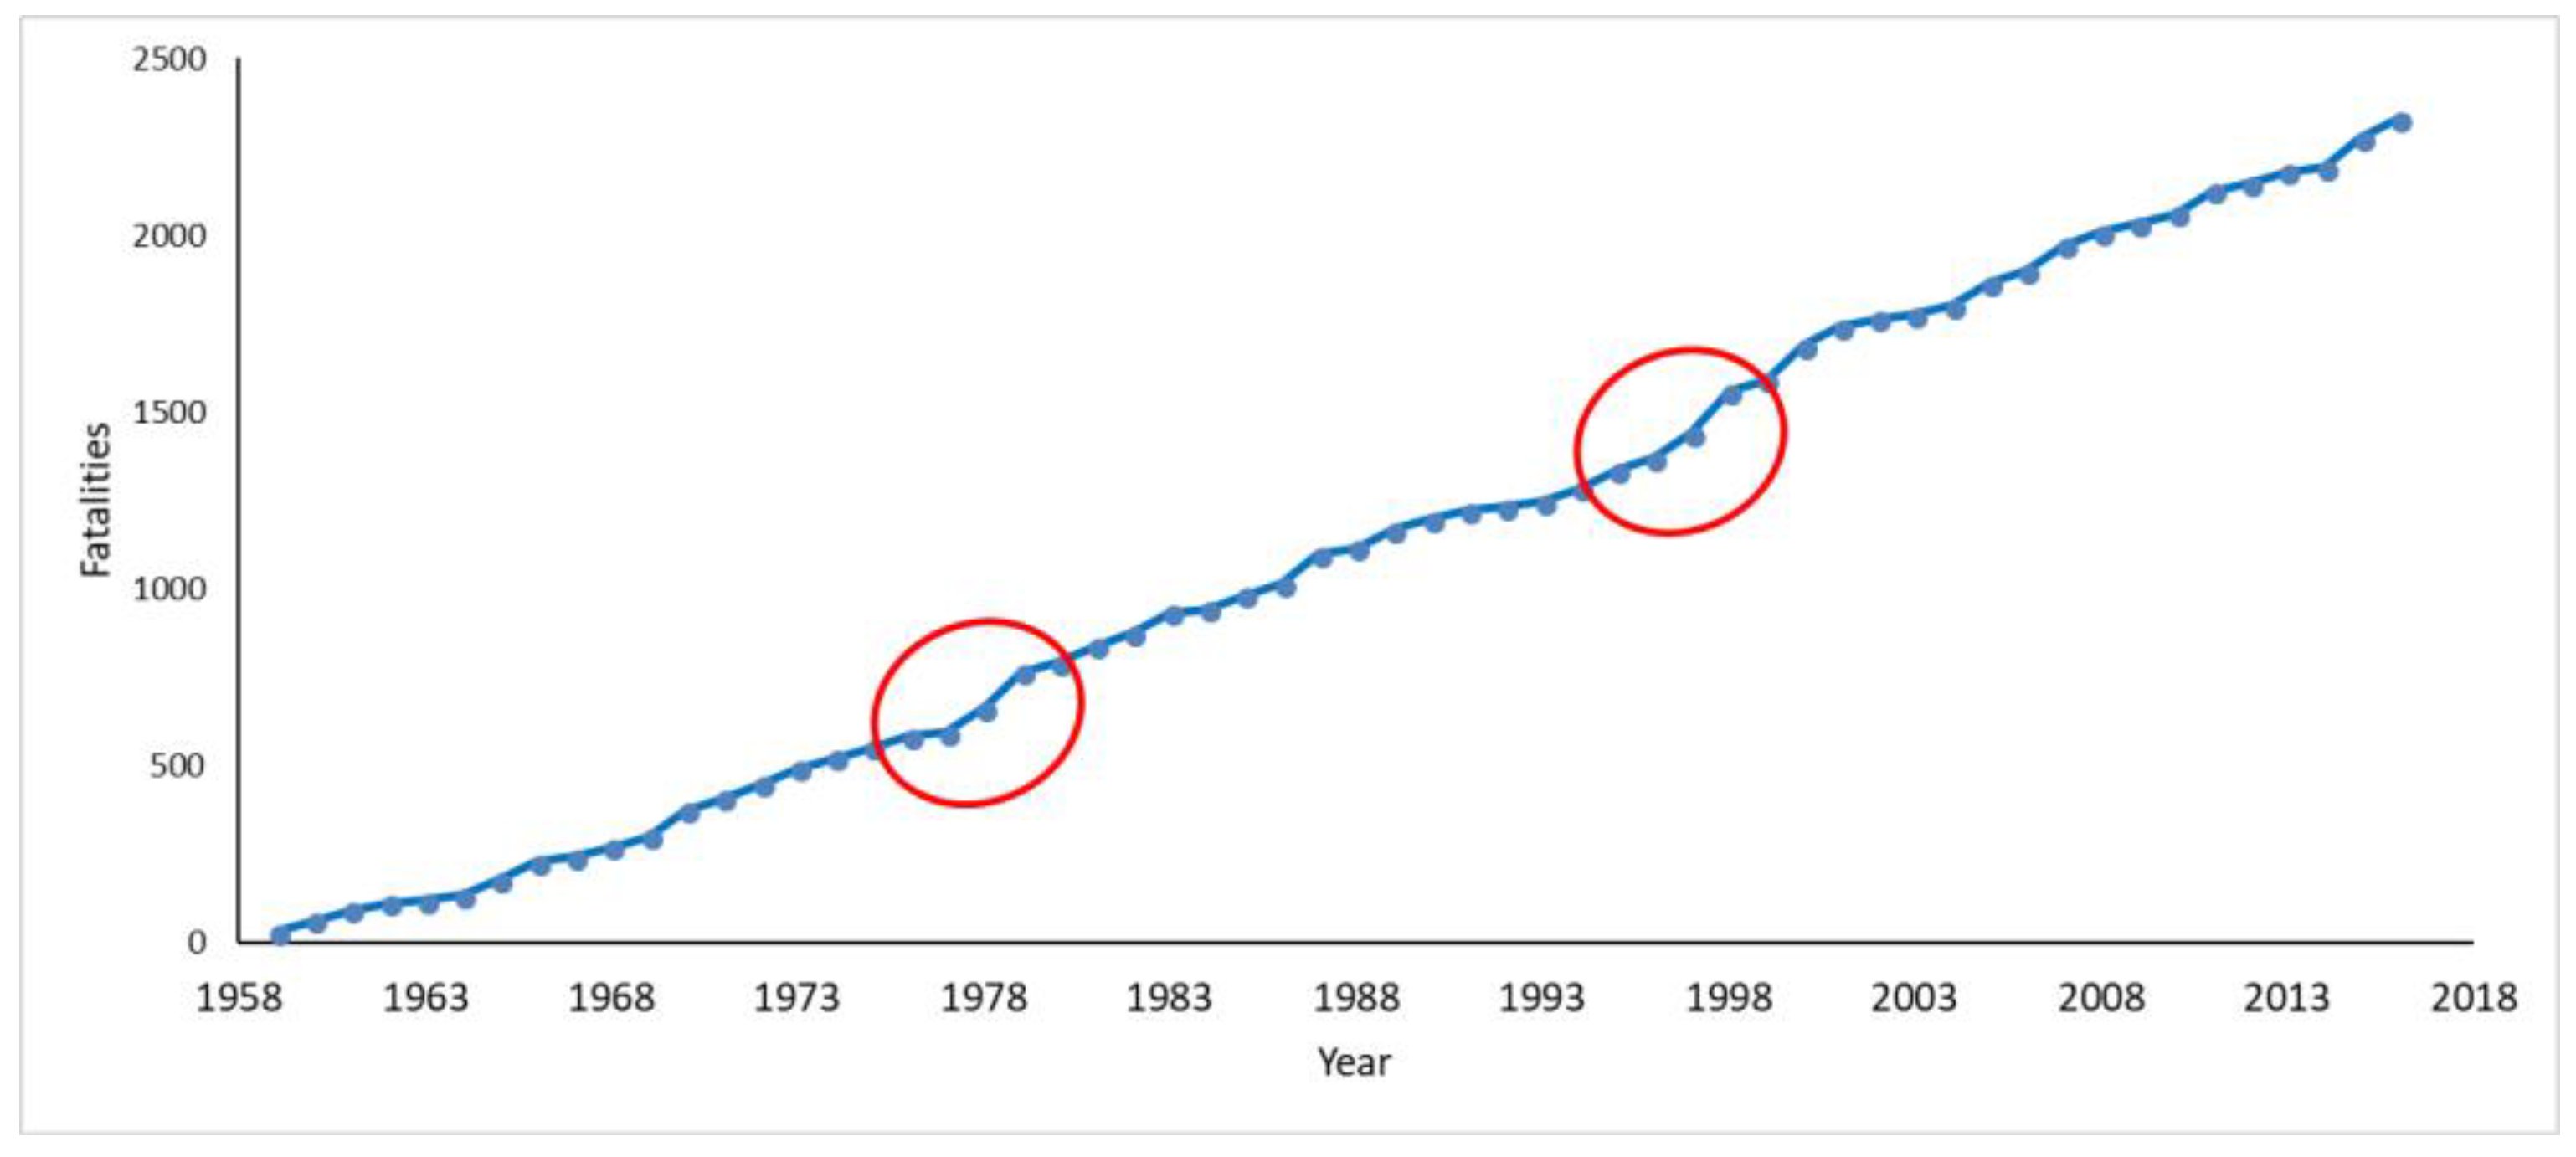
The curve of the cumulative annual fatality rate is relatively uniform with two observable spikes in 1978–1979 and 1998 driven by high fatalities resulting from heat and flooding events (Figure 3). Specifically, in 1978 Dallas County had 21 heat-related fatalities and 40 flooding fatalities that occurred in several counties including Bexar, Kerr, Shackelford, Bandera, and Randall counties. From May 1997 to August 1998 a severe heat event hit the southern region of the U.S. from Florida through Texas and into Colorado. Conversely, several flooding events in November 1998 resulted in fatalities in Bexar, Val Verde, Caldwell, Guadalupe, and Real counties.
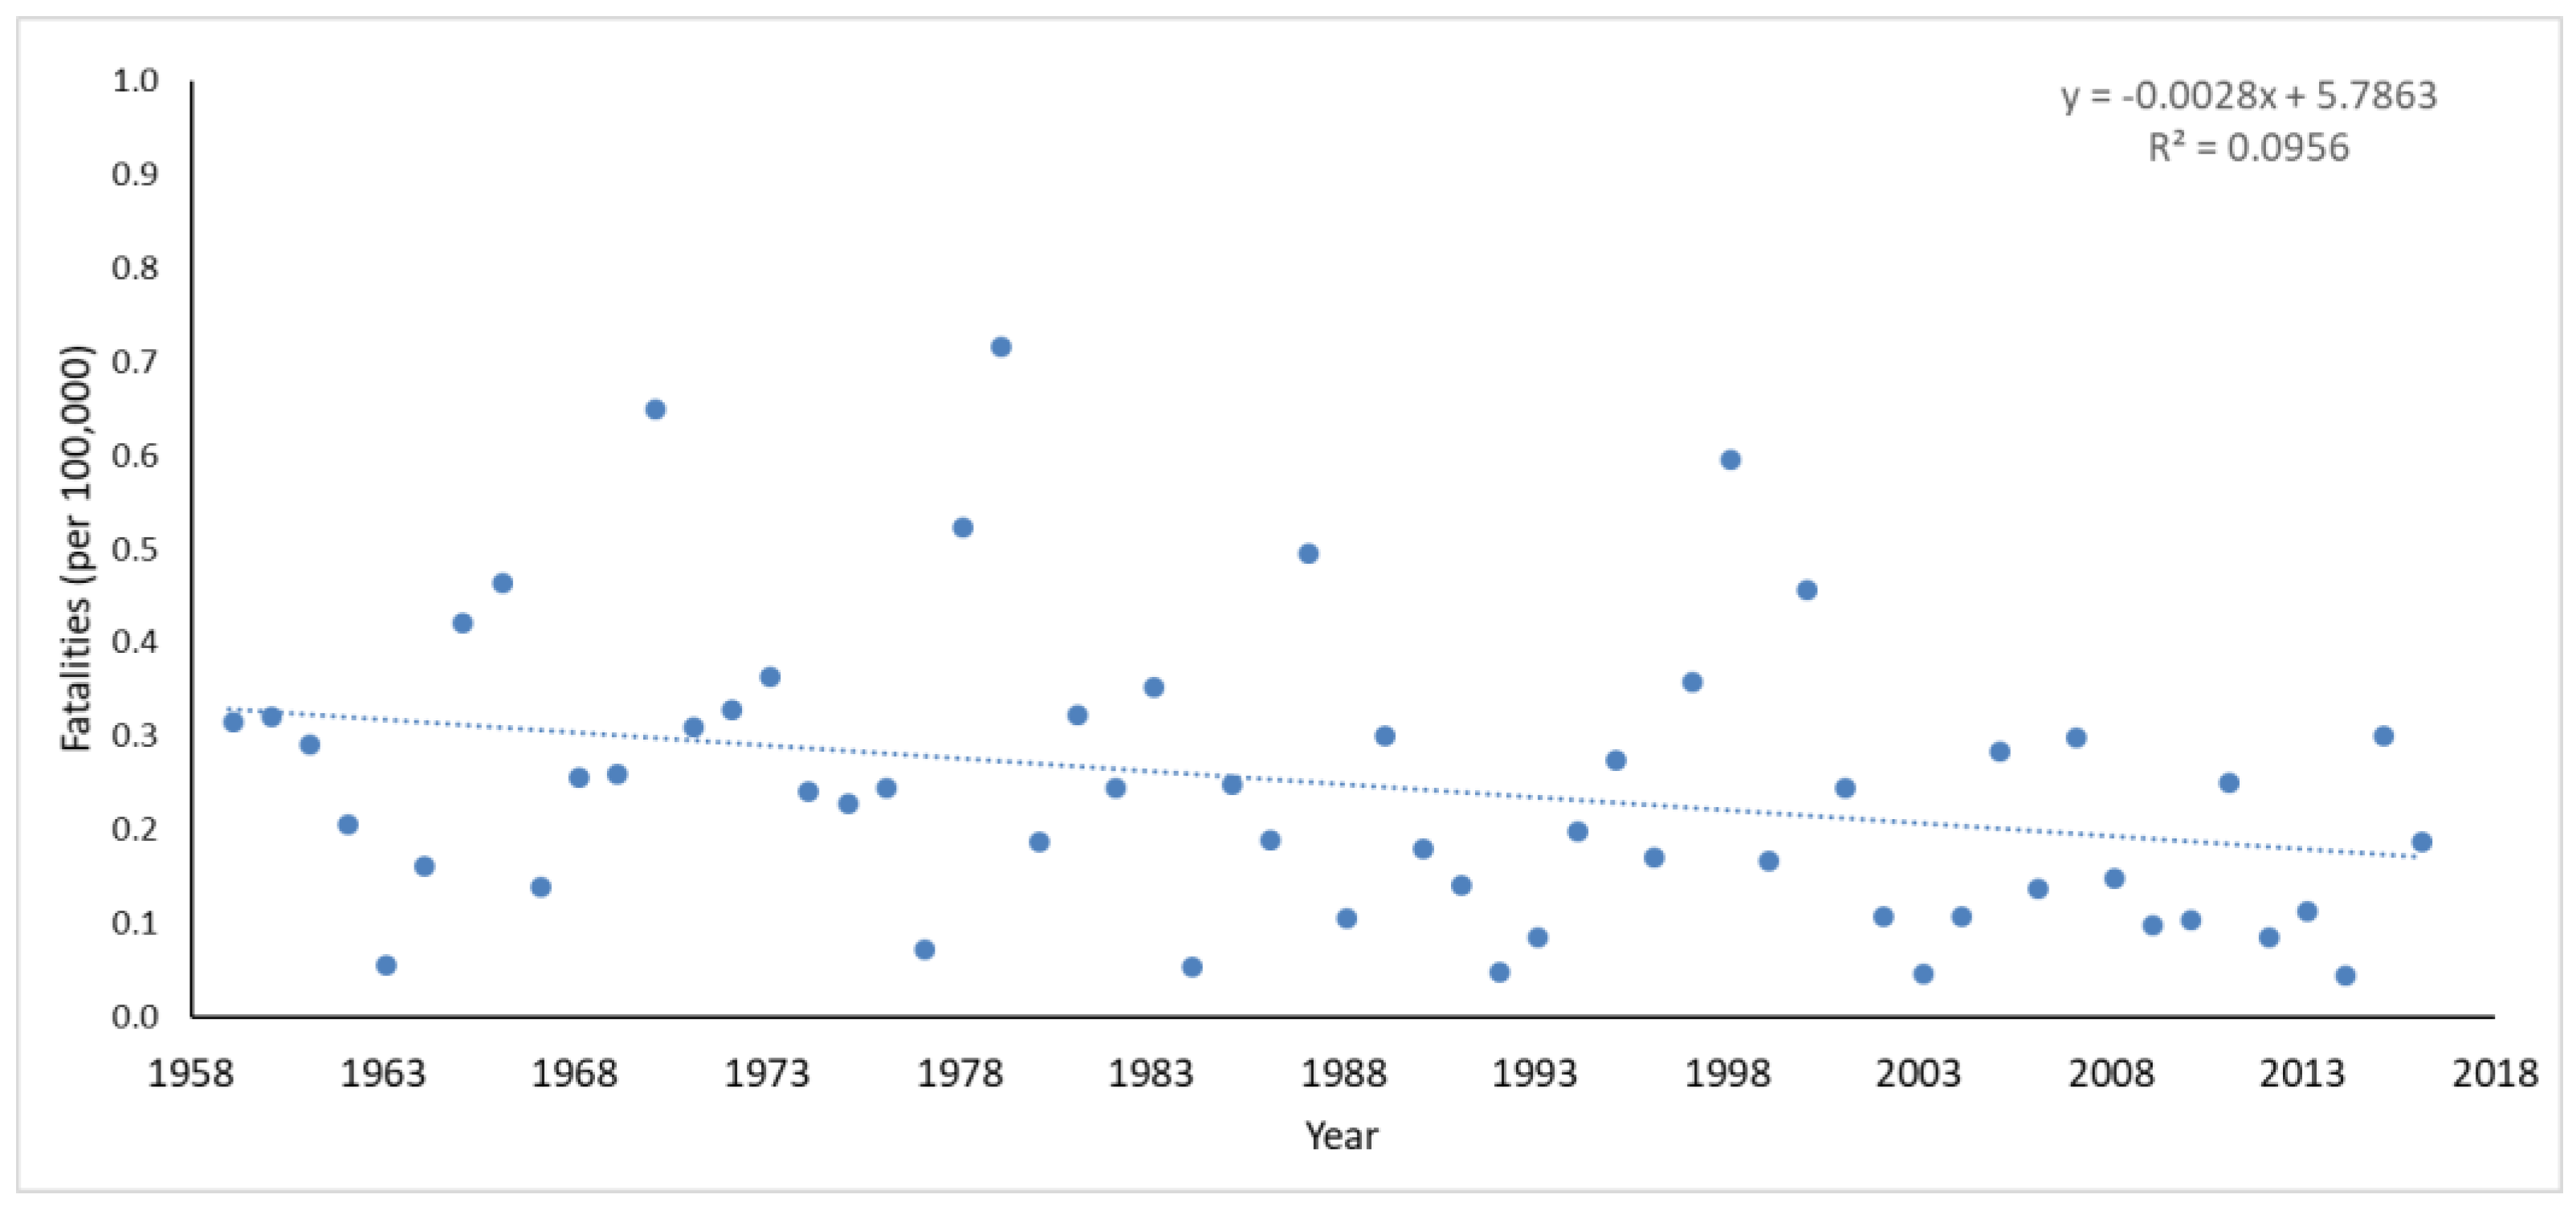
Normalization of the annual fatality rate by population indicates a decreasing trend with slightly better linearity (R2 = 0.096, p = 0.006) than the raw trend and a stronger statistically relationship of fatalities over time (Spearman’s 𝜌 = −0.355) which suggests a gradual decrease in the risk of being killed by hydrometeorological events in Texas over the 58-year study period. The normalized fatality trend can be seen in (Figure 4), which shows the fatality rate due to hydrometeorological disasters per 100,000 Texas residents. Public awareness and educational weather safety campaigns in Texas may have contributed to this reduction of risk [13]. Although the rank order of counties by number of raw fatalities aligns with the highest populated urban centers, these regions are not necessarily the most dangerous. This is evidenced in that several of the counties in immediate proximity to the counties that experienced high fatality have very few fatalities even though the intensity and durations of the disasters were probably very similar between the counties.
For example, Loving County has the highest normalized fatality rate (> 4000 per 100,000) in the state due to its small and stagnant population and the fact that the county experienced several multi-fatality events of wind and hailstorm that struck the Red Bluff Lake area killing four persons by drowning when their boat capsized in the lake during a squall. Similarly, on 11 June 1965, the city of Sanderson in Terrell county was devastated by a flash flood. As noted by the Texas State Historical Association, “A wall of water washed down Sanderson Canyon into Sanderson, destroying numerous homes and businesses. Twenty-six people died in the flood. Eleven flood-control dams were constructed to protect Sanderson against another such catastrophe” [29]. The town had a population of 1500 in 1980 and 1128 in 1990. Reduction of fatality risk in these rural counties will require an increase in awareness through weather-related emergency educational programs and resource assistance (financial and physical) to implement safety systems.
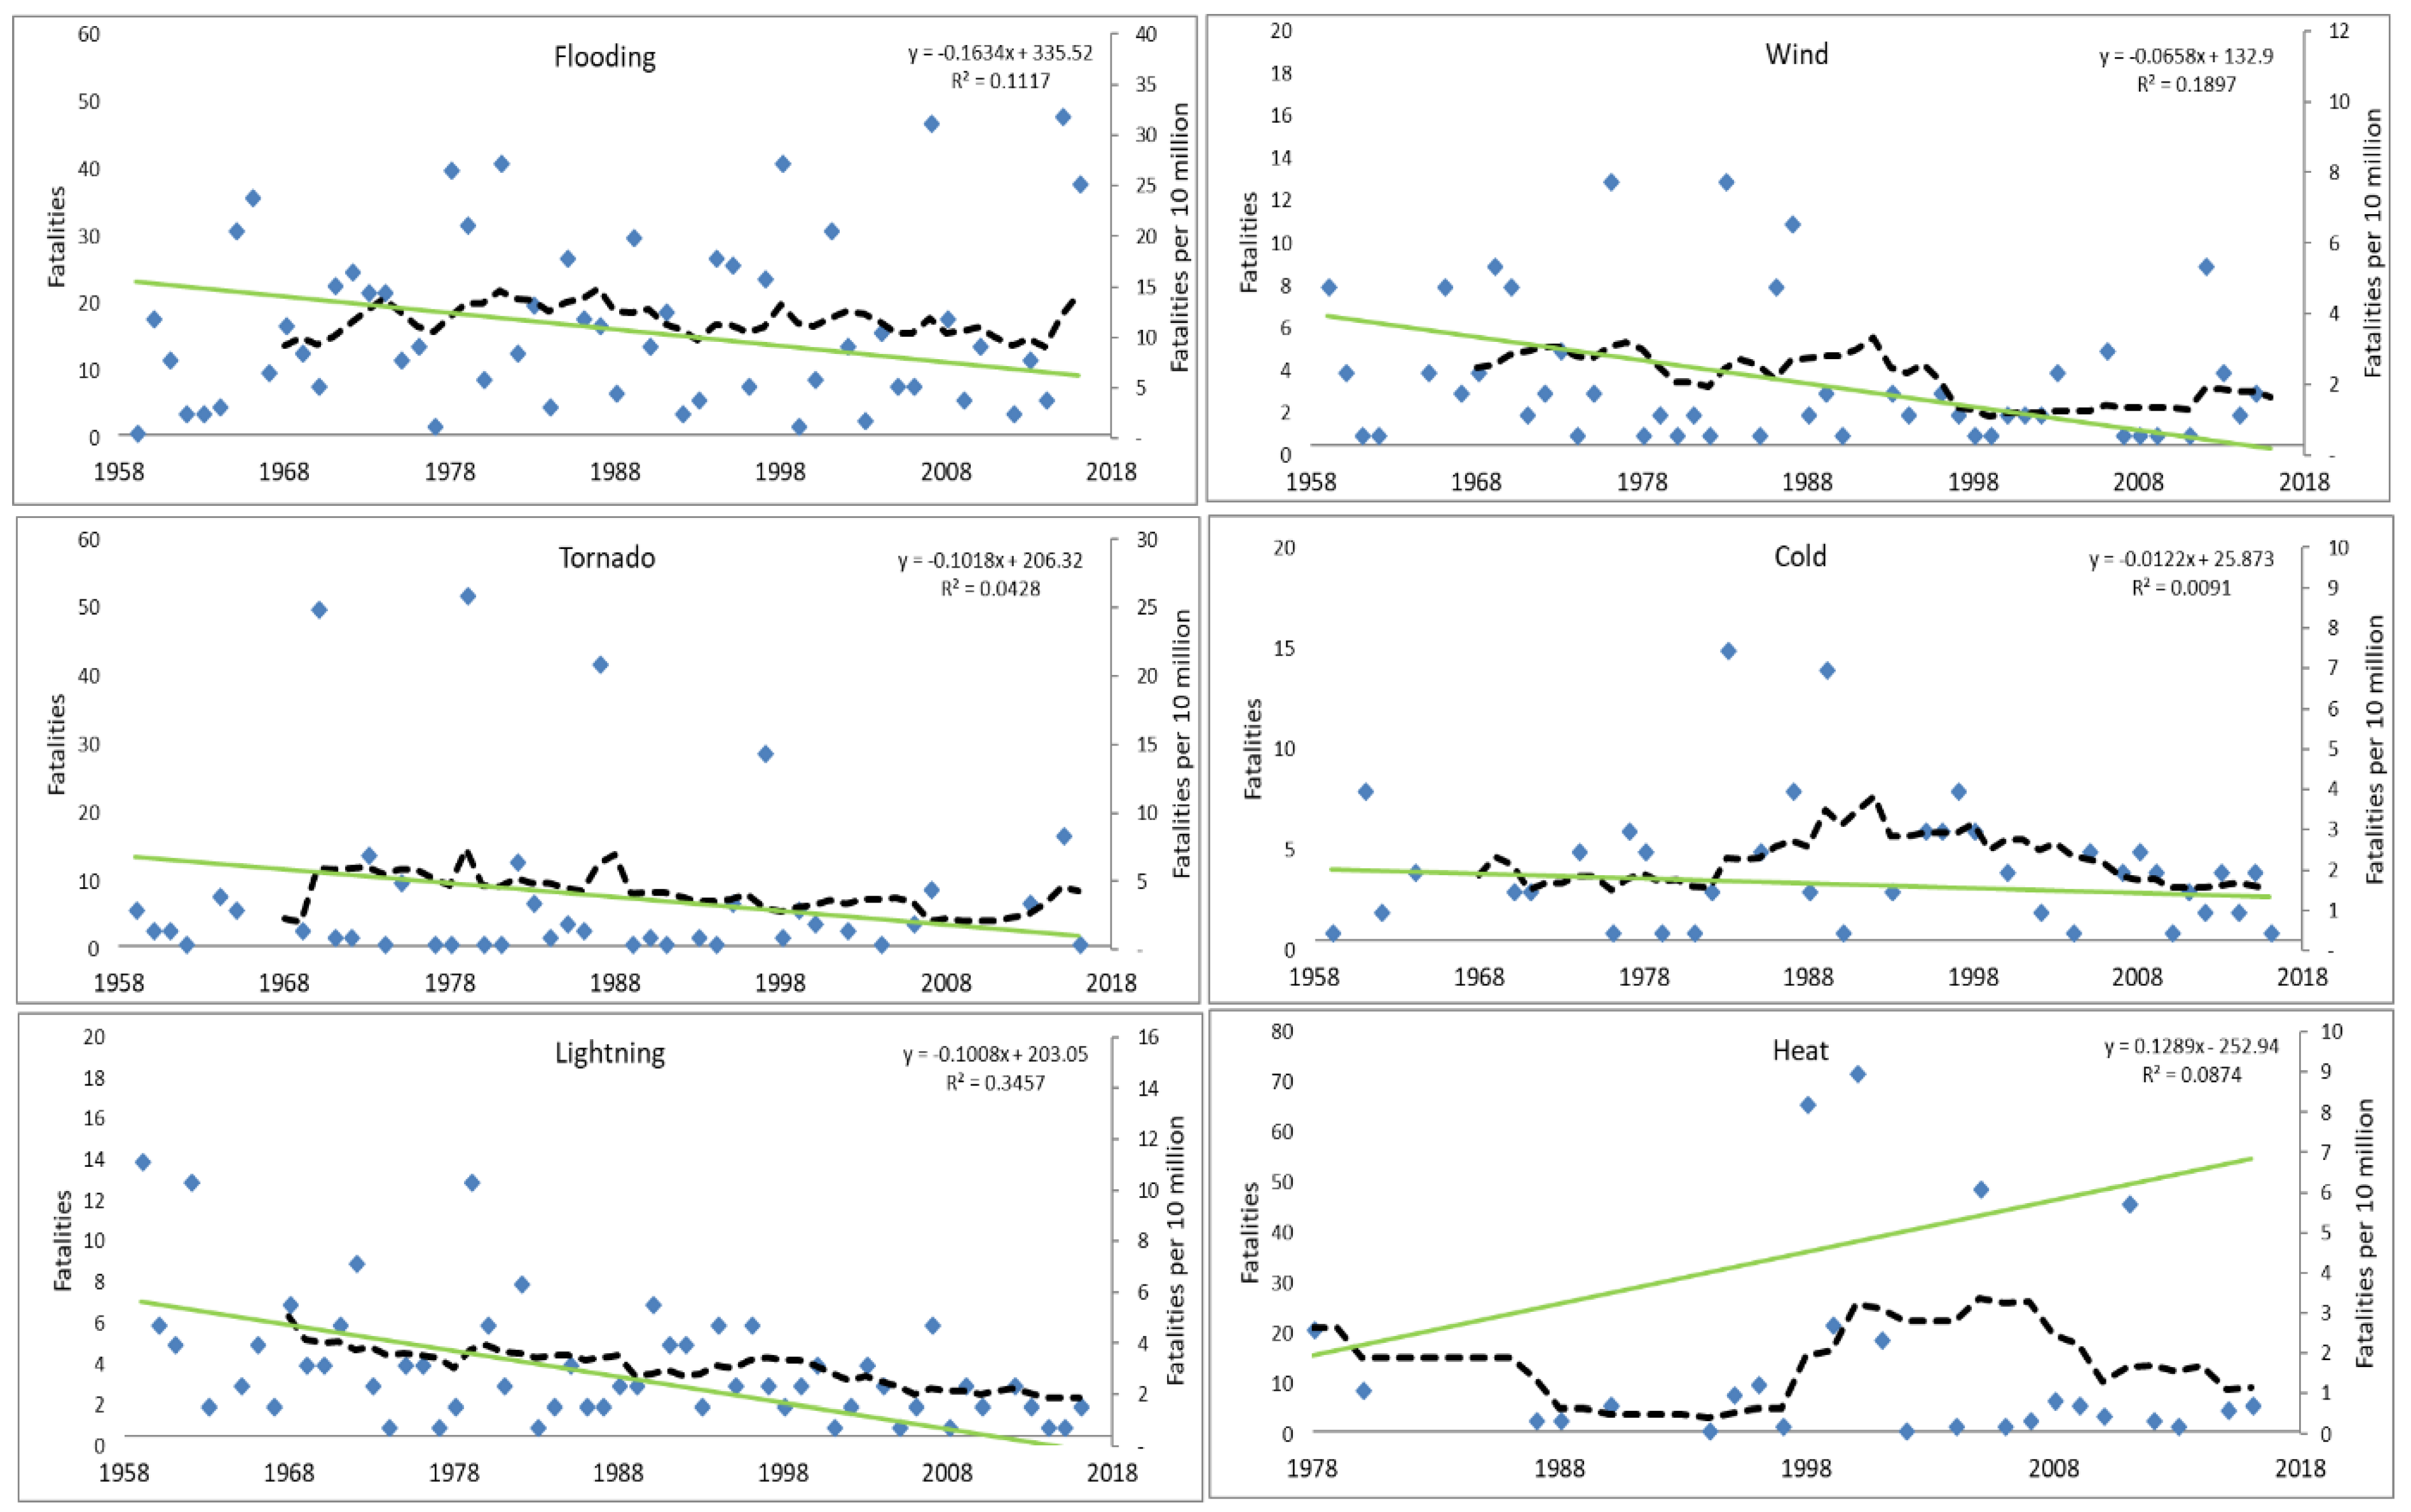
The annual fatality rate by disaster type from 1959 to 2016 for six of the eight disaster types is shown in Figure 5. There seems to be a shift in the number of fatalities at the middle of the study period, especially for tornadoes and lightning. Splitting the study period into two equal parts (1959–1987 and 1988–2016) shows the first half having a greater proportion of the total fatalities for all disasters except for heat-related events. Heat-related events show an increasing trend of 0.45 fatalities per year (R2 = 0.54) from 1978 to 2016 with no data available prior to 1978. Eighty-nine percent (89%) of all heat-related fatalities (335 out of 378) occurred after 1994. The increasing trend in heat fatalities is likely a compounded effect of higher than normal average air temperatures, the urban heat island effect, and increasing population in the urban regions. The retention of heat due to the abundance of non-natural building materials results in higher temperatures in the urban center than the surrounding area. As population increases in urban centers and higher temperatures the result will be increased heat fatalities especially for the most physically vulnerable such as the elderly. As noted in Figure 11, heat fatalities occur inside permanent residences about 50% of the time. This statistic is probably a conservative estimate since heat deaths may be under-reported for a variety of reasons. Exposure to extreme heat can cause cardiac or respiratory issues that can be fatal. Therefore, the judgment of the medical professional determines the cause of death as exposure to heat or the underlying medical condition. External factors also may contribute to under-reporting variability of heat fatalities especially along the U.S./Mexico border counties and in the case of chronically ill victims where it is unclear the final cause of death. Immigrant deaths along the border are uncertain due to international policy challenges.
The difference between the early and the latter half of the study period was highest for tornadoes with 71% in the first half of the study, followed by 68% for wind, 63% for cold weather, 62% for Lightning, 57% of tropical storms, and 52% for flooding. Not all years of the 58-year study experienced fatalities from all of the hydrometeorological disasters. Fatalities due to flooding. lightning and wind events were the most consistent occurring in 57, 56, and 47 of the 58 years respectively. Fatalities due to tornadoes, cold weather and heat events occurred in 41, 38, 26 of the 58 years respectively. The year 2011 was the only year that had no reported flood-related fatalities and was also the year that experienced one of the worst droughts in Texas history. Trend analysis over the entire 58-year period indicates statistically significant change (decreasing) for flooding (R2 = 0.112, p = 0.0104), wind (R2 = 0.190, p = 0.0006), lightning (R2 = 0.346, p = 1.21 × 10⁻⁶), and an increasing trend for heat (R2 = 0.087, p = 0.0243). Fatality trends due to tornadoes (R2 = 0.043, p = 0.1190), and cold (R2 = 0.009, p = 0.4770), exhibited slight downward trends but were not statistically significant.
Fatalities due to tropical events (hurricanes and tropical storms) were mostly due to drowning and therefore were integrated into the flooding fatalities unless there was a clear distinction in the fatality record. Only seven tropical event fatalities occurred during the period 2003–2007. The disaster category “Other” includes wildfires and other secondary perils that do not frequently result in death, such as hail, water spouts, or rain that resulted in roof collapse. The “Other” disaster category indicated 71% of the years (41 out of 58 years) had zero fatalities with a steady increase in the fatality rate starting in 2004. Eighty-one percent (81%) of fatalities of this category occurred in 13 years between 2004 and 2016. Rip currents were added to the Storm Data in 1998. The first reported fatalities occurred in 2007 with two total fatalities at 31 deaths from 2007 to 2016 with an average of 3.4 per year and a high of 8 deaths in 2011. Five of the 8 deaths were Mexican immigrants visiting the coastal county of Cameron. More years of rip current fatality data is needed to establish any definitive temporal or spatial trends.
3.2.2. Monthly Distribution of Fatalities
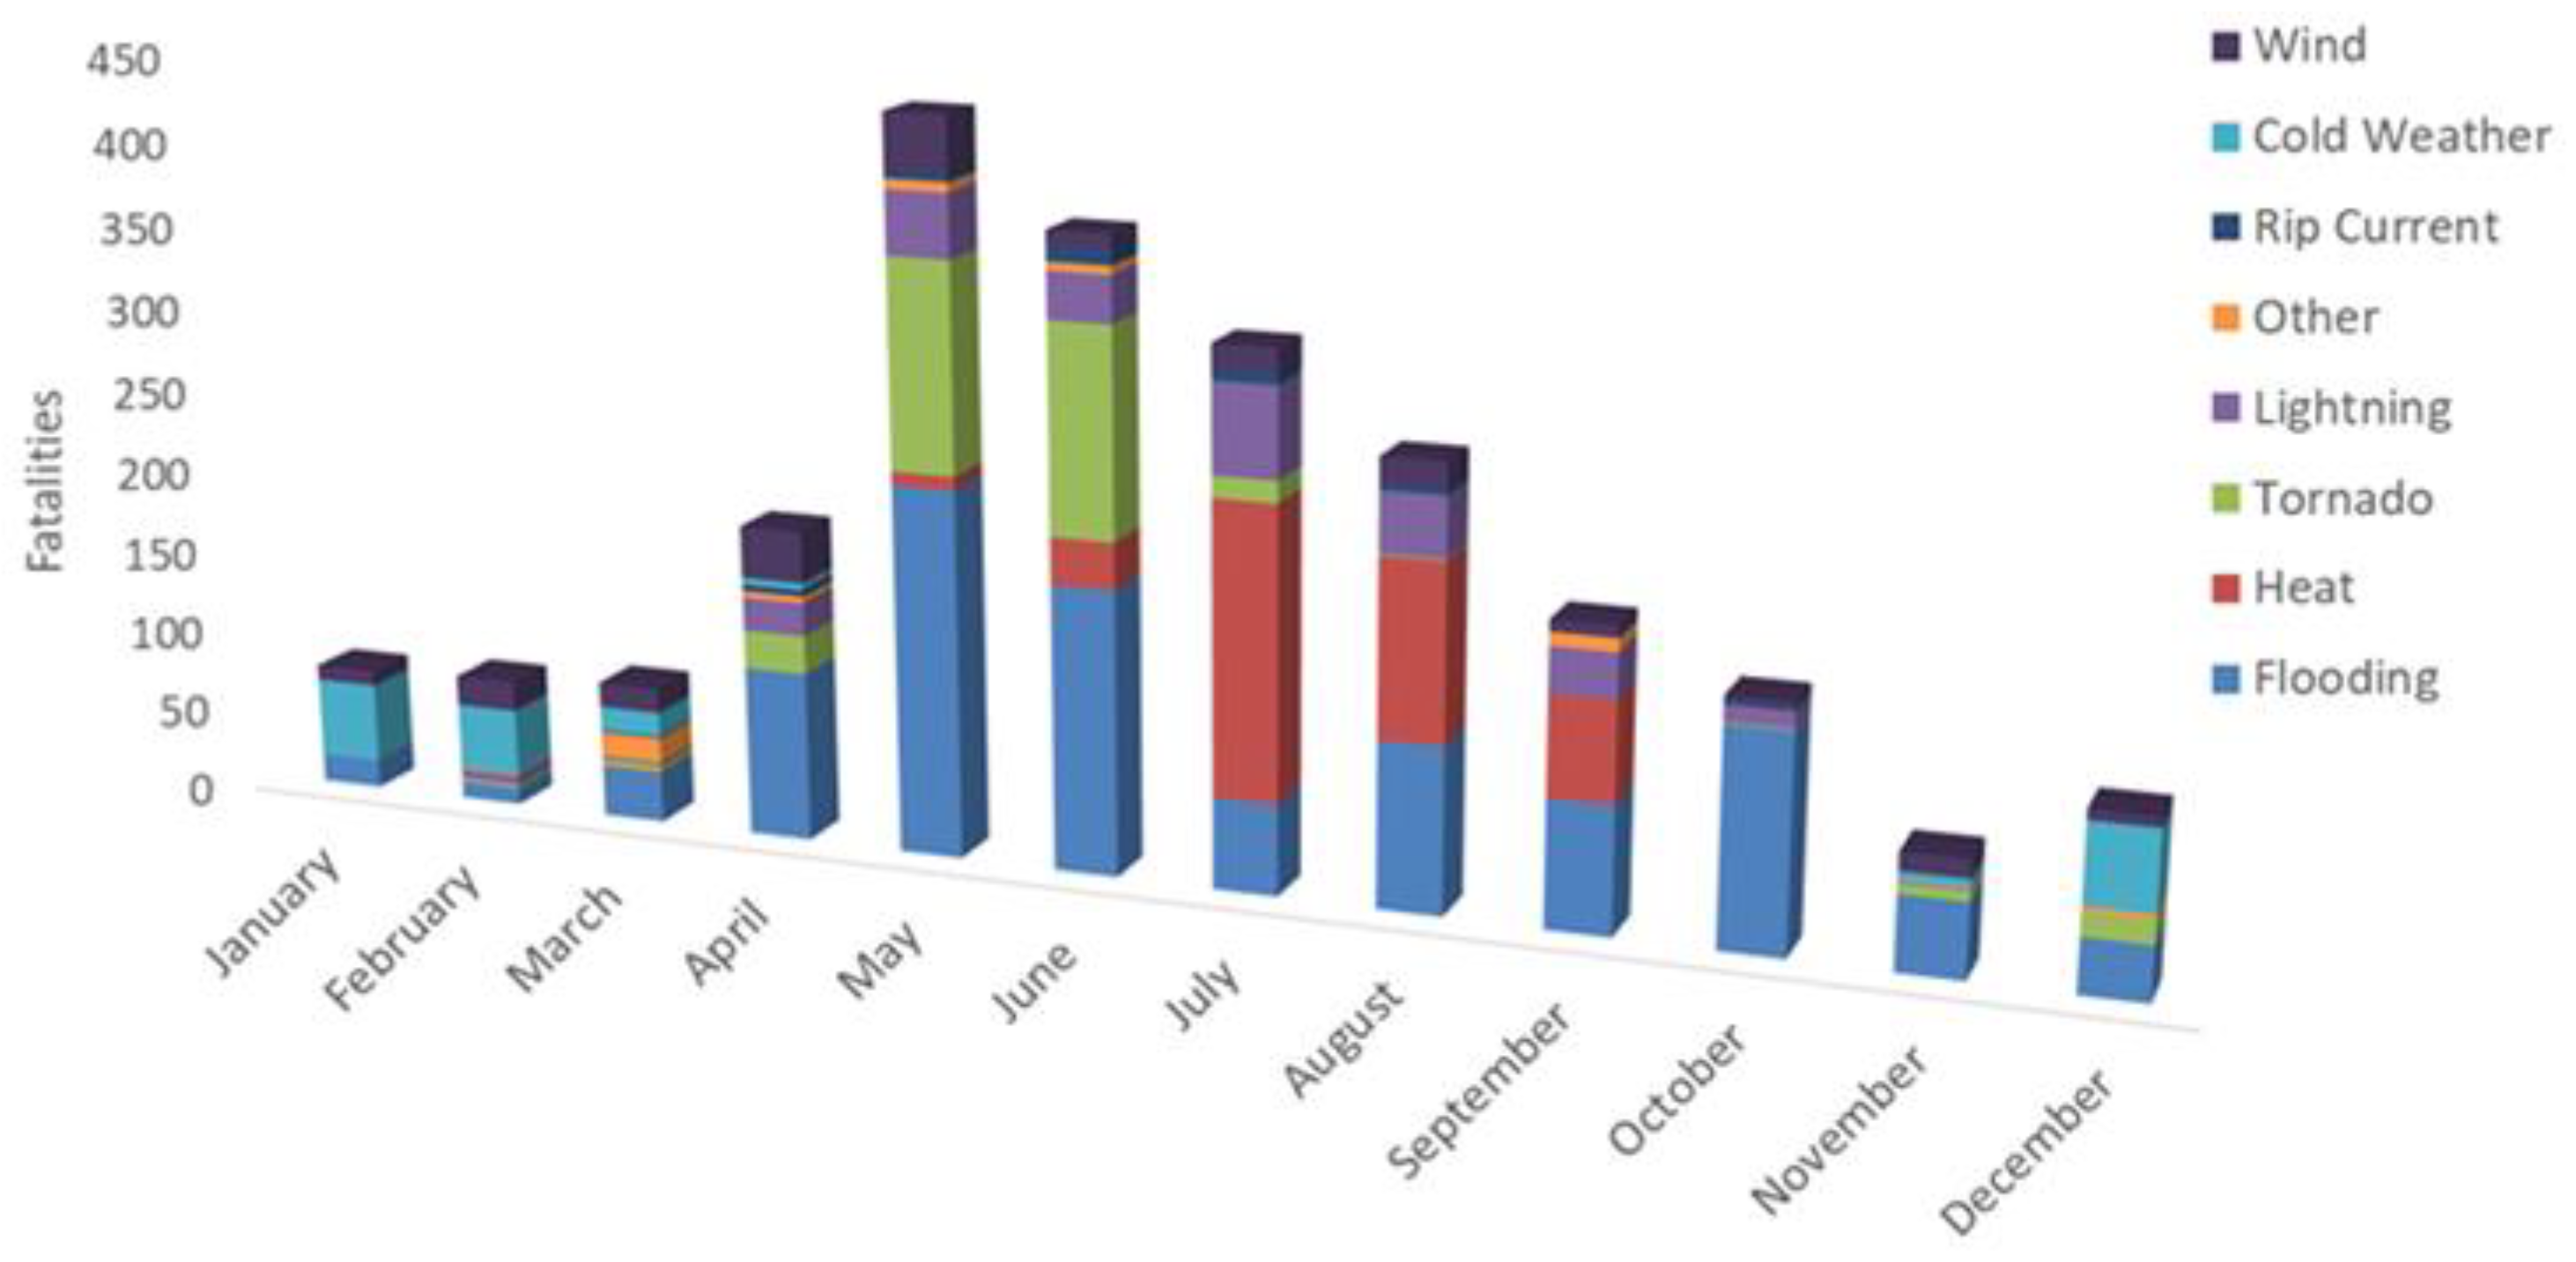
The monthly fatality rate due to hydrometeorological disasters illustrates the seasonal variability in the number of fatalities for different types of disasters (Figure 6). A distinct peak is noticeable in May driven by flooding and tornado fatalities, which are responsible for 80% of the fatalities in the month. During the summer months, most fatalities were due to heat events while spring fatalities result primarily from flooding. Flooding fatalities were highest in the months of May, June, and October with 22%, 17%, and 13%, respectively of the total flood-related fatalities. Some disaster-related fatalities are obviously limited to certain seasons such as cold weather fatalities that occur in Winter (85% of all cold weather-related deaths occurred in December, January and February). Seventy one percent (71%) of all fatalities occurred in spring and summer with an even split between the two seasons.
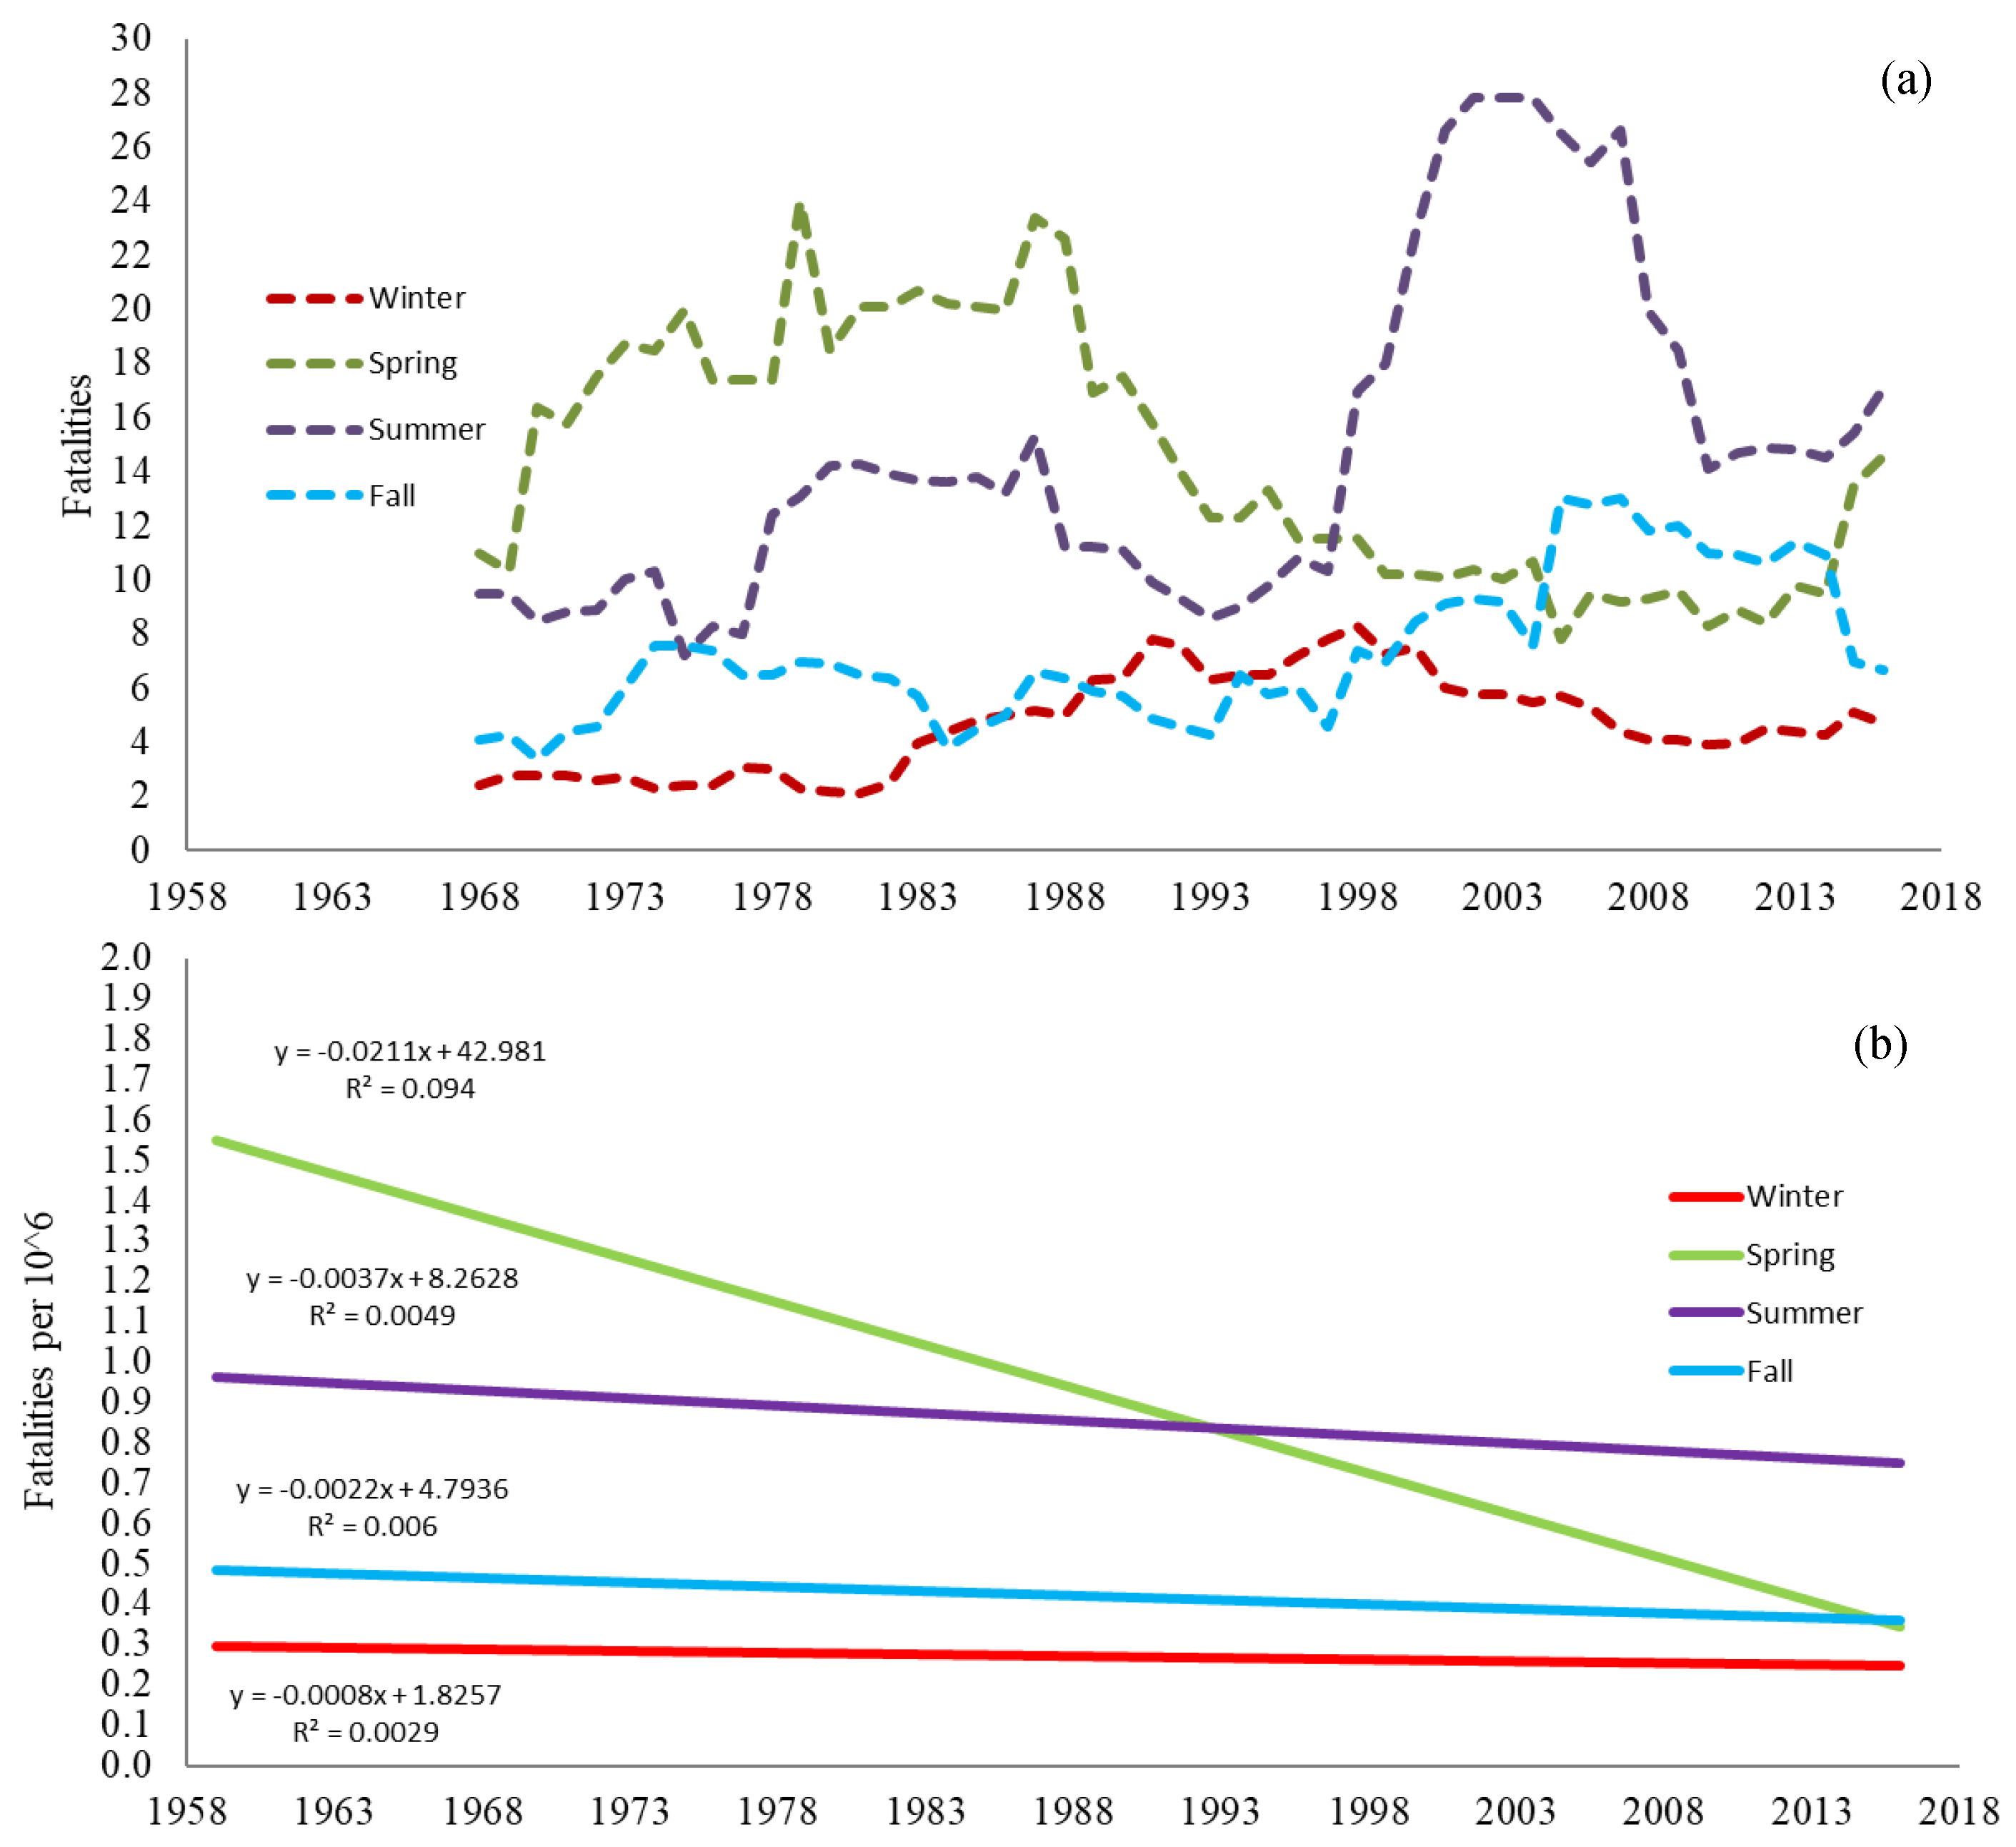
A grouping of the months into four seasons, Winter (December, January, February); Spring (March, April, May); Summer (June, July, August) and Fall (September, October, November), highlights the difference in rolling average fatality rates between the first half of the study period to the second half (Figure 7). The rolling averages show a slight decrease for spring and winter and increase in summer and fall with the largest difference observed in summer due primarily to an increase in heat-related fatalities that occurred between 1998 and 2008. Comparatively, all of the normalized trends for the four seasons have a decreasing trend winter (m = −0.0008, p = 0.687), summer (m = −0.0037, p = 0.600), fall (m = −0.0022, p = 0.563) with only the spring fatality trend (m = −0.0211, p = 0.019) having statistical significance.
3.2.3. Distribution of Fatalities by Time of Day
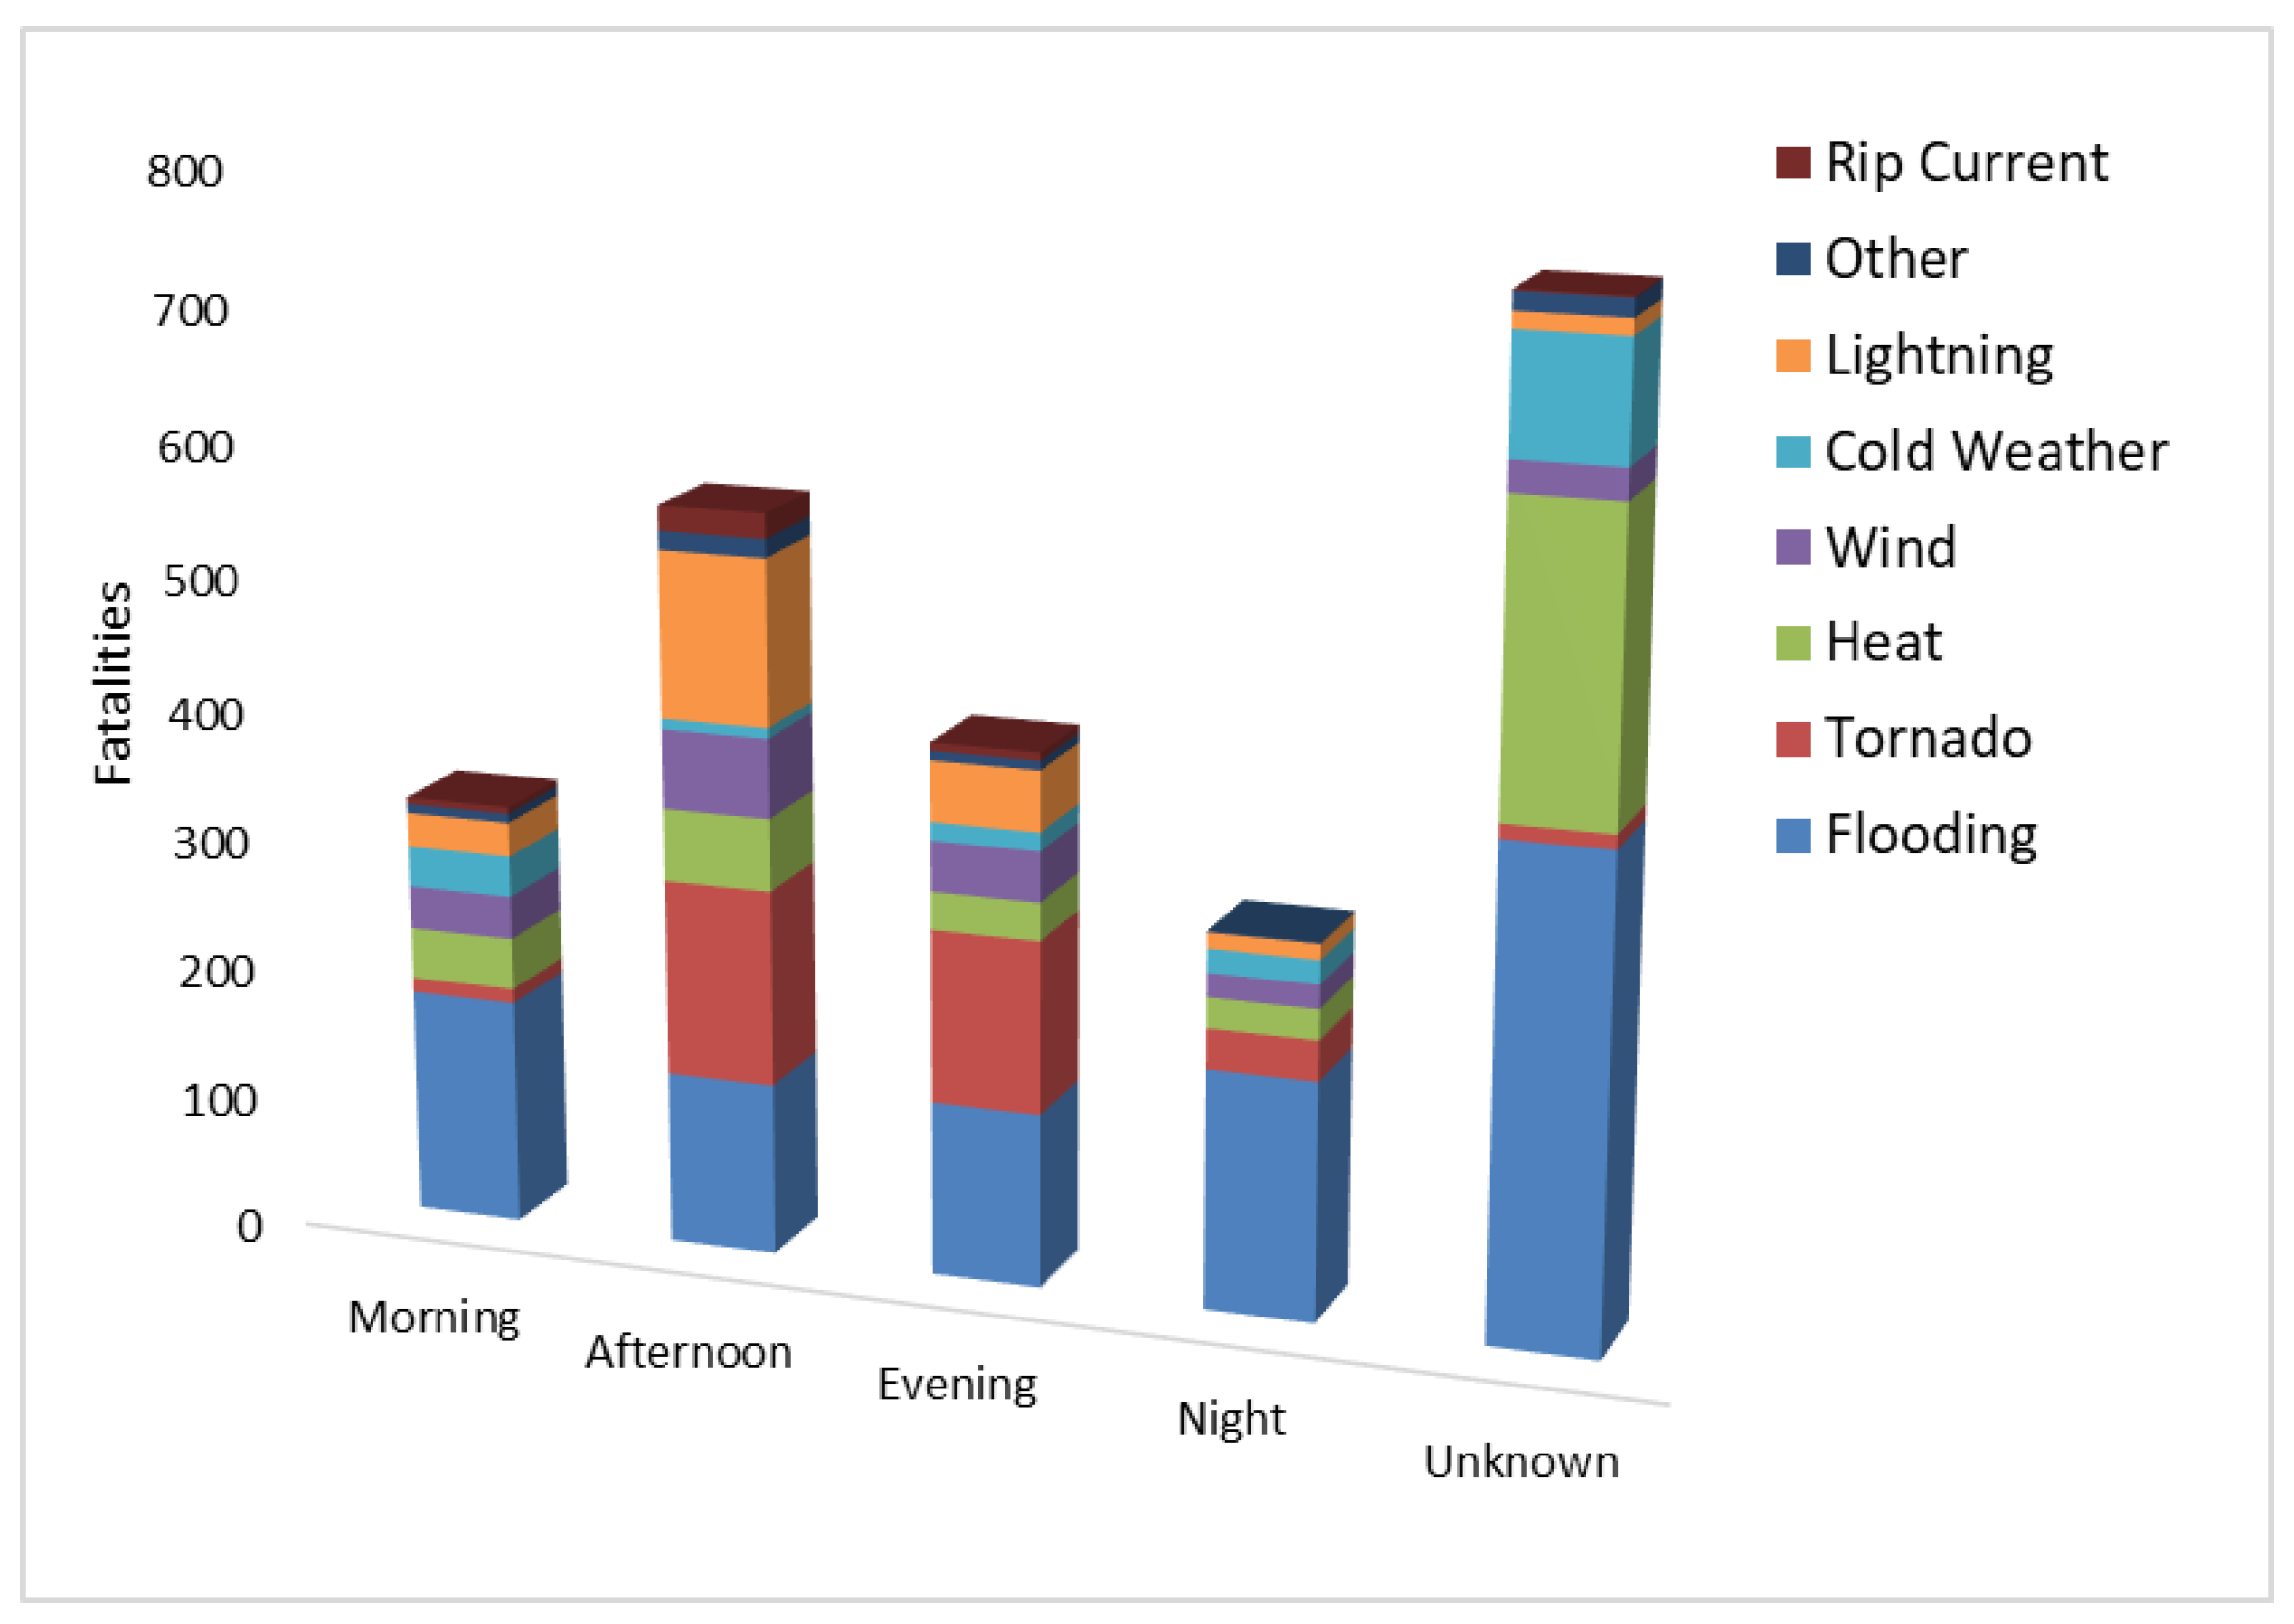
Time of day was provided for 68% of the hydrometeorological fatalities culled from the Storm Data. Each time of death was assigned to one of the four periods in a day: morning (6 a.m.–12 p.m.), afternoon (12 p.m.–6 p.m.), evening (6 p.m.–12 a.m.), and night (12 a.m.–6 a.m.). Of the fatalities with known time of death, 36% occurred in the afternoon, 26% in the evening, 21% in the morning, and 18% at night. Eighty percent (80%) of the fatalities with unknown time of the day were caused by flooding or heat-related events. Fifty percent (50%) of the total fatalities (562) that occurred in the afternoon were due to tornadoes and flooding. Detailed analysis shows that flooding events have a slightly higher chance of causing death at night or in the morning hours. However, tornados are much more likely to fatally strike in the afternoon/evening hours (Figure 8).
3.3. Spatial Distribution
Most hydrometeorological fatalities occurred in populated counties (Harris (Houston), Bexar (San Antonio), Dallas and Tarrant (Dallas area), Travis and Williamson (Austin) as well as rural counties in west Texas with low populations high fatality numbers are noted in the Flash Flood Alley counties and some coastal counties (Figure 9).
Table 3 provides the ranking of the top 5 counties with the highest number of hydrometeorological disaster fatalities which combined, account for 32% of the total hydrometeorological disaster fatalities. Slightly more than 3% of the total reported fatalities did not include county information. Forty-eight percent (48%) of the fatalities in Harris County were caused by heat-related events followed by flooding (33%) and lightning (11%). Heat events also caused the highest percentage of deaths (50%) in Dallas County followed by flooding (29%). Bexar County ranked third with 103 fatalities of which 82% were caused by flooding making Bexar the county the most dangerous in the state for death from flooding (per capita).
The top 5 counties within each hydrometeorological disaster type represent a significant percentage of the overall fatality rate within each of the category ranging from a high of 76% of all heat-related fatalities to a low of 28% of all wind event fatalities (Table 4). Dallas County is in the top five for six of the eight disaster types (heat, flooding, lightning, cold, wind, and others not shown in table). Harris is the only county that tops the list for more than one type of disaster and ranks number one for heat, flooding, and lightning fatalities and ranks second in wind fatalities. The top counties with the highest number of fatalities (and most populated counties) identified in Table 3 also dominate the top 5 ranking of counties in Table 4 for flooding, lightning and heat fatalities. Interestingly, although flooding is responsible for 43% of all disaster fatalities in the state, the top five counties only account for 34% indicating that flooding fatalities are extant over a high number of counties.
3.4. Fatalities by Age and Gender
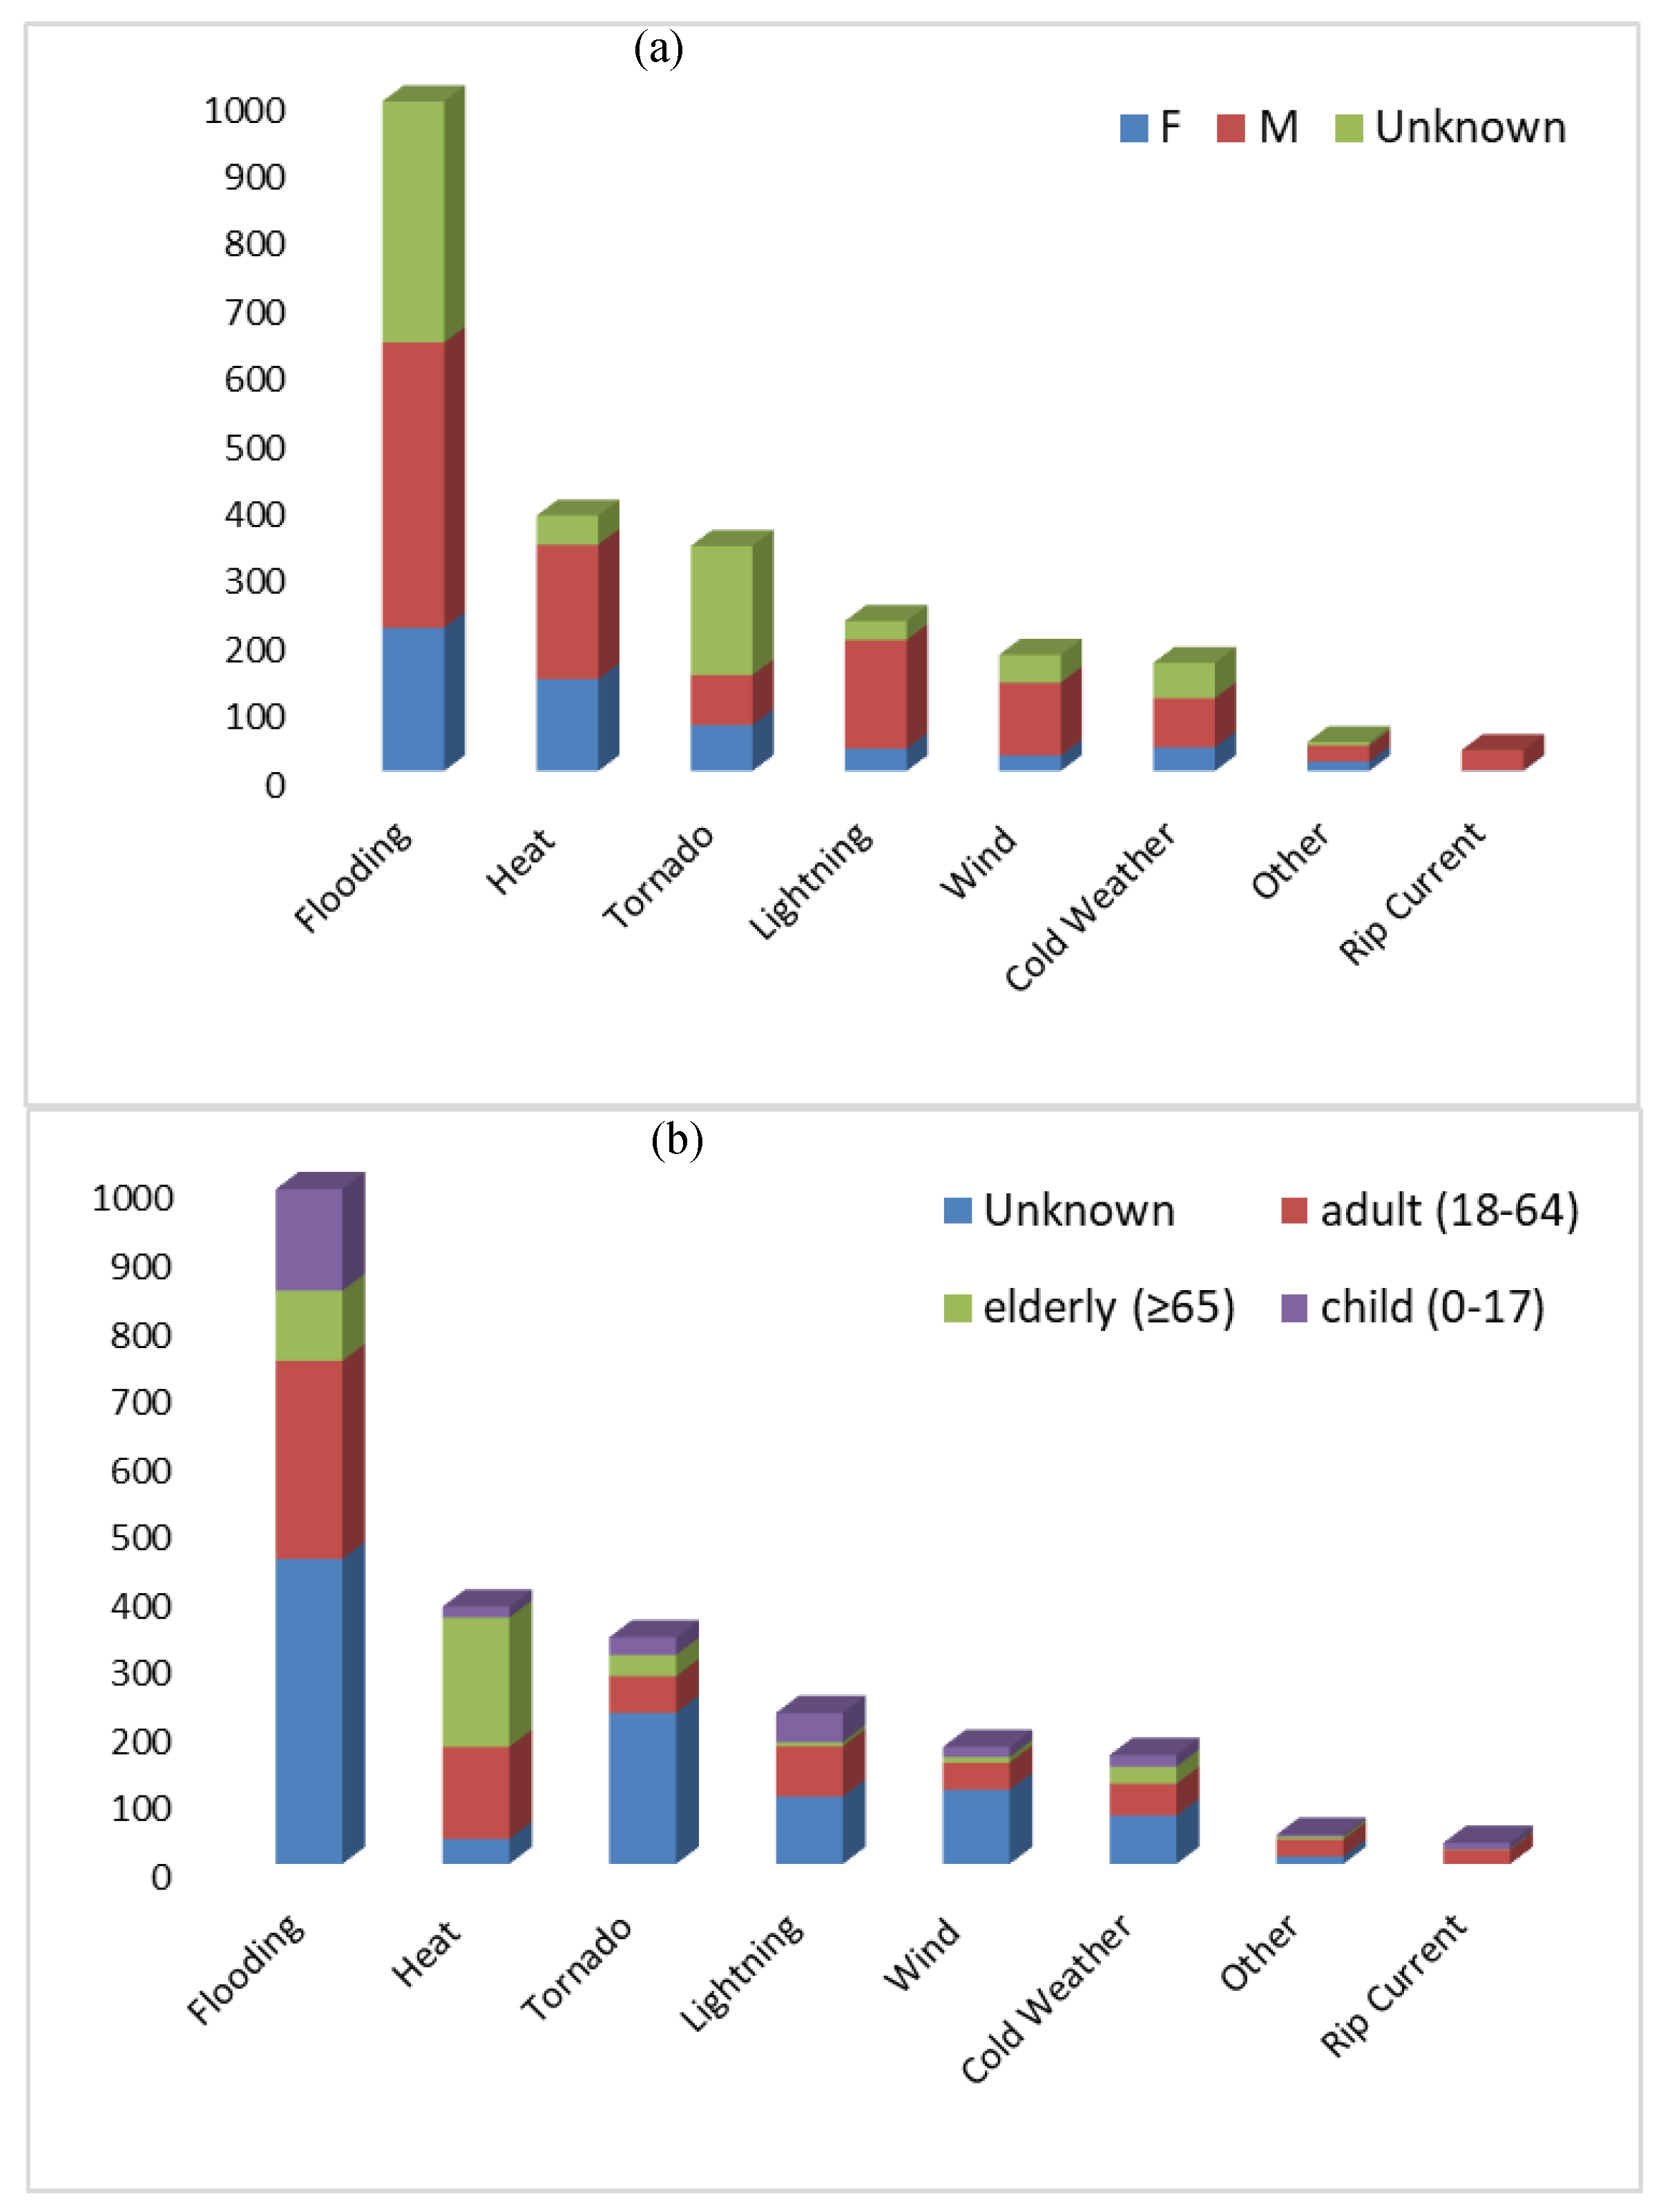
Age was provided for 57% of the total reported deaths (1333 fatalities) in which “Adults” made up 52%, the “Elderly” 28%, and “Children” 20% of the known age fatalities. In this study, “Children” are defined as newborns up to 17 years, “Adults” from 18 years to 64 years, and “Elderly” as persons above 65 years of age. Adults made up 53% and children made up 27% of all flooding fatalities. This fatality statistic requires more data (age aggregation) and further research into the specifics of the situation before any defensible conclusions can be drawn. On open conjecture it can be suggested that flooding is responsible for death of families which typically includes a higher number of children than adults that either did not evacuate or were killed during the evacuation process on transportation routes. Comparing the number of fatalities and the number of people in each age group provides a measure of relative risk of death within each age group. Using the 1990 census population in each age group: children (4,857,469), adults (10,420,598), and elderly (1,708,443) the relative risk of fatality for all hydrometeorological disasters during the period covered by this paper indicates a similar risk between children (0.006%) and adults (0.007%). But the risk of the elderly dying is more than three times the level at 0.022% due to the much lower elderly population (approximately 10% of total population). The elderly were mostly at risk for heat events, accounting for 52% of all heat-related fatalities (Figure 10).
The gender of the victim was provided in 69% of the reported fatalities. Among those, males made up 68% and females 32% representing an approximate ratio of 9:5. This gender disparity has also been observed in other research, for example in flood-related fatalities [12,13,30,31] and in lightning-related fatalities [32,33,34,35]. In all cases there was a high male to female ratio of fatalities. For the current study, the ratio of male to female fatalities is approximately 2:1. The greatest disparity was found in wind and lightning fatalities that show a 5:1 ratio of male to female fatalities. Rip currents have only been tracked since 1998 but the data thus far indicates a 30:1 ratio of male to female fatalities.
3.5. Fatalities by Activity Location
The Storm Data describes 18 potential activity fatality locations. For purposes of this study each of the disaster events reported in Texas from 1959 to 2016 was categorized within one of the following nine locations identified in based on the information provided in the incident reports (Table 5).
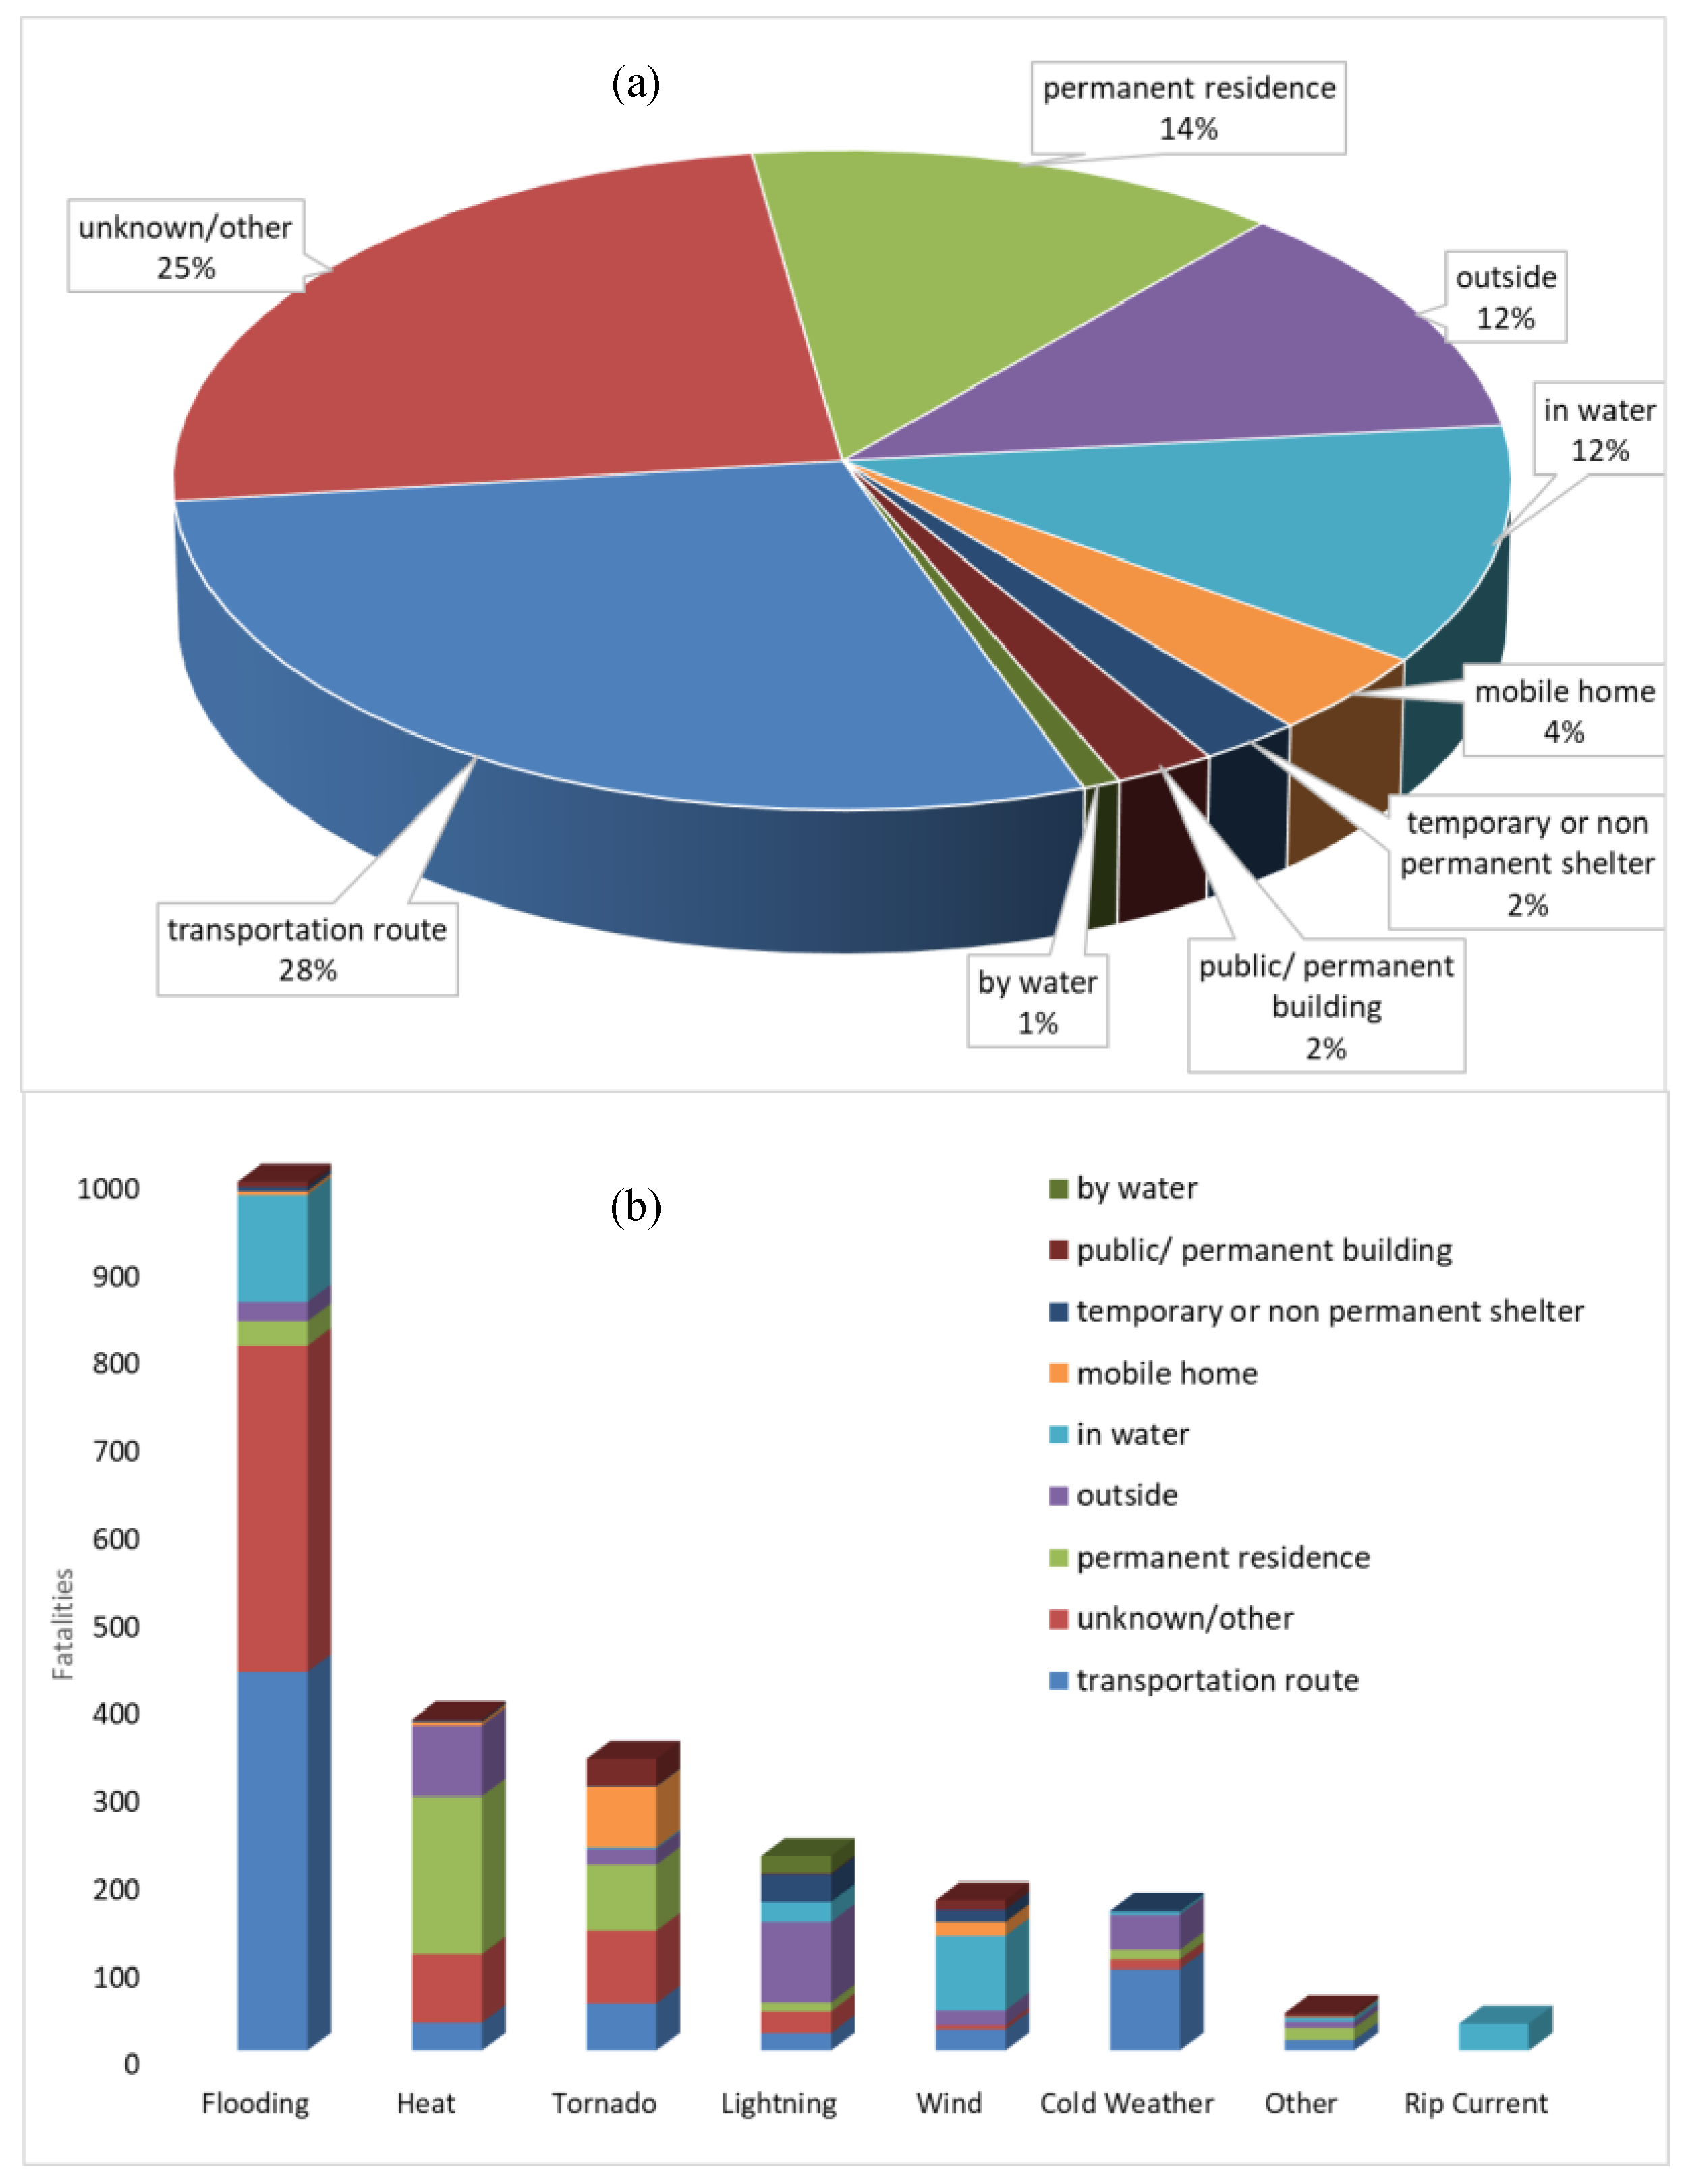
The activity location in which the fatality occurred was provided in 75% of the total fatalities that were reported in Texas from 1959 to 2016. Figure 11 shows the stratification of fatalities by location of occurrence and disaster types considered in this study. Fatalities with known locations, occurred most often (38%) on transportation routes such as roadways, freeways or toll ways, parking lots, sidewalks or air travel routes. Automobile accidents are not categorized as transportation routes unless they were specified as such in the report. Eighteen percent (18%) of known location fatalities occurred in “Permanent Residence”, followed by “Outside” and “In Water” at 16% and 15%, respectively. The high fatality rate in and around certain activity locations observed in Texas is also highlighted in research conducted in Switzerland for the period 1946–2015 [36] in which the researcher noted the greatest number of natural disaster fatalities occurring on transportation routes (33%), followed by in or around buildings and open terrain.
Sixty-five percent (65%) of fatalities on transportation routes were caused by flooding. This percentage is potentially underestimated since 65% of the fatalities in an unknown location were caused by flooding. As noted in other Texas flooding fatality studies [31] driving into flash flooding conditions is a significant occurrence that would make it very difficult to assign a location with no clear transportation route known. Also 25% of tornado fatalities are reported with an unknown location. Forty-eight percent (48%) of heat-related fatalities occurred in permanent residences. Tornados caused 73% of all hydrometeorological disaster fatalities reported in mobile homes. It must not be overlooked that the “Other” category included 11 deaths of children as result of being left in a car unattended and succumbing to heat exposure, a very preventable tragedy.
4. Discussion
The predominant types of natural disasters in Texas that result in fatalities are those initiated by weather conditions such as flooding, tornadoes, and extreme temperatures. This study did not analyze the climate conditions or associate global warming to disaster events, but rather its intent was to analyze the spatial and temporal distribution of fatalities by disaster type. Regardless of the reasons for changes in frequency or intensity of the hydrometeorological disaster events, the parametric shifts can challenge the preparedness and resiliency of a region and in many cases impact the number of fatalities incurred. Analysis of these types of natural disaster trends based on historic data can enhance predictability and preparedness planning to reduce the loss of life. Regional mortality and morbidity is also affected by the demographics and behavior of the people in the region of impact, specifically age, gender, and behavior patterns (location) have an observable relationship to the fatality rate due to hydrometeorological disasters.
4.1. Population and Fatality Rates
Texas exhibits regional variability in the hydrometeorological disaster fatality rate that is weighted to regions of high population. This suggests that as more people continue to move into populated urban areas or into regions that are at higher risk for hydrometeorological disasters such as flood plains, tornado alleys, or coastal regions, fatality rate will likely increase with or without an increase in the number of disaster events. Highly populated regions are more susceptible to a higher number of natural disaster fatalities than lower populated regions due to the sheer number of persons per area. As the population of Texas and the number of hydrometeorological disasters continues to increase, the result will likely be a continuing increase trend in the number of hydrometeorological fatalities. The current population growth rate for Texas is 1.8% which is the third in the U.S. According to the Texas Demographic Center [37], the vast majority of population growth since 1850 has occurred in metropolitan areas while the population in non-metropolitan counties has declined. This urban population increase coincides with an increasing trend of the annual fatalities as noted in Section 4.2.1.
The counties with the greatest population density: Harris, Dallas, Bexar, and Travis had the highest actual fatality rate, but each less than 15 fatalities per 100,000 persons over the study period. In contrast, some counties with lower populations had much higher per capita fatalities (higher risk for fatalities) although they were adjacent to the high population counties and experienced similar hydrometeorological disaster frequency and intensity. For example, Bexar county had 8.7 fatalities per 100,000 while surrounding county of Comal had 188 fatalities per 100,000 people. Harris county had 9.5 fatalities per 100,000 and the surrounding counties of Brazoria Chambers had 55 and 40 fatalities per 100,000 respectively. Figure 12 shows that per capita fatality rates are highest in sparsely populated counties in the southwestern portion of Flash Flood Alley and the Texas Panhandle in the northwestern part of the state.
4.2. Activity Locations for Fatality Occurrences
Twenty-five percent (25%) of the reported fatalities did not include a specific activity location of occurrence. But even with this uncertainty the available data strongly suggests that transportation routes are a leading fatality location. Approximately 38% of the total number of hydrometeorological disaster fatalities that reported a location (1756) identified transportation route as the activity location in which the fatality occurred. Approximately two-thirds (65%) of the fatalities on transportation routes were due to flooding which implies that driving into flood conditions is a frequent high-risk activity that likely contributed to many of these deaths. This conjecture is similar to conclusions drawn from research conducted in a study of natural hazard fatalities in Switzerland for the period 1946–2015 [36]. Additionally, research conducted at the University of Texas found that 73% of all flood fatalities in Texas during the period 1959 to 2008 were vehicle related and 16.5% were due to people walking into floodwaters from [13]. Further analysis of hydrometeorological fatalities in the U.S. suggests that flood fatalities are likely underestimated. Sixty-five percent (65%) of fatalities with an unknown location were due to floods, suggesting probable vehicle related incidents with no specific transportation route established.
The number of fatalities on transportation routes are directly related to the number of people on transportation routes which is related to the economic development of the affected region and the demographics of the people professionally and personally committed to the transportation routes. Developed economies result in more transportation between place of employment, schools, commercial and recreational destinations. This skew may be offset since regions of greater wealth and communication networks are more likely (have the ability) to evacuate out of harm which reduces the fatality rate when compared to regions of lower wealth and economic development who are unable or unwilling to evacuate. The employment rate, family structure (dual income/single income), cultural norms, and habits and behavior of the affected population significantly impacts the location of individuals at any given time and thereby impacts the number of fatalities experienced by hydrometeorological disaster events.
4.3. Gender and Age
Although gender and age were not reported for a large number of disaster fatality victims, the available information indicates more male fatalities than female fatalities. The gender gap in the hydrometeorological fatality rate exhibited a decreasing trend from the early years of the study to the more recent years suggesting a change in exposure possibly due to shifting roles and responsibilities of men and women in society.
Gender and age are two key demographics that differentiate in lifestyle, behavior and risk tolerance that ultimately affect the fatality rate. Female fatalities due to natural disasters increased significantly from the first to the second half of the study period. The 10-year rolling average more than quadrupled from three deaths in 1969 to 13 deaths in 2016. For the male population, the 10-year rolling average only increased (180%) from 10 deaths to 28 deaths during this same period. If it is generally accepted that contemporary (2017) societal gender roles and responsibilities are not the same as they were in 1959, some reasons for this difference may be in changing situational exposure of the workforce coupled with the level of risk accepted by males versus females. A change in situational exposure is evident in the recent years which is experiencing more role reversal in traditional male/female work roles (e.g., outdoor labor/indoor service).
The impact of gender and risk tolerance is most obvious in the rip current fatality numbers albeit culled from a limited time period (1997–2016) with a 30:1 ratio of male to female fatalities. Deaths from rip currents are more likely a factor of the difference in male / female risk tolerance than in a change of societal roles with more males swimming and pursuing water sports in an area and time of rip current activity. Tornado fatalities are an outlier to the general trends exhibiting a higher female to male fatality ratio, but more data is needed since a potential skew may exist with only 50% of all tornado fatalities reporting gender.
Risk tolerance also changes with age. Within the fatalities that included age (54% of total fatalities), two high risk groups stand out with the largest number of fatalities; 20–29 years. young adult age group and the 70–79 years age group. Changes in priori-ties, family, education, and responsibilities occur for most in this 50-year span and the accepted risk taking from youthful invincibility (such is likely the case for this age group that frequently drive into flash flood conditions), typically progresses to a longer period of more stable (less risky) lifestyle, until the later years when human vulnerabilities of age-related health limitations and immobility issues results in an increase potential for succumbing to hydrometeorological disasters. The limited number of fatality reports that includes age information in this study increases the uncertainty within the trend analysis and is an area that warrants further research. But within the confines of the given data, the elderly appear to be most susceptible to hydrometeorological disaster fatalities based on the percentage of total fatalities and taking into account the relatively low overall percentage of the Texas elderly population. The Texas Demographic Center statistics indicate that Texas population is 27.3% (<18 years, child), 62.4% (18–64 years, adult), and 10.3% (≥65 years, elderly) [37]. The age of the national and state populations overall is increasing and therefore the 2010 census estimates are conservative when comparing the fatality rates among the age groups from this study taking into account the much smaller number of elderly population versus younger age groups.
This study identified that the top two locations for elderly fatalities due to hydrometeorological disaster occurred in permanent residences (45%) and transportation routes (24%) which suggests a high risk to the homebound elderly segment of the population and to elderly when evacuating a disaster. Heat events and flooding were the top two disasters killing the elderly accounting for almost 80% of all elderly fatalities. The number of heat related fatalities is on the rise across all age groups but is particularly evident in the southwest of the U.S. and is usually combined with an extended drought period. Increasing global temperatures may be a factor in this trend with 2016 having the highest average temperature on record as well as the highest monthly temperatures in eight of the 12 months (January–May and July–September) [38]. With heat-related deaths heavily weighted towards the elderly that sometimes do not have family or social networks to acknowledge and report their demise, the fatality rate in this age group may be under-reported
The elderly are not only at risk of heat-related fatalities, but are also very vulnerable to flooding triggered by heavy rains and/or high winds such as exist in hurricane or tropical storm conditions. The fatality rate due to flooding ranked second for the elderly in the study but 45% of all flooding fatalities not reporting age of the victim, there is some uncertainty in this statistic. More certain is that flooding devastates a community on many levels including power interruptions and blockage of transportation routes. Medical attention is a necessity for many elderly, whether it is within a medical facility, nursing home or the need to obtain prescription drugs. All these are typically inhibited during a flooding condition. Although there is debate on whether it is safer to evacuate or shelter the elderly in place during a flood, improvement strategies to reduce fatalities should not be stalled until final consensus.
The study also found that flooding was responsible for 53% of the total hydrometeorological disaster fatalities where the victims were known to be children (<18 years). Young children tend to outnumber adults in a family unit and are dependent on the care and good decisions of parents or guardians. If the family guardian makes a decision (e.g., driving into dangerous flood waters) that result in a fatal outcome it is likely that the number of children will be greater than adult fatalities for the same incident. Data from this study indicates the top activity location for child flood fatalities is on transportation routes (38%) and seems to support the conjecture.
4.4. Evacuation or Shelter in Place
In response to a pending flood or hurricane event, unless there is a mandatory evacuation order given by the city or county jurisdiction, the critical questions to consider is whether it is safer to evacuate by driving or walking to the evacuation location or if there is less risk of harm to shelter in place. For example, although flood fatalities are most likely to occur on transportation routes, all 68 fatalities (except one) during Hurricane Harvey occurred inside homes. Several factors should be considered when deciding to evacuate or shelter in place such as the perceived risk to the specific area of residence, number of children and elderly in the family, health condition and mobility of each family member, condition of the shelter residence, condition and availability of transportation, and evacuation destination distance. The decision to evacuate during a hurricane or flood can be the difference between life and death.
This decision becomes especially critical with regards to the elderly residing in nursing homes and long-term care facilities (LTCF). Research conducted in 2017 by Pierce on disaster preparedness of LTCF [39] found deficiencies in integrated and coordinated disaster planning, staff training, practical consideration before governments order mandatory evacuations, and accurate assessment of the increased medical needs of LTCF residents following a disaster. Previous research on the management of nursing home residents [40] found that, “the decision to completely evacuate, partially evacuate (including transfers of individual residents), or to shelter in place must be based on the integration of real-time data regarding the disaster event, the facility in question, and the clinical profiles of the residents at risk”. Similar research by Dosa et al. [41] specific to Hurricane Katrina and Rita based on a survey of LCTF administrative directors noted a much higher mortality rate with evacuation actions than with shelter in place that was attributed to lack of governmental assistance, unsupported technical and physical requirements for transportation, and difficulty in retaining adequate staff.
4.5. Temporal Distribution
The fatality rate of annual raw fatalities increased from 1959 to 2016 with a maximum of 118 fatalities in 1998 due primarily to heat events in the months of July and August and flooding in August and October. Stratification of total fatalities by season indicated that the majority (70%) of all fatalities occurred in spring and summer with floods as the predominant disaster in spring and heat-related deaths in Summer. Monthly variation indicates the highest risk for flooding and tornado fatalities in April and May and the highest risk of heat events in August and September. Within the 68% of the hydrometeorological disaster fatalities that reported the time of day, the data in this study suggests that the afternoon period has the highest risk of fatality from tornado, flooding, or lightning.
Based on the current level of understanding in the relationship between earth sciences and meteorological conditions there is limited scientific predictability of disaster impacts. Predicting hydrometeorological disasters is challenging not only from a scientific basis but also because the fatality rate is not solely a factor of the type of the disaster but is impacted by societal activities of the region in which the disaster event may occur. In general, hurricanes have some level of temporal probability and typically make landfall at night when the storm strengthens due to the latent heat release in the upper and middle atmosphere. Tornadoes also tend to occur in the late afternoon and early evening hours, when the atmospheric conditions are most ripe for supercell thunderstorms and are most common from 4 p.m. to 9 p.m. in the evening [42]. Disaster events such as flooding are dependent on the amount and rate of precipitation and location of adjacent bodies of water (coastal, riverine, or inland). The resulting impact of such a disaster is a function of the activities occurring in the community affected at the time of the flood such as transportation density. Other factors include the level of early warning and evacuation, the time of the day of the flooding to accommodate or hinder rescue and transport efforts.
Similarly, if tornadoes strike during the day (especially a weekday) more people are at work or school and are in buildings where there are adequate public shelter facilities that are typically more disaster resilient than a private residence. Although one quarter of tornado deaths did not include an activity location, within the known study data, only 12% of the fatalities occurred in public/permanent buildings to support this conjecture. The study data also identified that more than 80% of lightning fatalities occur outside, in or around water, and temporary shelters. The extent of fatalities due to lightning is an example of the combined effect of the disaster and the victims location. Lightning fatalities have decreased significantly on a national and state level in the last several decades as a result of a decrease in exposure (outdoor labor, agricultural work) and the strengthening of OSHA (Occupation-al Safety and Health Agency) safety protocols. Children and adults are the high-risk age groups for lightning fatalities and mitigation efforts to reduce the fatality rate can include increased public awareness in school and at the workplace to move or stay indoors during lightning events. This is especially critical for early morning lightning storms which have the greatest killing potential due to the electric charge build-up overnight [43].
5. Conclusions and Recommendations
This study reviewed the fatality rates due to hydrometeorological disasters in Texas over a 58-year study period (1959–2016) with the objective of providing perspectives and information to enhance public awareness, support investment in infrastructure improvement, and serve as input to state and regional disaster mitigation plans. The ability to reduce the number of hydrometeorological fatalities in Texas should not be underestimated. Resources are available but require political will to drive prioritized allocation to ensure weighted coverage in the highest risk areas. Information gleaned from the review of trends from historic hydro-meteorological disasters analyzed in this study can assist decision-makers in determining the best allocation of resources to provide maximum mitigation potential for high risk disasters and regions.
Based on the Storm Data analyzed in this study the normalized fatality rates are decreasing for all hydrometeorological disasters except for heat fatalities. The overall growth in population and urban centers plays a key role in the decreasing normalized fatality rates. But population growth appears to have an increasing effect on heat fatalities. The study results show that heat fatalities have a strong correlation to counties with high population density as well as disproportionately effecting the elderly segment of the population. Dedicated financial support can improve emergency preparedness for the elderly in nursing homes, long-term care facilities and private residences to ensure backup power, channels of communication, and available transportation to address immobility issues for the elderly in the case of mandatory evacuation or the necessity to shelter in place.
In addition to the elderly being susceptible to heat fatalities, they are also vulnerable to flooding. The main reasons appear to be related to mobility issues and interruption in medical care. Senior residences and long-term care facilities must have the ability to safely evacuate all their residents if required or be able to shelter in place with all necessary medical staff, medication and back-up power for prolonged medical assistance. Adequate early warning and funding to build a preparedness plan and inventory are vital components to this cause. Requirements for emergency staffing and assistance must be mandated through policy with preparation and training funded before a disaster strikes. Flooding is also the leading killer of adults and children in Texas especially on transportation routes. Adequate road, bridge, and waterway maintenance and improvement to reduce roadway flooding should be an ongoing approved budget item in lieu of recreational upgrades or other low risk projects.
Conversely to populated urban centers that have a higher number of actual fatalities, regions with a low population density exhibit a higher normalized fatality risk. Although the normalized fatality risk is inversely proportional to the population due to the low number of people, the options for survival can still be improved through better preparation. Low population counties are typically rural and do not receive as much funding for road and water management projects. Engineering building codes also maybe more lax contributing to devastation from tornado or other high wind events especially on the coast during hurricane season. Coastal land development must be managed to avoid permanent or non-permanent housing being established in high risk hurricane and storm surge zones. Rural poverty should not be directly related to the risk of death due to a hydrometeorological disaster. The county and state should focus disaster preparation awareness and ensure basic funding is made available to those low population areas with high fatality rates.
Flooding, heat, and tornado events rank as the top three causes of hydrometeorological disaster fatalities in Texas. Regions that are prone to non-coastal flooding are predominantly in the counties within the regions known as Flash Flood Alley and incur a high number of fatalities on transportation routes. Therefore, risk reduction can be supported by investment in roadway flood control improvement including early warning flash flood signage, establishing alternate routes in case of emergencies and mandatory evacuation, preemptive emergency public transportation protocols, and public awareness through educational programs. Tornadoes occur most often in the northeastern counties of Texas, particularly in the months of April and May, and predominantly affect those in temporary or non-permanent shelter (e.g., mobile homes). Contingency planning for the segment of society that is vulnerable to tornadoes can include more frequent public awareness and information campaigns during these months along with practice drills for what to do and where to go when a tornado touchdown is likely. Ensuring that emergency shelters in proximity to mobile home communities are available, accessible, and publicized during these high-risk months also has the potential to save lives. Similar basic considerations can also reduce the risk of fatalities for cold weather, wind events and other types of natural hazards. It is imperative that research builds on historic data to better understand the synergy between high risk disasters, regions and vulnerable segments of society to reduce the risk of hydrometeorological disaster fatalities in Texas.
Author Contributions
A.M.C. provided manual aggregation of fatality data contained in archived pdf files and electronic files from the NOAA Storm Data repository from 1959 to 2016. H.O.S. provided interim review, comments, and professional guidance in all aspects of writing this paper. S.H.P. performed the quantitative data analysis, qualitative interpretation of results and discussion, and wrote this paper
Funding
This research was funded by the Nuclear Regulatory Commission (NRC) Fellowship Grant #NRC-HQ-60-17-G-0036.
Acknowledgments
We are grateful to the University of Texas at San Antonio for faculty and technical support and the Nuclear Regulatory Commission for financial support of this research.
Conflicts of Interest
The authors declare no conflict of interest.
References
- Munich Re. NatCatSERVICE, Natural Catastrophe Know-how for Risk Management and Research. Natural Catastrophe Online Tool. Available online: http://natcatservice.munichre.com/ (accessed on 17 May 2018).
- Hahn, D.; Viaud, E.; Corotis, R. Multihazard Mapping of the United States. ASCE-ASME J. Risk Uncertain. Eng. Syst. A Civ. Eng. 2016, 3, 04016016. [Google Scholar] [CrossRef]
- Borden, K.; Cutter, S. Spatial patterns of natural disasters mortality in the United States. Int. J. Health Geogr. 2008, 7, 1–13. [Google Scholar] [CrossRef] [PubMed]
- Chowdhury, A.; Mushtaque, R.; Bhuyia, A.; Choudhury, A.; Sen, R. The Bangladesh cyclone of 1991: Why so many people died. Disasters 1993, 17, 291–304. [Google Scholar] [CrossRef] [PubMed]
- Gerritsen, H. What happened in 1953? The Big Flood in the Netherlands in retrospect. Philos. Trans. R. Soc. 2005, A363, 1271–1291. [Google Scholar] [CrossRef] [PubMed]
- Jonkman, S.; Maaskant, B.; Boyd, E.; Levitan, M. Loss of life caused by the flooding of New Orleans after hurricane Katrina: Analysis of the relationship between flood characteristics and mortality. Risk Anal. Int. J. 2009, 29, 676–698. [Google Scholar] [CrossRef] [PubMed]
- Kure, S.; Jibiki, Y.; Quimpo, M.; Manalo, U.; Ono, Y.; Mano, A. Evaluation of the Characteristics of Human Loss and Building Damage and Reasons for the Magnification of Damage Due to Typhoon Haiyan, Coastal. Eng. J. 2016, 58, 1640008. [Google Scholar] [CrossRef]
- Ashley, S.; Ashley, W. Flood fatalities in the United States. J. Appl. Meteorol. Climatol. 2008, 47, 805–818. [Google Scholar] [CrossRef]
- Singh, O.; Kumar, M. Flood events, fatalities and damages in India from 1978 to 2006. Nat. Disasters 2013, 69, 1815–1834. [Google Scholar] [CrossRef]
- Paulikas, M.; Rahman, M. A temporal assessment of flooding fatalities in Pakistan (1950–2012). J. Flood Risk Manag. 2015, 8, 62–70. [Google Scholar] [CrossRef]
- FitzGerald, G.; Du, W.; Jamal, A.; Clark, M.; Hou, X. Flood fatalities in contemporary Australia (1997–2008). Emerg. Med. Australas. 2010, 22, 180–186. [Google Scholar] [CrossRef] [PubMed]
- Sharif, H.; Jackson, T.; Hossain, M.; Zane, D. Analysis of Flood Fatalities in Texas. Nat. Disasters Rev. 2014, 16, 04014016. [Google Scholar] [CrossRef]
- Sharif, H.; Jackson, T.; Hossain, M.; Bin-Shafique, S.; Zane, D. Motor Vehicle-related Flood Fatalities in Texas, 1959–2008. J. Trans. Saf. Secur. 2010, 2, 325–335. [Google Scholar] [CrossRef]
- Fox News. Fox Facts: Hurricane Katrina Damage. 2006. Available online: http://www.foxnews.com/story/2006/08/29/fox-facts-hurricane-katrina-damage.html (accessed on 2 April 2018).
- Wikipedia: Hurricane Harvey. Available online: https://en.wikipedia.org/wiki/Hurricane_Harvey (accessed on 2 April 2018).
- Spatial Disaster Events and Losses Database for the United States (SHELDUS); Hazards and Vulnerability Research Institute. U.S. Hazard Losses (1960–2015) Summary Report. 2017. Available online: http://hvri.geog.sc.edu/SHELDUS/index.cfm?page=reports (accessed on 2 April 2018).
- National Oceanic and Atmospheric Administration. NOAA. U.S. Tornado Climatology. 2017. Available online: https://www.ncdc.noaa.gov/climate-information/extreme-events/us-tornado-climatology (accessed on 2 April 2018).
- Ashley, W.S. Spatial and temporal analysis of tornado fatalities in the United States: 1880–2005. Weather Forecast. 2007, 22, 1214–1228. [Google Scholar] [CrossRef]
- Changnon, A.; Pielke, R.; Changnon, D.; Sylves, R.; Pulwarty, R. Human factors explain the increased losses from weather and climate extremes. Bull. Am. Meteorol. Soc. 2000, 81, 437–442. [Google Scholar] [CrossRef]
- Cutter, S.L.; Finch, C. Temporal and spatial changes in social vulnerability to natural disasters. Proc. Natl. Acad. Sci. USA 2008, 105, 2301–2306. [Google Scholar] [CrossRef] [PubMed]
- Cutter, S.; Emrich, C.; Gall, M.; Reeves, R. Flash Flood Risk and the Paradox of Urban Development. Nat. Disasters Rev. 2017, 19, 05017005. [Google Scholar] [CrossRef]
- Milch, K.; Broad, K.; Orlove, B.; Meyer, R. Decision Science Perspectives on Hurricane Vulnerability: Evidence from the 2010–2012 Atlantic Hurricane Seasons. Atmosphere 2018, 9, 32. [Google Scholar] [CrossRef]
- Sault, S. Why the Hill Country Is A.K.A. ‘Flash Flood Alley’ 2016. Texas Hill Country. Available online: http://texashillcountry.com/why-the-hill-country-is-a-k-a-flash-flood-alley/ (accessed on 2 April 2018).
- National Oceanic and Atmospheric Administration (NOAA). National Centers for Environmental Information. Storm Events Database 2017. Available online: https://www.ncdc.noaa.gov/stormevents/ (accessed on 2 April 2018).
- Border Patrol. Southwest Border Sectors. 2018. Available online: https://www.cbp.gov/sites/default/files/assets/documents/2017-Dec/BP%20Southwest%20Border%20Sector%20Deaths%20FY1998%20-%20FY2017.pdf (accessed on 2 April 2018).
- Lomonaco, C. U.S. Mexico Border: The Season of Death. PBS Frontline World. 2006. Available online: https://www.pbs.org/frontlineworld/blog/2006/06/usmexico_border_1.html (accessed on 2 April 2018).
- United Nations Education, Scientific, and Cultural Organization (UNESCO), Disaster Risk Reduction. Available online: http://www.unesco.org/new/en/natural-sciences/special-themes/disaster-risk-reduction/natural-hazards/hydro-meteorological-hazards/ (accessed on 2 April 2018).
- National Weather Service (NWS). Storm Events Database. Directives Systems. 2018. Available online: http://www.nws.noaa.gov/directives/010/010.php (accessed on 2 April 2018).
- Pitts, Swanya H., Texas State Historical Association (TSHA). Sanderson, Tx. Available online: https://tshaonline.org/handbook/online/articles/hjs07 (accessed on 2 April 2018).
- Coates, L. Flood Fatalities in Australia, 1788–1996. Aust. Geogr. 1999, 30, 391–408. [Google Scholar] [CrossRef]
- Sharif, H.; Hossain, M.; Jackson, T.; Bin-Shafique, S. Person-Place-Time Analysis of Vehicle Fatalities Caused by Flash Floods in Texas. Geomat. Nat. Disasters Risk 2012, 3, 311–323. [Google Scholar] [CrossRef]
- Singh, O.; Singh, J. Lightning fatalities over India: 1979–2011. Meteorol. Appl. 2015, 22, 770–778. [Google Scholar] [CrossRef]
- Navarrete-Aldana, N.; Cooper, M.A.; Holle, R.L. Lightning fatalities in Colombia from 2000 to 2009. Nat. Disasters 2014, 74, 1349–1362. [Google Scholar] [CrossRef]
- Elsom, D. Deaths and injuries caused by Lightning in the United Kingdom: Analyses of two databases. Atmos. Res. 2001, 56, 325–334. [Google Scholar] [CrossRef]
- Curran, E.; Holle, R.; Lopez, R. Lightning Casualties and Damage in the United States from 1959 to 1994. J. Clim. 2001, 13, 3448–3464. [Google Scholar] [CrossRef]
- Badoux, A.; Andres, N.; Techel, F.; Hegg, C. Natural Disaster Fatalities in Switzerland from 1946 to 2015. Nat. Disasters Earth Syst. Sci. 2016, 16, 2747–2768. [Google Scholar] [CrossRef]
- Texas Demographic Center. Projections of the Population of Texas and Counties in Texas by Age, Sex and Race/Ethnicity for 2010–2050. 2014. Available online: http://txsdc.utsa.edu/Data/TPEPP/Projections/ (accessed on 2 April 2018).
- Shaftel, H. NASA, Global Climate Change, Vital Signs of the Planet, (2018). Climate Change: How Do We Know? Available online: https://climate.nasa.gov/evidence/ (accessed on 2 April 2018).
- Pierce, J.; Morley, S.; West, T.; Upton, L.; Banks, L. Improving Long-Term Care Facility Disaster Preparedness and Response: A Literature Review. Disaster Med. Public Health Preparedness 2017, 11, 140–149. [Google Scholar] [CrossRef] [PubMed]
- Dosa, D.; Hyer, K.; Brown, L.; Artenstein, A.; Polivka-West, L.; Mor, V. The controversy inherent in managing frail nursing home residents during complex hurricane emergencies. J. Am. Med. Dir. Assoc. 2008, 9, 599–604. [Google Scholar] [CrossRef] [PubMed]
- Dosa, D. To Evacuate or Not to Evacuate: Lessons Learned from Louisiana Nursing Home Administrators Following Hurricanes Katrina and Rita. J. Am. Med. Dir. Assoc. 2007, 8, 142–149. [Google Scholar] [CrossRef] [PubMed]
- Weather Underground. Prepare for a Tornado. Available online: https://www.wunderground.com/prepare/tornado (accessed on 16 April 2018).
- Woollaston, V. Lightning is at its most powerful at 8am in the morning but more storms occur in the afternoon, Daily Mail 2015. Available online: http://www.dailymail.co.uk/sciencetech/article-2998781/Lightning-powerful-8am-morning-storms-occur-afternoon.html (accessed on 16 April 2018).
Figure 1.
Primary disaster resulting in largest number of deaths per county. Dark grey: no one predominant disaster. Light grey: No hydrometeorological disaster fatalities reported.
Figure 1.
Primary disaster resulting in largest number of deaths per county. Dark grey: no one predominant disaster. Light grey: No hydrometeorological disaster fatalities reported.

Figure 2.
Total Fatalities from natural disasters in Texas from 1959 to 2016 with 10 year rolling average (red dashed line). The solid line represents the linear trend.
Figure 2.
Total Fatalities from natural disasters in Texas from 1959 to 2016 with 10 year rolling average (red dashed line). The solid line represents the linear trend.

Figure 3.
Cumulative number of fatalities (all disasters).

Figure 4.
Normalized Fatality Rate from hydrometeorological disasters in Texas from 1959 to 2016. The solid line represents the linear trend.
Figure 4.
Normalized Fatality Rate from hydrometeorological disasters in Texas from 1959 to 2016. The solid line represents the linear trend.

Figure 5.
Annual fatality rate in Texas for six disaster types: flooding, wind, tornado, cold, lightning, and heat: 10-year rolling average (dashed line) and normalized (fatalities per 10 million) trend line (green solid). Note: Heat fatalities are reported from 1978 to 2016.
Figure 5.
Annual fatality rate in Texas for six disaster types: flooding, wind, tornado, cold, lightning, and heat: 10-year rolling average (dashed line) and normalized (fatalities per 10 million) trend line (green solid). Note: Heat fatalities are reported from 1978 to 2016.

Figure 6.
Monthly distribution of hydrometeorological disaster fatalities (all fatalities).

Figure 7.
(a) Number of total fatalities (rolling 10-year averages) by season; (b) Normalized fatality rates by season.
Figure 7.
(a) Number of total fatalities (rolling 10-year averages) by season; (b) Normalized fatality rates by season.

Figure 8.
Distribution of hydrometeorological disaster fatalities by time of day.

Figure 9.
Raw number of hydrometeorological disaster fatalities by county.

Figure 10.
Total natural disaster fatalities considered in this study classified (a) by gender and (b) by age group
Figure 10.
Total natural disaster fatalities considered in this study classified (a) by gender and (b) by age group

Figure 11.
Hydrometeorological disaster fatalities classified (a) by reported location of occurrence and (b) by disaster type and location
Figure 11.
Hydrometeorological disaster fatalities classified (a) by reported location of occurrence and (b) by disaster type and location

Figure 12.
Fatalities Normalized by Population (per 100,000).


Table 1.
Definitions of Hydrometeorological Disaster Types.
| Disaster Type | Characteristics |
|---|---|
| Flooding | Floods and flash floods due to extreme rain caused by hurricanes *, tropical storms, or other rain storm events |
| ** Tornado | Wind event meeting the minimum classification of wind speed and ground contact |
| Lightning | Natural high voltage electrical discharge from atmosphere striking person or surface in proximity of person |
| Heat | Prolonged period of time with extremely high average temperature usually accompanied by drought |
| Cold Weather | Blizzards, snow storms, ice storms, and prolonged period of time with extremely low average temperatures |
| Wind | Extreme high winds causing damage but not meeting the minimum criteria of hurricanes or tornados |
| Other | Hail, water spouts, wildfires, or rain that directly resulted in some major structural damage (e.g., roof collapse) |
| Rip Current | Coastal specific disaster that includes people killed (drowned) in rip currents. Rip currents have only been tracked as of 1997 |
* The Saffir–Simpson hurricane wind scale (SSHWS), classifies hurricanes as Western Hemisphere tropical cyclones that exceed the intensities of tropical depressions and tropical storms with sustained winds of at least 74 mph (Category 1). ** The Enhanced Fujita scale (EF) classifies tornadoes based on wind speed and damage (once they have touch ground) from EF-0 (65–85 mph) to EF-5 (>200 mph).
Table 2.
Hydrometeorological Disaster Fatalities, source: NOAA (National Oceanic and Atmospheric Administration) Storm Data [24].
Table 2.
Hydrometeorological Disaster Fatalities, source: NOAA (National Oceanic and Atmospheric Administration) Storm Data [24].
| Disaster Type | Fatalities | % Total |
|---|---|---|
| Flooding * | 991 | 42.5 |
| Heat | 378 | 16.2 |
| Tornado | 333 | 14.3 |
| Lightning | 222 | 9.5 |
| Wind | 172 | 7.4 |
| Cold Weather | 160 | 6.9 |
| Other | 43 | 1.9 |
| Rip Current | 31 | 1.3 |
| Total | 2330 | 100 |
* Includes fatalities due to hurricanes and tropical storms.
Table 3.
Top 5 Texas counties (Raw Fatality Rate). source: NOAA Storm Data (1959–2016) [24].
Table 3.
Top 5 Texas counties (Raw Fatality Rate). source: NOAA Storm Data (1959–2016) [24].
| Rank | County | Fatalities |
|---|---|---|
| 1 | Harris | 259 |
| 2 | Dallas | 228 |
| 3 | Bexar | 103 |
| 4 | Tarrant | 87 |
| 5 | Travis | 76 |
Table 4.
Top 5 Texas counties with highest fatality rate (and % of total) by hydrometeorological disaster. source: NOAA Storm Data (1959–2016) [24].
Table 4.
Top 5 Texas counties with highest fatality rate (and % of total) by hydrometeorological disaster. source: NOAA Storm Data (1959–2016) [24].
| Heat (76%) | Tornado (45%) | Wind (28%) | Flooding (34%) | Lightning (31%) | Cold (30%) | ||||||
|---|---|---|---|---|---|---|---|---|---|---|---|
| Harris | 124 | Wichita | 47 | Nueces | 16 | Harris | 85 | Harris | 29 | Dallas | 16 |
| Dallas | 113 | Reeves | 30 | Harris | 10 | Bexar | 84 | Jefferson | 12 | Potter | 12 |
| Tarrant | 22 | Williamson | 29 | Dallas | 8 | Dallas | 65 | Dallas | 11 | McLennan | 7 |
| Montgomery | 16 | Lubbock | 26 | Brazoria | 7 | Travis | 59 | Tarrant | 9 | Tarrant | 7 |
| Travis | 12 | Donley | 17 | Denton | 7 | Tarrant | 43 | Bexar | 8 | Castro | 6 |
Table 5.
Definitions of Hydrometeorological Disaster Fatality Locations.
| Location | Definition |
|---|---|
| In Water | Streams, river, bayous, oceans, floods, etc. and includes activities such as swimming, boating, surfing, and working on oil rigs |
| By Water | Boat docs, levies, beaches or other types of shoreline appurtenances |
| Temporary or non-Permanent Shelters | Tents, car ports, trees, and other temporary shelters that do not have a foundation (excluding umbrellas) |
| Outside | People who were outside but not in or near water, people standing in lawns, in construction sites that did not offer shelter, in ball fields, parks, golf courses, etc. People seeking shelter under umbrellas are also included. People standing/sitting near or on top of personal vehicles that are not along a transportation rout are included in outside (e.g., people walking from their home to their car who died before reaching their vehicle, people sitting on top of trucks in fields) |
| Transportation Route | Roadways, freeways or toll ways, parking lots, sidewalks or air travel routes. People walking along roads who hid behind a vehicle right before the disaster are categorized under transportation routes. Fatalities in vehicles were not assumed to be along transportation routes and were classified as unknown unless the description indicated a transportation route. Exclusion: people hiking or traveling along non-established routes by foot were not included in this category, and instead were classified as “outside” |
| Mobile Home | Standard and double-wide mobile homes |
| Permanent Residence | Domiciles that have a foundation, including but not limited to brick houses, frame houses, and apartment buildings |
| Public and Permanent Buildings | Schools, restaurants, airports, and other buildings with foundations that are not residences |
| Other/Unknown | All other locations not described by any of the other location categories listed or if the location was not specified |
© 2018 by the authors. Licensee MDPI, Basel, Switzerland. This article is an open access article distributed under the terms and conditions of the Creative Commons Attribution (CC BY) license (http://creativecommons.org/licenses/by/4.0/).
Share and Cite
MDPI and ACS Style
Paul, S.H.; Sharif, H.O.; Crawford, A.M. Fatalities Caused by Hydrometeorological Disasters in Texas. Geosciences 2018, 8, 186. https://doi.org/10.3390/geosciences8050186
AMA Style
Paul SH, Sharif HO, Crawford AM. Fatalities Caused by Hydrometeorological Disasters in Texas. Geosciences. 2018; 8(5):186. https://doi.org/10.3390/geosciences8050186
Chicago/Turabian StylePaul, Srikanto H., Hatim O. Sharif, and Abigail M. Crawford. 2018. "Fatalities Caused by Hydrometeorological Disasters in Texas" Geosciences 8, no. 5: 186. https://doi.org/10.3390/geosciences8050186
Note that from the first issue of 2016, this journal uses article numbers instead of page numbers. See further details here.