Article

Selected Metal Content and Binding Behaviour in Riverbed Sediments of the Kavala–Philippi Area (Northern Greece)

by
Katerina Giouri
1,*,
Vasilios Melfos
1,
Lamprini Papadopoulou
1,
Michael Vavelidis
1 and
Dimitrios Alifragkis
2
1
Department of Mineralogy-Petrology-Economic Geology, School of Geology, Aristotle University of Thessaloniki, 54124 Thessaloniki, Greece
2
Laboratory of Forest Soil Science, School of Forestry and Natural Environment, Aristotle University of Thessaloniki, 54124 Thessaloniki, Greece
*
Author to whom correspondence should be addressed.
Geosciences 2018, 8(5), 187; https://doi.org/10.3390/geosciences8050187
Submission received: 31 March 2018 / Revised: 6 May 2018 / Accepted: 15 May 2018 / Published: 19 May 2018

Abstract

:
The broader Philippi area (NE Macedonia, Northern Greece), which was chosen for the present study, is characterized by the presence of various metals. An approach to the correlation of selected parameters (grain-size distribution, Al2O3, CaO, Fe2O3, MnO, SiO2 content, environmentally available concentrations of Cu and Zn) was carried out in samples collected downstream of Palea Kavala River and Kryoneri and Philippi streams. The abundance of Cu, Fe, Mn, and Zn in relation to four binding fractions (exchangeable, bound to carbonates, Fe–Mn oxides, organic matter complexes) was also investigated. The enrichment of the studied metals was determined by evaluating the enrichment factor (EF) and geo-accumulation index (Igeo). Considering the results, Si was the most abundant major element oxide in sediments, followed by Al, Ca, Fe, and Mn. The sediments are dominated by sand and reveal minor Cu and Fe enrichment and moderate Mn and Zn enrichment. Statistical analyses revealed a significant correlation between Cu, Fe, Mn, and Zn, suggesting their common sources. They probably originate naturally, since the weathering of metal assemblages occurring in the broader Philippi area, comprising minerals such as chalcopyrite, pyrite, goethite, pyrolusite and sphalerite, may contribute to the concentrations of these elements in the sediments.

1. Introduction

The origin of metals in the environment can be attributed either to natural sources (soil erosion, rock weathering, and forest fires) or to anthropogenic ones (agriculture, irrigation, mining and industrial activities, and waste discharge). Due to their significant mobility, reactivity and bioavailability, metals can pose a potential threat to both ecosystems and human health. They enter the human body through the food chain via complicated biochemical mechanisms and processes like bioaccumulation and biomagnification [1,2,3,4].
When discharged in aquatic systems, metals are distributed during their transport between the bottom sediments and the overlying water column. In oxidized environments the metals are released from the mineral compounds, remobilize and so contaminate the water [5,6,7].
The variety of their physical and chemical properties makes sediments capable of acting both as carriers and potential sources of contaminants. They are comprised of different fractions including various particle sizes and different sediment phases such as carbonates, Fe–Mn oxides and organic matter. Contaminants can be bound to these phases by processes like adsorption, precipitation and co-precipitation. Moreover, the properties of each binding phase combined with the binding mechanisms control the mobility and, hence, the distribution of each metal [8,9,10]. It is apparent, therefore, that sequential extraction provides detailed information regarding the identification of the main binding site, the strength of the element binding to the particulates and the phase associations of metals in sediments [1,11,12,13]. As a result, the determination of physical and chemical characteristics of sediments is very important when assessing the bioavailability of metals and the quality of the aquatic environment [14,15,16,17].
Many researchers have used numerous enrichment quantification methods in order to assess the impact of metal contamination in aquatic environments. As a result, there is a considerable variation of methodologies in order to quantify metal contamination on a specific site [18,19,20,21,22]. These methodologies include numerical approaches based on the identification of anomalous metal concentrations by normalizing their contents to the background value of one element. The latter must be a significant constituent of the major trace metal carriers and reflect their granular variability in the sediments [18,19,22,23,24,25].
Northern Greece is characterized by a large number of mineral deposits including skarn, porphyry, epithermal, carbonate replacement, intrusion-related and vein ore types [26]. One of the most significant metallogenic regions is the Palea Kavala area, which extends north of Kavala and towards Philippi (Figure 1).
Previous environmental studies have been carried out in the large region of Kavala Prefecture [27,28,29,30,31,32,33]. The geochemistry and metal concentrations of surface soils and sediments was mainly investigated in the immediate vicinity of Kavala City and its port [31,32,33]. Metal content in waters and sediments of Palea Kavala River has also been studied [28,29,30], as well as the concentrations of trace elements in Philippi peatland [27]. The present study provides information about the metal content in sediments of the wider Kavala–Philippi area, with the sampling area extending further than the port and the city of Kavala. The study area is located in the northeastern part of Macedonia (Northern Greece). The geological bedrock comprises various rock formations and metals, and anthropogenic activities like surface mining and agriculture take place in the region. The mutual relationships between selected metals and various mineral components were investigated for the first time in riverbed sediments of the Kavala–Philippi area. The correlations between four sediment fractions were used in order to determine the binding behaviour of metals. The enrichment of selected metals was also evaluated in the studied sediment samples.

2. Geological Setting

The study area belongs to the Pangeon unit, part of the Southern Rhodope Core Complex, representing a large metamorphic core complex that was exhumed along the Strymon detachment fault between the upper Oligocene and the middle Miocene. The lithology of the Pangeon unit includes Paleozoic–Mesozoic gneisses overlain by marbles with schist intercalations [34,35,36]. These rocks were intruded by the Kavala (or Symvolon) pluton of a Miocene age (22–21 Ma; [37]). This pluton is an I-type intrusion and mainly consists of amphibole-biotite granodiorite with subordinate amounts of tonalite, diorite, monzogranite, and monzodiorite. Alluvial sediments of a Quaternary age consisting of clays, sands and gravels overlie the crystalline rocks in the western part of the studied area and form the Philippi basin (Figure 1).
A total of approximately 150 minor and major base and precious metal occurrences, mostly weathered and oxidized, are spread in an area of about 100 km2 [40,41,42,43]. These metal occurrences have a magmatic-hydrothermal origin and are found within the Kavala pluton, as well as in the surrounding metamorphic rocks [41,42,43]. Five different metal assemblages, including Fe–Mn– (Pb–Zn–Ag), Fe–Mn–Au, Fe–As–Au, Fe–Cu–Au and Bi–Te–(Pb–Sb–Au), exhibit a zonal distribution around the magmatic intrusion and contain complicated primary and secondary metallic mineral paragenesis. Primary minerals consist of pyrite, arsenopyrite, chalcopyrite, galena, sphalerite, tetrahedrite-tennantite, with subordinate pyrrhotite, bismuthinite, petzite, lillianite, proustite, pyrargyrite, argentite, cosalite, tetradymite, jalpaite, stephanite and native gold and silver. The secondary minerals comprise mainly goethite, lepidocrocite, hematite, covellite, chalcocite, malachite, smithsonite, cerussite, mimetite, siderite, arseniosiderite, scorodite, jarosite, pyrolusite, manganite, manganosite, cryptomelane, todorocite, nsutite [40,41,42,43,44].
Considerable underground and surface mining activities took place during Classical and Roman times for gold or lead–silver and in modern times (1904–1914) for iron, manganese, zinc and lead [40,42,43,45]. In the vicinity of the mines, large piles of mining wastes, mainly from recent activities, are spread along the rivers and streams. The wastes are eroded and significant quantities of the metals are diffused in the aquatic environment of the river drainage systems and transported downhill in the Philippi basin.

3. Materials and Methods

3.1. Study Area Description

For the purposes of the present study, a total of six samples were collected from the sediments of the Palea Kavala River and the Kryoneri and Philippi streams. The river and the streams originate from the southwest part of the Lekani Mountains and flow towards the mineralized Philippi plain, between Kavala City and Philippi. While flowing towards the exit of their catchment area, the streams and rivers that drain the Kavala–Philippi region pass through agricultural cultivated lands. They finally discharge in a complicated system of drainage trenches, which end in the Philippi peatland (Figure 1).

3.2. Samples Collection

Six sites were selected for the sediment collection, located along three different branches of the main drainage system. The study was mainly focused on Palea Kavala River as well as on the two streams of Kryoneri and Philippi, since they flow among the ore mineralization occurrences and the old mining wastes. When sampling sites are close, then significant variation in the geochemical background is not expected. Although numerous metal occurrences are present in the study area, neither their dimensions are specific nor do they follow any geometric distribution. Hence, the metals dispersion in the area is non-uniform. Furthermore, the sediments used in the present study were chosen according to their element content and origin, so as to represent differential behaviour with regard to metal sorption. The number of samples was selected taking into account these aforementioned facts. Consequently, samples S1, S2 and S3 were collected downstream the Palea Kavala River, samples S4 and S5 along the Kryoneri stream and sample S6 from the Philippi stream (Figure 1). The sediment samples were collected using an acid-washed plastic shovel. Afterwards they were placed in clean polyethylene bags. They remained sealed until they were brought to the laboratory for further preparation.

3.3. Samples Preparation

When in the laboratory at the Department of Mineralogy, Petrology and Economic Geology of the Aristotle University of Thessaloniki, the samples were dried at 60 °C in an oven so as to remove the adsorbed moisture. The dried samples were sieved through a 2 mm and a 0.063 mm sieve in order to obtain the coarse- and fine-grained fractions of each sample.

3.4. Samples Analysis

In the present study, the fine-grained fraction (<0.063 mm) of each sample has been used for chemical analysis and metal extraction. This fraction has also been used by many researchers in the investigation of sediments metal contamination. This is due to the fact that the fine particles reveal large specific area and as a consequence the metal contaminants mainly remain in this fraction [6,17,46,47,48].

3.4.1. Metal Content

The content of the major element oxides Al2O3, CaO, Fe2O3, MnO and SiO2 was determined by X-Ray Fluorescence (XRF) at the Electron Microscopy Laboratory of Aristotle University (Thessaloniki). For the application of the method, fused discs were prepared for every sample with a mixture of 35% Li2B4O7/65% LiBO2 as a flux and NH4I as releasing agent. One gram of this mixture was placed in an Au–Pt alloy crucible and heated at 1100 °C with simultaneous agitation. Subsequently, it was cast in an Au–Pt disc mould and cooled in order to obtain the fused disc for the analysis. Environmentally available concentrations of Cu and Zn were determined by Inductively Coupled Plasma-Mass Spectrometry (ICP-MS), at the Acme Analytical Laboratories, in Vancouver, Canada. Bulk metal extraction of sediments was performed via the aqua regia digestion, an HCl–HNO3 mixture in a 3:1 ratio.

3.4.2. Metals Fractionation

The determination of metals fractionation was carried out by following the sequential extraction described by Tessier et al. [11]. The detailed procedures employed in this process were as follows:
  • Exchangeable fraction: 1 g of the dried sediment sample was extracted with 8 mL of 1 M MgCl2 (pH = 7) for 1 h at room temperature (20–25 °C) with continuous agitation.
  • Fraction bound to carbonates: the residue from the exchangeable fraction was extracted with 8 mL of 1 M NaOAc (adjusted to pH = 5 with HOAc) for 5 h at room temperature with continuous agitation.
  • Fraction bound to Fe-Mn oxides: the residue from the carbonates fraction was extracted with 20 mL of 0.04 M NH2OH∙HCl in 25% (v/v) HOAc, for 6 h at 96 °C with occasional agitation.
  • Fraction bound to organic matter: the residue from the Fe-Mn oxides fraction was extracted with 3 mL of 0.02 M HNO3 and 5 mL of 30% H2O2 (adjusted to pH = 2 with HNO3) for 2 h at 85 °C with occasional agitation. After cooling, 3 mL of H2O2 were added to the extracted solution and the sample was heated again to 85 °C for 3 h with occasional agitation. Finally, 5 mL of 3.2 M NH4OAc in 20% (v/v) HNO3 were added to the solution and agitated continuously for 30 min at room temperature.
After each extraction step, the extracts were separated by the solids by centrifuging at 4000 rpm for 20 min. The supernatant was filtered and collected in polyethylene bottles where it was kept until further analysis. The residue was washed with 8 mL of deionized water and centrifuged for 10 min. This second supernatant was discarded, while the obtained extracts were used for determining the binding amounts of Cu, Fe, Mn and Zn. The determination was performed by Flame Atomic Absorption Spectroscopy (FAAS) at the Laboratory of Forest Soil Science, School of Forestry and Natural Environment, Aristotle University of Thessaloniki.

3.5. Data Interpretation

The results of the present study were analysed through basic descriptive statistics methods: median, mean, standard deviation and variation were calculated for each variable. Bivariate statistics with the non-parametric Spearman’s correlation coefficient analysis (CA) was conducted for insights of the relationship between the studied parameters. Multivariate analysis was conducted for better comprehension of some possible geochemical processes occurring in the streams environment [49,50]. The variations of parameters were determined on the basis of cluster analysis. The average linkage between groups was used to link the clusters. Cluster analysis was based on standardized data (z scores), the Euclidean distance was used as similarity measurement while the results are reported in the form of a dendrogram. Correlation was assumed to be statistically significant at p < 0.05. Principal component analysis (PCA) was performed with Varimax normalized rotation, which facilitates the interpretation of the output results by minimizing the number of variables, taking into consideration the factors with eigenvalues >1. The statistical analyses were performed using SPSS Statistics for Windows (version 25.0, SPSS Inc., Chicago, IL, USA).
In order to determine the metal enrichment in the sediments two indices were employed: the Enrichment Factor (EF) and the Geo-accumulation Index (Igeo). These indices are mainly based on the normalization of the studied element against a reference element, which is characterized by low variability. So, the choice of background is very important in the calculation of both used indices. The most common normalizing elements are Fe and Al, because it is suggested that their origin is geogenic [21,23,24,25]. However, in the study area extensive Fe-rich mineralizations and mining wastes occur and therefore Fe was excluded from using it as a reference element. On the contrary, Al is not affected by any geological or anthropogenic factors and this is the reason that it was chosen as the reference element to normalize the metal concentrations. The geochemical background values used for calculating the two indices were the ones introduced by Turekian and Wedepohl [51] as average shale content.
The enrichment factor (EF) values were calculated according to the Salomons and Förstner [5] equation:
E F = ( M e t a l A l ) S a m p l e ( M e t a l A l ) B a c k g r o u n d .
EF values were interpreted as suggested by Sakan et al. [52]: EF < 1 indicates no metal enrichment; EF = 1–3 shows a minor enrichment; EF = 3–5 a moderate enrichment; EF = 5–10 a moderately severe enrichment; EF = 10–25 a severe enrichment; EF = 25–50 a very severe enrichment; and EF > 50 indicates an extremely severe enrichment.
The geo-accumulation Index (Igeo) for each metal was defined by the equation of Müller [53]:
I g e o = log 2 ( C n 1.5 × B n ) ,
where Cn is the analysed concentration of the studied metal in the sample and Bn is the geochemical background concentration of the metal for the average shale. The 1.5 factor is the background matrix correction factor due to the lithogenic effects [18,48]. Müller [18] has distinguished seven classes for the resulting Igeo values: Class 0 (practically uncontaminated) with Igeo ≤ 0; Class 1 (uncontaminated to moderately contaminated) with 0 < Igeo < 1; Class 2 (moderately contaminated) with 1 < Igeo < 2; Class 3 (moderately to heavily contaminated) with 2 < Igeo < 3; Class 4 (heavily contaminated) with 3 < Igeo < 4; Class 5 (heavily to extremely contaminated) with 4 < Igeo < 5; Class 6 (extremely contaminated) with Igeo > 5.

4. Results and Discussion

4.1. Grain Size Distribution of Sediments

The six sediment samples were classified according to their grain size in gravel (>2 mm), sand (2 mm to 0.063 mm) and silt + clay (<0.063 mm). Table 1 presents the results of sediments grain size analysis, while the grain size composition (gravel−sand− silt + clay ratios) of the studied sediments are shown in the ternary diagram (Figure 2) of Folk [54]. In most of the samples the sandy fraction predominates with a mean of 60.12 ± 9.24 wt %, though it reveals the second highest variation among the three components (26.35 wt %) with the gravel fraction following (32.85 wt %). The gravel fraction can be considered as subordinate to the sandy fraction (mean 26.91 ± 11.91 wt %) whereas the presence of the fine grained component (silt + clay) is relatively limited (mean 12.97 ± 8.81 wt %). According to the textural classification of the gravel bearing sediments introduced by Folk [54], the samples S1, S4 and S5 are classified as gravelly muddy sands, S2 as sandy gravel, S3 as a gravelly sand and S6 as muddy sandy gravel. As a conclusion, the samples are dominated by sand.
Samples S1–S3, which were collected along the Palea Kavala River, did not show any trend in terms of a decrease or increase in their mean size, although such a trend should be expected since sediments usually become richer in fine-grained content towards the water flow direction. On the contrary, among these three samples, sample S1, which is located upstream, contains the largest proportion of the fine fraction (25.18 wt %), whereas sample S3, which is downstream, has a lower fine fraction amount (4.07 wt %). This is probably attributed to the function of the river water flow. In the presence of abrupt hydrodynamic variations, it is observed that the coarsest sediments rapidly match the transport capacity. On the other hand, the finest material is less suitable to quick hydrodynamic variations. Moreover, when the stream velocity increases, the finest bed material may not be enough to satisfy the requirements of the transport capacity. Generally the mean diameter of the transported material is less than the mean diameter of the bed-forming material [55,56]. This is the case with the Palea Kavala River since a resuspension of the sediment particles is probably caused by an approximately 10 m high waterfall, which is located between samples S2 and S3. The flow speed is drastically increased at the waterfall, constituting a rapid change in the hydrodynamic condition of the river and as a consequence the suspended fine particles in the water column are transported at longer distances.

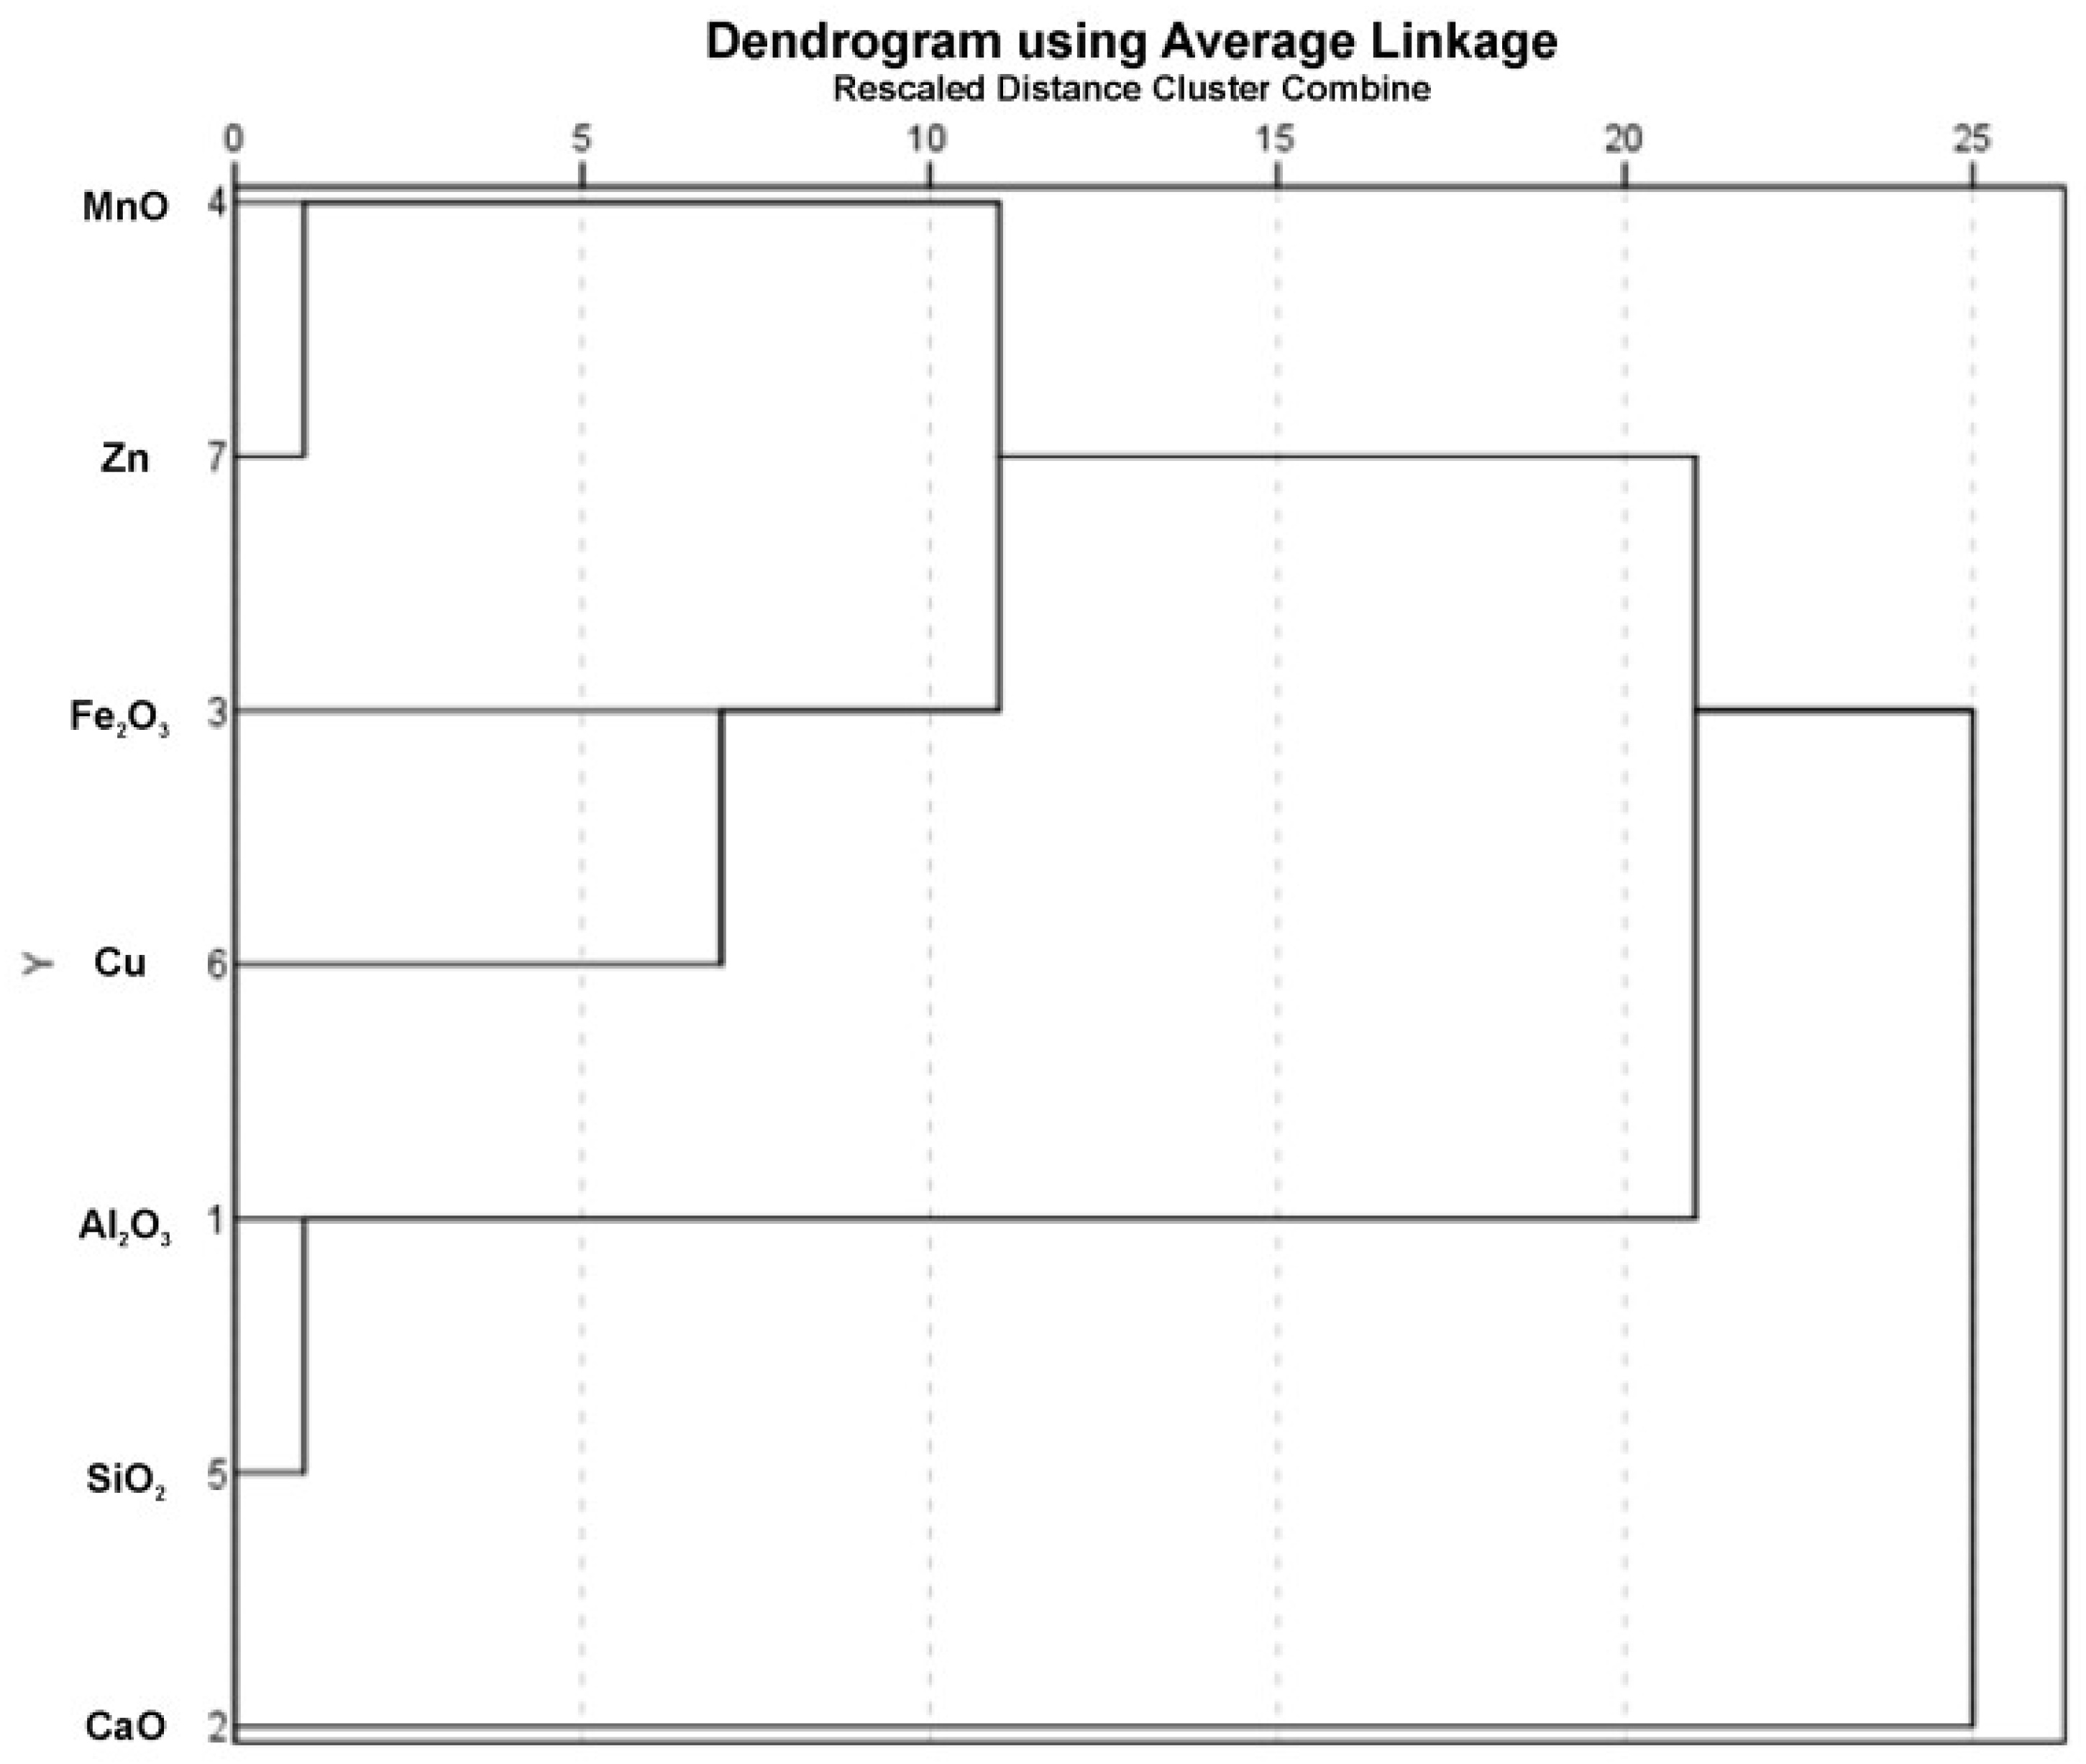
4.2. Elemental Content of Sediments

The results of the analysed elemental concentrations in the studied samples are presented in Table 2. In terms of the major element oxides, SiO2 is the most abundant with a mean of 40.28 ± 12.03 wt %. The second most abundant is Al2O3 (mean 13.28 ± 3.95 wt %). Concentrations of CaO are also significant revealing an average of 9.12 ± 11.08 wt %, followed by Fe2O3 (mean 7.31 ± 2.38 wt %) and MnO (mean 0.30 ± 0.35 wt %). Concerning the environmentally available trace elements, concentrations of Zn are more elevated (mean 171.08 ± 76.65 μg·g−1) in comparison to Cu (mean 59.14 ± 18.60 μg·g−1).
A correlation matrix was obtained in order to investigate the relationships between the determined elemental concentrations (Table 3). Metal occurrences in the study area do not form any particular shape. So the correlation coefficient between any two metals can provide information about the metal dispersion under significant conditions. High correlation coefficient between any two metals implies common sources, identical behaviour during transport and mutual dependence. On the other hand, the absence of significant correlation suggests that the concentrations of these metals geochemically depend on a combination of sediment phases and the relations among them [57,58].
A more detailed examination of the relationships between the analysed parameters, demonstrates that Fe2O3 reveals significant correlation with MnO (ρ = 0.886, p = 0.019). The correlation of Zn with Fe2O3 (ρ = 0.771, p = 0.07) and mainly with MnO (ρ = 0.943, p = 0.005) reveals that Zn is bound with the Fe–Mn oxides. The same can be partially concluded for Cu, because of its marginally significant positive correlation with MnO (ρ = 0.771, p = 0.07). These positive correlations among the analysed metals are attributed to the sediments contamination by the extensive ore mineralizations in the Kavala–Philippi area (Figure 1).
Considering the marginally significant positive correlation that also exists between Al2O3 and SiO2 (ρ = 0.771, p = 0.07), the presence of these elemental oxides is probably related to the clay minerals (aluminium phyllosilicates), which mainly occur in the fine-grained particles of sediments [59,60,61].
Figure 3 presents the hierarchical cluster analysis that was applied to the z scores of the determined elemental concentrations in the studied sediment samples, in order to investigate the associations between them. As shown in Figure 3, the first group includes MnO, Zn, Fe2O3 and Cu, then Al2O3 and SiO2 form the second group and both groups subsequently join CaO, which can be considered a third one. The strongest associations were observed for the pairs of MnO–Zn and Al2O3–SiO2, a result that is in agreement with the correlation analysis. As presented in Table 3, a positive correlation was observed for MnO with Zn (ρ = 0.943) and for both of them with Fe2O3 (ρ = 0.771 and ρ = 0.886, respectively) with these three parameters forming a cluster. Copper joins them following in the first group of the dendrogram in Figure 3. The less strong association of Cu with Fe2O3 and MnO, which is depicted in Figure 3, is in agreement with the correlation analysis in Table 3 as well. Specifically, the correlation for the pairs Cu–Fe2O3 and Cu–MnO may be positive with the corresponding coefficients being 0.657 and 0.771, but their p-values reveal marginal significance (p = 0.15 and p = 0.07, respectively). The strong elemental association that was observed for the pair Al2O3-SiO2 is confirmed by the regarding correlation coefficient in Table 3 (ρ = 0.771, p = 0.07).
For the further identification of possible sources of the metals in the studied sediments, principal component analysis (PCA) was performed on Al2O3, CaO, Fe2O3, MnO, SiO2, Cu and Zn concentrations. PCA results are presented in Table 4, including factor loadings with Varimax rotation and Kaiser normalization, as well as eigenvalues. The extracted two components with eigenvalues >1 explain 94.43% of the total variance. The first principal component (PC1) accounts for 52.04% of the total variance, showing high positive loadings of Al2O3 (0.962), CaO (−0.990) and SiO2 (0.968). This suggests that these parameters are primarily from natural sources, such as the rock formations in the region. The second principal component (PC2) accounts for 42.39% of the total variance, showing high positive loadings of Fe2O3 (0.816), MnO (0.745), Cu (0.874) and Zn (0.955). The source of this component may be the ore mineralizations that occur in the Kavala–Philippi area, since they include elevated Fe, Mn, Cu and Zn concentrations. Thus, the origin of the metals in the studied river sediments is probably lithogenic with the erosion of the geological bedrock contributing to their concentrations.
The major mechanisms of metals accumulation in the sediments exchangeable, bound to carbonates, Fe–Mn oxides and organic fractions have different behaviour concerning remobilization, under changing environmental conditions [5,6,43,44]. The percentage of the studied metals’ content (Cu, Fe, Mn and Zn) in these four sediment fractions is presented in Figure 4.
The exchangeable fraction, which is considered to be weakly bound and may equilibrate with the aqueous phase, thus becoming more rapidly bioavailable, usually accounts for the lowest metals percentage. This is the case in the present study, since a minor percentage of Cu, Mn and even lower of Zn is bound to the exchangeable fraction. Likewise, a minor amount of Cu, Mn and Zn is bound to the carbonate fraction. Copper exists mainly in organic and Fe–Mn oxides bound fractions. In samples S1, S3 and S6 the largest amounts of organic-bound Cu were determined (49%, 70% and 52%, respectively). A percentage <10% of Cu is observed in the carbonate-bound fraction. Concerning Fe, it is clearly abundant in the Fe–Mn oxides bound fraction and less observed in the organic fraction. The same occurs for Mn. In samples S1, S3, S4 and S6 a percentage of approximately 10% of Mn is bound to the carbonate fraction. Most of Zn content is also determined in the Fe–Mn oxides bound fraction, followed by the organic and the carbonate fraction. In general, most of the metal content is bound to the Fe–Mn oxides fraction. The second most abundant is the organic bound fraction, with the carbonate fraction to follow.
Table 5 presents the correlation matrix that was obtained in order to interpret the associations of the selected metals binding behaviour in each one of the four binding fractions (exchangeable, bound to carbonates, Fe–Mn oxides and organic matter). Concerning the relationships between the metal concentrations in each of the binding fractions, a positive and statistically strong correlation is revealed between exchangeable bound Zn and exchangeable bound Mn (ρ = 0.794, p = 0.05). This is expected since, as shown in Figure 4, the amounts of exchangeable bound Zn and Mn are minimal (Table 5a). There is a moderate correlation for the pairs of carbonates bound Zn with carbonates bound Cu (ρ = 0.600) and carbonates bound Mn wuth carbonates bound Fe (ρ = 0.600), but their significance is near-marginal in both cases (p = 0.2). Furthermore, there is a negative but marginally significant correlation between carbonates bound Zn and Fe (ρ = −0.771, p = 0.07) (Table 5b). There is a strong, positive correlation between the oxides bound Fe and Mn, which is statistically significant (ρ = 0.943, p = 0.005). This is also expected, since, as shown in Figure 4, the largest parts of Fe (65–90%) and Mn (70–95%) are bound to the oxides fraction (Table 5c). Finally, in the fraction of metals released by the oxidation of the organic matter a strong and significant positive correlation is observed for the pair Fe–Mn (ρ = 0.886, p = 0.02), while an equally strong but negative correlation is evident for the organic bound Cu when forming pairs with organic bound Fe and Mn (ρ = −0.771 and ρ = −0.943, respectively) (Table 5d). Overall, an elevated correlation coefficient was detected for Zn with Mn when bound to the exchangeable fraction. An elevated correlation coefficient is also evident for the pair Fe–Mn when bound to both the organic and the Fe–Mn oxide fractions. It should be mentioned that these results are in agreement with the correlations revealed by the total metal concentrations, since in that case positive and significant correlations were exhibited between the exact same elemental pairs, Zn–MnO and Fe2O3–MnO (Table 3, Figure 3).
Concerning the interpretation of the associations between any two metal binding fractions, according to Tessier et al. [62], the most important factors under the same environmental conditions are the stability of metal complexation reactions and the metal input in the water bodies. Significant correlations between specific metals and various river or stream sediment phases are an implication that metal content variations in the bottom sediment samples and the aqueous phase comply well with metal discharging into the river waters. Therefore, the pairs that revealed the most elevated correlation coefficient in the present study (exchangeable bound Zn and exchangeable bound Mn, Fe–Mn oxides bound Fe and Fe–Mn oxides bound Mn, organic matter bound Fe and organic matter bound Mn) indicate that the heavy metals Cu, Fe, Mn and Zn originate from the same source.
The concentrations of the studied metals in the sediments are probably affected by the ore mineralizations that occur in the Kavala–Philippi area, since they include elevated Fe, Cu, Zn and Mn concentrations. Thus, it is strongly suggested that the origin of the metals in the studied river sediments is lithogenic and is associated with the erosion of the geological bedrock and soil materials. However, the physicochemical reactions that are involved in the binding behaviour of the metals with the sediment matrices are complicated. Therefore, reactions like the coagulation of colloidal materials and the complexation at the surface of particles, as well as between the contaminants and suspended solids, should be taken into account in order to specify the metal sources.

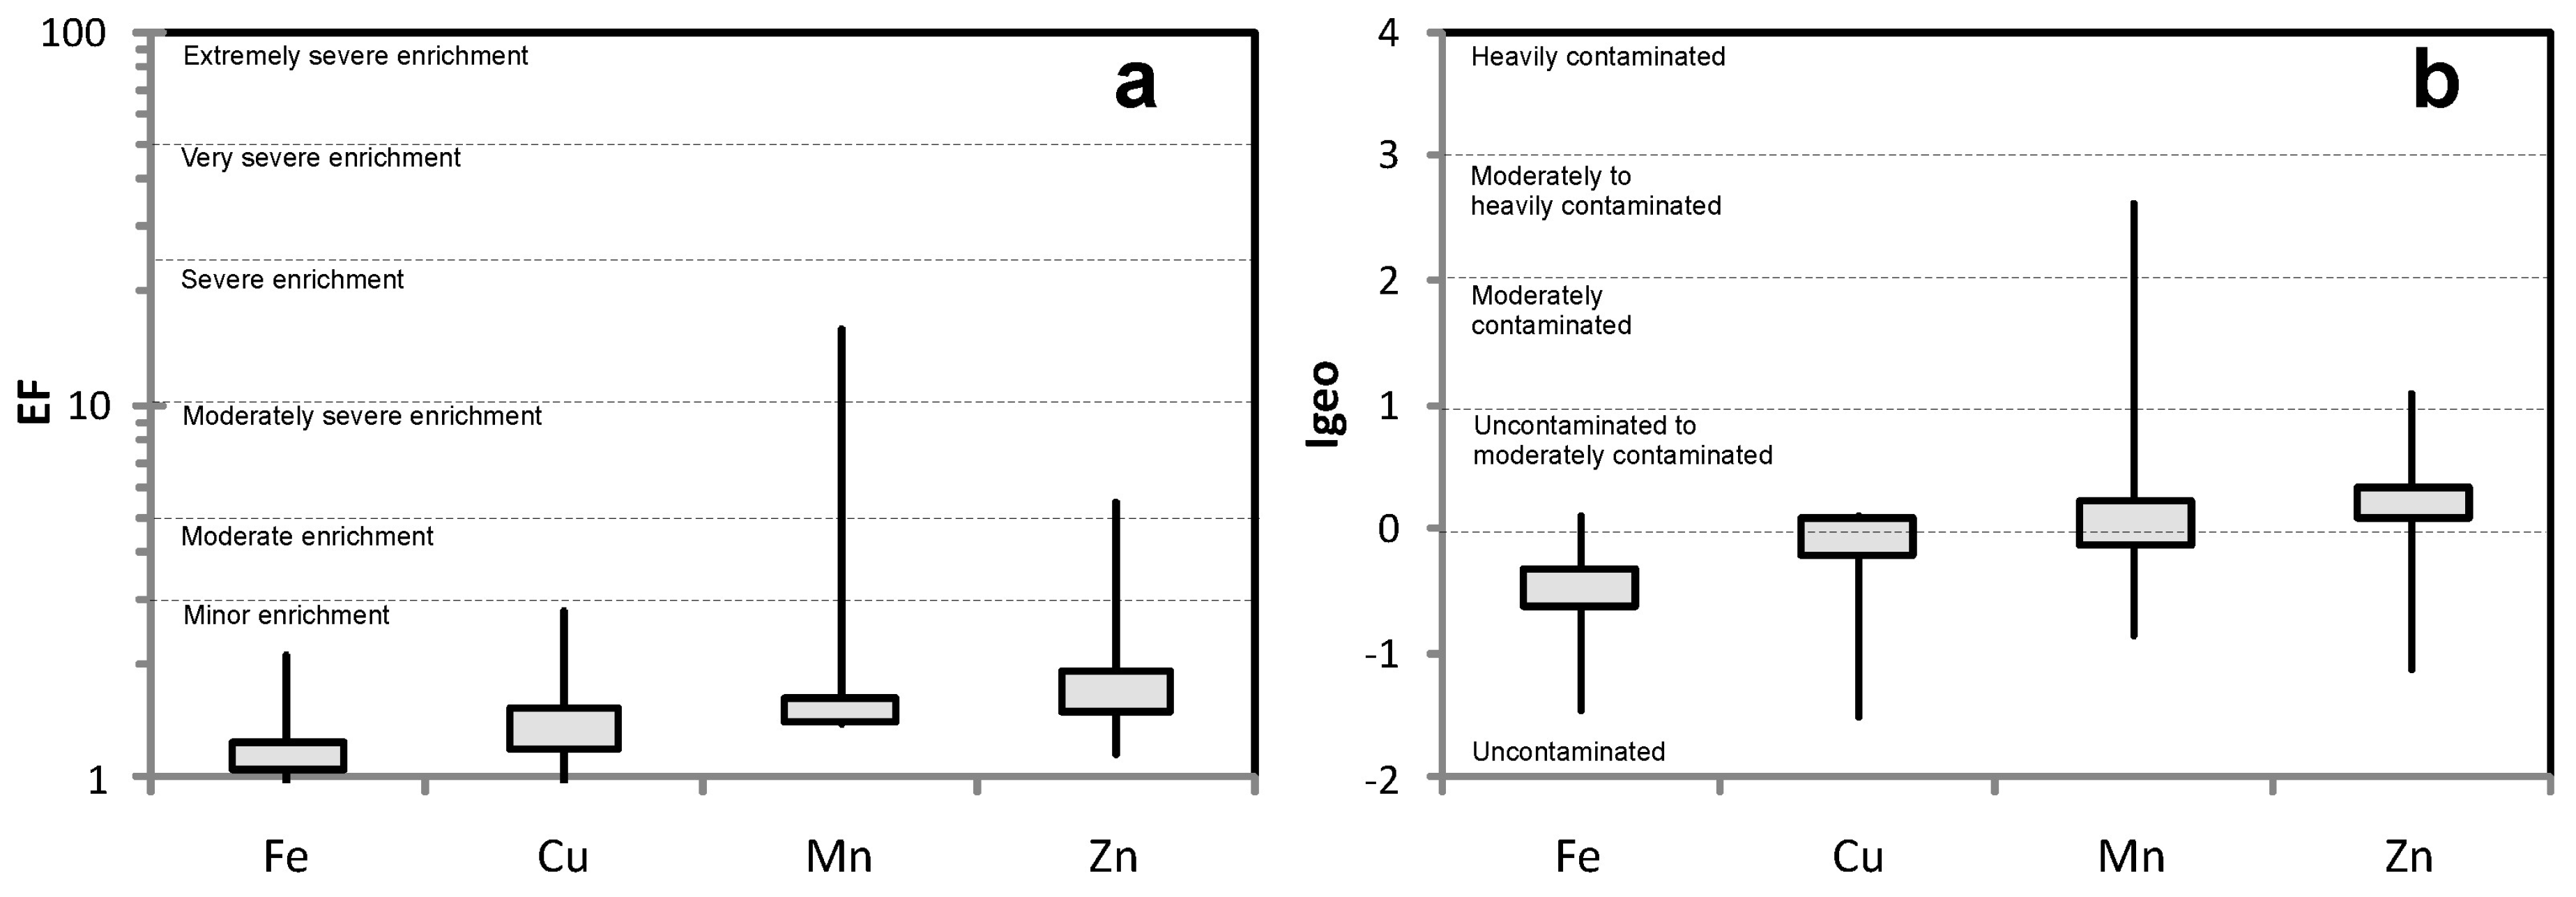
4.3. Metals Enrichment

The resulting EF and Igeo values of the selected metals for this study are presented in Table 6 and Figure 5. Based on the EF values, Fe and Cu exhibit minor enrichment. From Figure 5a it is obvious that there is a minor to severe enrichment for Mn, while a minor to moderately severe enrichment is observed for Zn. These two elements show elevated concentrations in only one sample (S2), which was collected downstream of the Palea Kavala River. The maximum Mn and Zn concentrations in sample S2 are much higher than their corresponding mean values (Table 2). The same occurs for the EF values, which are elevated for Mn and Zn in sample S2 as well. This is probably attributed to the fact that sample S2 is located very close to a mineralization occurrence which is rich in Mn and Zn contributing, therefore, to the concentrations of these elements in the sediment. Overall, it can be assumed that Fe and Cu enrichment is minor since most of their EF values are plotted in that field (Figure 5a), while Mn and Zn enrichment is moderate. Besides, as shown in Table 3, the metal pair Mn–Zn demonstrates a positive correlation coefficient (ρ=0.943), revealing probably similar chemical behaviour.
Calculated Igeo values present similar distribution with EF values (Figure 5b). The results indicate that the sediments are not contaminated with respect to Fe, while Cu levels range from uncontaminated to uncontaminated/moderately contaminated. Moreover, the sediments are uncontaminated to moderately–heavily contaminated with respect to Mn and uncontaminated to moderately contaminated concerning Zn. According to the results, Igeo values demonstrate a similar effect with EF values. Maximum concentrations of Mn and Zn are higher than their corresponding mean values. As a result, the Igeo values of Mn and Zn are elevated as well. Overall, by the classification of Igeo values it can be assumed that the studied sediment samples are mainly considered uncontaminated regarding Fe and Cu, with a degree of uncontaminated to moderately contaminated for Mn and Zn.
Consequently, the metal concentrations of the studied samples are relatively elevated due to the numerous ore mineralizations in the area, which contain a large number of primary and secondary metallic minerals. Primary minerals, through alteration, oxidation and erosion processes, release metal cations into the river, forming stable mineral compounds like oxides, carbonates or hydrous sulphates. All these minerals are distributed in the river sediments and, together with the primary sulphides, sulfosalts and oxides, may contribute to an extensive occurrence of contaminants [63,64,65,66]. In the case of the Kavala–Philippi area it is suggested that pyrite, arsenopyrite, pyrrhotite, goethite, lepidocrocite, hematite, siderite, arseniosiderite, chalcopyrite, covellite, chalcocite and malachite increase the Fe and Cu content. Zinc enrichment is attributed to minerals like sphalerite, tetrahedrite–tennantite and smithsonite. Since the ore mineralization mainly includes Fe–Mn metal assemblages [40,42,43], the elevated Mn concentrations are attributed to pyrolusite, manganosite, manganite, cryptomelane, todorocite and nsutite.

5. Conclusions

The results of the present study in the Kavala–Philippi area demonstrated that sand is the predominant fraction concerning the grain size distribution in the sediments. The gravel fraction is the second most abundant, whereas the fine-grained component is relatively limited. A positive correlation was observed between the pairs Al2O3–SiO2 and MnO–Fe2O3. Correlation of Cu and Zn with Fe2O3 and MnO reveals their bond with Fe–Mn oxides. In terms of the binding behaviour of metals in the sediment fractions, an elevated correlation coefficient was determined between the exchangeable bound Zn and Mn, as well as between Fe and Mn in both the Fe–Mn oxides and the bound organic matter. The mean values of metal enrichment factor (EF) values decrease in the order of Zn > Mn > Cu > Fe. In a similar way, geo-accumulation indexes (Igeo) followed the order Zn > Mn > Cu > Fe. As indicated by enrichment factor (EF) values, the studied sediment samples demonstrated minor enrichment for Fe and Cu and moderate enrichment for Mn and Zn. The results are similar regarding the geo-accumulation index (Igeo) values, according to which the sediment samples are mainly considered uncontaminated regarding Fe and Cu and uncontaminated to moderately contaminated for Mn and Zn. Cluster analysis revealed one group that includes MnO, Zn, Fe2O3 and Cu; a second group is formed by Al2O3 and SiO2, and both of these groups subsequently join Ca, which can be considered a third one. The first component of PCA is dominated by Al2O3, CaO and SiO2, while the second principal component includes Fe2O3, MnO, Cu and Zn. The correlation between the major oxides Al2O3, CaO and SiO2 suggests their lithogenic origin. Significant correlation between Cu, Fe, Mn and Zn suggests that these metals have common sources, mutual dependence, and identical behaviour during transport. Their origin is probably natural due to the weathering of the geological formations and of the Fe–Mn–(Pb ± Zn ± Ag), Fe–Mn–Au and Fe–Cu–Au ore mineralizations that occur in the region. However, research in the study area is in progress for a more detailed evaluation of the composition of the sediments, as well as for a more precise interpretation of the correlations between the binding behaviour of metals and sediment matrices. There is a lack of geochemical mapping data or data concerning the recording of contaminated sites and contaminated soils in the whole of Greece. Such information could significantly contribute to studies like the present one by reducing uncertainty in the interpretation of the relationships between various sediment parameters.

Author Contributions

M.V. provided critical feedback, contributed to the planning and supervised the research. V.M. assisted in shaping the research, interpreting the results and editing the manuscript. D.A., L.P. and K.G. were involved in processing the samples for further analysis. D.A. and K.G. performed the FAAS measurements and the interpretation of the results. L.P. performed the XRF analysis and processed the resulted data. K.G. performed the sampling and the interpretation of the results, wrote the manuscript and designed the figures. All authors discussed the results and participated in drafting and revising the manuscript.

Acknowledgments

The present research was carried out within the framework of the Ph.D. thesis of the first author, Katerina Giouri, and has been financially supported by the State Scholarships Foundation of Greece (I.K.Y.). Special thanks are due to the Editorial Board of the Geosciences, especially to Ms. Daisy Hu and Prof. Dr. Ariadne Argyraki for handling the review process of this paper. Dr. Anna Bourliva is gratefully acknowledged for her significant contribution in performing the statistical analysis of the data. We would like to thank the two anonymous reviewers for their constructive and fruitful comments, which significantly improved the initial manuscript.

Conflicts of Interest

The authors declare no conflict of interest.

References

  1. Singh, K.P.; Mohan, D.; Singh, V.K.; Malik, A. Studies on distribution and fractionation of heavy metals in Gomti river sediments—A tributary of the Ganges India. J. Hydrol. 2005, 312, 14–27. [Google Scholar] [CrossRef]
  2. Suthar, S.; Nema, A.K.; Chabukdhara, M.; Gupta, S.K. Assessment of metals in water and sediments of Hindon River, India: Impact of industrial and urban discharges. J. Hazard. Mater. 2009, 171, 1088–1095. [Google Scholar] [CrossRef] [PubMed]
  3. Chen, H.; Wang, J.; Chen, J.; Lin, H.; Lin, C. Assessment of heavy metal contamination in the surface sediments: A reexamination into the offshore environment in China. Mar. Pollut. Bull. 2016, 113, 132–140. [Google Scholar] [CrossRef] [PubMed]
  4. Zhang, C.; Shan, B.; Tang, W.; Dong, L.; Zhang, W.; Pei, Y. Heavy metal concentrations and speciation in riverine sediments and the risks posed in three urban belts in the Haihe Basin. Ecotoxicol. Environ. Saf. 2017, 139, 263–271. [Google Scholar] [CrossRef] [PubMed]
  5. Salomons, W.; Förstner, U. Metals in the Hydrocycle; Springer: Berlin, Germany, 1984; 349p. [Google Scholar]
  6. Förster, U.; Salomons, W. Mobilization of metals from sediment. In Metals and Their Compounds in the Environment; Merian, E., Ed.; VCH: Weinheim, Germany, 1991; pp. 379–398. [Google Scholar]
  7. Peng, J.F.; Song, Y.H.; Yuan, P.; Cui, X.Y.; Qiu, G.L. The remediation of heavy metals contaminated sediment. J. Hazard. Mater. 2009, 161, 633–640. [Google Scholar] [CrossRef] [PubMed]
  8. Allen, H.E. Partitioning of toxic metals in natural water-sediment systems. In Transport and Transformation of Contaminants near the Sediment Water Interface; De Pinto, J.V., Lick, W., Paul, J.F., Eds.; Lewis Publishers: Boca Raton, FL, USA, 1994; pp. 115–127. [Google Scholar]
  9. Tokalioglu, S.; Kartal, S.; Elçi, L. Determination of heavy metals and their speciation in lake sediments by flame atomic absorption spectrometry after a four-stage sequential extraction procedure. Anal. Chim. Acta 2000, 413, 33–40. [Google Scholar] [CrossRef]
  10. Farkas, A.; Erratico, C.; Vigano, L. Assessment of the environmental significance of heavy metal pollution in surficial sediments of the River Po. Chemosphere 2007, 68, 761–768. [Google Scholar] [CrossRef] [PubMed]
  11. Tessier, A.; Campbell, P.G.C.; Bisson, M. Sequential extraction procedure for the speciation of particulate trace metals. Anal. Chem. 1979, 51, 844–851. [Google Scholar] [CrossRef]
  12. Block, D.Z.R. Studies of the availability of toxic heavy metal elements in soil and sediments in the vicinity of lead smelting site (Germany). Water Air Soil Pollut. 1994, 78, 317–334. [Google Scholar]
  13. Baeyens, W.; Monteny, F.; Leermakers, M.; Bouillon, S. Evalution of sequential extractions on dry and wet sediments. Anal. Bioanal. Chem. 2003, 376, 890–901. [Google Scholar] [CrossRef] [PubMed]
  14. Förstner, U. Contaminated sediment. In Lecture Notes in Earth Sciences; Bhattacharij, S., Ed.; Springer: Berlin, Germany, 1989; pp. 1–157. [Google Scholar]
  15. Laws, E.A. Aquatic Pollution: An Introductory Text, 2nd ed.; John Wiley and Sons, Inc.: New York, NY, USA, 1993; 611p. [Google Scholar]
  16. Calmano, W.; Ahlf, W.; Förstner, U. Sediment quality assessment: Chemical and biological approaches. In Sediments and Toxic Substances; Calmano, W., Förstner, U., Eds.; Springer Verlag: Berlin, Germany, 1996; pp. 1–35. [Google Scholar]
  17. Kabata-Pendias, A. Trace Elements in Soils and Plants, 4th ed.; CRC Press: New York, NY, USA, 2011; 548p. [Google Scholar]
  18. Müller, G. Die Schwermetallbelstung der sedimente des Neckars und seiner Nebenflusse: Eine Bestandsaufnahme. Chemicer-Zeitung 1981, 105, 157–164. [Google Scholar]
  19. Hakanson, L. Ecological risk index for aquatic pollution control, a sedimentological approach. Water Res. 1980, 14, 975–1001. [Google Scholar] [CrossRef]
  20. Adamo, P.; Arienzo, M.; Imperato, M.; Naimo, D.; Nardi, G.; Stanzione, D. Distribution and partition of heavy metals in surface and sub-surface sediments of Naples city port. Chemosphere 2005, 61, 800–809. [Google Scholar] [CrossRef] [PubMed]
  21. Abrahim, G.; Parker, R. Assessment of heavy metal enrichment factors and the degree of contamination in marine sediments from Tamaki Estuary, Auckland, New Zealand. Environ. Monit. Assess. 2010, 136, 227–238. [Google Scholar] [CrossRef] [PubMed]
  22. Christophoridis, C.; Dedepsidis, D.; Fytianos, K. Occurrence and distribution of selected heavy metals in the surface sediments of Thermaikos Gulf, N. Greece. Assessment using pollution indicators. J. Hazard. Mater. 2009, 168, 1082–1091. [Google Scholar] [CrossRef] [PubMed]
  23. Loska, K.; Wiechula, D. Application of principal component analysis for the estimation of source of heavy metal contamination in surface sediments from the Rybnik Reservoir. Chemosphere 2003, 51, 723–733. [Google Scholar] [CrossRef]
  24. Zhang, W.; Feng, H.; Chang, J.; Qu, J.; Xie, H.; Yu, L. Heavy metal contamination in surface sediments of Yangtze River intertidal zone: An assessment from different indexes. Environ. Pollut. 2009, 157, 1533–1543. [Google Scholar] [CrossRef] [PubMed]
  25. Hu, B.; Li, G.; Li, J.; Bi, J.; Zhao, J.; Bu, R. Spatial distribution and ecotoxicological risk assessment of heavy metals in surface sediments of the southern Bohai Bay, China. Environ. Sci. Pollut. Res. 2013, 20, 4099–4110. [Google Scholar] [CrossRef] [PubMed]
  26. Melfos, V.; Voudouris, P. Cenozoic metallogeny of Greece and potential for precious, critical and rare metals exploration. Ore Geol. Rev. 2017, 89, 1030–1057. [Google Scholar] [CrossRef]
  27. Christanis, K.; Georgakopoulos, A.; Fernandez-Turiel, J.L.; Bouzinos, A. Geological factors influencing the concentration of trace elements in the Philippi peatland, eastern Macedonia, Greece. Int. J. Coal Geol. 1998, 36, 295–313. [Google Scholar] [CrossRef]
  28. Giouri, A.; Vavelidis, M.; Melfos, V. Primary Approach on the Evaluation of Total Arsenic Concentration in Palea Kavala River, NE Macedonia, Northern Greece. In Proceedings of the 11th International Conference Protection and Restoration of the Environment XI (PREXI), Thessaloniki, Greece, 3–6 July 2012; Katsifarakis, K.L., Theodossiou, N., Christodoulatos, C., Koutsospyros, A., Mallios, Z., Eds.; pp. 356–364. [Google Scholar]
  29. Giouri, A.; Vavelidis, M.; Melfos, V. Occurrence of Arsenic in waters and sediments of the Palea Kavala river, NE Macedonia, Northern Greece. Bull. Geol. Soc. Greece 2013, XLVII, 934–941. [Google Scholar] [CrossRef]
  30. Giouri, K.; Vavelidis, M.; Melfos, V.; Papadopoulou, L. Assessment of selected metals enrichment in sediments from Palea Kavala river, NE Macedonia, Northern Greece. Bull. Geol. Soc. Greece 2016, 50, 2137–2144. [Google Scholar] [CrossRef]
  31. Papastergios, G.; Filippidis, A.; Fernandez-Turiel, J.L.; Gimeno, D.; Sikalidis, C. Natural and anthropogenic effects on the soil geochemistry of Kavala area, northern Greece. Bull. Geol. Soc. Greece 2010, 43, 2373–2382. [Google Scholar] [CrossRef]
  32. Papastergios, G.; Fernandez-Turiel, J.L.; Georgakopoulos, A.; Gimeno, D. Arsenic Background Concentrations in Surface Soils of Kavala Area, Northern Greece. Water Air Soil Pollut. 2010, 209, 323–331. [Google Scholar] [CrossRef]
  33. Papastergios, G.; Filippidis, A.; Fernandez-Turiel, J.L.; Gimeno, D.; Sikalidis, C. Surface soil geochemistry for environmental assessment in Kavala area, northern Greece. Water Air Soil Pollut. 2011, 216, 141–152. [Google Scholar] [CrossRef]
  34. Krohe, A.; Mposkos, E. Multiple generations of extensional detachments in the Rhodope Mountains (northern Greece): Evidence of episodic exhumation of high-pressure rocks. In The Timing and Location of Major Ore Deposits in an Evolving Orogen; Blundell, D.J., Neubauer, F., von Quadt, A., Eds.; Geological Society: London, UK, 2002; Volume 204, pp. 151–178. [Google Scholar]
  35. Brun, J.P.; Sokoutis, D. Kinematics of the Southern Rhodope Core Complex (North Greece). Int. J. Earth Sci. 2007, 96, 1079–1099. [Google Scholar] [CrossRef] [Green Version]
  36. Kydonakis, K.; Gallagher, K.; Brun, J.P.; Jolivet, M.; Gueydan, F.; Kostopoulos, D. Upper Cretaceous exhumation of the western Rhodope Metamorphic Province (Chalkidiki Peninsula, northern Greece). Tectonics 2014, 33, 1113–1132. [Google Scholar] [CrossRef] [Green Version]
  37. Christofides, G. Tertiary magmatism in the Greek Rhodope Massif, northern Greece: Granitic plutons. In Terranes of Serbia: The Formation of the Geologic Framework of Serbia and the Adjacent Regions; Knezevic, V., Krstic, B., Eds.; University of Belgrade: Belgrade, Serbia, 1996; pp. 155–160. [Google Scholar]
  38. Kronberg, P. Kavala Sheet. In Geological Map of Greece, Scale 1:50.000; Institute of Geology and Mineral Exploration (IGME): Athens, Greece, 1970. [Google Scholar]
  39. Kronberg, P.; Melidonis, N. Krinidhes Sheet. In Geological Map of Greece, Scale 1:50.000; Institute of Geology and Mineral Exploration (IGME): Athens, Greece, 1970. [Google Scholar]
  40. Vavelidis, M.; Melfos, V.; Eleftheriadis, G. Mineralogy and microthermometric investigations in the Au-bearing sulphide mineralization of Palea Kavala (Macedonia, Greece). In Mineral Deposits: Research and Exploration—Where Do They Meet; Papunen, H., Ed.; Balkema: Rotterdam, The Netherlands, 1997; pp. 343–346. [Google Scholar]
  41. Fornadel, A.P.; Spry, P.G.; Melfos, V.; Vavelidis, M.; Voudouris, P. Is the Palea Kavala Bi–Te–Pb–Sb±Au district, northeastern Greece, an intrusion-related system? Ore Geol. Rev. 2011, 39, 119–133. [Google Scholar] [CrossRef]
  42. Vavelidis, M.; Christofides, G.; Melfos, V. The Au–Ag-bearing mineralization and placer gold of Palea Kavala (Macedonia, N. Greece). In Terranes of Serbia: The Formation of the Geologic Framework of Serbia and the Adjacent Regions; Knežević-Dorđević, V., Krstić, B., Eds.; University of Belgrade: Belgrade, Serbia, 1996; pp. 311–316. [Google Scholar]
  43. Vavelidis, M.; Gialoglou, G.; Melfos, V.; Wagner, G.A. Goldgrube in Palea Kavala-Griechenland: Entdeckung von Skaptehyle? Erzmetall 1996, 49, 547–554. [Google Scholar]
  44. Melfos, V.; Voudouris, P.; Vavelidis, M.; Spry, P.G. Microthermometric Results and Formation Conditions of a New Intrusion-Related Bi–Te–Pb–Sb±Au Mineralization in the Kavala Pluton, Greece. In Proceedings of the 13th All-Russian Conference on Thermobarogeochemistry in Conjuction with the 4th Asian and Pacific International Fluid Inclusion Society Symposium, Moscow, Russia, 22–25 September 2008; Volume 2, pp. 165–168. [Google Scholar]
  45. Vavelidis, M.; Andreou, S. Gold and Gold Working in Late Bronze Age Northern Greece: The Evidence from Thessaloniki Toumba. Naturwissenschaften 2008, 95, 361–366. [Google Scholar] [CrossRef] [PubMed]
  46. Tessier, A.; Campbell, P.G.C. Partitioning of Trace Metals in Sediments: Relationships with Bioavailability. Hydrobiologia 1987, 149, 43–52. [Google Scholar] [CrossRef]
  47. Salomons, W. Environmental impact of metals derived from mining activities: Processes, predictions, preventions. J. Geochem. Explor. 1995, 52, 5–23. [Google Scholar] [CrossRef]
  48. Hu, B.; Cuia, R.; Li, J.; Weia, H.; Zhao, J.; Bai, F.; Song, W.; Ding, X. Occurrence and distribution of heavy metals in surface sediments of the Changhua River Estuary and adjacent shelf (Hainan Island). Mar. Pollut. Bull. 2013, 76, 400–405. [Google Scholar] [CrossRef] [PubMed]
  49. Reimann, C.; Filzmoser, P.; Garrett, R.G.; Dutter, R. Statistical Data Analysis Explained; John Wiley & Sons Ltd.: Chichester, UK, 2008; 343p. [Google Scholar]
  50. Grunsky, E.C. The interpretation of geochemical survey data. Geochem. Explor. Environ. Anal. 2010, 10, 27–74. [Google Scholar] [CrossRef]
  51. Turekian, K.K.; Wedepohl, K.H. Distribution of the elements in some major units of the earth’s crust. Geol. Soc. Am. Bull. 1961, 72, 175–192. [Google Scholar] [CrossRef]
  52. Sakan, S.M.; Djordjević, D.S.; Manojlović, D.D.; Polic, P.S. Assessment of heavy metal pollutants accumulation in the Tisza river sediments. J. Environ. Manag. 2009, 90, 3382–3390. [Google Scholar] [CrossRef] [PubMed]
  53. Müller, G. Index of geoaccumulation in sediments of the Rhine River. GeoJournal 1969, 2, 108–118. [Google Scholar]
  54. Folk, R. Petrology of Sedimentary Rocks; Hemphill Publishing Company: Austin, TX, USA, 1980; 184p. [Google Scholar]
  55. Egashira, S.; Ashida, K. Flow resistance and sediment transportation in streams with step-pool bed morphology. In Fluvial Hydraulics of Mountain Regions; Armanini, A., DiSilvio, G., Eds.; Springer-Verlag: Berlin, Germany, 1991; pp. 45–58. [Google Scholar]
  56. Armanini, A. Principles of River Hydraulics; Springer International Publishing AG: Cham, Switzerland, 2018; 236p. [Google Scholar]
  57. Mao, L.J.; Mo, D.W.; Guo, Y.Y.; Fu, Q.; Yang, J.H.; Jia, Y.F. Multivariate analysis of heavy metals in surface sediments from lower reaches of the Xiangjiang River, southern China. Environ. Earth Sci. 2013, 69, 765–771. [Google Scholar] [CrossRef]
  58. Liu, J.J.; Liu, Y. Study on heavy metal sand ecological risk assessment from Gansu, Ningxia and Inner Mongolia sections of the Yellow, China. Spectrosc. Spect. Anal. 2013, 33, 3249–3254. [Google Scholar]
  59. Grim, R.E. Applied Clay Mineralogy; McGraw-Hill: New York, NY, USA, 1962; 422p. [Google Scholar]
  60. Blatt, H.; Middeleton, G.; Murray, R. Origin of Sedimentary Rocks, 2nd ed.; Prentice-Hall, Englewood Cliffs: Upper Saddle River, NJ, USA; 1980; 782p. [Google Scholar]
  61. Moore, D.M.; Reynolds, R.C., Jr. X-Ray Diffraction and the Identification and Analysis of Clay Minerals, 2nd ed.; Oxford University Press: Oxford, MS, USA, 1997; 378p. [Google Scholar]
  62. Tessier, A.; Rapin, F.; Carignan, R. Trace metals in oxic lake sediments: Possible adsorption onto iron oxyhydroxides. Geochim. Cosmochim. Acta 1985, 47, 1091–1098. [Google Scholar] [CrossRef]
  63. Rose, A.W.; Hawkes, H.E.; Webb, J.S. Geochemistry in Mineral Exploration, 2nd ed.; Academic Press: New York, NY, USA, 1979; 657p. [Google Scholar]
  64. Gambrell, R. Trace and toxic metals in wetlands—Review. J. Environ. Qual. 1994, 23, 883–891. [Google Scholar] [CrossRef]
  65. Alloway, B.J. Heavy Metals in Soils, 2nd ed.; Blackie Academic and Professional: London, UK, 1995; 371p. [Google Scholar]
  66. Adriano, D. Trace elements in terrestrial environments. In Biogeochemistry, Bioavailability and Risks of Metals; Springer-Verlag: New York, NY, USA, 2001; 867p. [Google Scholar]
Figure 1. Geological map of the Kavala-Philippi area (modified after [38,39,40,41]), including the Palea Kavala river and the Kryoneri and Philippi streams. The sampling sites of the riverbed sediments are also shown.
Geosciences 08 00187 g001
Figure 2. Classification of the studied sediments in the ternary diagram of Folk [54]. (Blue symbols: samples from Palea Kavala River; red symbols: samples from Kryoneri stream; Black symbol: sample from Philippi stream).
Geosciences 08 00187 g002
Figure 3. Hierarchical cluster analysis of the determined elemental concentrations in the studied sediment samples.
Geosciences 08 00187 g003
Figure 4. Speciation of Cu, Fe, Mn and Zn in the studied sediments of the Kavala–Philippi area.
Geosciences 08 00187 g004
Figure 5. Variations of resulting values for (a) enrichment factors; and (b) geo-accumulation indexes -Igeo.
Geosciences 08 00187 g005
Table 1. Statistical summary of the studied sediment samples textural composition.
Sample IDGravel (wt %)Sand (wt %)Silt+Clay (wt %)
S119.8554.9825.18
S231.2663.665.08
S325.0670.874.07
S420.6361.3818.00
S515.9065.3418.77
S648.7544.526.73
Median22.8462.5212.36
Mean ± SD26.91 ± 11.9160.12 ± 9.2412.97 ± 8.81
Variation32.8526.3521.11
Table 2. Statistical summary of the determined elemental concentrations in the <0.063 mm fraction of the studied sediment samples. The average shale composition is according to Turekian and Wedepohl [51].
Sample IDAl2O3
(wt %)
CaO
(wt %)
Fe2O3
(wt %)
MnO
(wt %)
SiO2
(wt %)
Cu
(μg∙g−1)
Zn
(μg∙g−1)
S115.905.707.300.1650.3573.20151.00
S28.7427.698.401.0121.0373.31302.80
S312.6511.786.420.1540.4456.97154.40
S414.616.467.270.1850.9766.58171.50
S518.781.2210.870.2047.6861.23181.70
S69.0325.723.630.0931.2223.5465.10
Median13.6313.107.280.1744.0663.91162.95
Mean ± SD13.28 ± 3.959.12 ± 11.087.31 ± 2.380.30 ± 0.3540.28 ± 12.0359.14 ± 18.60171.08 ± 76.65
Variation10.0426.477.240.9229.9449.77237.70
Average Shale8.00 4.720.085 4595
Table 3. Spearman’s correlation coefficients (ρ) between the elemental analysed parameters.
Al2O3CaOFe2O3MnOSiO2CuZn
Al2O31
CaO−0.9991
Fe2O30.429−0.4291
MnO0.086−0.0860.8861
SiO20.771−0.7710.086−0.0291
Cu−0.0290.0290.6570.7710.0861
Zn−0.0290.0290.7710.943−0.1430.6001
Values in bold are considered as statistically significant (p < 0.05); Underlined values are considered at the margin of statistical significance (p ≤ 0.07).
Table 4. Statistical results from principal component analysis (PCA). Values in bold represent strong correlation in specific components.
ParameterPC1PC2
Al2O30.9620.203
CaO−0.990−0.128
Fe2O30.4480.816
MnO−0.6620.745
SiO20.968−0.113
Cu0.2920.874
Zn−0.2780.955
Eigenvalues3.6512.960
% total variance52.0442.39
% cumulative variance52.0494.43
Table 5. Spearman’s correlation coefficients (ρ) between any two metal-binding fractions: (a) bound to exchangeable fraction (b) bound to carbonates, (c) bound to Fe–Mn oxides, (d) bound to organic matter.
(a)Cu exchangeableFe exchangeableMn exchangeableZn exchangeable
Cu exchangeable1
Fe exchangeable0.2611
Mn exchangeable0.3430.0881
Zn exchangeable0.6380.1430.7941
(b)Cu carbonatesFe carbonatesMn carbonatesZn carbonates
Cu carbonates1
Fe carbonates−0.1431
Mn carbonates−0.0860.6001
Zn carbonates0.600−0.771−0.1431
(c)Cu oxidesFe oxidesMn oxidesZn oxides
Cu oxides1
Fe oxides0.7141
Mn oxides0.7710.9431
Zn oxides0.6570.4860.7141
(d)Cu organicFe organicMn organicZn organic
Cu organic1
Fe organic−0.7711
Mn organic−0.9430.8861
Zn organic0.1430.0860.0861
Values in bold are considered statistically significant (p < 0.05); underlined values are considered at the margin of statistical significance (p ≤ 0.07).
Table 6. Enrichment factor (EF) and geo-accumulation index (Igeo) values of selected metals in the studied samples.
Sample IDFeCuMnZn
EFIgeoEFIgeoEFIgeoEFIgeo
S11.03−0.471.550.121.39−0.041.510.08
S22.15−0.272.820.1215.982.625.511.09
S31.14−0.661.51−0.241.59−0.171.940.12
S41.11−0.481.53−0.021.660.101.870.27
S51.300.101.09−0.141.450.271.540.35
S60.90−1.480.88−1.521.38−0.871.15−1.13

