Article

Using ArcticDEM to Analyse the Dimensions and Dynamics of Debris-Covered Glaciers in Kamchatka, Russia

1
School of Science and the Environment, Manchester Metropolitan University, Manchester M15 6BH, UK
2
High-Mountain Geophysical Institute, 360030 Nalchik, Russia
3
Department of Geography, University of Sheffield, Sheffield S10 2TN, UK
4
Department of Geography, University of Portsmouth, Portsmouth PO1 2UP, UK
5
Cryosphere Research Department, Adam Mickiewicz University, 61-680 Poznań, Poland
6
Institute of Geography, Russian Academy of Sciences, 119017 Moscow, Russia
*
Author to whom correspondence should be addressed.
Geosciences 2018, 8(6), 216; https://doi.org/10.3390/geosciences8060216
Submission received: 10 May 2018 / Revised: 7 June 2018 / Accepted: 11 June 2018 / Published: 13 June 2018
(This article belongs to the Special Issue Glacial and Geomorphological Cartography)

Abstract

:
On the Kamchatka Peninsula, a number of glaciers are covered by thick volcanic debris, which makes their margins difficult to delineate from satellite imagery. Fortunately, high resolution, multi-temporal digital surface models (DSMs) covering the entire peninsula have recently become freely available (i.e., ArcticDEM). We use these DSMs to analyse the dimensions and dynamics of debris-covered glaciers in the northern Kluchevskoy Volcanic Group, central Kamchatka. This approach demonstrates that between 2012 and 2016, some of the region’s glaciers advanced despite regional and local climate warming. These glacial advances are part of a long-term trend, presumed to reflect the role of extensive supraglacial debris in limiting ice ablation, though there is also evidence for local ice melt due to supraglacial lava/debris flows. Glacier surface velocities during the period 2012–2015 were typically 5–140 m yr−1. Velocities for the major outlets of the region’s central icefield were typically higher than for other extensively debris-covered glaciers globally, likely reflecting the influence of ice supply from the high altitude Ushkovsky caldera. In all, we find ArcticDEM useful for analysing debris-covered glaciers in Kamchatka, providing important information on flow dynamics and terminus change that is difficult to derive from satellite imagery.

Graphical Abstract

1. Introduction

The Kamchatka Peninsula, Eastern Russia, is currently occupied by more than 600 glaciers and about 30 active volcanoes [1,2] (Figure 1A). Over the 20th and early part of the 21st centuries, most of these glaciers experienced retreat characterised by a reduction in area and overall mass [3,4,5,6]. For example, an ~11% reduction in glacier area has been reported for the peninsula as a whole between the 1950s and 2000, and a further ~24% reduction between 2000 and 2014 [6]. Glacier retreat between the 1950s and 2000 is thought to reflect rising temperatures and declining precipitation, whereas rapid retreat since 2000 is thought to be solely in response to a peninsula-wide increase in temperatures [6]. Despite this overall retreat pattern, some of the peninsula’s glaciers experienced periods of margin stability and/or advance during the 20th and early 21st centuries [7,8,9,10]. One region of particular interest is the northern Kluchevskoy Volcanic Group (NKVG) (Figure 1A), where, over recent decades, glaciers appear to have responded to both volcanic and climatic forcing [7,9,10,11]. To date, glacier monitoring in the NKVG has been based on the analysis of satellite imagery [9,10] combined with some fieldwork [7,11] and comparison with data regarding glacier extent in the 1950s [12,13]. However, because many of the region’s glaciers are extensively debris-covered (e.g., Figure 1B), monitoring changes in their extent and dynamics (e.g., flow velocity) is often difficult. This is exacerbated by logistical challenges with conducting fieldwork in central Kamchatka and the relative scarcity of cloud-free satellite imagery, due to the peninsula’s maritime setting [6]. As a result, systematic monitoring of glacier behaviour in the NKVG, with a view to understanding controlling mechanisms (e.g., climatic versus volcanic forcing), is limited [9,10,14].
Fortunately, as part of the ArcticDEM project [15,16], repeat (during the period 2012–2016), high spatial resolution (2 m) digital surface models (DSMs) are now freely available for the entire peninsula. Because of their repeat coverage and high spatial resolution, these DSMs provide a means of measuring landscape change (including variations in glacier behaviour) on the peninsula in ways that have hitherto been impossible. This paper uses ArcticDEM data to analyse the dimensions and dynamics of glaciers in the NKVG during the period 2012–2016.

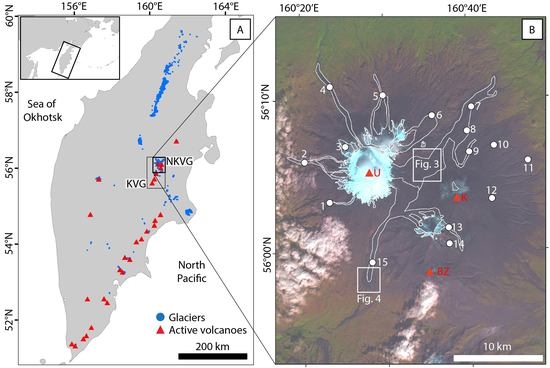
2. Glaciers of the Northern Kluchevskoy Volcanic Group (NKVG)

The NKVG is a region that includes several active volcanoes, including Ushkovsky, Klyuchevskoy, and Bezymianny (Figure 1B). Ushkovsky last erupted in 1890 [19], whereas Klyuchevskoy and Bezymianny have erupted >90 and >20 times, respectively, since 1800 [17]. The region contains 15 main (named) glaciers [9,10] (Figure 1B, Table 1). Most of these glaciers are depicted in the Randolph Glacier Inventory version 6 [18], though their margins are often poorly defined and some glaciers are unmapped (Figure 1B, Table 1). Since 1950, the total area of these glaciers has decreased slightly, though some glacier margins have appeared stable or advanced over this period [7,9,10,11] (Table 1). These patterns suggest both climatic and volcanic controls on glacier behaviour [9,10]. However, partly because of extensive supraglacial debris (Figure 1B), monitoring fluctuations in the dimensions and dynamics of these glaciers is difficult, and our understanding of controls on their behaviour is therefore limited [9,10].

3. Materials and Methods

3.1. ArcticDEM Digital Surface Models (DSMs)

The ArcticDEM DSMs were generated from a variety of high-resolution satellite imagery datasets (WorldView-1, WorldView-2, WorldView-3, and GeoEye-1) [20,21]. The DSM archive extends back to 2007 (for some locations), and covers all land north of 60° N as well as some lower latitude regions (such as Kamchatka) [15,16]. The multi-temporal DSMs have a 2 m spatial resolution, and are provided as ~17 km wide and ~110 km long strips [15]. These DSMs have internal accuracy of 0.2 m, but may have systematic vertical and horizontal offsets of 3–5 m [20]. These offsets can be removed using ground control points or, as adopted in the present study (Section 3.3), by coregistration to a reference DSM [20,22].
In total, 14 ArcticDEM 2 m resolution DSM strips were acquired for the NKVG between 2012 and 2016 (Figure 2, Table 2). However, there are a number of factors that limit the dataset’s utility for mapping and analysing glaciers. First, despite the coverage, many of the DSM strips contain notable data gaps. Second, there is no single time-slice that offers complete coverage for all the region’s glaciers, and in some cases, even individual glaciers are not entirely covered during a single time-slice. Third, some glacier sections are only covered during a single time-slice. Finally, some DSM strips reflect conditions during winter months, when glacier surfaces are snow covered. This is likely to be a particular issue when analysing changing glacier surface elevations (Section 3.3), as metres of snow [23] are within the measurement error of some of the glacier surface elevation change estimates [21].

3.2. Mapping Glaciers

Building on [9], the margins of all glaciers in the NKVG were mapped (manually digitised) for the period 2012–2016 (Table 1). For regions with overlapping DSMs (Figure 2), fluctuations in glacier margins during this period were documented. In the DSM strips, glaciers were often readily identifiable due to surface indicators of ice flow (e.g., crevasses formed by longitudinal stretching of the ice in a down-glacier direction) (Figure 3A) not always clearly visible from satellite imagery (Figure 3B). Supraglacial debris is a particular problem when trying to map glacier margins from satellite imagery (Figure 4A), and one key advantage of using ArcticDEM is that glacier margins were often distinguishable by notable breaks-of-slope even when debris-covered (Figure 4B,C).
Potential sources of error in digitising glacier margins not only come from difficulties with correctly identifying areas of glacial ice, but also from inherent inaccuracies in the DSMs (Section 3.1). In the present study, mapping error was calculated following [24]:
R M S E = i = 1 N ( a i â i ) 2 N
where ai denotes glacier area, âi is the glacier area calculated on the pixel base (i.e., the total number of pixels within a polygon multiplied by the DSM resolution), and N is the number of polygons digitised. On this basis, mapping error was calculated to be ~3.5%.
In addition, areas of ‘clean’ and debris-covered ice were differentiated by manual digitisation from a Landsat 8 satellite image from September 2014 (Figure 1B). This image was chosen since it coincides with the period covered by the ArcticDEM data and is one of very few images to show nearly complete, cloud-free coverage for all the region’s glaciers.

3.3. Changing Glacier Surface Elevation

In order to monitor changes in glacier surface elevation through time, DSMs were differenced following procedures outlined in [25]. As noted in Section 3.1, to remove systematic vertical and horizontal offsets, DSMs were first coregistered to a reference DSM [20,22]. This coregistration was achieved by identifying static surfaces on each DSM and aligning DSMs to a single reference frame. Static surfaces were identified based on the degree of similarities in slope, aspect, and height undulations between different DSMs [26]. Coregistration was performed for all intersecting sections of the DSMs, without filtering (e.g., steep slopes were not masked). For all DSM pairs, after coregistration, the standard deviation of differences over static/stationary surfaces ranged from 1.6 to 3.4 m, which represents a measure of uncertainty in the elevation difference measurements [25].

3.4. Measuring Glacier Velocities

For regions with overlapping DSMs (Figure 2), glacier velocity could be measured. However, because of differences in the periods covered by DSM strips, velocity was only measured for the period 2012–2015. Where possible, horizontal displacement of characteristic features (e.g., crevasses, distinct ridges, hummocks) was manually tracked and measured on hillshaded relief maps generated from DSMs. For most points, velocity data is available only for one interval, but in some cases this was extended to two distinct periods, thus providing a general insight into the magnitude of ice velocity fluctuations in the study area. The majority of data points are located along glacier centrelines in zones of the fastest flow, except for the marginal zone of Bogdanovich Glacier, where a denser array of control points was established in order to demonstrate the spatial pattern of ice flow velocities and directions. The precision of feature tracking was usually within ± 2 m (1 pixel) and the error of displacement measurements propagates to a similar value. Thus, uncertainties in velocity measurements are typically between ±0.6 and ±3.9 m yr−1.

4. Results

4.1. Glacier Extent

Mapping from ArcticDEM data reveals that in 2015, glaciers in the NKVG covered ~182.7 ± 6.5 km2 (Figure 5). These glaciers typically extend (up to ~20 km) from a central icefield linking Ushkovsky and Klyuchevskoy volcanoes. Mapping also reveals a number of smaller independent glaciers on the N, E, and SE slopes of Klyuchevskoy volcano, that are not connected to the central icefield (Figure 5). Although they are almost entirely debris-covered, these smaller features have been mapped as glaciers because they are actively flowing (as illustrated by glacier velocity data; Section 4.3). Of the total mapped area of glacier ice, ~117.9 ± 4.1 km2 (~65%) is classified as debris-covered (based on Figure 1B).
For most glaciers in the NKVG (12 of the 15 main glaciers), the multi-temporal DSMs reveal little evidence of terminus fluctuations during the period 2012–2016. However, three glaciers show evidence of terminus advance (based on visual observations of changes in terminus position). The most conspicuous example is Shmidta Glacier, which advanced ~120 m between July 2012 and April 2014 (~69 m yr−1) and a further ~60 m by October 2015 (~40 m yr−1) (Figure 6). Similarly, the terminus of Bogdanovich Glacier advanced ~40 m between April 2013 and October 2015 (~27 m yr−1), while the terminus of Erman Glacier spread laterally ~25 m and advanced ~30 m between September 2013 and February 2016 (~12 m yr−1). In the latter case, the glacier’s capacity to spread laterally, as dictated by topography [27], may have limited its down-valley advance. Finally, a small unnamed ice mass immediately north of Shmidta Glacier (coordinates: ~56.02° N, 160.66° E) advanced ~75 m between July 2012 and April 2014 (~43 m yr−1) and a further ~35 m by March 2015 (~38 m yr−1).

4.2. Glacier Surface Elevations

Changes in surface elevation were measured across glaciers of the NKVG (during the period 2012–2016); however, because DSM availability restricted analysis to certain glaciers, glacier sections, and time-periods (including different seasons), it is not possible to make any overall regional assessment of changing glacier mass over this period. In addition, in many cases, the observed changes in glacier surface elevation are within measurement error (Section 3.3). Despite these limitations, some surface elevation changes are still noteworthy.
First, for some glaciers (and/or glacier sections) occupying the slopes of Klyuchevskoy volcano, the largest changes in DSM elevations appear related to the supraglacial deposition of volcanically derived material. For example, in 2013, lava/debris-flows extend from the summit of Klyuchevskoy and onto the surface of Bogdanovich Glacier (Figure 7A). These flows relate to the eruption of Klyuchevskoy during this period [17], and caused a local increase in the apparent surface elevation (by up to ~13 m) of Bogdanovich Glacier between July 2012 and April 2014 (Figure 7B). In proximity to these localised areas of increased surface elevation, there are notable areas of elevation decrease (Figure 7B). These areas appear to be channels incised into supraglacial ice or snow, and may well result from increased ice melt, and subsequent drainage, during and following the emplacement of the (likely hot) supraglacial lava/debris. For some of the smaller ice masses on the slopes of Klyuchevskoy, volcanically derived lava/debris appear to dominate surface elevation change (i.e., leading to an increase in surface elevation, though some melt is also likely to have occurred directly following lava/debris emplacement) (Figure 7B), making any changes in overall ice thickness very difficult to discern.
Second, for most glacier termini in the NKVG (all of which are debris-covered), there is no clear overall trend in surface elevation change and differences between DSMs often lie within measurement error. An exception is the terminus of Shmidta Glacier, which experienced surface elevation changes ranging from −12.3 to 13.4 m between July 2012 and April 2014 (Figure 8). There is also evidence that the small, unnamed ice mass immediately north of Shmidta Glacier (referred to in Section 4.1) experienced elevation changes dominated by the movement of ice towards the terminus during this period (Figure 8).

4.3. Glacier Velocity

Analysis of the ArcticDEM data indicates that during the period 2012–2015, glacier surface velocities in the NKVG typically ranged from 5 to 140 m yr−1 (Figure 9). Velocities are highest (>100 m yr−1) in the central parts of the largest outlet glaciers emanating from Ushkovsky caldera and decrease towards glacier termini (Figure 9). In some cases, the ablation areas of the mapped glaciers show very limited evidence of active flow, and are here classified as ‘low-activity ice-cored topography’ (Figure 9). Across the entire region, the area classified as low-activity ice-cored topography covers 38.4 km2 (~21% of the mapped glacier area), leaving an ‘active’ ice area of 144.3 km2 (much of which is debris-covered). Information on temporal fluctuations in glacier velocity are sparse and do not show any consistent trend. Even for individual glaciers, some control points appear to accelerate slightly, while others decelerate, suggesting localised velocity fluctuations.

5. Discussion

5.1. Glacier Dimensions

Our study demonstrates that the ArcticDEM is a useful dataset for identifying and mapping glaciers. In the NKVG specifically, this mapping shows that a number of large outlet glaciers drain an icefield linking Ushkovsky and Klyuchevskoy volcanoes, with additional independent glaciers on some of these volcanic slopes (Figure 5). Though the general extent of these glaciers has been demonstrated previously [9,10], ArcticDEM has proven to be particularly useful for precisely mapping, and monitoring fluctuations of, glacier margins. Notably, mapping from ArcticDEM reveals the terminus advance of three main glaciers (Shmidta, Bogdanovich, and Erman) during the period 2012–2016 (Section 4.1) and a smaller unnamed glacier on the SE flank of Klyuchevskoy volcano. For other glaciers, there is little evidence of terminus fluctuations.
In the case of Shmidta Glacier, advance has been ongoing since 2007 (Table 1), and is thought to be a response to the 2005–2010 eruptive period of Klyuchevskoy volcano [8,9,10]. The advance of Bogdanovich Glacier appears to be a continuation of a trend ongoing since the 1950s (Table 1) [9,10], and likely reflects a response to extensive supraglacial debris cover (Figure 5) acting to limit ablation [8]. Similarly, terminus advance at Erman Glacier has been ongoing since the mid-20th century (Table 1), and is thought to be a response to reduced ablation beneath supraglacial landslide debris deposited during the 1944–1945 eruption of Klyuchevskoy [8,9,10,28,29]. Similar periods of glacier advance in response to supraglacial debris accumulation have been observed in other regions globally due to accumulated mass-movement debris [30,31,32,33], volcanic debris (including tephra) [34,35], or other material [36]. The ArcticDEM data reveal little indication of terminus fluctuations of the other main glaciers in the NKVG. However, surface elevation changes (Figure 7) indicate localised volcanic impacts on glaciers. Specifically, a supraglacial lava/debris flow resulted in an increase in DSM elevation (i.e., the material accumulated on the glacier), but also appears to have caused localised melt on the surface of Bogdanovich. Such melting has been observed on other glaciers globally [37,38], though the degree to which this reflects snow versus ice melt is unclear [39] and making links between such activity and overall glacier behaviour is very difficult [38].

5.2. Glacier Dynamics

Despite their limited temporal coverage (2012–2016), the ArcticDEM DSMs are a particularly useful means of measuring the surface velocity of glaciers across the NKVG. Surface velocity measurements have previously been obtained from Bilchenok (using field-based global positioning system (GPS) monitoring) [11], Bogdanovich and Erman Glaciers (from satellite imagery) [10], but this is the first region-wide analysis.
At Bogdanovich, [10] measured surface velocities of ~14–15 m yr−1 near the glacier’s terminus during the period 2012–2014. This is consistent with results from the ArcticDEM data, which suggest surface velocities typically <20 m yr−1 near the glacier’s terminus (Figure 9). At Erman, [10] measured surface velocities of 115–150 m yr−1 for the glacier’s eastern tongue (which extends into Krutenkaya valley) (period 2012–2014). Again, this is generally consistent with results from the ArcticDEM data, which suggest surface velocities of ~80–125 m yr−1 for this region (Figure 9). At Bilchenok, [7] (referencing unpublished data from Muraviev) suggest that during the 1982–1984 period of terminus advance (Table 1), the glacier velocity (as measured from debris ridges) was ~98–100 m yr−1. By contrast, during a field-based GPS survey in 1998 (18 July–17 August), [11] found the lower 2–3 km of the glacier to have surface velocities of only ~12–17 m yr−1. These low velocities have been interpreted as a quiescent phase following a period of surging and acceleration in 1982–1984 [7]. However, the region-wide perspective offered by the ArcticDEM data (Figure 9) illustrates that during the period 2012–2015, many outlet glaciers in the NKVG had velocities <30 m yr−1 near their termini but >50 m yr−1 further up-glacier (Figure 9). At Bilchenok specifically, the ArcticDEM data suggest velocities of ~22 m yr−1 ~1 km from the glacier terminus, ~43 m yr−1 ~2 km from the glacier terminus, and ~83 m yr−1 ~6.5 km from the glacier terminus (Figure 9). Similar patterns, with increasing glacier velocity with distance up-glacier from the terminus, are found for many land-terminating glaciers elsewhere globally [40]. On this basis, we suggest that the low surface velocities measured in 1998 by [11] reflect the proximity of their GPS measurements to the glacier terminus (while the 1982–1984 measurements come from a site further up-glacier) rather than a shift from the active to the quiescent phase of a surge [41,42].
In the NKVG as a whole, only three glaciers (Ushkovsky, Bilchenok, and Erman) show surface velocities >100 m yr−1. At Ushkovsky and Bilchenok, these velocities coincide with icefalls (where high velocities are expected [43]), whereas at Erman, these high velocities are found in a comparatively low gradient sector of the outlet (Figure 9). Glacier velocities of ~5–140 m yr−1 are comparable with other mountain glaciers globally [44,45,46]. However, heavily debris-covered glaciers typically have velocities towards (and below) the lower end of this range [40,44,47]. For example, [40] found surface velocities of debris-covered glaciers in the Everest region (between 1992 and 2002) to peak at ~36 m yr−1 and in some cases to show no evidence of flow (i.e., stagnant ice). Given their extensive debris-cover, the maximum velocities of some of the glaciers in the NKVG are relatively high. This might reflect the fact that these fastest-flowing glaciers all drain from the central high-altitude (~3900 m a.s.l.) Ushkovsky caldera (Figure 5), with such glaciers typically considered more dynamic/active than those originating at lower elevations (partly because of their steeper surface slopes) [40]. Ice velocities in the NKVG might also be enhanced by geothermal heat flux, which promotes meltwater accumulation at the ice–bed interface, and in turn reduces basal drag and promotes basal sliding. However, though glacier velocities elsewhere globally have been observed to increase in response to subglacial geothermal/volcanic heating [48,49], such events are typically short-lived and therefore not consistent with observed velocities in the NKVG (Figure 9). Enhanced geothermal heat flux and associated melt might explain the short-term periods of ice advance at Bilchenok Glacier in 1959–1960 and 1982–1984 (Table 1) [8], since geothermally triggered periods of advance have been observed for other glaciers globally [49,50,51]. However (contrary to some other suggestions [7,11]), we refrain from using the term ‘surges’ to describe these events, since they deviate from the traditional definition of an internally-controlled, cyclical glaciodynamic instability [41,42].
In all, the consistency between our velocities and previous studies in this region provides little evidence to suggest recent speed-ups of slow-downs of these glaciers. Similarly, fluctuations in their terminus positions (i.e., glacier advance in some cases) appear to be part of a long-term trend rather than something unique to the period covered by the ArcticDEM data. The overall controls on this behaviour are poorly understood, though a combination of climate and volcanic impacts have often been inferred [7,8,9,10]. In order to further our understanding, there is clearly a need for continued monitoring of the region’s glaciers and volcanoes. In many cases, this will be facilitated by the development of remotely sensed datasets (such as ArcticDEM) combined with field-based investigations (e.g., monitoring seismic/geothermal/volcanic activity and better characterising supraglacial debris).

6. Conclusions

We use ArcticDEM data to analyse the dimensions and dynamics of debris-covered glaciers in the NKVG, central Kamchatka. Our main findings can be summarised as follows:
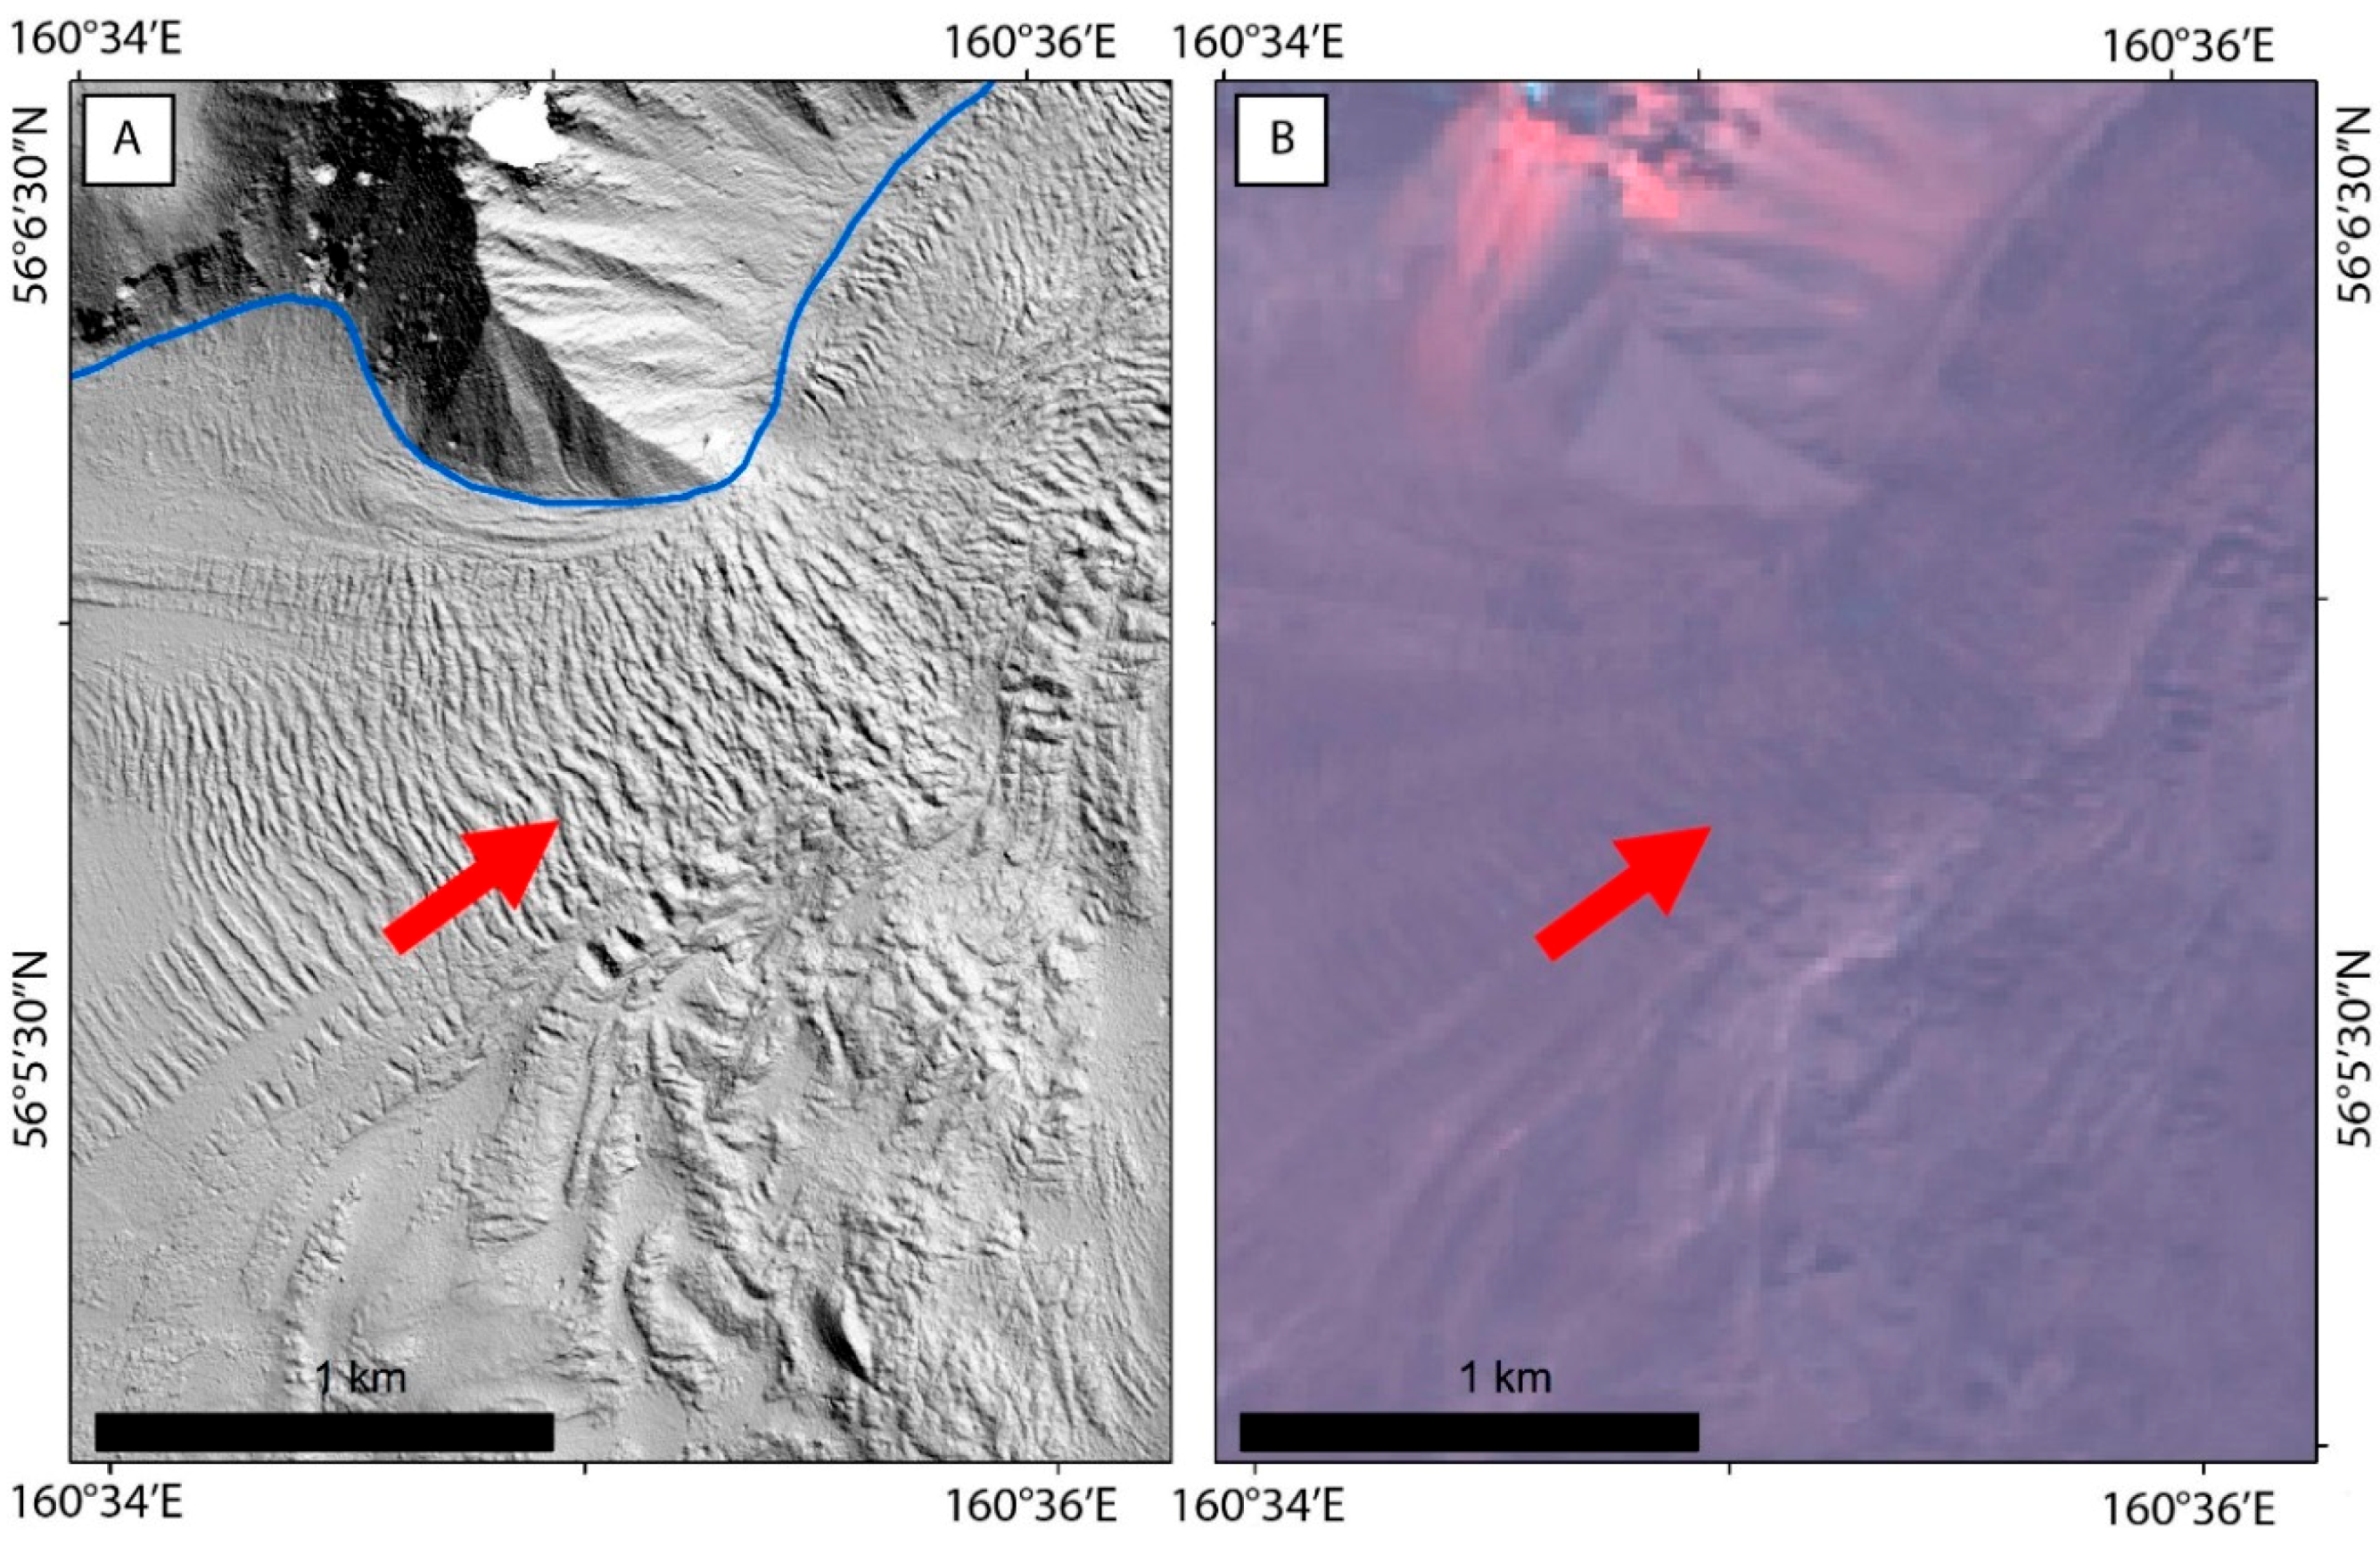
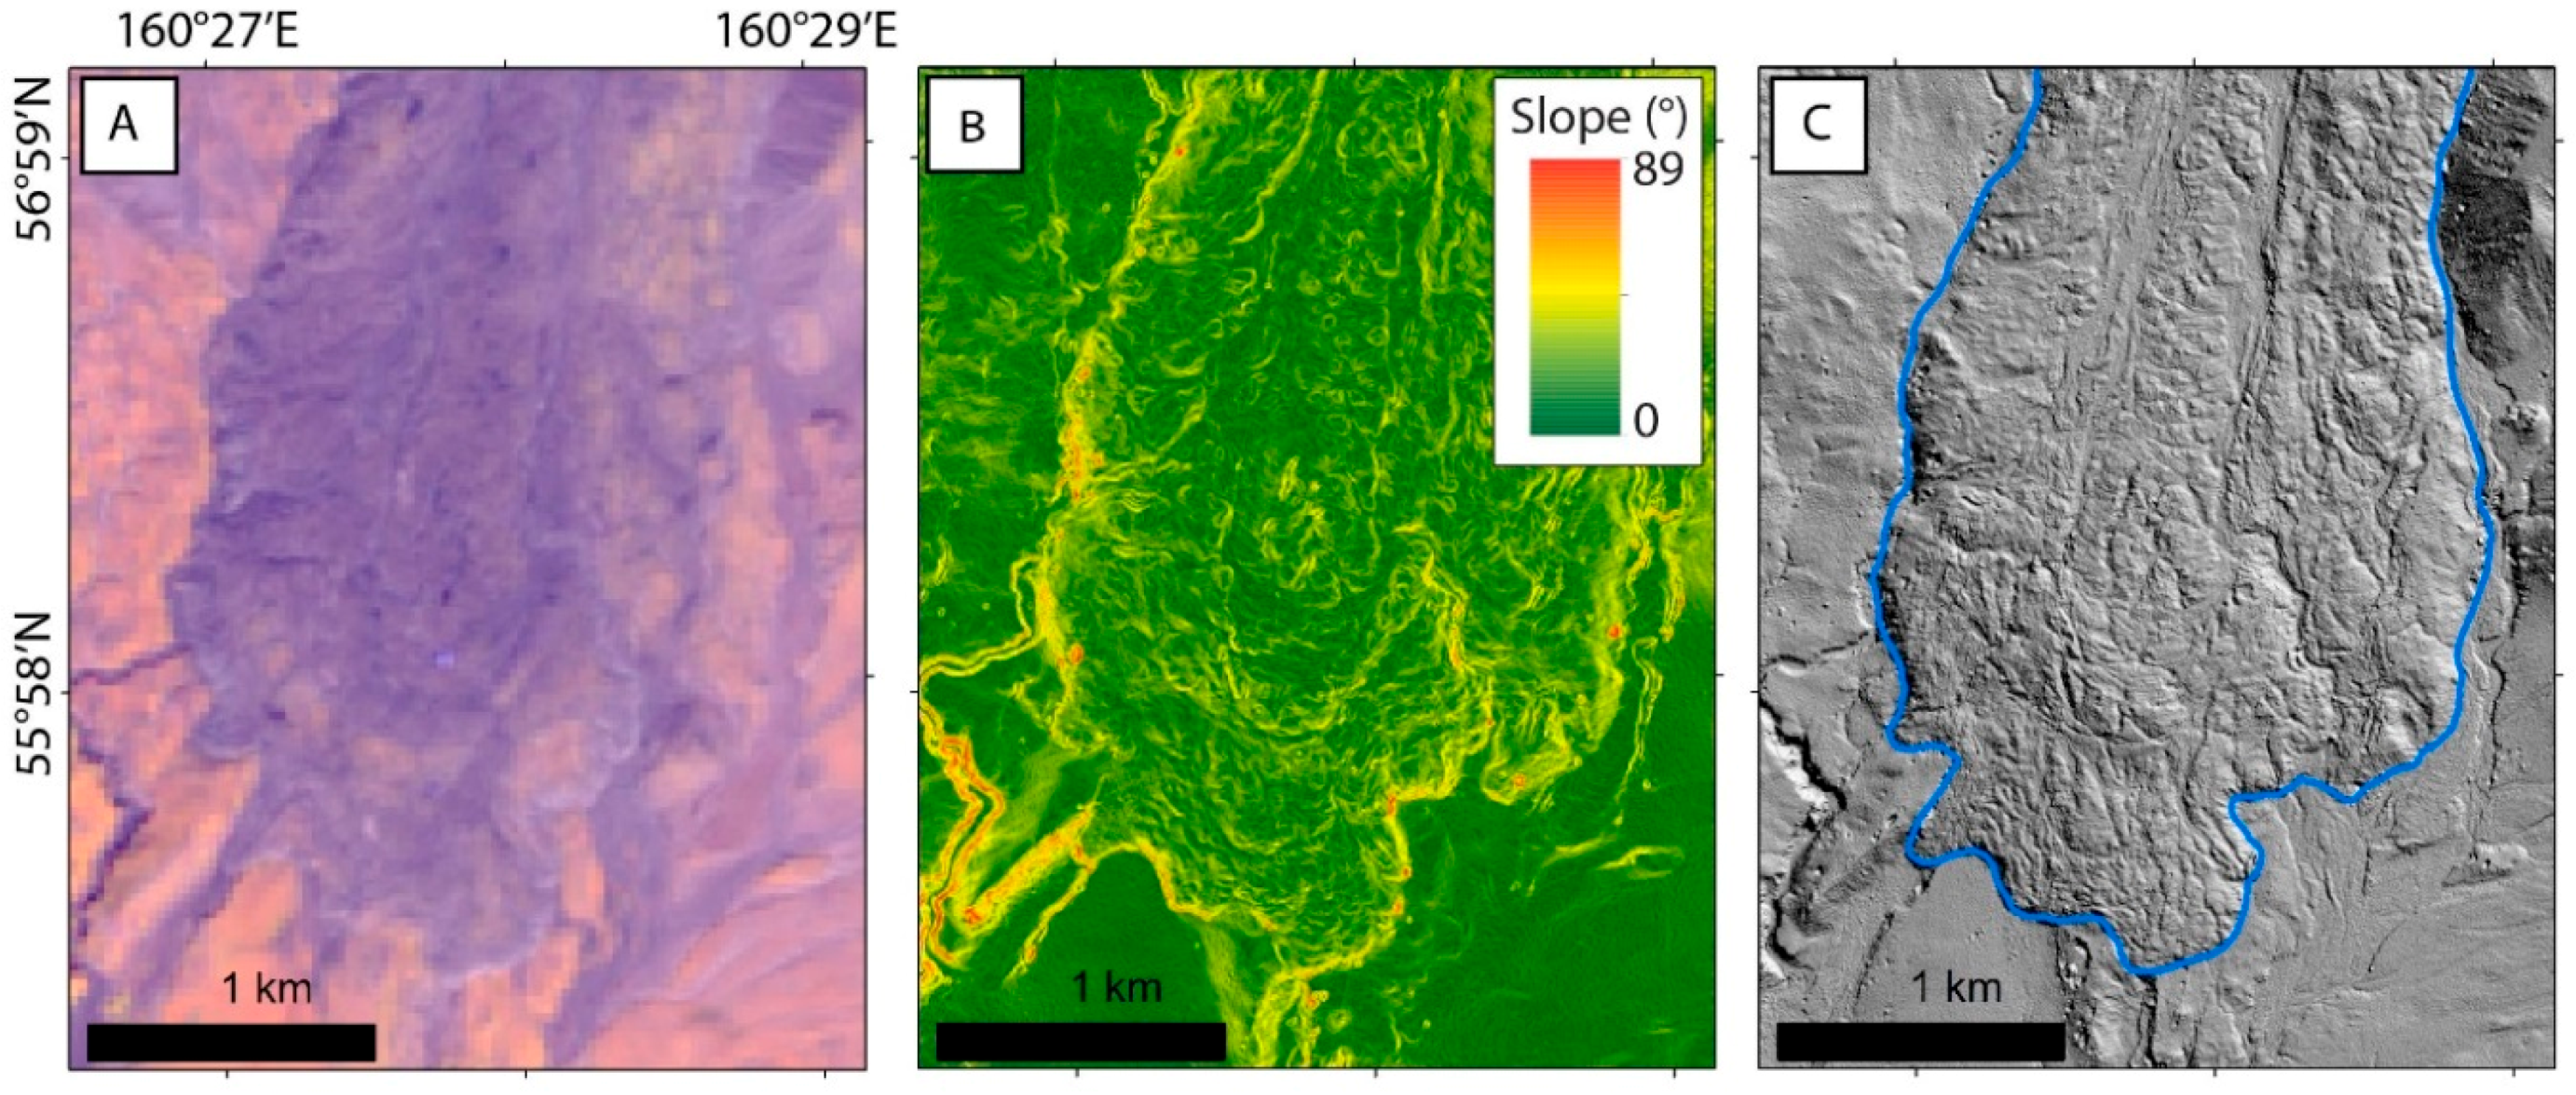
  • ArcticDEM is a useful dataset for mapping glaciers. This is particularly apparent for debris-covered glaciers (or debris-covered sections of glaciers), since their margins can be difficult to distinguish in satellite imagery but are often readily identifiable as breaks-of-slope in the ArcticDEM data.
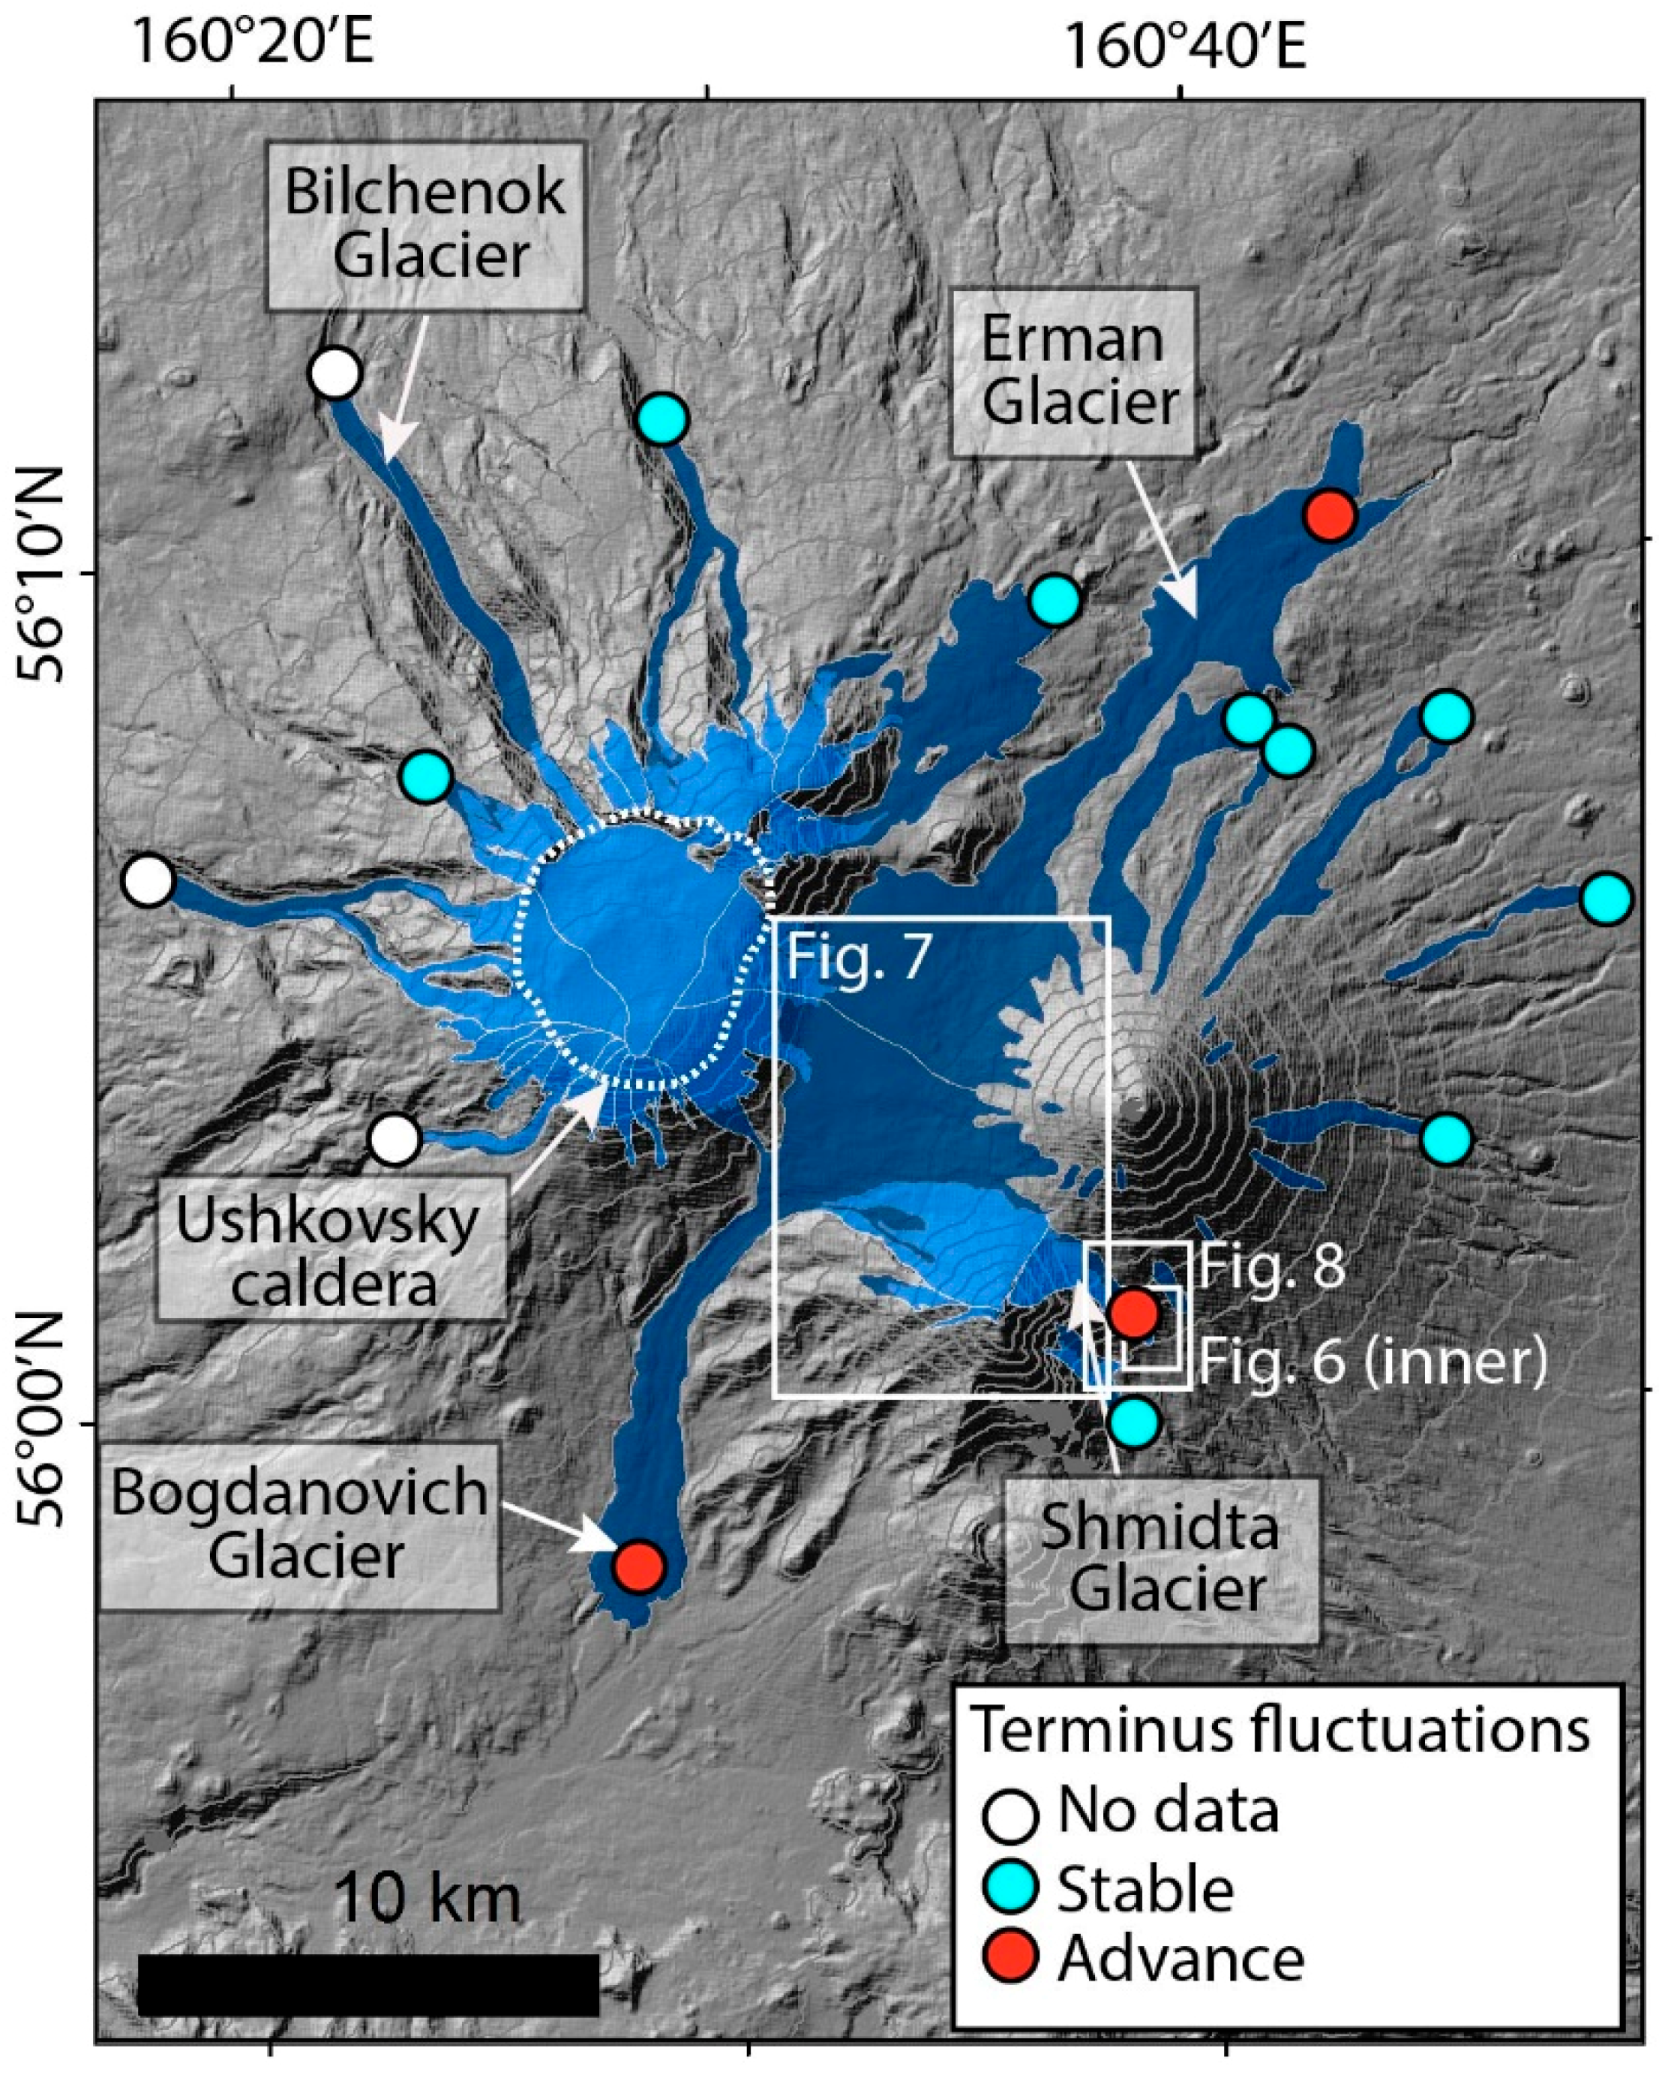
  • In 2015, glaciers in the NKVG covered a total area of ~182.7 ± 6.5 km2. These glaciers typically extend (up to ~20 km) from a central icefield (linking the Ushkovsky and Klyuchevskoy volcanoes), but there are also smaller, independent ice masses on the N, E, and SE slopes of Klyuchevskoy.
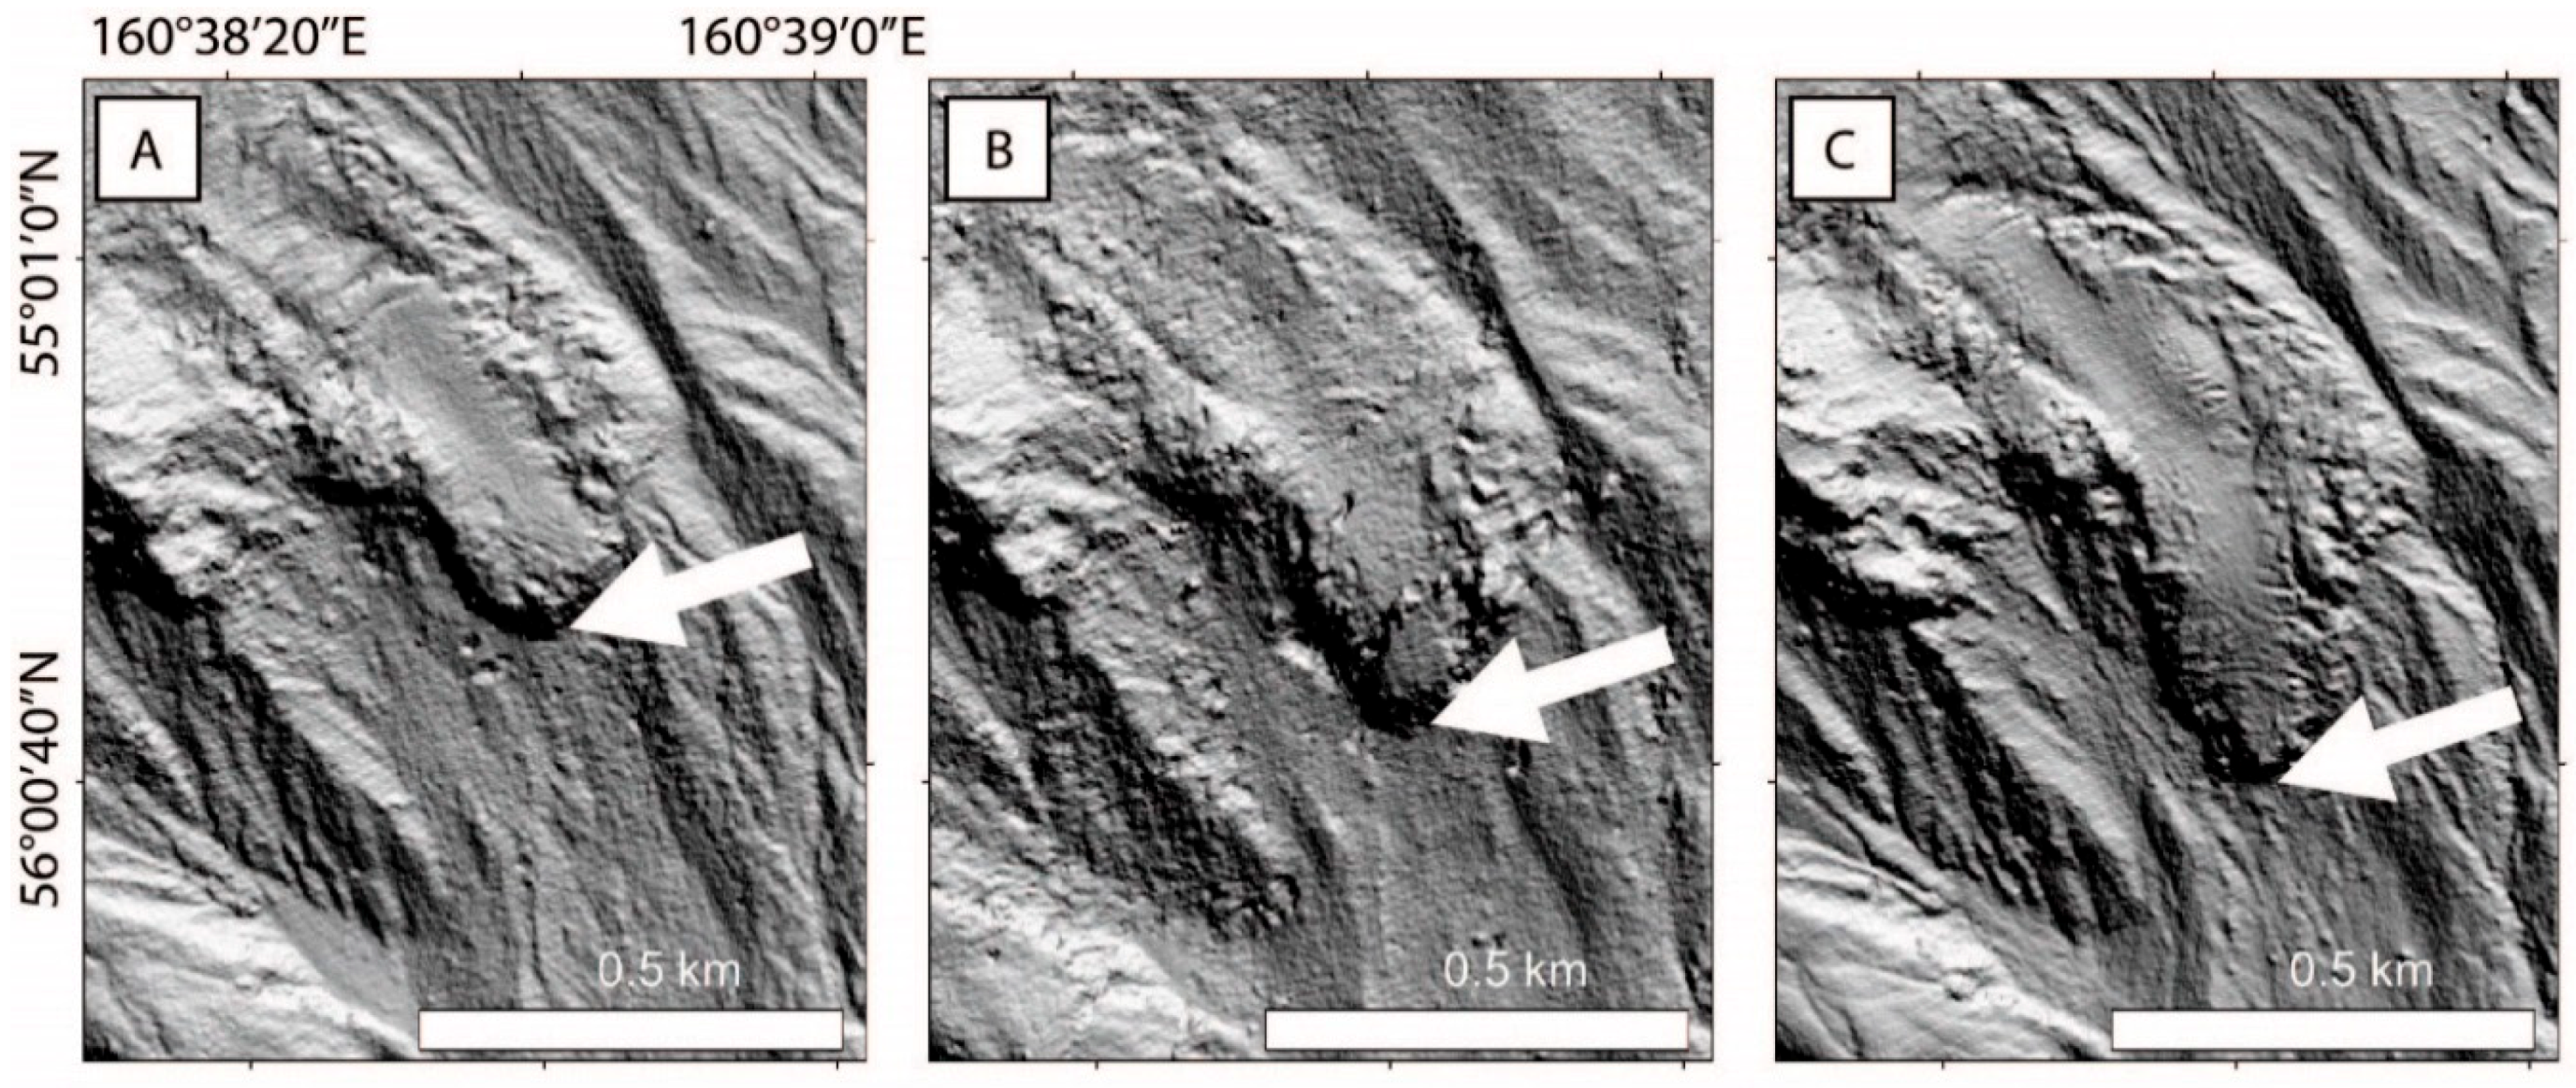
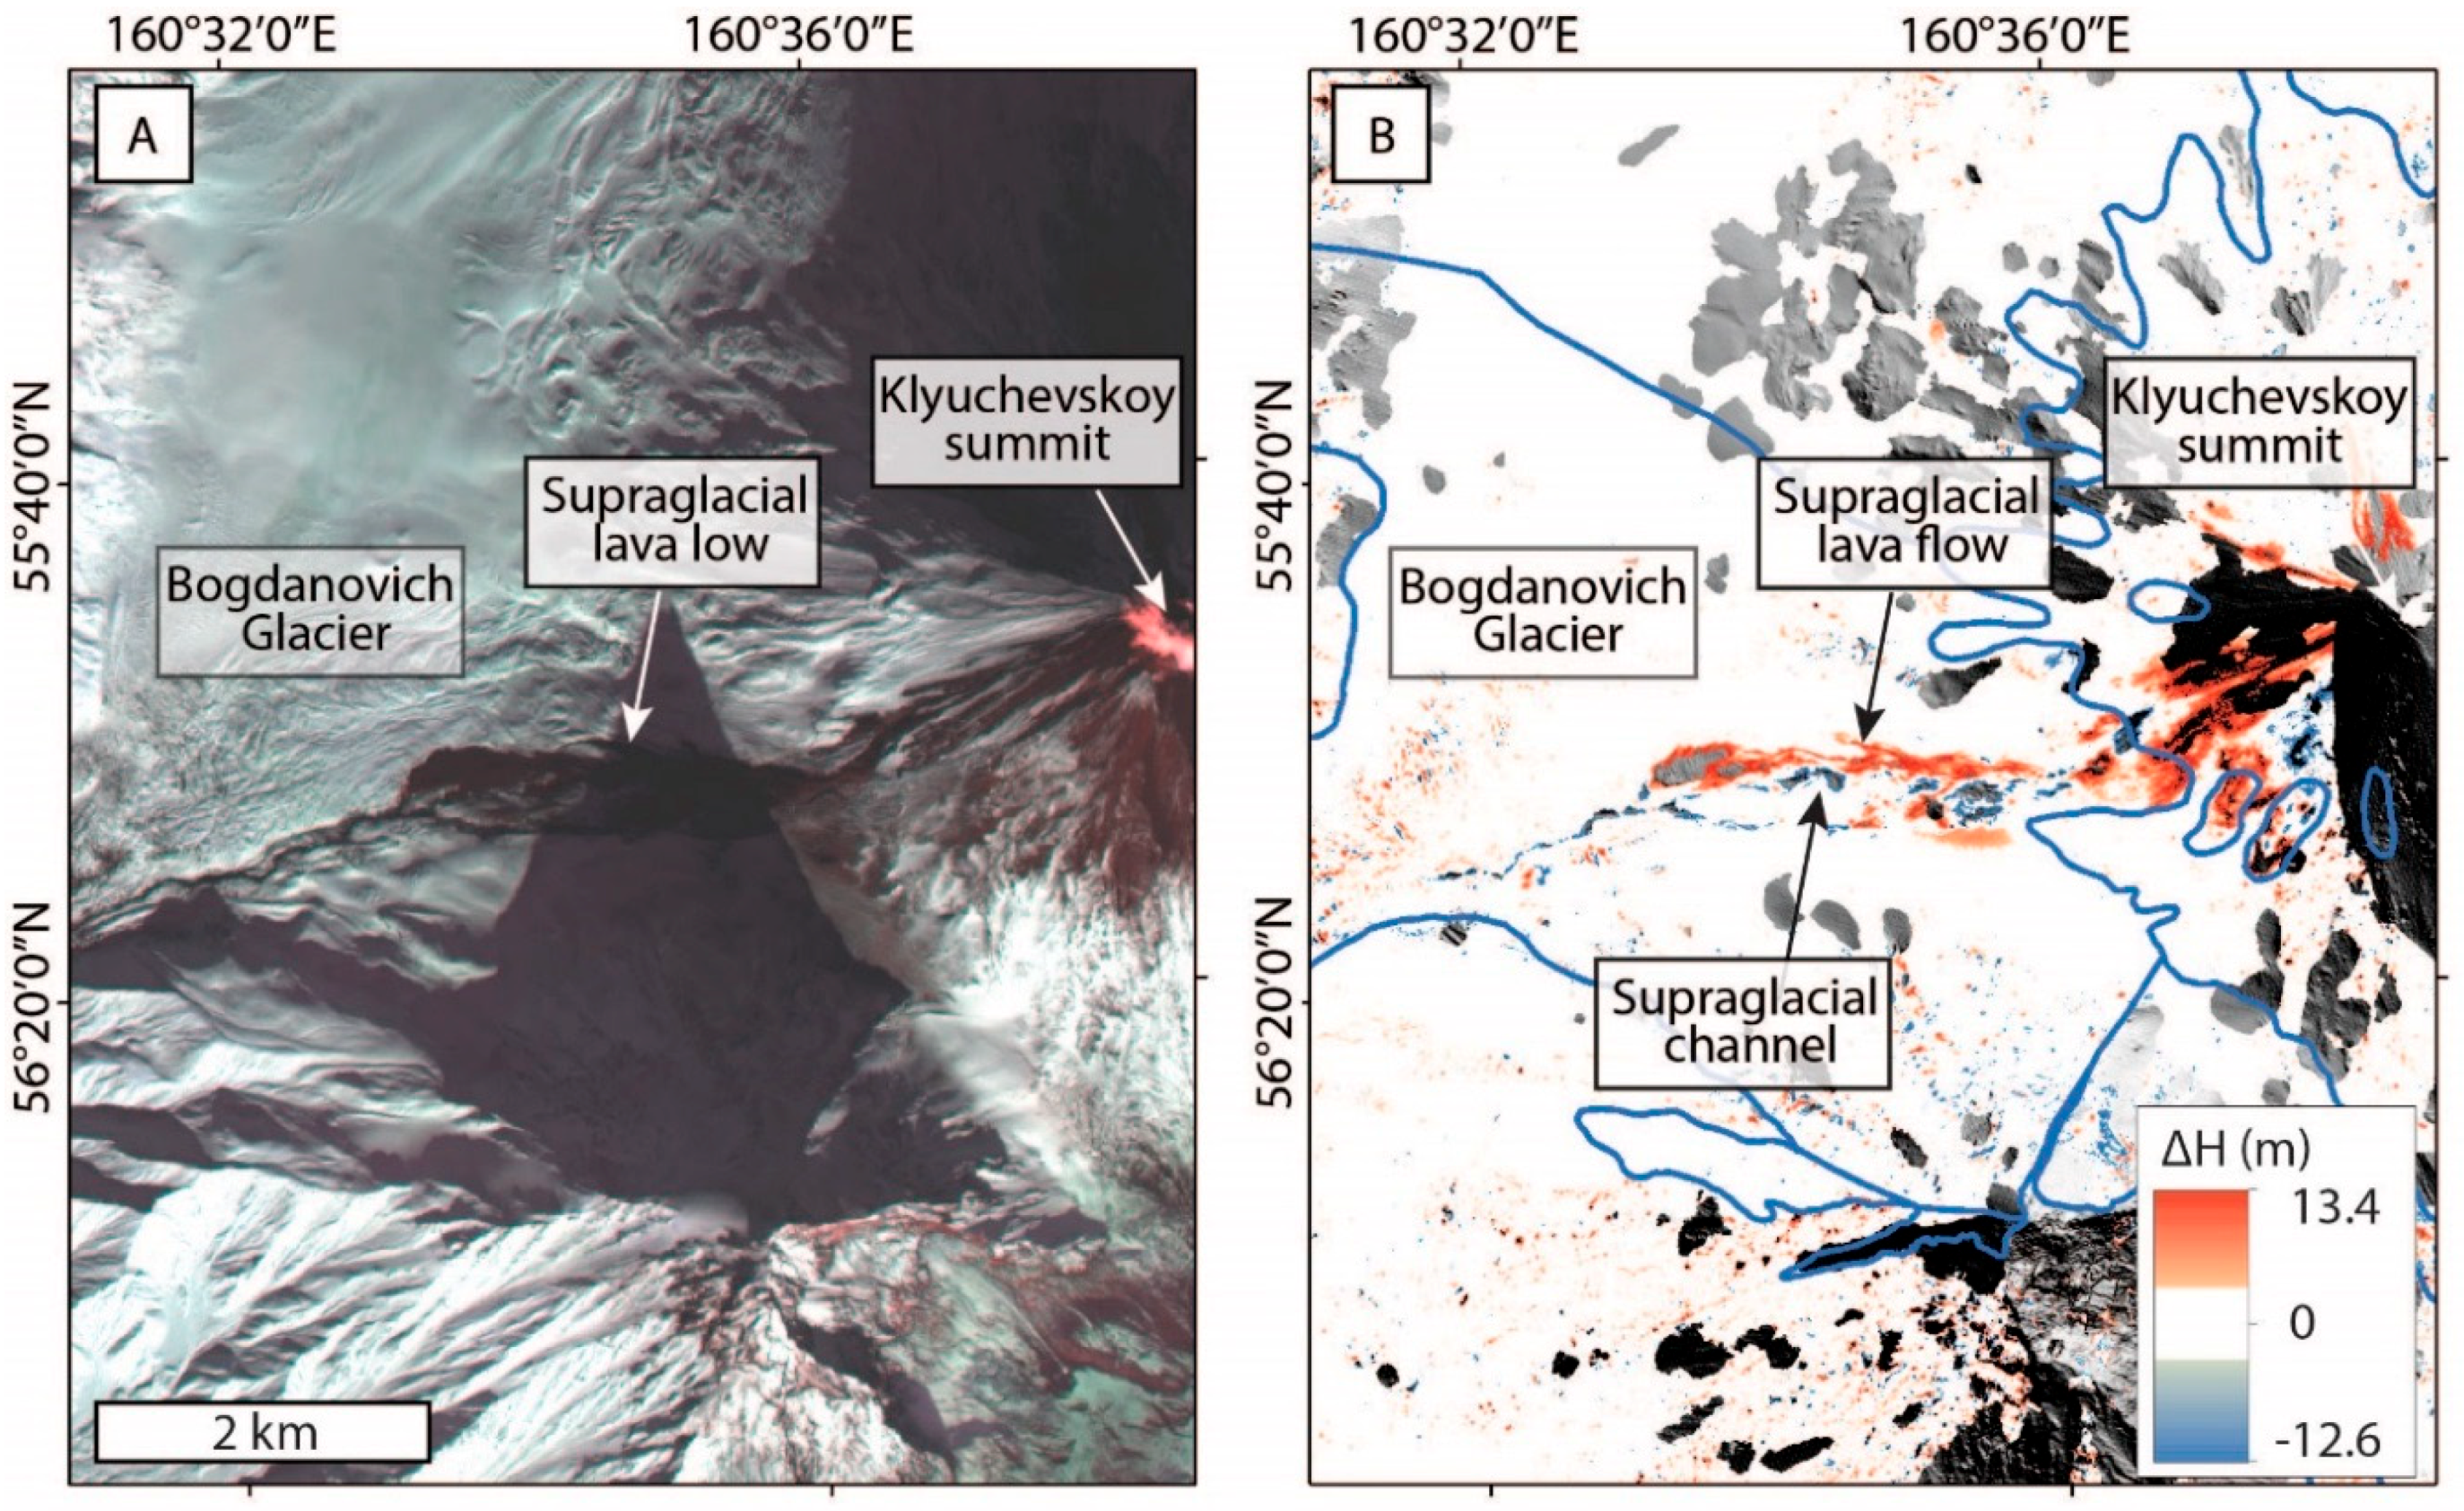
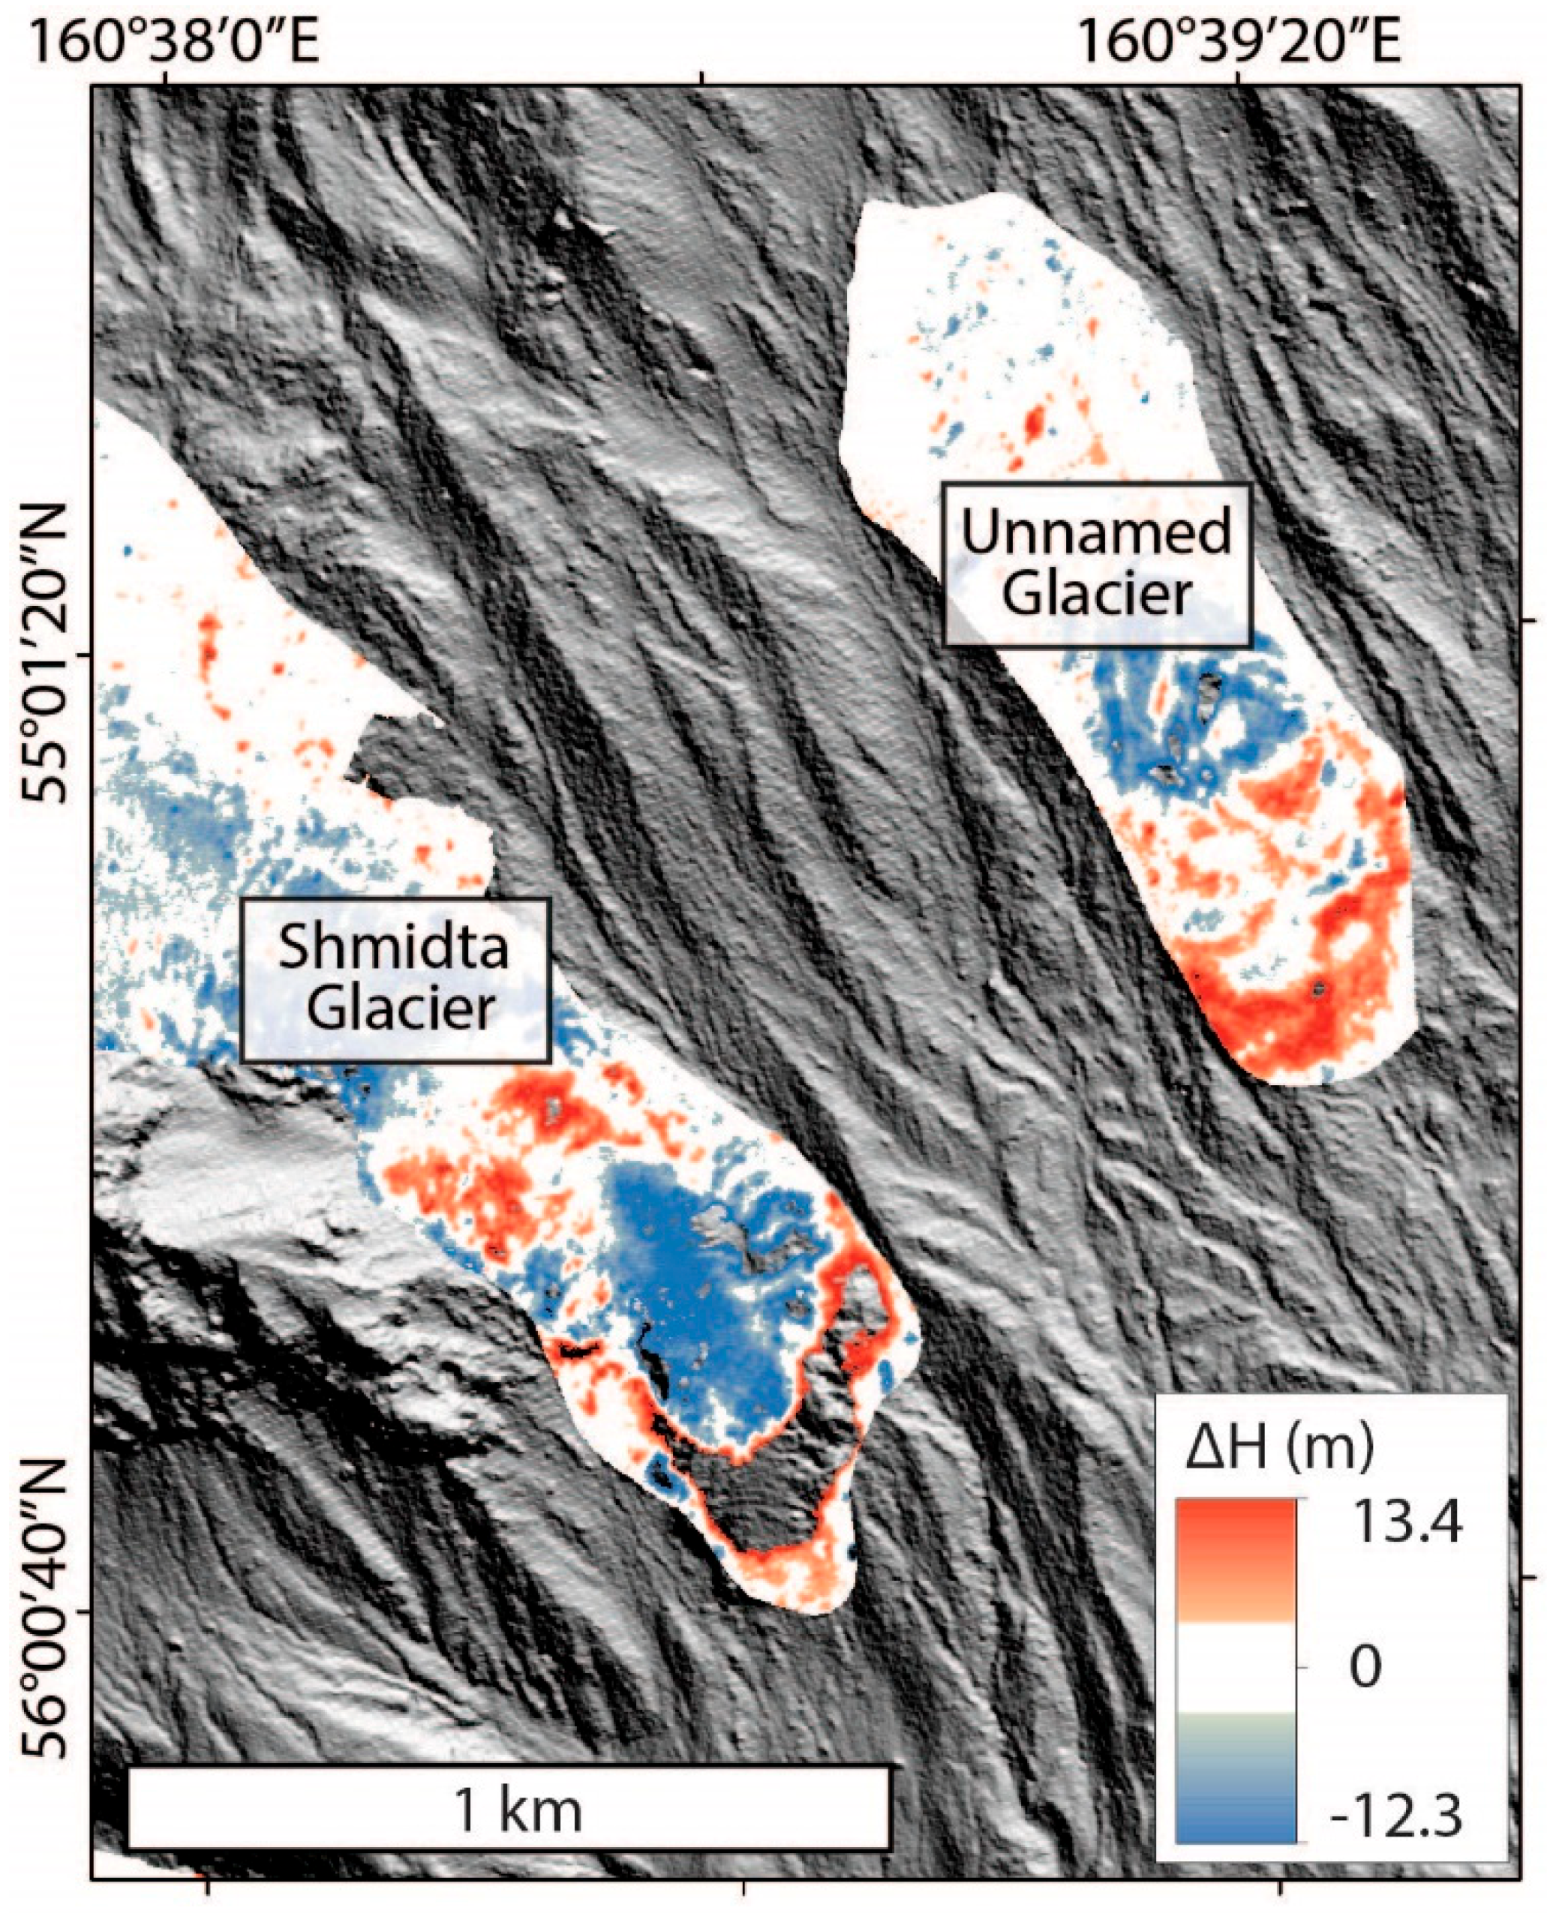
  • Mapping from multi-temporal DSMs shows that three main glaciers in the NKVG (Shmidta, Bogdanovich, and Erman) experienced terminus advance during the period 2012–2016. In each case, this advance is a continuation of a longer trend presumed to reflect the role of extensive supraglacial debris in limiting ice ablation. There is also evidence of terminus advance at a smaller unnamed glacier during the 2012–2016 period, though whether this reflects a long-term trend remains unclear. The ArcticDEM data reveal little indication of terminus fluctuations of other glaciers in the NKVG during this period. However, surface elevation changes suggest localised ice melt due to supraglacial lava/debris flows.
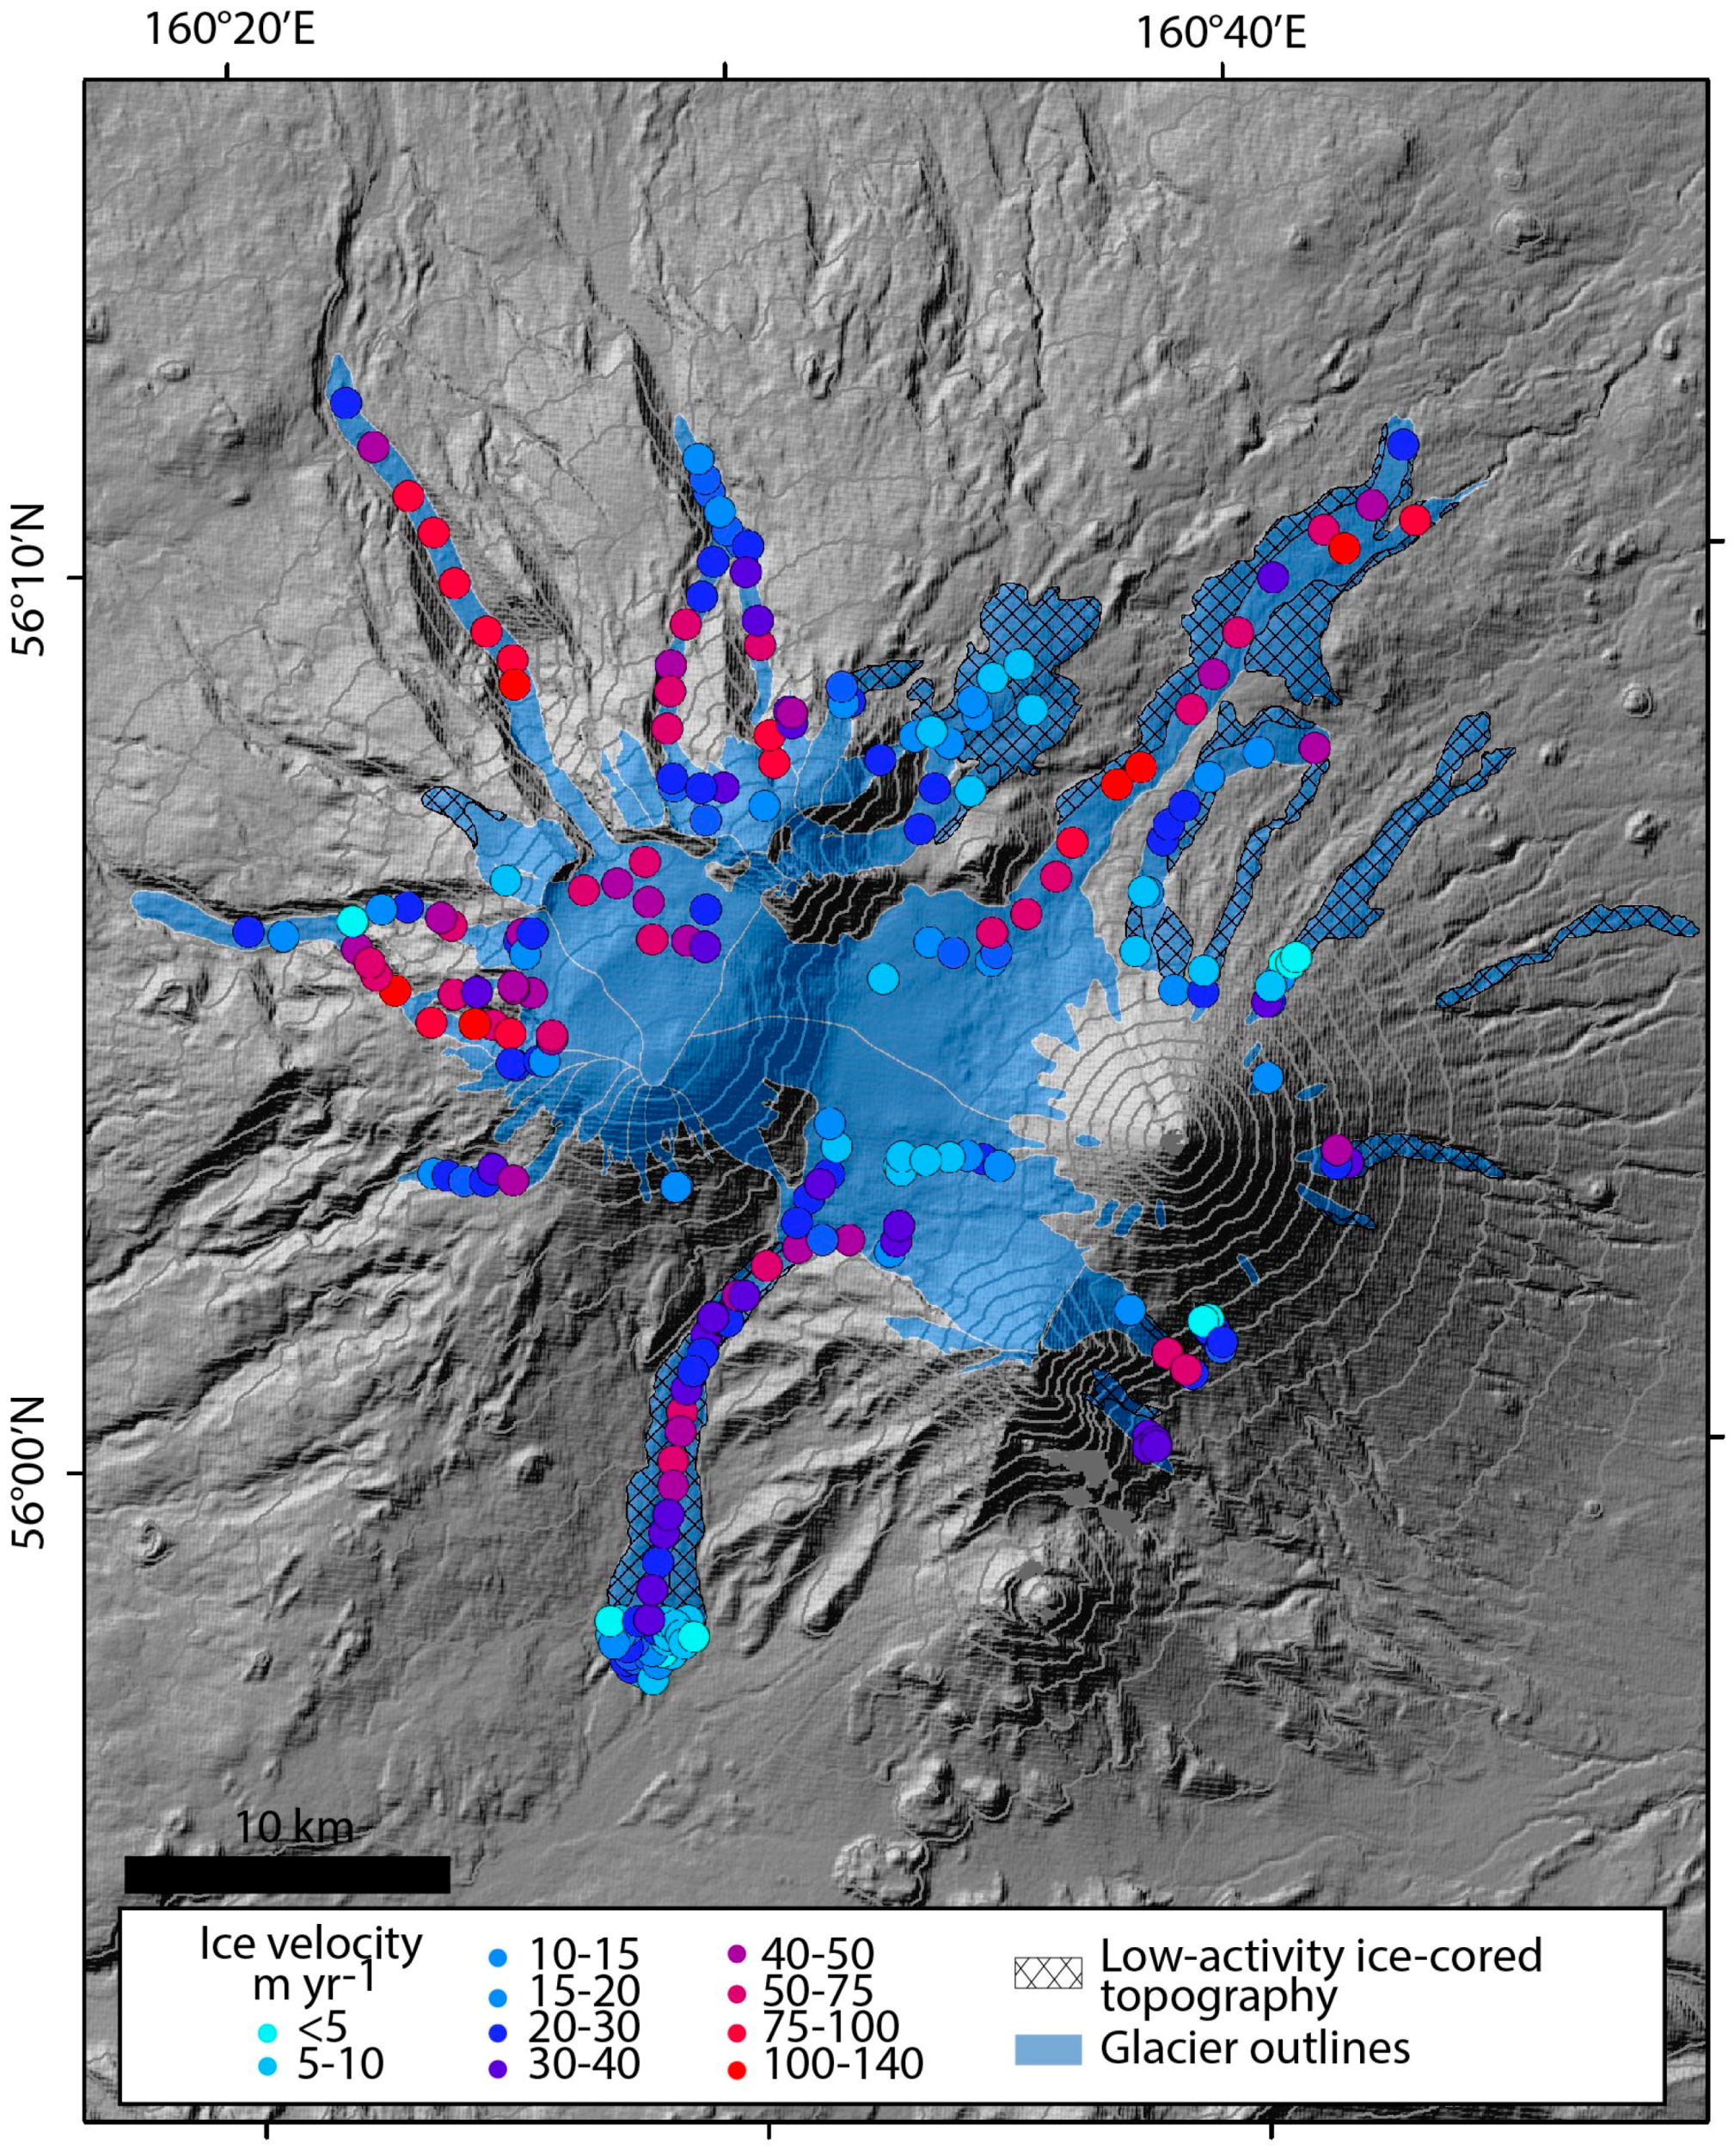
  • In the first study to measure glacier velocities across the region, the multi-temporal DSMs reveal that during the period 2012–2015, glacier surface velocities in the NKVG were 5–140 m yr−1. The highest velocities (>100 m yr−1) are found for the major outlets of the region’s central icefield and are typically higher than for other extensively debris-covered glaciers globally. These elevated velocities likely reflect the influence of ice supply from the high altitude (~3900 m a.s.l.) Ushkovsky caldera. By contrast, some lower-altitude sections of glaciers were effectively inactive during the period 2012–2015. Though comparison is sometimes difficult, our velocities are generally consistent with previous studies in this region, and we therefore find little evidence to suggest recent speed-ups of slow-downs of these glaciers.
In all, the ArcticDEM is found to be a useful dataset for investigating the behaviour of debris-covered glaciers, such as those of the NKVG. However, limited spatial and temporal coverage mean that these data are best used in conjunction with satellite and airborne imagery combined with field-based investigations. The utility of ArcticDEM is particularly apparent in remote (and often cloud-covered) areas such as Kamchatka, where our understanding of glacier behaviour is currently very limited.

Author Contributions

Conceptualization, I.B., M.D. and A.M.; Methodology, I.B., I.K., S.L., H.L., J.M.; Writing-Original Draft Preparation, I.B.; Writing-Review & Editing, M.D., A.M., I.K., S.L., H.L., J.M.

Funding

DEMs were created from DigitalGlobe, Inc., imagery and funded under National Science Foundation awards 1043681, 1559691, and 1542736.

Acknowledgments

We thank C. Scott Watson and two anonymous reviewers for helpful comments and suggestions.

Conflicts of Interest

The authors declare no conflict of interest.

References

  1. Solomina, O.; Wiles, G.; Shiraiwa, T.; D’Arrigo, R. Multiproxy records of climate variability for Kamchatka for the past 400 years. Clim. Past 2007, 3, 119–128. [Google Scholar] [CrossRef] [Green Version]
  2. Earl, L.; Gardner, A. A satellite-derived glacier inventory for North Asia. Ann. Glaciol. 2016, 57, 50–60. [Google Scholar] [CrossRef]
  3. Yamaguchi, S.; Naruse, R.; Shiraiwa, T. Climate reconstruction since the Little Ice Age by modelling Koryto glacier, Kamchatka Peninsula, Russia. J. Glaciol. 2008, 54, 125–130. [Google Scholar] [CrossRef] [Green Version]
  4. Muraviev, A.Y.; Nosenko, G.A. Glaciation change in northern part of the Middle Range on Kamchatka Peninsula in the second half of the XX century. Ice Snow 2013, 2, 5–12, (In Russian with English abstract). [Google Scholar] [CrossRef]
  5. Muraviev, A.Y. Glacier size changes in Kronotsky Peninsula and Alney-Chashakondzha Massif, Kamchatka Peninsula in the second half of XX century and the beginning of XXI century. Ice Snow 2014, 2, 22–28, (In Russian with English summary). [Google Scholar]
  6. Lynch, C.M.; Barr, I.D.; Mullan, D.; Ruffell, A. Rapid glacial retreat on the Kamchatka Peninsula during the early 21st century. Cryosphere 2016, 10, 1809–1821. [Google Scholar] [CrossRef] [Green Version]
  7. Yamaguchi, S.; Sawagaki, T.; Matsumoto, T.; Muravyev, Y.D.; Naruse, R. Influence of Debris Cover on Ogive-like Surface Morphology of Bilchenok Glacier in Kamchatka. Arct. Antarct. Alp. Res. 2007, 39, 332–339. [Google Scholar] [CrossRef]
  8. Muraviev, Y.D.; Muraviev, A.Y.; Osipova, G.B. Features of dynamics of ice files on active volcanoes, Kamchatka. In Proceedings of the 7th Biennial Workshop on Japan-Kamchatka-Alaska Subduction Processes: Mitigating Risk through International Volcano, Earthquake, and Tsunami Science, Petropavlovsk-Kamchatsky, Russia, 25–30 August 2011. JKASP 93. [Google Scholar]
  9. Muraviev, A.Y.; Muraviev, Y.D. Fluctuations of glaciers of the Klyuchevskaya group of volcanoes in the 20th–21st centuries. Ice Snow 2016, 56, 480–492, (In Russian with English abstract). [Google Scholar]
  10. Dokukin, M.D.; Seynova, I.B.; Savernyuk, E.A.; Chernomorets, S.S. On advancing of glaciers due to activity of the Klyuchevskaya Sopka volcano (Kamchatka). Ice Snow 2017, 57, 10–24, (In Russian with English abstract). [Google Scholar] [CrossRef] [Green Version]
  11. Yamaguchi, S.; Matsumoto, T.; Sawagaki, T.; Muravyev, Y.D.; Ovsyannikov, A.A.; Naruse, R. Glaciological research of Bilchenock Glacier in Kamchatka. Bull. Glaciol. Res. 2000, 17, 43–50. [Google Scholar]
  12. Vinogradov, V.N. Inventory of Glaciers of the USSR, Kamchatka, 20; Gidrometeoizdat: Leningrad, Russia, 1968. (In Russian) [Google Scholar]
  13. Khromova, T.; Nosenko, G.; Kutuzov, S.; Muraviev, A.; Chernova, L. Glacier area changes in Northern Eurasia. Environ. Res. Lett. 2014, 9, 015003. [Google Scholar] [CrossRef] [Green Version]
  14. Muraviev, A.Y. Fluctuations of Glaciers of Kamchatka in the Second Half of XX—Beginning of XXI Centuries. Ph.D. Thesis, Institute of Geography of the Russian Academy of Sciences, Moscow, Russia, 2017. (In Russian). [Google Scholar]
  15. Morin, P.; Porter, C.; Cloutier, M.; Howat, I.M.; Noh, M.J.; Willis, M.; Bates, B.; Willamson, C.; Peterman, K. ArcticDEM; a publically available, high resolution elevation model of the Arctic. EGU Gen. Assem. Conf. Abstr. 2016, 18, 8396. [Google Scholar]
  16. ArcticDEM. Available online: https://www.pgc.umn.edu/data/arcticdem/ (accessed on 7 June 2018).
  17. VONA/KVERT Weekly Release. Institute of Volcanology and Seismology FEB RAS: Kvert, Russia. Available online: http://www.kscnet.ru/ivs/kvert/index_eng.php (accessed on 4 April 2018).
  18. RGI Consortium. Randolph Glacier Inventory—A Dataset of Global Glacier Outlines: Version 6.0; Technical Report; Global Land Ice Measurements from Space: Boulder, CO, USA, 2017. [Google Scholar] [CrossRef]
  19. Muraviev, Y.D.; Ovsyannikov, A.A.; Shiraiwa, T. Activity of the northern volcano group according to drilling data in the Ushkovsky crater glacier, Kamchatka. J. Volcanol. Seismol. 2007, 1, 42–52. [Google Scholar] [CrossRef]
  20. Noh, M.J.; Howat, I.M. Automated stereo-photogrammetric DEM generation at high latitudes: Surface extraction with TIN-based search-space minimization (SETSM) validation and demonstration over glaciated regions. GISci. Remote Sens. 2015, 52, 198–217. [Google Scholar] [CrossRef]
  21. Noh, M.J.; Howat, I.M. The surface extraction from TIN based search-space minimization (SETSM) algorithm. ISPRS J. Photogramm. Remote Sens. 2017, 129, 55–76. [Google Scholar] [CrossRef]
  22. Dai, C.; Durand, M.; Howat, I.M.; Altenau, E.H.; Pavelsky, T.M. Estimating river surface elevation from ArcticDEM. Geophys. Res. Lett. 2018, 45, 3107–3114. [Google Scholar] [CrossRef]
  23. Matsumoto, T.; Kodama, Y.; Shiraiwa, T.; Yamaguchi, S.; Sone, T.; Nishimura, K.; Muravyev, Y.D.; Khomentovsky, P.A.; Yamagata, K. Meteorological observation by Automatic Weather Stations (AWS). In Alpine Regions of Kamchatka, Russia, 1996–1997; Low Temperature Science, Series A Data Report; Hokkaido University: Sapporo, Japan, 1997; Volume 56, pp. 53–68. [Google Scholar]
  24. Bajracharya, S.R.; Maharjan, S.B.; Shrestha, F. The status and decadal change of glaciers in Bhutan from the 1980s to 2010 based on satellite data. Ann. Glaciol. 2014, 55, 159–166. [Google Scholar] [CrossRef] [Green Version]
  25. Dai, C.; Howat, I.M. Measuring lava flows with ArcticDEM: Application to the 2012–2013 eruption of Tolbachik, Kamchatka. Geophys. Res. Lett. 2017, 44, 12133–12140. [Google Scholar] [CrossRef]
  26. Noh, M.J.; Howat, I.M. Automated coregistration of repeat digital elevation models for surface elevation change measurement using geometric constraints. IEEE Trans. Geosci. Remote Sens. 2014, 52, 2247–2260. [Google Scholar]
  27. Barr, I.D.; Lovell, H. A review of topographic controls on moraine distribution. Geomorphology 2014, 226, 44–64. [Google Scholar] [CrossRef] [Green Version]
  28. Vinogradov, V.N.; Muraviev, Y.D. Lava and ice interaction at the Klyuchevskoy volcano during the 1983 eruption. Volcanol. Seismol. 1985, 1, 29–46. (In Russian) [Google Scholar]
  29. Muravyev, Y.D.; Salamatin, A.N. Predictive estimate of ice mass dynamics in volcano tectonic valleys of the Klyuchevskoy volcano. Volcanol. Seismol. 1993, 4, 43–53. (In Russian) [Google Scholar]
  30. Gardner, J.S.; Hewitt, K. A surge of Bualtar Glacier, Karakoram Range, Pakistan: A possible landslide trigger. J. Glaciol. 1990, 36, 159–162. [Google Scholar] [CrossRef]
  31. Hewitt, K. Rock avalanches that travel onto glaciers and related developments, Karakoram Himalaya, Inner Asia. Geomorphology 2009, 103, 66–79. [Google Scholar] [CrossRef]
  32. Reznichenko, N.V.; Davies, T.R.; Alexander, D.J. Effects of rock avalanches on glacier behaviour and moraine formation. Geomorphology 2011, 132, 327–338. [Google Scholar] [CrossRef]
  33. Deline, P.; Hewitt, K.; Reznichenko, N.; Shugar, D. Rock avalanches onto glaciers. In Landslide Hazards, Risks and Disasters; Davies, T., Shroder, J.F., Eds.; Elsevier: Amsterdam, The Netherlands, 2015; pp. 263–319. ISBN 978-0-12-396452-6. [Google Scholar]
  34. Kirkbride, M.P.; Dugmore, A.J. Glaciological response to distal tephra fallout from the 1947 eruption of Hekla, south Iceland. J. Glaciol. 2003, 49, 420–428. [Google Scholar] [CrossRef]
  35. Hildreth, W.; Fierstein, J. The Novarupta-Katmai Eruption of 1912—Largest Eruption of the Twentieth Century: Centennial Perspectives; U.S. Geological Survey Professional Paper 1791; USGS: Reston, VA, USA, 2012; p. 259.
  36. Jamieson, S.S.; Ewertowski, M.W.; Evans, D.J. Rapid advance of two mountain glaciers in response to mine-related debris loading. J. Geophys. Res. Earth Surf. 2015, 120, 1418–1435. [Google Scholar] [CrossRef] [PubMed] [Green Version]
  37. Patrick, M.R.; Smellie, J.L. Synthesis A spaceborne inventory of volcanic activity in Antarctica and southern oceans, 2000–10. Antarct. Sci. 2013, 25, 475–500. [Google Scholar] [CrossRef] [Green Version]
  38. Barr, I.D.; Lynch, C.M.; Mullan, D.; De Siena, L.; Spagnolo, M. Volcanic impacts on modern glaciers: A global synthesis. Earth Sci. Rev. 2018, 182, 186–203. [Google Scholar] [CrossRef]
  39. Edwards, B.R.; Karson, J.; Wysocki, R.; Lev, E.; Bindeman, I.; Kueppers, U. Insights on lava- ice/snow interactions from large-scale basaltic melt experiments. Geology 2013, 41, 851–854. [Google Scholar] [CrossRef]
  40. Quincey, D.J.; Luckman, A.; Benn, D. Quantification of Everest region glacier velocities between 1992 and 2002, using satellite radar interferometry and feature tracking. J. Glaciol. 2009, 55, 596–606. [Google Scholar] [CrossRef]
  41. Meier, M.F.; Post, A. What are glacier surges? Can. J. Earth Sci. 1969, 6, 807–817. [Google Scholar] [CrossRef]
  42. Sevestre, H.; Benn, D.I. Climatic and geometric controls on the global distribution of surge-type glaciers: Implications for a unifying model of surging. J. Glaciol. 2015, 61, 646–662. [Google Scholar] [CrossRef] [Green Version]
  43. Berthier, E.; Vadon, H.; Baratoux, D.; Arnaud, Y.; Vincent, C.; Feigl, K.L.; Rémy, F.; Legresy, B. Surface motion of mountain glaciers derived from satellite optical imagery. Remote Sens. Environ. 2005, 95, 14–28. [Google Scholar] [CrossRef]
  44. Kääb, A. Combination of SRTM3 and repeat ASTER data for deriving alpine glacier flow velocities in the Bhutan Himalaya. Remote Sens. Environ. 2005, 94, 463–474. [Google Scholar] [CrossRef]
  45. Herman, F.; Anderson, B.; Leprince, S. Mountain glacier velocity variation during a retreat/advance cycle quantified using sub-pixel analysis of ASTER images. J. Glaciol. 2011, 57, 197–207. [Google Scholar] [CrossRef]
  46. Kumar, V.; Venkataramana, G.; Høgda, K.A. Glacier surface velocity estimation using SAR interferometry technique applying ascending and descending passes in Himalayas. Int. J. Appl. Earth Obs. Geoinf. 2011, 13, 545–551. [Google Scholar] [CrossRef]
  47. Quincey, D.J.; Copland, L.; Mayer, C.; Bishop, M.; Luckman, A.; Belo, M. Ice velocity and climate variations for Baltoro Glacier, Pakistan. J. Glaciol. 2009, 55, 1061–1071. [Google Scholar] [CrossRef]
  48. Chernomorets, S.S.; Tutubalina, O.V.; Seinova, I.B.; Petrakov, D.A.; Nosov, K.N.; Zaporozhchenko, E.V. Glacier and debris flow disasters around Mt. Kazbek, Russia/Georgia. In Debris-Flow Hazards Mitigation: Mechanics, Prediction, and Assessment; Chen, C.L., Major, J.J., Eds.; Millpress: Amsterdam, The Netherlands, 2007; pp. 691–702. ISBN 978-90-5966-059-5. [Google Scholar]
  49. Rivera, A.; Bown, F.; Carrión, D.; Zenteno, P. Glacier responses to recent volcanic activity in Southern Chile. Environ. Res. Lett. 2012, 7, 014036. [Google Scholar] [CrossRef] [Green Version]
  50. Sturm, M.; Hall, D.K.; Benson, C.S.; Field, W.O. Non-climatic control of glacier-terminus fluctuations in the Wrangell and Ghugach Mountains, Alaska, USA. J. Glaciol. 1991, 37, 348–356. [Google Scholar] [CrossRef]
  51. Liaudat, D.T.; Penas, P.; Aloy, G. Impact of volcanic processes on the cryospheric system of the Peteroa Volcano, Andes of southern Mendoza, Argentina. Geomorphology 2014, 208, 74–87. [Google Scholar] [CrossRef]
Figure 1. (A) Overview map of the Kamchatka Peninsula showing the general locations of modern glaciers [6] and active volcanoes [17]. The boxed areas show the Kluchevskoy Volcanic Group (KVG), and its northern sector (NKVG), the focus of this study. (B) A Landsat 8 satellite image (date: 21 September 2014) of the NKVG. Active volcanoes (red triangles) include Ushkovsky (U), Klyuchevskoy (K), and Bezymianny (BZ). Numbered white dots mark the approximate locations of modern glaciers (most of which are debris-covered) as documented by [9]. These glaciers include (1) Kozirevsky, (2) Ushkovsky, (3) No. 161, (4) Bilchenok, (5) Eulchenok, (6) Sredny, (7) Erman, (8) Obvalny, (9) Vlodavtsa, (10) Sopochny, (11) Kellya, (12) Piipa, (13) Shmidta, (14) Kamensky, and (15) Bogdanovich. Detailed information about these glaciers is presented in Table 1. This figure also shows the glaciers (outlined in white) as depicted in the Randolph Glacier Inventory version 6 [18].
Geosciences 08 00216 g001
Figure 2. Coverage of the ArcticDEM 2m digital surface model (DSM) strips for the NKVG. (A) 2012. (B) 2013. (C) 2014. (D) 2015. (E) 2016. Mapped glaciers are shown (in blue) in the background image. Strip details are presented in Table 2.
Geosciences 08 00216 g002
Figure 3. Crevasses in the debris-covered upper section of Erman glacier. (A) ArcticDEM 2 m DSM shaded from the NE (July 2012). Blue line shows the mapped glacier margin. (B) Pan-sharpened Landsat 8 satellite image (15 m spatial resolution) (date: 21 September 2014). Red arrows show general ice flow direction. Location shown in Figure 1B.
Geosciences 08 00216 g003
Figure 4. The debris-covered terminus of Bogdanovich Glacier. (A) Pan sharpened Landsat 8 satellite image (15 m spatial resolution) (date: 21 September 2014). (B) Surface slope calculated from ArcticDEM 2 m DSM data (October 2015), demonstrating a notable break-of-slope around the glacier margins. (C) ArcticDEM 2 m DSM data shaded from the NE (October 2015), with the mapped glacier margin shown in blue. Location shown in Figure 1B.
Geosciences 08 00216 g004
Figure 5. Glaciers in the NKVG mapped from the ArcticDEM DSMs. Clean (light blue) and debris-covered (dark blue) ice (based on the Landsat 8 image in Figure 1B) are differentiated. Key glaciers (referred to in the text) are labelled, as is Ushkovsky caldera (dashed white line). Coloured dots indicate glacier terminus fluctuations as observed from the ArcticDEM data.
Geosciences 08 00216 g005
Figure 6. Evidence for terminus advance at Shmidta Glacier between (A) July 2012, (B) April 2014, and (C) October 2015 observed in the ArcticDEM 2m DSMs. The white arrow indicates the glacier terminus in each image. In total, the glacier advanced ~180 m over this period (~120 m between (A) and (B), and ~60 m between (B) and (C)). Location shown in Figure 5.
Geosciences 08 00216 g006
Figure 7. The upper section of Bogdanovich Glacier and adjacent areas on the slopes of Klyuchevskoy volcano. (A) A Landsat 8 satellite image (date: 27 October 2013) showing a lava/debris flow extending from the summit of Klyuchevskoy volcano and onto the surface of Bogdanovich Glacier. (B) Surface elevation change between July 2012 and April 2014 calculated from Arctic DEM 2 m DSMs data (white areas show where the surface elevation change is within measurement error). In this image, the greatest increase in elevation coincides with the lava flow in (A). In proximity to this localised area of increased surface elevation are notable areas of elevation decrease (shown in blue). These areas likely reflect channels incised into supraglacial ice or snow due to increased melt, and subsequent drainage, during and following the emplacement of the supraglacial lava/debris flow. Blue outlines in (B) show glacier margins. It is also clear from this image that for some of the smaller ice masses on the slopes of Klyuchevskoy (i.e., ice masses in the right centre of the image), volcanically derived lava/debris appears to dominate surface elevation change. Location shown in Figure 5.
Geosciences 08 00216 g007
Figure 8. Surface elevation change between July 2012 and April 2014 (calculated from Arctic DEM 2 m DSMs) for the terminus of Shmidta Glacier and an adjacent unnamed glacier (white areas show where the surface elevation change is within measurement error). Location shown in Figure 5.
Geosciences 08 00216 g008
Figure 9. Estimates of annual glacier surface velocity in the NKVG during the period 2012–2015 based on ArcticDEM data.
Geosciences 08 00216 g009
Table 1. Details of modern glaciers in the northern Kluchevskoy Volcanic Group (NKVG) (glacier locations shown in Figure 1B).
Glacier Number (in Figure 1B)Glacier NameCoordinates (° N,° E)Glacier Area (km2) *Glacier Area (km2) **Recent Fluctuations According to [9], unless Otherwise Stated.
1Kozirevsky56.053, 160.4282.52.61950–2013: glacier area increased by ~4.64 km2, though the 1950 glacier area is likely underestimated.
2Ushkovsky56.100, 160.3459.311.71950–2013: glacier area increased by ~1.73 km2.
19752013: glacier area decreased by ~0.57 ± 0.06 km2, and the terminus retreated 340 ± 10 m.
3No. 16156.115, 160.4192.33.51950–2013: glacier area decreased by ~0.29 km2.
4Bilchenok56.100, 160.48218.019.81950–2013: glacier area decreased by ~2.08 km2.
1959–1960: glacier terminus advanced (‘surged’) 1050–1150 m.
1982–1984: glacier terminus advanced (‘surged’) 700–800 m.
5Eulchenok56.173, 160.4978.29.21950–2013: glacier area increased by ~0.94 km2, and the terminus advanced 700–730 m.
19501975: terminus advanced 380–390 m.
19752013: terminus advanced 330 ± 10 m, but the terminus area decreased by ~0.04 ± 0.03 km2.
20102013: terminus was practically stationary.
6Sredny56.152, 160.6019.414.71950–2012: glacier area decreased by ~1.31 km2. Since 1984, the glacier terminus has been quasi-stationary, with some sections/periods experiencing retreat of 20–30 m and others advance of 20–40 m.
7Erman56.151, 160.66533.542.81945–2015: terminus advanced ~4000 m (near-constant ~50 m yr−1).
1950–2015: glacier area increased by ~8.13 km2.
8Obvalny56.099, 160.611-6.61975–2012: terminus area increased by ~2.87 ± 0.22 km2, and the terminus advanced 1800–1850 m.
9Vlodavtsa56.109, 160.669-2.01950–2012: glacier area decreased by ~0.31 km2, though Muraviev and Muraviev [9] consider the 1950 area estimate to be incorrect.
1967–1968: glacier area increased by ~0.5 km2, and the terminus advanced ~2200 m.
1975–2012: terminus area increased by ~0.23 ± 0.03 km2, and terminus advanced 500 ± 10 m.
10Sopochny56.101, 160.699-4.91953 (and directly following): glacier area increased by ~1 km2, and terminus advanced ~2000 m.
1975–2010: glacier area increased by ~0.19 ± 0.08 km2, and the terminus advanced 95 ± 10 m.
11Kellya56.095, 160.778-2.01950–2010: glacier area decreased by ~2.41 km2.
1983: significant part of the glacier’s accumulation area was destroyed by an eruption of Klyuchevskoy Volcano.
1975–2010: glacier area decreased by ~0.04 ± 0.03 km2, and terminus retreated 25 ± 10 m.
12Piipa56.053, 160.712-2.01950–2010: glacier area decreased by ~1.82 km2.
13Shmidta56.023, 160.6272.53.01950–2013: glacier area decreased by ~0.24 km2.
1975–2013: glacier area decreased by 0.28 ± 0.04 km2, and the terminus retreated 1730 ± 10 m.
1978–1987: glacier terminus advanced.
1987: part of the glacier destroyed by an eruption of Klyuchevskoy Volcano.
2007–2012: glacier terminus advanced ~500 m (100 m yr−1) [10].
2012–2013: glacier terminus advanced 105–110 m [10].
14Kamensky55.994, 160.640-1.41950–2013: glacier area increased by ~0.04 km2.
1975–2010: terminus area increased by 0.05 ± 0.01 km2, and the terminus advanced 170 ± 10 m.
15Bogdanovich56.009, 160.47623.642.81950–2013: glacier area increased by ~4.46 km2.
1975–2013: terminus area increased by 1.41 ± 0.07 km2, and the terminus advanced 950 ± 10 m.
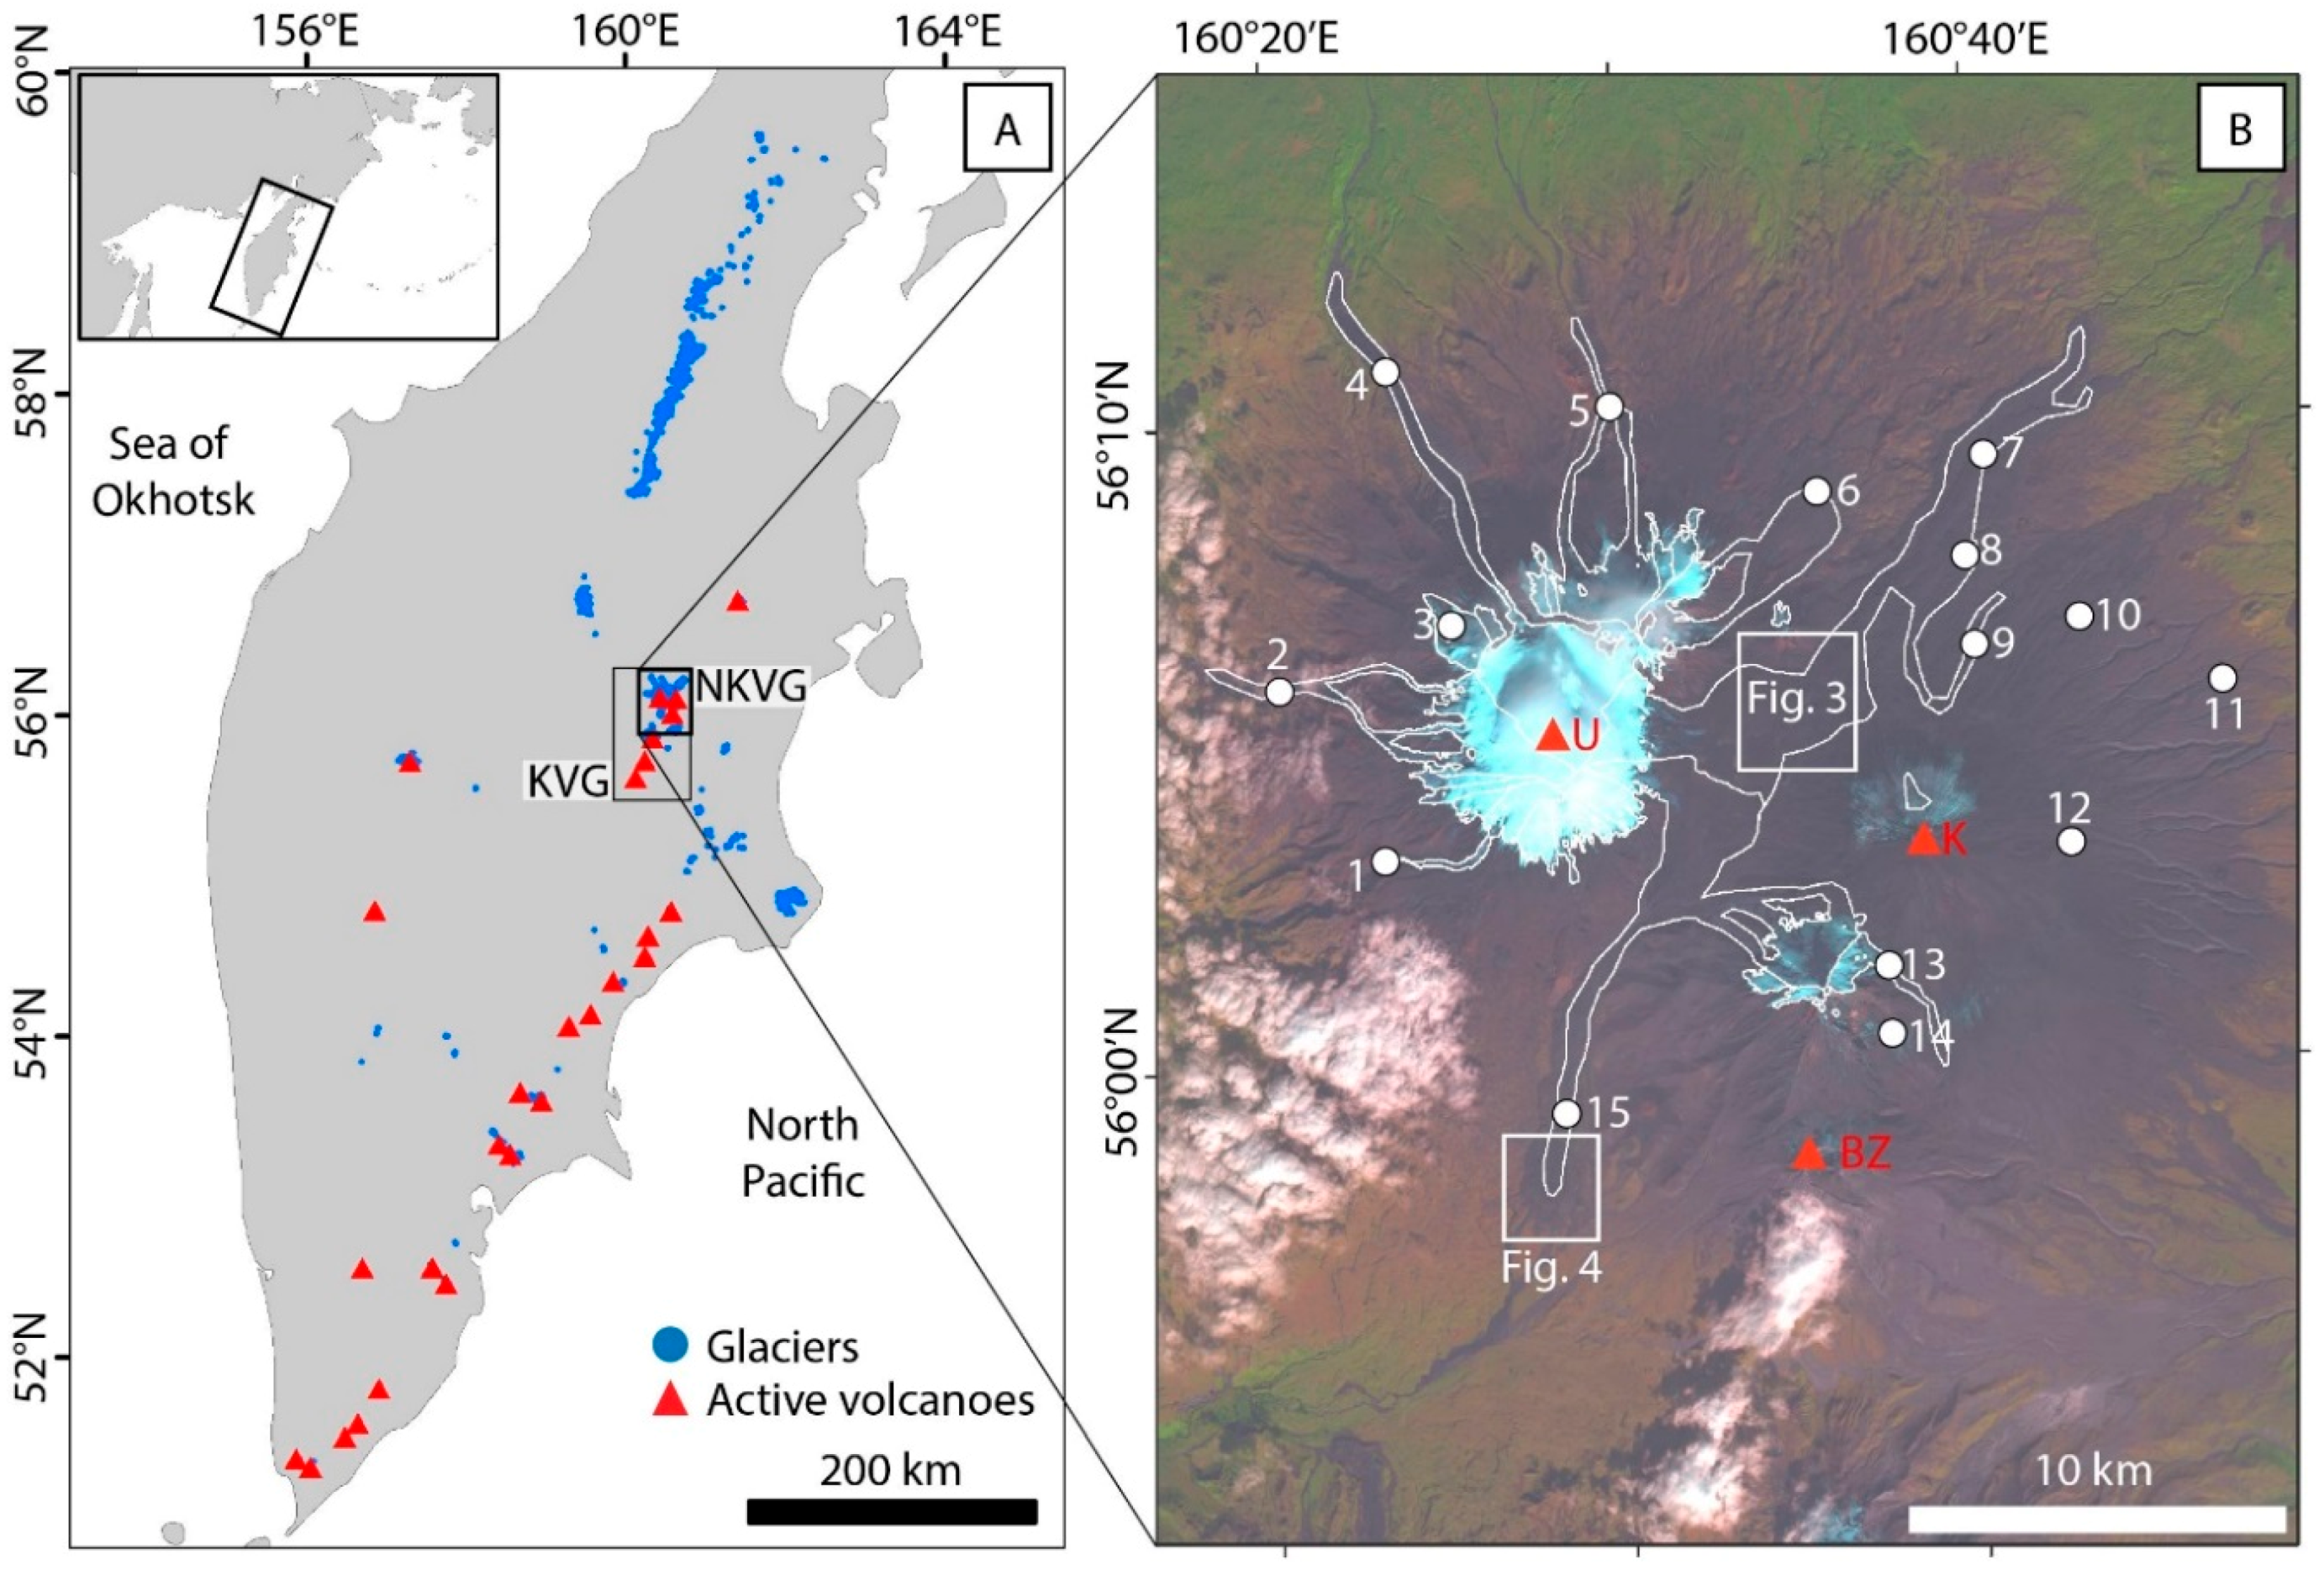
* Based on the Randolph Glacier Inventory version 6 (Figure 1B). ** As mapped in this study.
Table 2. ArcticDEM 2m digital surface model (DSM) strips used in this study.
Acquisition DateStrip IDSensorGlacier Area Covered (km2)Proportion of Total Glacierised Area (%)
23.07.20121050410000D55A00_1050410000C9D500GeoEye-169.438.0
07.04.20131020010021D64400_1020010021A5EB00WorldView-110.65.8
04.09.20131020010026495000_1020010024B35C00WorldView-1131.071.7
12.10.20131020010026D7D000_1020010025464000WorldView-172.339.6
24.12.2013102001002A132200_1020010026057900WorldView-16.23.4
17.04.2014102001002B779C00_102001002ECBF800WorldView-1152.283.3
17.09.201410200100347D3000_1020010032449B00WorldView-156.731.0
12.11.201410300100394B8400_10300100382EDB00WorldView-22.41.3
07.03.2015103001003E788300_103001003F40C000WorldView-2179.798.4
22.03.2015102001003C73CE00_102001003A90C000WorldView-116.79.1
25.03.2015102001003CB98200_102001003A67A000WorldView-1152.183.3
19.09.20151020010044925000_102001004226AE00WorldView-111.76.4
10.10.201510200100450ED100_1020010042387B00WorldView-121.311.7
13.02.20161020010048935700_1020010046957700WorldView-116.28.9

