Room for Rivers: Risk Reduction by Enhancing the Flood Conveyance Capacity of The Netherlands’ Large Rivers

1
Deltares, P.O. Box 177, NL 2600 MH Delft, The Netherlands
2
Department TPM, Delft University of Technology, Jaffalaan 5, NL 2628 BX Delft, The Netherlands
*
Author to whom correspondence should be addressed.
Geosciences 2018, 8(6), 224; https://doi.org/10.3390/geosciences8060224
Submission received: 20 May 2018
/
Revised: 12 June 2018
/
Accepted: 15 June 2018
/
Published: 20 June 2018
(This article belongs to the Special Issue Integrated Risk Analysis and Management of Floods)
Abstract
:The Netherlands has just finished implementing the Room for the Rivers program along the Rhine and Meuse Rivers in response to increasing river discharges. Recently, making more room for the river is, however, being challenged for future application because the flood defenses are assessed to be too weak and will need reinforcement anyway. To be able to decide on the most desirable policy for the remainder of the century, we require knowledge of all benefits and costs of individual interventions and strategic alternatives for flood mitigation. In this paper, we quantify some benefits of making more room for the rivers. We recognize and quantify two risk-reducing effects and provide results of analyses for the Rhine and Meuse Rivers in The Netherlands. Making room for rivers was originally advocated because it (1) reduces the consequences of flooding, as well as (2) reduces the probability of failure of the embankments. We have now quantified these effects allowing translation into risk reduction proper. Moreover, larger floodplain surface area may influence the relationship between discharge and flood level, which implies that rivers with widened floodplains are less sensitive to uncertainties about future river discharges. This does not reduce risk proper, but makes the river system more robust, as we shall argue in the discussion where we present risk reduction and robustness as complementary perspectives for assessing strategic alternatives for flood risk management.
1. Introduction
After two major floods in the 1990s, which were close to causing disastrous flooding and hence were wake-up calls after a period of no major floods since 1926, The Netherlands decided to change its policy on river flood management. It was decided that, instead of raising the embankments again and again, the river would be given more room in response to increasing river discharges. The 1993 and 1995 floods were the reason to adjust the then 1:1250 per year design discharge of the Rhine River from 15,000 m3/s to 16,000 m3/s. The planning of making more room for the river took place in the beginning of this century [1], followed by a key decision at the national level in which it was decided where to intervene [2]. The implementation of more than 30 interventions along three Rhine River branches has now just been finished, resulting in the lowering of the 1:1250 per year flood levels by 0.3 m on average by, among other things, adding 4400 ha of extra floodplain area to the 28,800 ha along The Netherlands’ Rhine branches that had remained [2]. A similar program is being implemented along the Meuse River, the second large river in The Netherlands.
The room for the river program is regarded a success from various viewpoints, not the least because of its additional benefits for economy and ecology (cf. [2]). Whether it achieved its prime goal, namely reducing flood risk [3,4], is however being challenged lately, because the flood defenses are assessed as not so much being too low, but rather too fragile. This means that the flood water level may not be the key factor determining flood risk, but rather the fragility of the embankments. In addition, if the embankments are to be reinforced anyway, then why not raise them at the same time? This places the policy makers for a dilemma: should the policy principle of making more room for the rivers be maintained in the process of counteracting climate change into the future, or is it more desirable to return to raising the embankments again given the fact that this is cheaper as they need reinforcement anyway? In answer to this dilemma, there is a need to bring together all relevant decision information in support of the policy making, but especially to provide quantitative information on the benefits of making more room for rivers from a flood risk management perspective. After all, the room for rivers policy was based on the assumed advantages in reducing flood risks [1,2], which in turn related loosely to the well-known “levee effect” as coined by White [5].
White [5] maintained that flood defenses may reduce the probability of flooding, but at the same time incentivize society to invest in protected areas to such an extent that eventually flood disasters tend to grow bigger instead of smaller. In the 1990s this argument was also used in pleas for making more room for the rivers [6]. It was recognized that when the probability of flooding is reduced, people feel much safer and invest more, with an increasing vulnerability of the society in the protected areas as an inevitable outcome. This increased vulnerability calls for better flood protection again, etcetera: a spiral, which some would call “negative” and others “upward”. Anyhow, this long-term joint evolution of society and engineered environment is precisely what the term “levee effect” signifies. It was the basis for a decades-long search for more resilient flood risk management along rivers [7,8] and lies behind the current popularity of resilience or robustness as normative concepts in water management in general and flood risk management in particular [9,10]. More specifically, giving some room back to the rivers “to let them breath” is often suggested under reference to the advantages that would have in terms of lower flood levels, smaller probabilities of flooding and less sensitivity to deviations of the discharge from the expected. It is now indeed reckoned that providing more room to the rivers makes the flood risk system more robust [11,12].
The fact that constraining rivers by constructing and raising embankments causes flood levels in the river to rise, is already generally recognized for a long time and is nowadays substantially documented [13,14,15], but the positive effects of making more room on reducing flood risk are much less so. In qualitative terms there is no lack of arguments, but quantitative information is scarce. We know that both the probability and consequences of flooding can be reduced by making more room, but we do not know how much. In our conference paper for FLOODrisk2016 [16], we presented some first results for analyses we did for The Netherlands’ Rhine and Meuse River. In this paper, we elaborate on these, shall add some recent results and we shall discuss the findings in a broader scope. Our quantitative empirical results are of course limited to our case studies on the Rhine and Meuse Rivers only, but the principles apply to many rivers in similar settings worldwide. After all, the alluvial plains of most lowland rivers in developed countries are being protected by embankments, thus constraining the rivers to relatively narrow floodplains. Examples from Europe are the Danube River, the Po River, the Rhône River or the Elbe River; and on other continents we may think of the Mississippi River, the Mekong River, or the Yellow River. The straightjacketing of these rivers explains why most lowland rivers face large economic flood risks, even if fatality risk may not be as large as in smaller mountainous streams which are sensitive to experiencing flash floods [17].
In this paper, we focus on the quantification of the risk-reducing effects of making more room for the river. As risk is usually defined as a combination of the probability of flooding and its consequences [17,18,19], we shall first investigate the effects on the expected consequences of flooding. These consequences are a function of several parameters, in our case primarily the extent and depth of the flood; both may be less when the flood levels in the river are lower. Stream velocity, inflow velocity and rising speed are relevant parameters too, but the role of high stream velocities is negligible in our case, whereas the other parameters are captured by the damage model we used. We build on the results as presented by Asselman and Klijn [16], but give other examples, more details and results for The Netherlands’ Rhine and Meuse River protected alluvial plains.
Next, we go into the effects on the probability of flooding as a result of embankment failure. These results have become available quite recently because data on fragility curves for embankments and for different failure mechanisms were not available any earlier, nor were reliable procedures for their combination into one failure probability. The results of these two effects, on flooding consequences and on flood probabilities, can be combined into a measure for flood risk. In this paper, we shall, however, not go into this combination, but instead also explore another perspective, namely that of robustness. As Merz et al. [19] also explain, combining probabilities and consequences into one metric for risk has a downside, namely that rare disasters with huge consequences are treated as equal to frequent floods with small consequences. From psychological research on risk perception we know, however, that people value large consequences as much more important than frequency of occurrence [20]. This means that we might have to give more attention to preventing disasters, and especially disasters of a magnitude “beyond recovery”, rather than risk as such. This idea is discussed by Merz et al. [21], and lies behind the concept of robustness in relation to flood risk management [10]. In the discussion of this paper we shall argue that robustness may be regarded as a perspective on managing risks related to another normative principle than the nowadays mainstream utilitarian perspective of cost-benefit analyses.
To underpin this argument, we shall go into the relationship between flood levels (h) and discharge (Q), as this is relevant in the context of coping with uncertainty about a river’s discharge, already in the current situation which often relies on design discharges with a certain level of recurrence but never witnessed in reality, but even more so in the context of climate change. The latter may change a river’s discharge regime, but to an unknown and unknowable degree. Future may hence have surprises in store. The Q-h relationship will be analyzed as a proxy for the sensitivity of different rivers and river stretches to uncertainties about the discharge regime. The relevance from a flood risk perspective relates to both flooding consequence and flood probability, as flood level influences both, as follows from the previous two quantifications in this paper.
In this paper, we thus quantify three effects of lowering river flood levels by enhancing the conveyance capacity of our rivers, namely (1) the reduction of the consequences of flooding; (2) the reduction of the probability of failure of the flood defenses; and (3) the Q-h relationship as a proxy for insensitivity to uncertainties, or the river’s robustness. The second is new for its quantification, the third in its conceptualization. It was found that making more room for rivers can indeed reduce the two key risk constituents, but the effect is very sensitive to the local physiography and the state of the flood defenses. We also show that there are significant differences between the three Rhine River branches in terms of robustness, as well as substantial differences within one river between different stretches. These findings may support drafting a long-term flood risk management policy for The Netherlands, incorporating both room for rivers and flood protection. From a scientific point of view, the contribution to the operationalization of the concept of robustness is, to our opinion, new and important.
In the next section we first introduce the rivers that provided the empirical material and explain which data we (re-)used and which methods we applied for successively the hydraulics, the establishment of the consequences, the estimation of failure probabilities and the drafting of the Q-h relationships. In the subsequent section we present and discuss our results in the same order. Finally, we discuss the overall outcomes and especially go into the relevance of distinguishing robustness as additional perspective, along a utilitarian perspective on reducing flood risk to an acceptable level against acceptable societal costs.
2. Object of Research and Approach
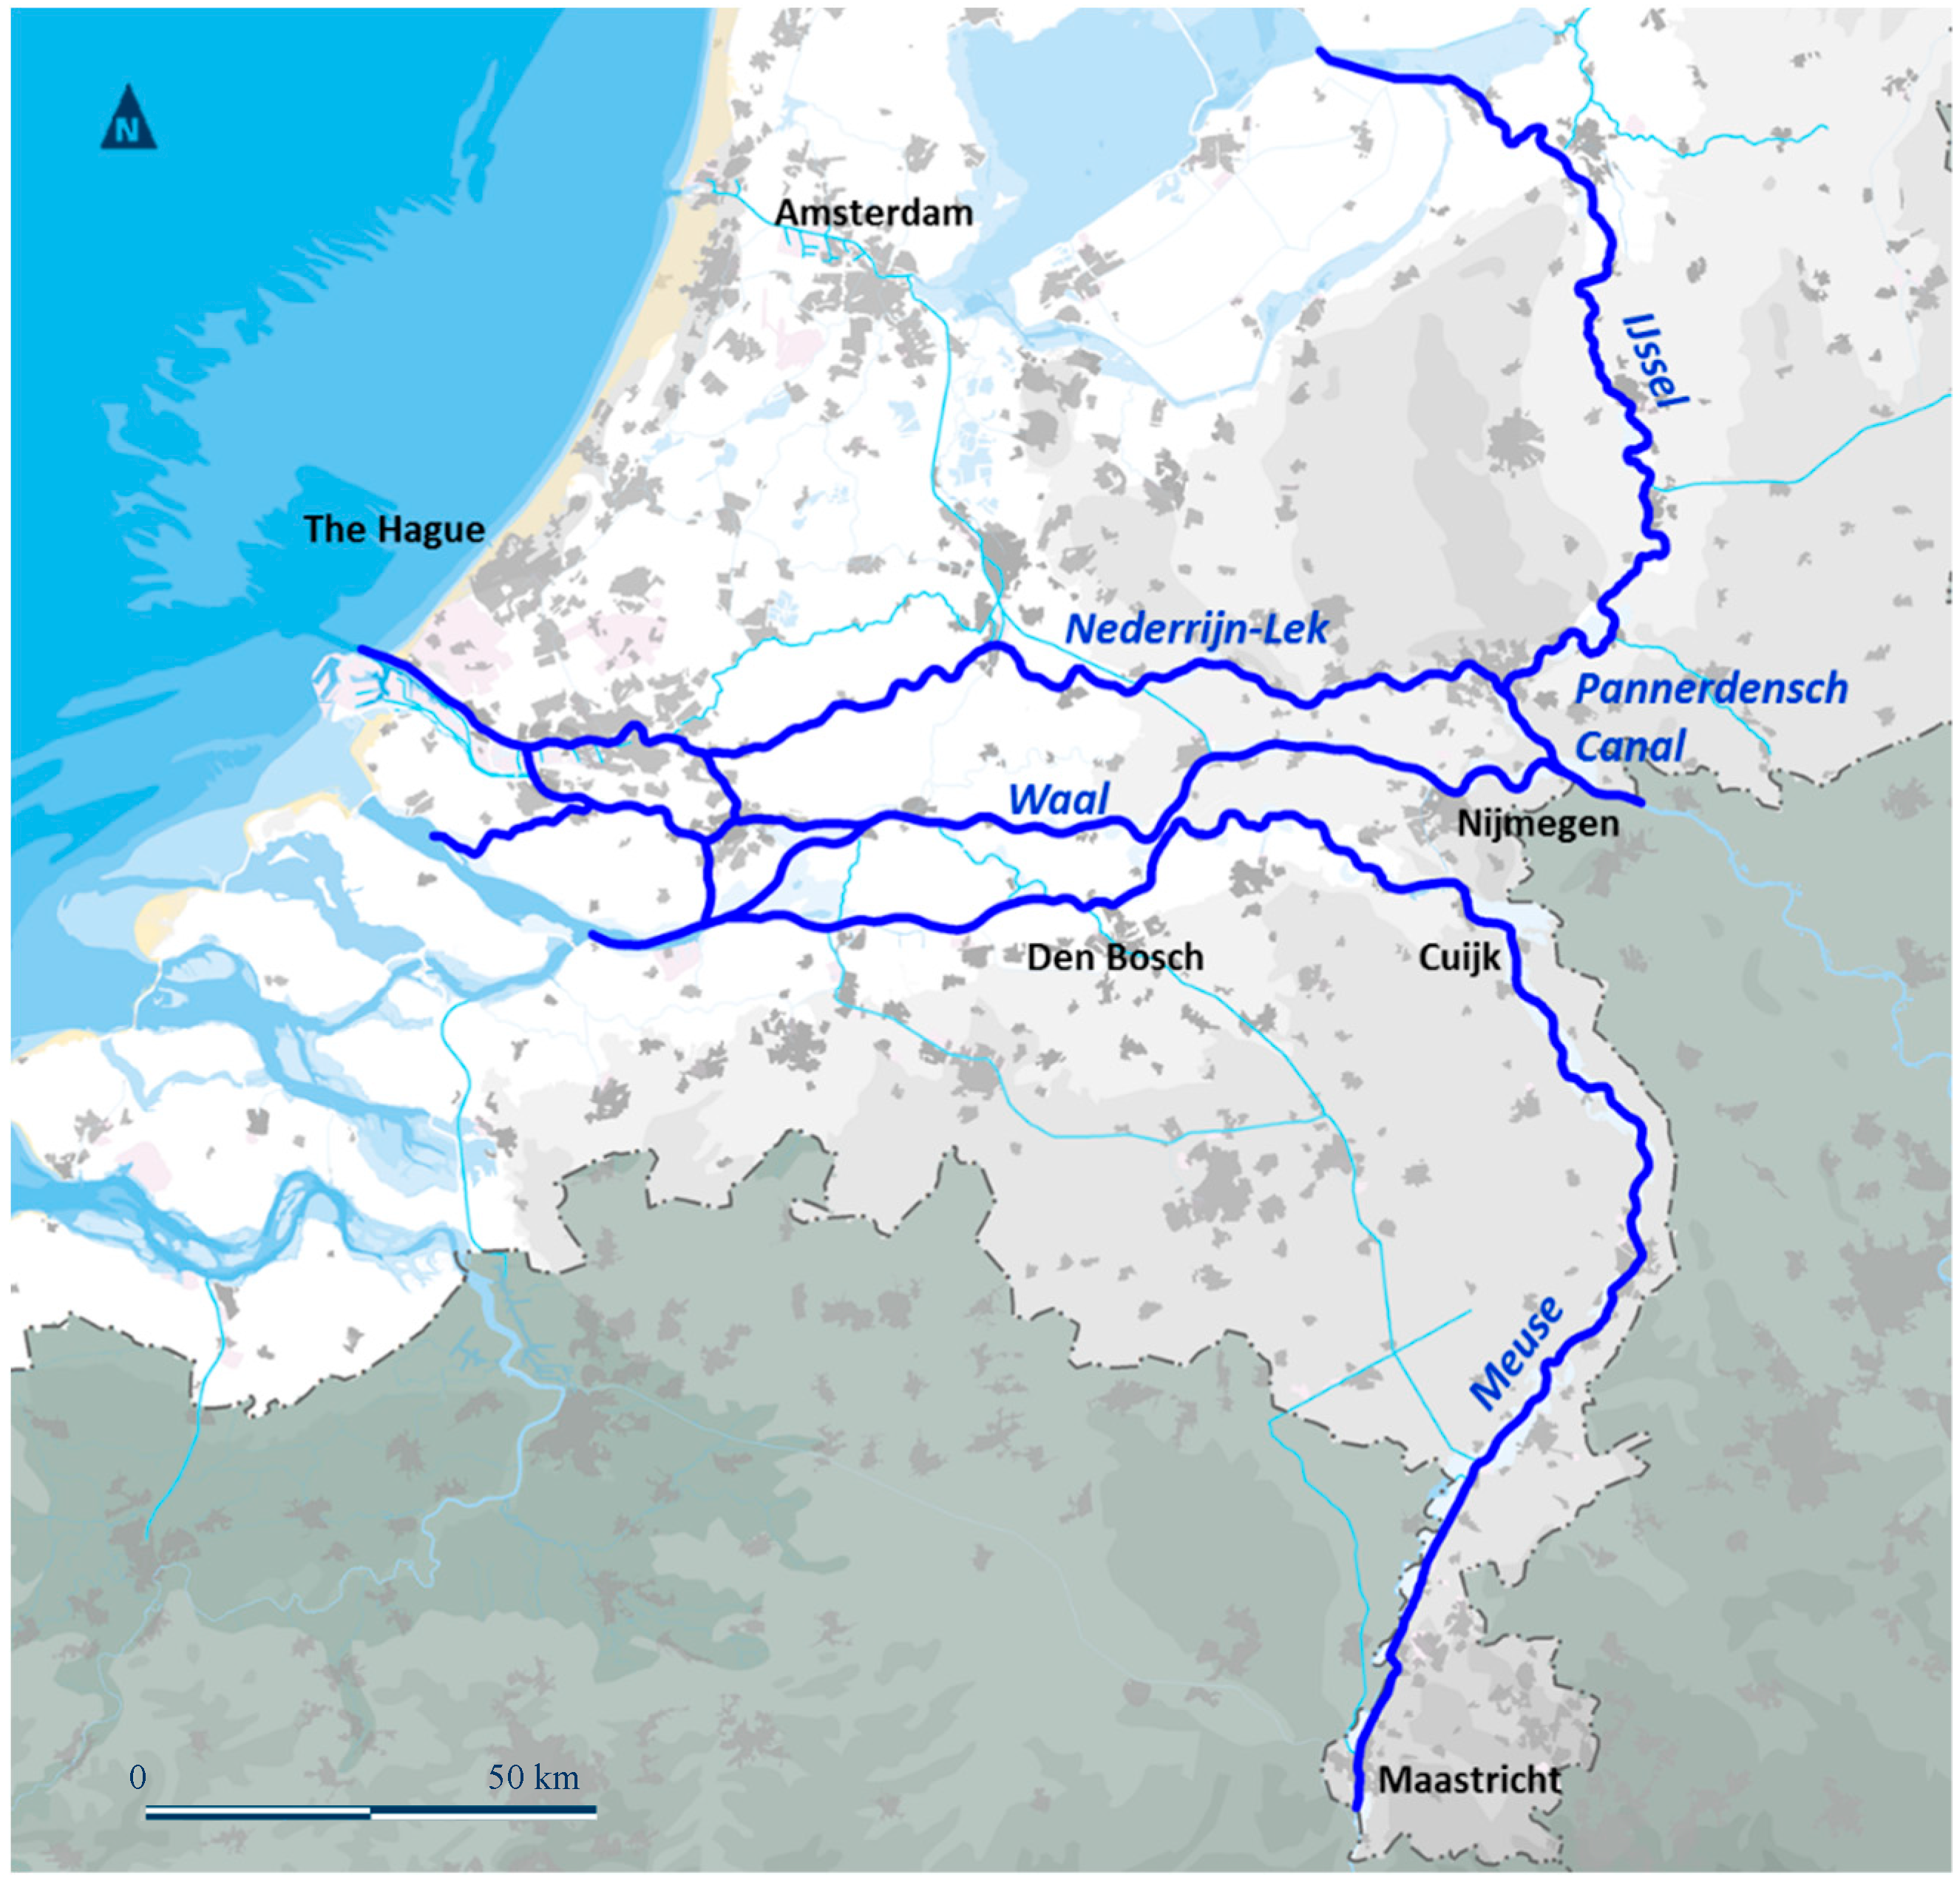
The Rhine and Meuse Rivers are the largest rivers in The Netherlands. The Rhine originates in Switzerland and has a length of 1320 km. In The Netherlands, the river splits into three major branches: the Waal, IJssel and Nederrijn-Lek Rivers (Figure 1). The land adjacent to the Rhine distributaries is protected by embankments. The average discharge of the Rhine River, where it enters the country, is about 2200 m3/s. The design discharge which applied until 2017 was 16,000 m3/s, corresponding with a probability of exceedance of 1:1250 per year.
The Meuse River originates in France and has a length of about 900 km. The upstream part of the Meuse River in The Netherlands (Figure 1) flows through a natural valley. Embankments have been constructed at a limited number of locations to protect individual villages. The downstream part of the Meuse River is, however, embanked over its entire reach, just as with the Rhine Branches. The average discharge of the Meuse River is 230 m3/s. The design discharge which applied until 2017 was 3800 m3/s, also corresponding with a 1:1250 per year probability of exceedance.
For both rivers the fact that the river is embanked implies that floods do not cause harm very often, because they use to stay between the embankments. If, however, the embankments fail, the protected land is being flooded by rivers that rise high above the land, entering it through rapidly developing breaches in those embankments and causing rapid and deep flooding of these protected “dike-ring areas” [4] along the rivers.
For both rivers hydraulic models were applied to calculate the flood levels for a range of discharges, because The Netherlands has a flood protection policy based on probability of breaching [4]. This requires that the whole range of relevant flood levels, with their respective probability of occurrence is considered. For the Rhine River a range of discharges between 6000 and 20,000 m3/s was used, corresponding with a probability of occurrence of about 1:5 to <1:1,000,000 per year. For the Meuse a set of floods ranging from 1300 to 5000 m3/s were simulated, with a similar span of occurrence probability. The flood levels were calculated with the so-called delta model [22] for a reference situation of planform and morphology as resulting after implementation of the Room-for-the-River program [2]. It was assumed that this program was fully implemented (actually as from January 2017).
From the thus obtained flood levels, the probability of breaching of the embankments was calculated, by establishing the intersection of the flood levels with fragility curves which were defined for each embankment section. Fragility curves represent the fragility of an embankment, as a fraction between 0 and 1, in relation to the loading, in our case a flood level. As for the consequences of flooding, we used available data on flooding patterns resulting from many hundreds of possible flood events and on the consequences of these events in terms of economic damage, number of people affected and number of casualties [3,4].
Below, we describe the methods that were applied more specifically to quantify the effect of making room for the river on (1) consequence reduction; (2) reduction of the probability of embankment failure; and (3) the Q-h relationship.
2.1. Flood Consequence Reduction
During the last 10 to 15 years, many hundreds of flooding simulations have been made for different parts of The Netherlands. The simulations were carried out by water boards and Provinces in The Netherlands and by the FLORIS project [23] and all the results were stored in a national database so that they can be used for further studies or other purposes.
For each breach location flood simulations are available for flood levels corresponding with the design flood level, as well as for flood levels that are expected 10 times more frequently respectively 10 times less frequently; the so-called “one decimation height” lower and higher floods. Based on the simulated flood extent and depth, the consequences of each flooding scenario were calculated in terms of economic damage, number of people affected and number of casualties [3,4] using the standard damage model for The Netherlands [24]. The simulation results were used to derive the required flood hazard maps for the European Floods Directive [25], to compute the economically most efficient protection standards for all embankments in The Netherlands [3], for the revision of The Netherlands’ flood protection standards [4], and to develop flood hazard maps for spatial planning [26].
As the database contains flooding simulations for two or three different flood levels as well as on the consequences of these flood events, the results can also be used to compute the difference in economic damage and number of casualties as a function of flood level.
2.2. Reduction of the Probability of Embankment Failure
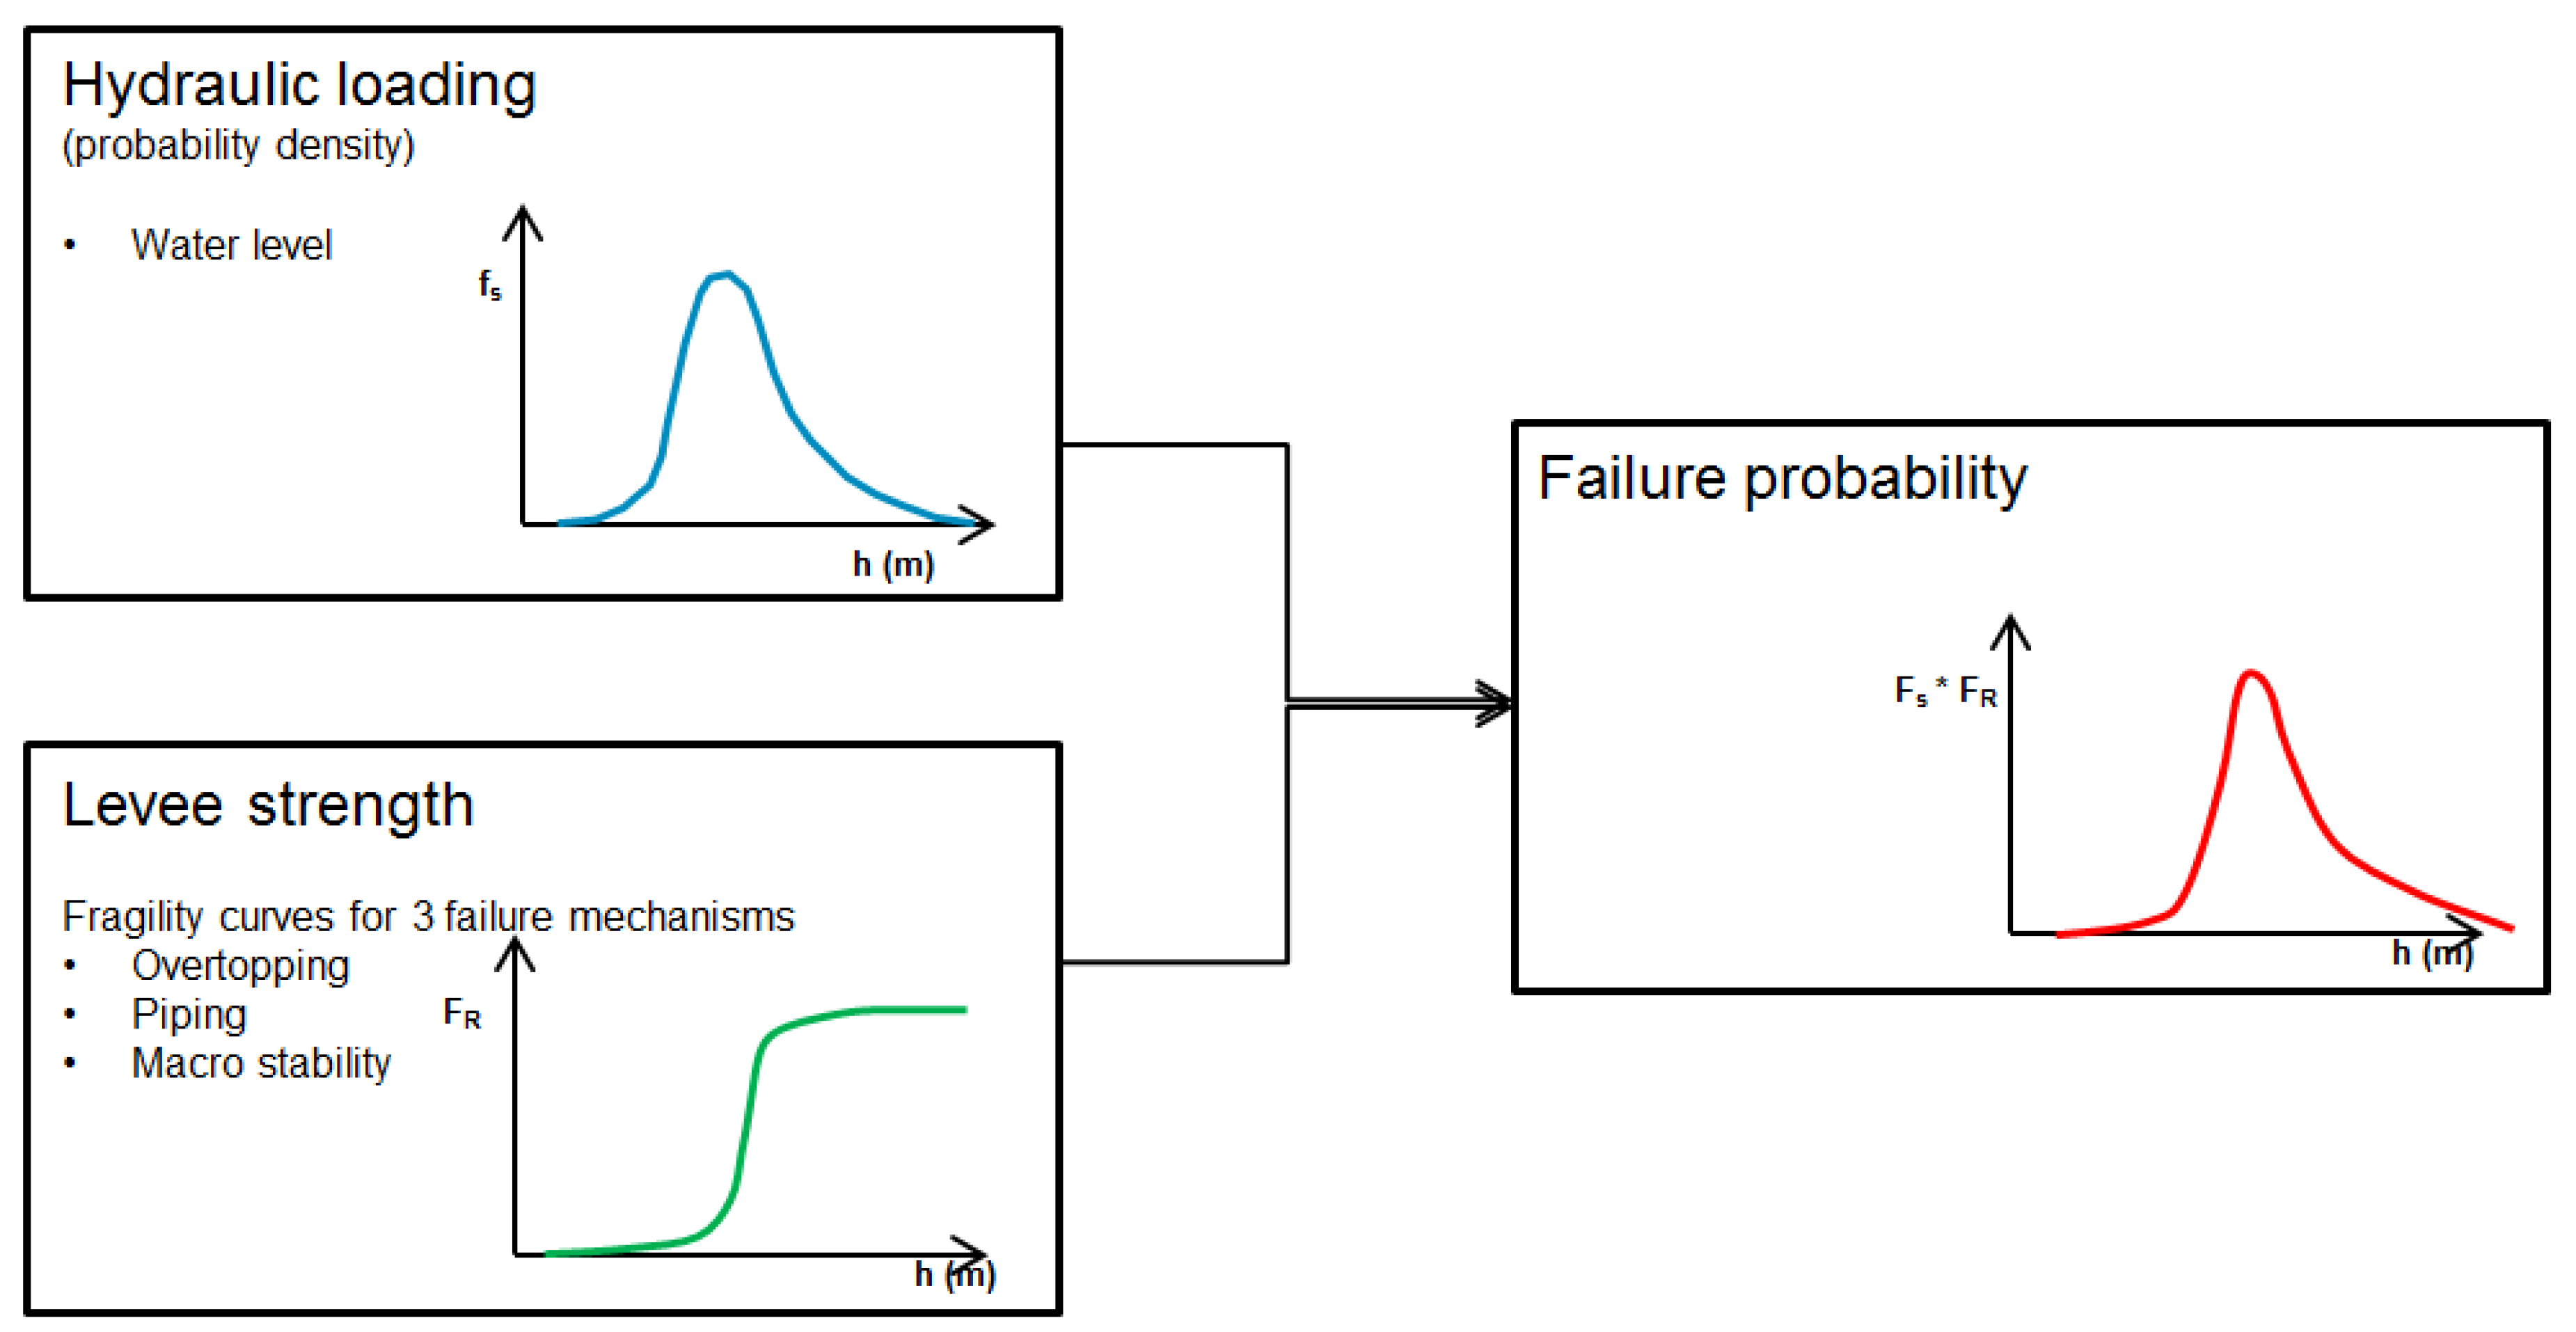
The probability that embankments or other flood defenses fail, can be established by combining the relevant probability density distributions. This involves the probability density distribution of river discharges for the whole river [27], translated into probability distributions of flood water levels at each location along the river and subsequently combining these with so-called fragility curves [28,29], which describe the conditional failure probability of the embankment at each location as a function of flood water level (Figure 2). Because the embankments can fail as a consequence of different failure mechanisms, various fragility curves need to be combined. We combined the fragility curves for (a) overtopping and overflow with those for (b) piping and/or upheave and for (c) macro-instability (slumping, sliding or liquefaction) into one overall fragility curve for the embankment at each location by assuming a relative contribution of each failure mechanism to the overall probability of failure (“default”, in accordance with The Netherlands’ Legal Assessment Instrument [22]).
Making room for rivers results in lower flood water levels at the location of the measure being taken, as well as, depending on the kind of measure, extending upstream (in case of increased discharge capacity) or downstream (in case of reduced maximum discharge resulting from retention through temporary storage). Hence, in practice, it reduces the load on the flood defenses to a different degree at different locations. Consequently, the intersection between flood water level and the respective fragility curve for each examined location is obviously changed as well, resulting in smaller probabilities of failure over the stretch of river that is loaded to a lesser degree. This means, however, that the reduction of the failure probability is not equal along the length of the river or a flood defense stretch but differs per location (Figure 3). This is a disadvantage of making room for rivers. On the other hand, the lower flood levels reduce the failure probability of the embankments on both sides of the river, which is an advantage to reinforcing the flood defenses which is, in practice, often limited to one side of the river only.
Reinforcement of the flood defenses, in contrast, is usually tuned in such a way that the probability of failure is equal along the whole length of the embankment, i.e., “the same” for each section. This difference complicates a simple comparison between making room for rivers and reinforcing embankments. Therefore, to allow a straightforward analysis of the (potential) effect of making room for rivers on flood probabilities, we simply assumed that we could lower all relevant flood levels over the whole length of the rivers by 0.5 m.
All calculations were done for embankments that meet the recently defined (2017) legal protection standards, i.e., after implementation of any reinforcements required until 2050. In addition, we applied the fragility curves per location/ stretch for the failure mechanisms overtopping, piping and macro-instability as well as the default “contribution budgeting” for these mechanisms (see Figure 2). With these, we calculated the failure probabilities “before” and “after” lowering all flood levels by 0.5 m. For the actual calculations, we applied a tool which was developed to quantify the “possible savings on embankment reinforcement” as a result of making more room for the rivers [28]. This tool is intended to produce savings in terms of less investment costs for reinforcement, but for its quantification it also produces failure probabilities before and after making room for the river, as intermediate output.
We did the calculations for flood defense stretches, as defined for the recently updated legal protection standards [4]. These defense stretches have been distinguished by their approximately equal flood pattern and consequences when breached on any random location. They are of quite similar length and border the river, together constituting the dike ring areas we use for calculating the consequence reduction for. Along the 3 Rhine River Branches and the Meuse River we recognize 97 defense stretches, of which 46 protect tiny dike ring areas in the Meuse Valley.
2.3. Deriving the Q-h Relationship
The discharge-flood level relationship gives an indication about the sensitivity of a river for uncertainties in discharge. As each river has, of course, a discharge regime depending on the climate in which the catchment is located, as well as depending on the morphology of the valley and floodplains, accounting for any human interference in terms of flood defenses, it is required that we somehow account for these differences by scaling. In this paper, we present results for the Rhine River and its three branches. These three branches do not get an equal share of the Upper Rhine River’s discharge, but must convey a share which is pre-defined for one particular discharge, namely 16,000 m3/s. For other discharge volumes, the shares may deviate from these pre-defined shares. Therefore, we do not start from a fixed additional discharge per branch, but instead from an increase in the main river’s discharge which corresponds with a 10 times smaller probability of occurrence. This implies that we used the calculated water levels for four discharge levels: the 1:10, the 1:100, the 1:1000 and the 1:10,000 per year Rhine River discharge. The differences in flood level between these discharges are often addressed as “decimation heights” (cf. [25]). By this approach we account for the different size of the three branches; this may be regarded as a kind of scaling, which allows direct comparison of the results for the Waal, Nederrijn and IJssel.
We derived the 1:10, 1:100, 1:1000 and 1:10,000 discharge from GRADE [30,31]. For the Rhine River these amount respectively to about 9000, 13,000, 15,000 en 16,250 m3/s. The additional discharge to be conveyed for each step is consecutively 4000, 2000 and 1250 m3/s, corresponding with + 44%, +15%, and +8% per step. This declining increase in discharge partly explains that the “decimation height” that we will show in the results also diminishes per step. Another explanation lies in the fact that the more extreme the discharge, the more peak attenuation is likely to occur upstream in the catchment; in our case caused by flooding in Germany [27].
The calculated flood levels were specified for each “river kilometer”, according to the standard Rhine kilometerization. By subtracting the flood water levels, we obtained the “decimation heights” for each step: 1:10 → 1:100, 1:100 → 1:1000 and 1:1000 → 1:10,000.
3. Results
We consecutively show what making room for the river means for (1) the reduction of the consequences of flooding due to less flooding depth and smaller flood extent and (2) the reduction of the probability of breaching of the embankments due to a reduced loading of the flood defenses. Both will be done for the Rhine and Meuse Rivers. The combination of the two effects yields the overall effect on flood risk, defined as the multiplication (actually: integral) of probability and consequence. As the combined effect on flood risk has already been discussed, though not accurately quantified, by Asselman and Klijn [16], we shall not repeat this here. Instead we will give results for the two risk constituents separately and provide results on (3) how the room available for discharge influences the Q-h relationship along a river’s length, and especially go into differences between different rivers and different river stretches.
3.1. Flood Consequence Reduction
Making room for the river means that flood levels become lower than in straightjacketed rivers. In case of failing flood protection, e.g., by breaching of the embankments, this means a smaller hydraulic head over the breach. This in turn results in smaller volumes of water flowing through the breach, and probably slower breach growth thanks to lower flow velocities in and immediately behind the breach. The flooding depths in the protected areas will be smaller and, in some cases, the flooded area is smaller too, especially where lowlands gradually change into more undulated or hilly topography. Although flow velocity is generally regarded important for quantifying flood consequences as well, we neglected its influence, because high flood velocities are limited to the immediate surroundings of the breach only and hence refer to less than 1% of the flooded areas.
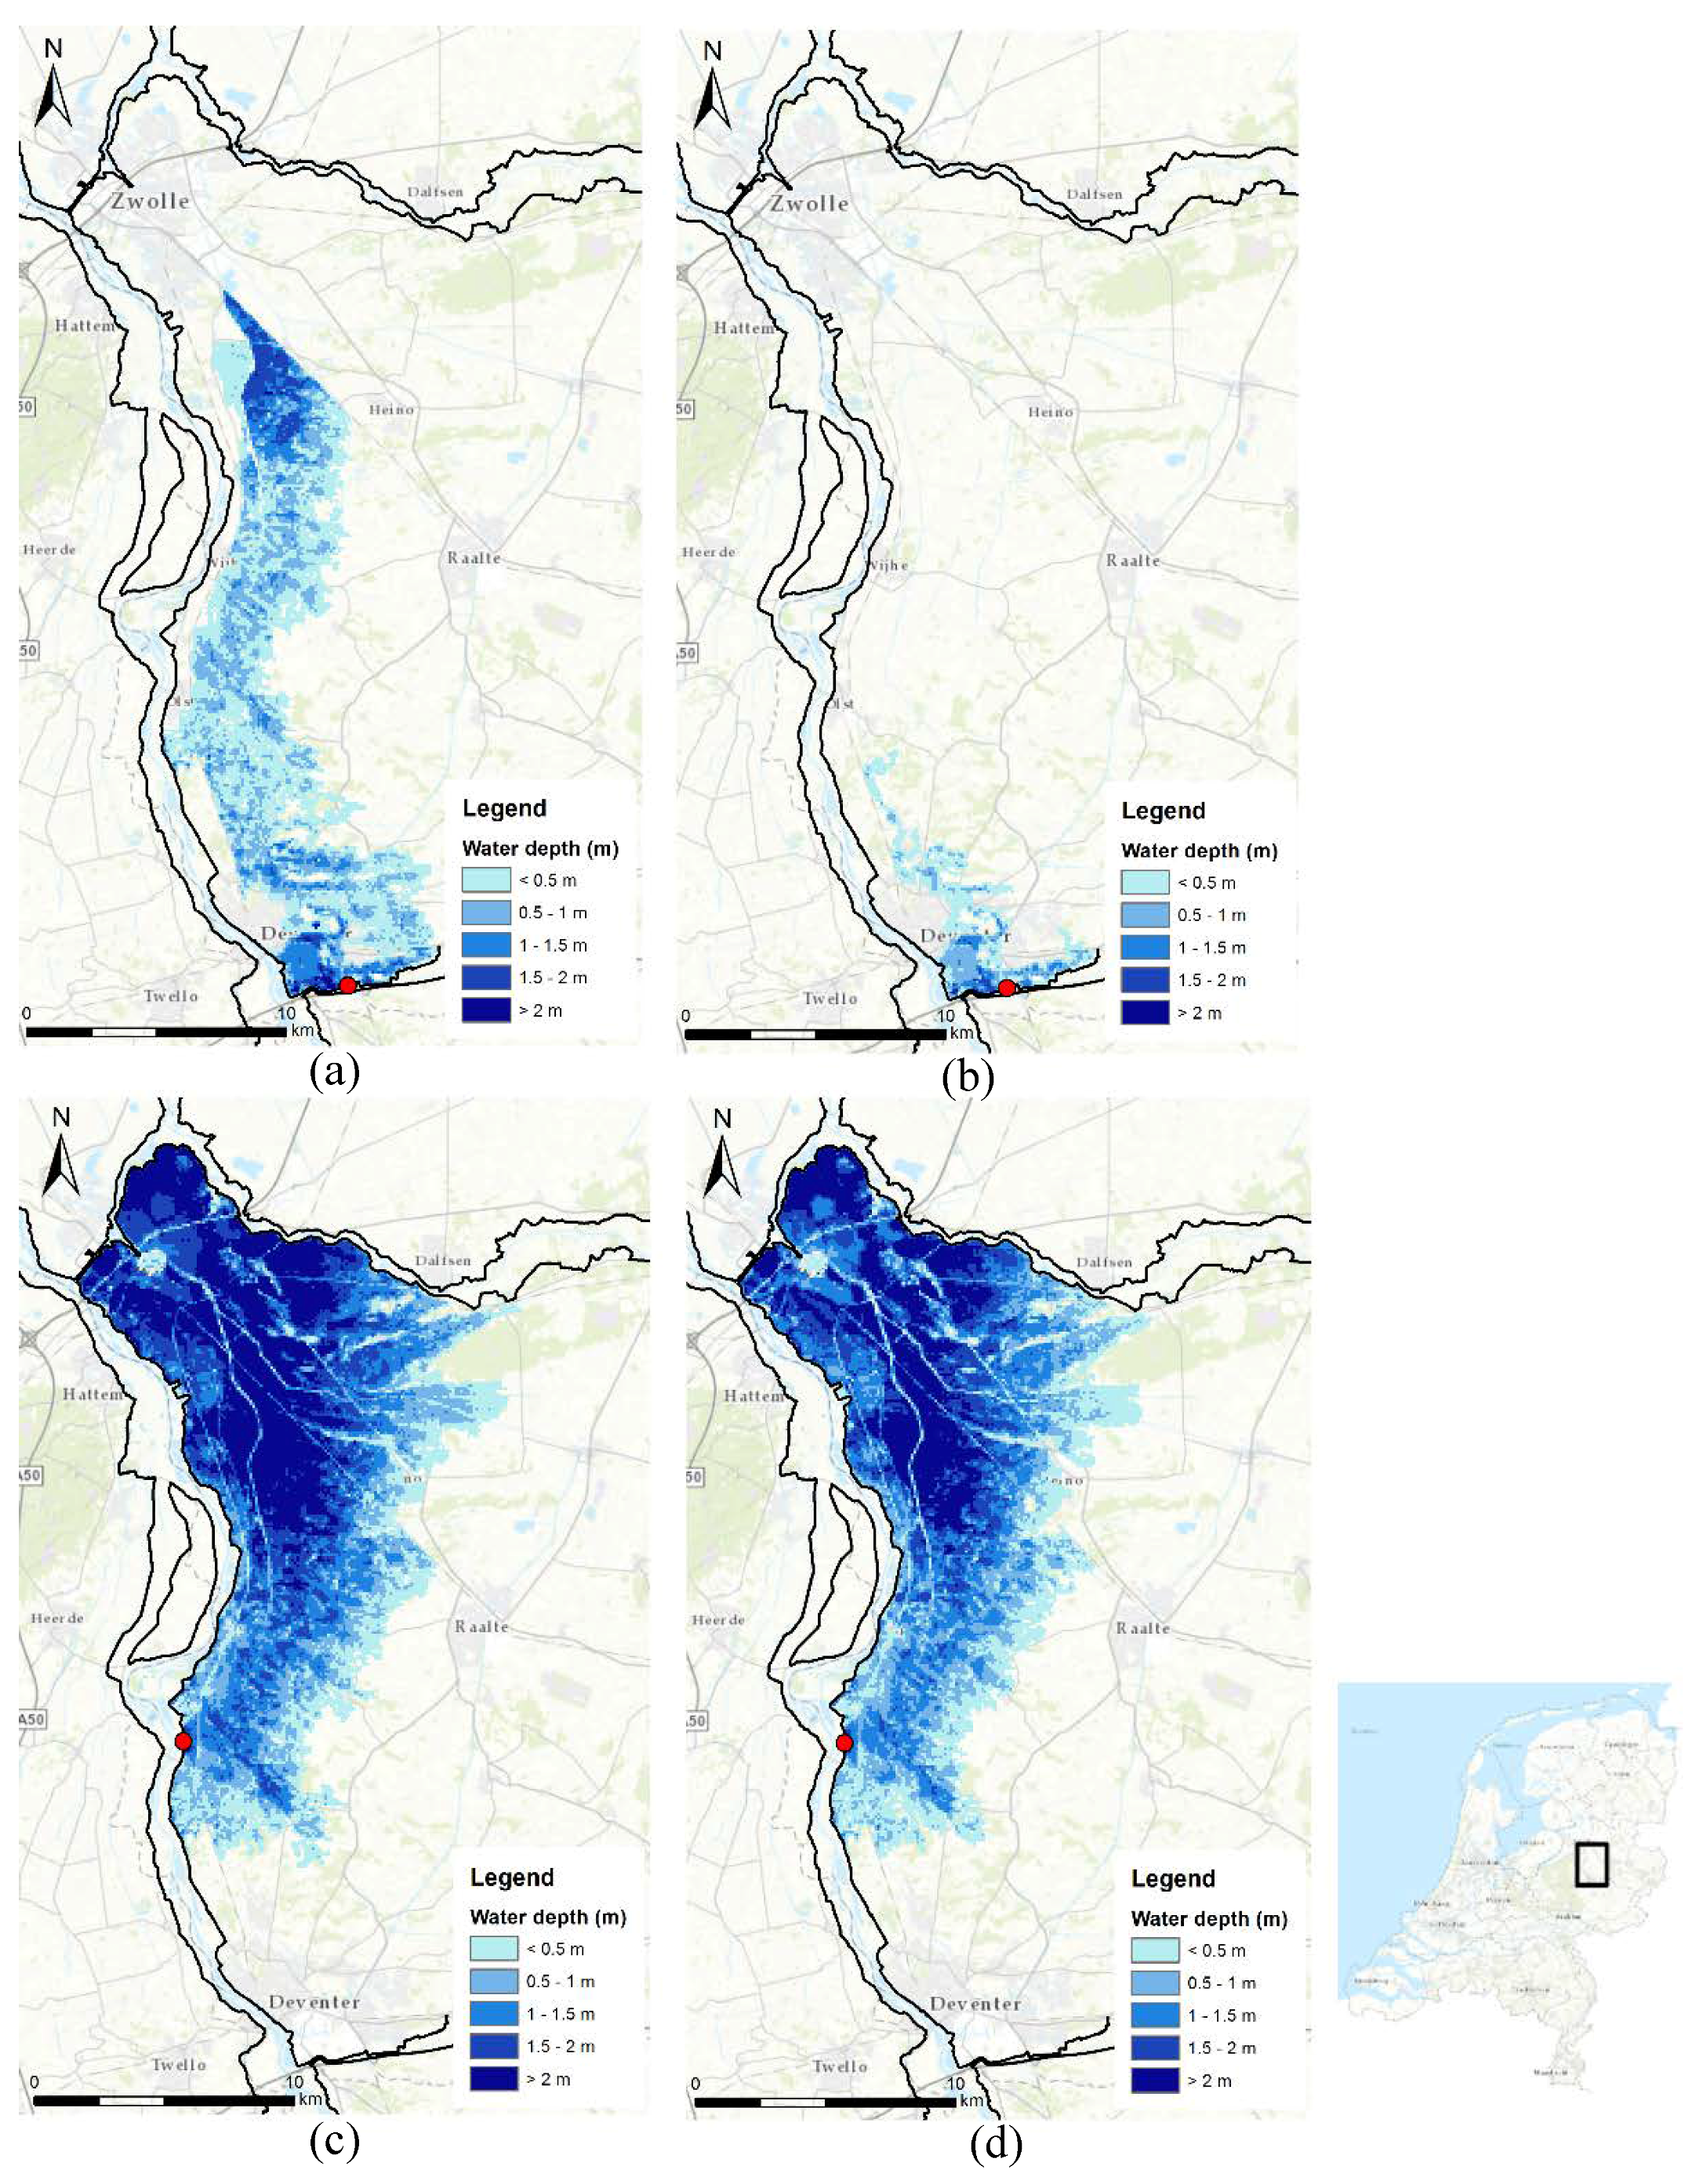
An example of the flood pattern and flooding depths resulting from different flood levels is shown in Figure 4. This figure shows the simulated flood maps for a protected area along the IJssel River and for two breach locations. In the top figures breaching is assumed to occur in the upstream part of the dike ring area (at the red dot). In Figure 4a the flood level in the river is about 70 cm higher than in Figure 4b. The total volume of water flowing through the breach is much smaller in the latter case because of the lower water levels in the river and the existence of relatively high areas just inland of the breach. In the bottom figures breaching is assumed to occur halfway the protected area, i.e., about 15 km more downstream. The difference in water level between c and d is about the same as between a and b, but the location and elevations are such that almost the same area is being flooded in Figure 4d as in Figure 4c. The extent of the flooding is only marginally less, and the water levels are less only by a few decimeters as well. The upstream parts of the protected area that are flooded in Figure 4a,b (near the city of Deventer) are, however, not flooded when the breach occurs more downstream. That is because the protected area is slightly inclined towards the north, following the river’s slope; and water does not flow uphill.
In many cases, along The Netherlands’ rivers the impact of lower flood levels in the river is thus quite small, especially in polder areas which do not adjourn elevated land. Because these areas lie relatively low in comparison to the river level during flood, they become entirely flooded in any case. This means that only the flood depth is less when the water level in the river is lower, but that the extent of the flooding is not affected. This translates into only a minor reduction of flood consequences, depending on the shape of the depth-damage curve [19,32].
Smaller water depths and flood extent result in less economic damage and fewer casualties. As Figure 4 shows, the magnitude of this effect differs from place to place. Conversely, larger water depths and flood extents will result in more economic damage and more casualties. Preventing this was the reason behind the room for rivers program, as already mentioned. However, the magnitude of this assumed effect was not known in quantitative terms until recently. We quantified the economic damage, number of people affected by flooding, and the number of casualties for flood levels equal to the 1:1250 per year design flood level as well as for a flood level corresponding to a 1:12,500 per year flood level for some hundreds of breach locations. The difference in consequences between those two flood levels was then “normalized” to a plausible 0.5 m of difference in flood level. This is approximately what might be expected from climate change in this century [33]. Below, we first give a table (Table 1) with results for all the major protected areas along the Rhine River branches and the Meuse River. We show the results for the floods which incur the largest consequences for each dike ring area, which of course depends on the location of the breach, as well as the increase in consequences for a river flood level that is 0.5 m higher.
The table shows that for most areas the increase in consequence ranges between 10 and 50 percent, but we also find very high values of way above 100% increase in damage (up to 12 times as much) as well as number of casualties and number of people affected (as much as 13 times as many). The explanation for this is that in some cases higher flood levels cause flooding depths that exceed the height of the embankments on the downstream end of the dike ring area, thus causing overflow of those embankments and the flooding of the adjacent dike ring area as well. This snowball or domino-effect is considered of special concern and explains the pleas for compartmentalization of large dike-ring areas [33]. It also is an argument to prevent that flood levels in the rivers rise any further than to the already hazardous levels they may now reach, because the consequences may increase in a non-linear way as important “hydraulic tipping points” are being exceeded.
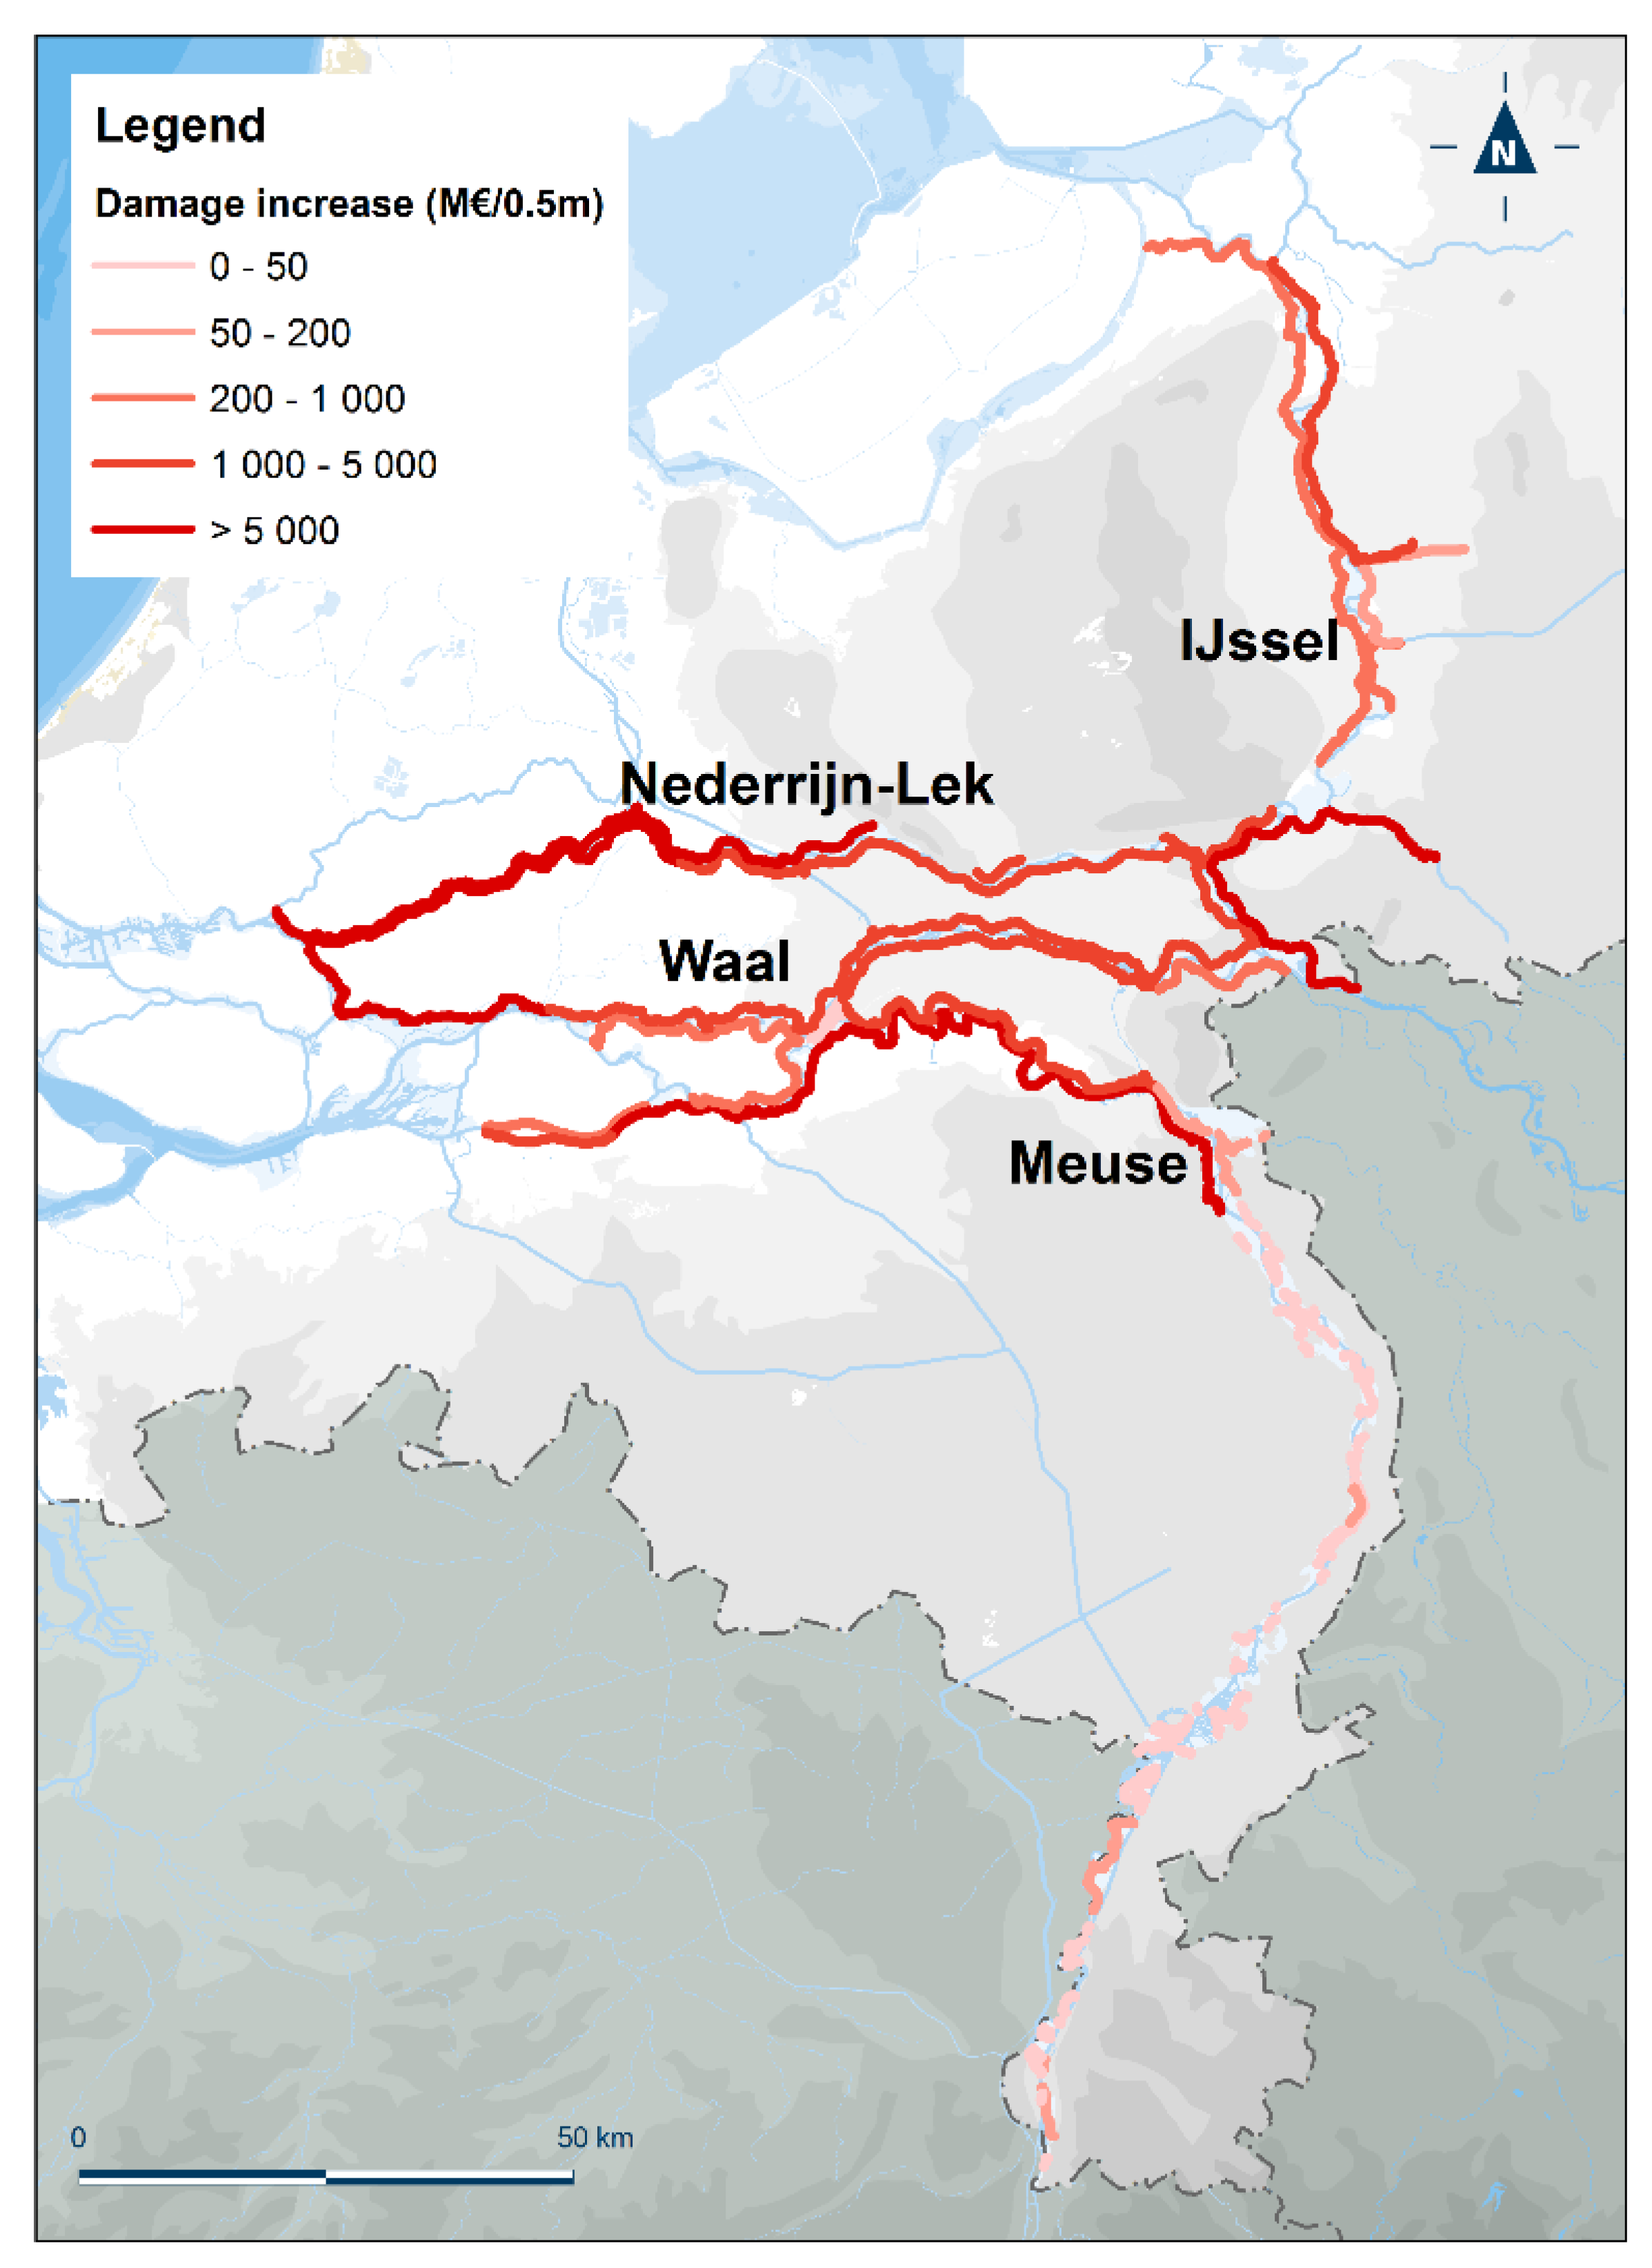
Next, we present the results on a map (Figure 5), thus stressing the expected absolute increase in consequences resulting from higher river flood levels. This map shows that the largest reduction in consequence per 0.5 m of water level lowering is to be expected in areas that are not entirely flooded but only partly and that are densely populated. Such areas can be found along the Nederrijn-Lek River, but also along the Waal River and along the downstream stretches of the Meuse River (Figure 5). A red line indicates that economic damage may increase by more than 2 billion euro when breaching would occur due to 0.5 m higher flood levels in the river. Again, an important argument to try to prevent that flood water levels go up in the future.
3.2. Reduction of the Probability of Breaching of Flood Defences
As explained in Section 2.2, we assumed we could lower all relevant flood levels by 0.5 m and subsequently calculated how that would influence the probability of breaching of each flood defense stretch. In Table 2 we show the results. We grouped the defense stretches per river (respectively the 3 Rhine branches and for the Meuse River the “embanked stretch” and the “valley stretch”; the latter being characterized by much shorter defense stretches than all the other rivers) and also ordered them from downstream to upstream, in order to be able to trace any pattern in the results.
Table 2 reveals that lowering the flood water levels by 0.5 m reduces the failure probability of the embankments by a factor which grossly varies between 5 and 25, so a 5–25 times smaller probability of breaching. Of the 97 defense stretches 12 have a factor of more than 25 (of which at least 2 are outliers, where the failure probability is reduced to nil) and 13 have a factor of (slightly) less than 5 (2 of which are along the Old IJssel River, which is a small tributary to the IJssel River, and the majority in the Meuse Valley where the river is relatively steep). The mean reduction of the failure probability of all stretches (n = 97) is by a factor 14.4 (median 8.7).
As Figure 6 shows, especially the most downstream stretches show a very large reduction in failure probabilities, but we need to stress that in those stretches making room for the river is hardly effective as the sea level determines the lower boundary condition. Lowering the flood levels by 0.5 m seems impossible here; reason to exclude these results from some of our calculations. A more relevant and reliable estimate of the mean effect of lowering the river flood levels by 0.5 m would therefore be the mean of the longer stretches (i.e., without the Meuse Valley, and without the 4 most downstream stretches; n = 46): a factor of 10.6 on average (median 9.7), say a tenfold decrease of the failure probability.
The table also shows that the factor varies per river: from 12.3 for the Waal (7.3 without the 2 most downstream stretches; median 7.2), 46.1 for the Nederrijn (16.4 without the 2 most downstream stretches; median 14.9), 10.6 for the IJssel (leaving out the outliers; median 10.6), to 9.9 for the embanked Lower Meuse (median 9.7). For the Meuse Valley (with 46 protected areas) the average reduction of the failure probability is by a factor of 11.6 (median 7.4). In general, the differences between the rivers relate to differences in height of the embankments in relation to the river and the protected hinterland, properties of the subsoil, et cetera, which all influence the relative importance of the different failure mechanisms, and hence the “overall fragility curve’. This explains the differences per flood defense stretch, as well as per river. A clear and interpretable pattern cannot be discerned, however. There appears to be a very small trend of increasing effectiveness when going from upstream to downstream (see Figure 6), but this is of course counteracted by the increasing difficulty of lowering the flood levels by 0.5 m the further downstream one gets and the larger the influence of the sea level.
3.3. Sensitivity to Uncertainty about Flood Discharges: Influence of River Planform on the Q-h Relationship
The morphology of a river, whether natural or embanked, determines how much the flood levels rise with a certain increase of the discharge. This is the Q-h relationship. In relatively wide and shallow rivers, an additional 100 m3/s (or any other hypothetical increase of the discharge) causes less rise of the flood levels than the same additional discharge would in a narrow, deep channel of equal capacity (Figure 7).
This is reflected in Figure 8, which shows the decimation heights (DH) for the three branches of the Rhine River, each starting at the German-Dutch border (at Lobith, kmr 859). The figure shows the differences in flood water levels with probabilities of occurrence from 1:10 to 1:10,000 per year. Especially the differences between the three river branches, with the same discharge regime, and between river stretches in each river are significant.
For the interpretation it is relevant that the starting point on the left is the same for all three river branches and lies upstream of the bifurcation points. The first bifurcation is at kmr 868, for all three river branches; the second is at kmr 879 but applies only to the Nederrijn-Lek and IJssel Rivers. These bifurcation points are fully armored and constrained by the river manager to be able to control the discharge distribution during floods according to pre-defined proportions. They consequently have significant backwater effects, reflected by the shooting jumps in the middle and bottom graph of Figure 7 at kmr 868 and 879. This means that we should neglect the left parts of the graphs. Apart from this, Figure 8 shows the following:
- The flood levels in the Waal River (upper) show large increases with increasing Rhine River discharge, with 2 to 2.5 m in total. This points to the fact that the Waal River is not very wide relative to its discharge share, and hence is sensitive to uncertainties in the total discharge. Especially the stretch upstream of Nijmegen (kmr 885) with its many meanders is relatively cramped as well as the stretch between Tiel and Gorinchem (kmr 915 and 955), where the river lost substantial discharge capacity because of the separation of the Maas and Waal Rivers in 1904 [34]. The difference in 1:10 and 1:10,000 flood levels amount almost 2.5 m in these stretches.
- The Nederrijn (middle) shows differences in flood level of about 1.5 m for the same range of discharge increase at Lobith in the upstream part, i.e., until about Wijk bij Duurstede (kmr 925). Further downstream the difference increases to more than 2 m. This can be explained by the genesis and history of this river, which became one of the main channels because of the closing of two other channel belts, namely the Kromme Rijn and Oude IJssel when the rivers were fully embanked in the 14th century. This explains why this river stretch is relatively tight [35].
- On the IJssel River (bottom) the difference in flood levels between 1:10 and 1:10,000 remains limited to less than 1.5 m and locally even less than 1.0 m. This points to a relatively spacious river, in which flood levels are not very sensitive to uncertainties about the discharge that enters The Netherlands at Lobith; the IJssel River is indeed characterized by broad floodplains, whereas recently two bypasses have been added in the context of making Room for Rivers [2], namely at Veessen (kmr 961) and Kampen (kmr 991).
For the interpretation of the differences between the three rivers, we need to account for the fact that the increasing discharge is not equally distributed over the three distributaries. In the hydraulic model a free distribution is assumed corresponding to the pre-defined proportions of 6:2:1 over Waal, Nederrijn and IJssel but also responding to the morphology to some degree. The pre-defined proportions apply for a discharge of 16,000 m3/s. If these proportions would significantly differ at other discharges (1:10 is about 9000 and 1:10,000 is about 16,250 m3/s) the increase in percentage also differs. Probably, the effect of this is small, but we have not verified it.
Overall, we may conclude that the IJssel River is the least sensitive, or the most robust of the three Rhine River branches. The Waal, in contrast, is the most sensitive and least robust of the three when it comes to uncertainties about the discharge. It also gets the largest share of the Upper Rhine River’s discharge, namely 2/3. However, because of this large share, it is the least sensitive to deviations of the discharge distribution, because an extra 100 m3/s means less than 1% of the almost 11,000 it is prepared for, whereas for the IJssel River this would mean an increase of more than 5%. Therefore, the robustness with respect to other sources of uncertainty may differ from those for uncertain discharges. Still, we regard the Waal River as the most hazardous of the three, partly because of its sensitivity, but also because it brings the largest volume of water as it discharges the largest share of the Rhine River, and it rises the highest above the protected areas. If a breach were to occur along the Waal River, the consequences would be by far the largest.
4. Discussion
In the former section we have ascertained that making more room for the river can reduce the consequences of flooding in terms of damage, number of people affected and number of fatalities. It was found that the effects depend very much on the location of a breach and the physiography of the hinterland in relation to the flood water levels in the river. In most of the protected areas along The Netherlands’ Rhine Branches and Meuse River, the reduction of the consequences is estimated to amount between 10 and 50% per 0.5 m. It is, however, not easy to lower the flood water level by that degree. We also found that for some breach locations the increase in damage and number of fatalities is much more than 100%, because of non-linearities or hydraulic tipping points. This is the case when the flood does not remain limited to the protected area immediately behind the flood protection but incurs a domino effect and affects other areas as well.
Secondly, we established the effect of making more room for the rivers on the failure probability of the flood defenses. Even though it is often maintained that it is difficult if not impossible to reduce the failure probability of flood defenses by lowering flood water levels, because of the relative importance of strength-related failure mechanisms (piping and macro-instability), our results show that lowering the flood levels over the whole relevant range does effectively reduce the probability of failure. A lowering of the flood levels by 0.5 m generally translates into a reduction of the probability by a factor of 10, even when the decimation height is much less than 0.5 m, as is the case along the IJssel and large parts of the Nederrijn-Lek.
Thirdly, we have investigated the sensitivity of the flood water levels in the three Rhine River branches to uncertainties in discharge by investigating the Q-h relationship along the rivers’ courses. We found that the Waal River is the most sensitive to deviations from the expected discharges, whereas the IJssel River is the least sensitive. This means that uncertainties about the Rhine River’s discharge may sooner cause things to go wrong along the Waal River than along the IJssel River. The influence on risk of this phenomenon is effective via the two previously discussed mechanisms: in a river that is more sensitive to uncertainties in discharge, an unexpected increase in discharge will lead to a more rapid increase in failure probabilities and consequences in case of flooding. We introduced the Q-h relationship as a proxy for a river’s robustness. Then it follows that the IJssel River is the most robust, followed by the Nederrijn-Lek River, whereas the Waal River is the least robust. This approach, i.e., interpreting the Q-h relationship by assessing decimation heights, allows the comparison of different rivers in different climatic settings, and may prove applicable worldwide. We do need applications on alluvial rivers in other parts of the world to establish this with more certainty however.
Our interpretation of the concept of robustness deviates slightly from that of Mens [10] et al. [11,36] in the sense that it pertains to a river in its function of discharging water instead of to a flood risk system, defined as a geographic unit consisting of protected areas including the socio-economy in those areas as well as the infrastructure that provides flood protection (cf. [10]). With respect to flood risk systems, Mens [10] advised to analyze the shape of the relationship between flood consequences and discharge. We, in this paper, have investigated the relationship between discharge and flood water level in the river itself. Obviously, there exists a close relationship between the robustness of the river and the robustness of the flood risk system. In addition, the non-linearity referred to with respect to the increase of consequences with increasing river water level supports this view. Sensitive to higher water levels may imply sensitivity to sudden increases in consequence, as found by Mens in her case studies [10]. The aspiration for a robust river, which is not so sensitive to temporal variability in discharge, is currently supported by The Netherlands’ river managers [37].
Now why is a robustness perspective relevant? As we already stated in the introduction, people perceive risk not in the same manner as engineers or scientists do. When we define risk as the summed product of probabilities and consequences, we judge rare disastrous floods as equally risky as frequent floods with minor consequences. This conceptualization of risk lies behind cost-benefit analyses as they have been performed to derive the new flood protection standards in The Netherlands [3,4] and are used as basis for decisions about flood mitigation projects in the UK, USA and in many other countries as well. This approach is typical for a utilitarian perspective: to achieve the largest benefits for the least costs. However, reducing risk to an acceptable level against acceptable costs does not account for the dread of disasters nor for the fact that disastrous consequences may be unbearable to a local, regional or even larger society and not be overcome. A robustness perspective, instead, puts emphasis on the sensitivity to uncertainty, whether related to natural variability or climate change, as well as on the capacity to recover from flood events. In this paper, we showed that indeed the rise of the river flood levels in the Rhine and Meuse Rivers may translate into increases in consequence which are beyond our imagination because of non-linearities. In one case we find twelve times larger consequences for “the worst breach”, but perhaps we had better look at the overall effect of 0.5 m higher flood levels for all “worst breaches” along our major rivers: this adds up to almost 50% more people affected, more than 50% larger damage, and more than 70% more casualties. This sounds like a good argument to at least prevent that an increase of river discharges resulting from climate change translates into higher flood water levels by enhancing the conveyance capacity of the river. In addition, as follows from our analysis of the Q-h relationship, this should preferably be done by enlarging the floodplain area to achieve more robust rivers and consequently a more robust flood risk system along our major rivers as well.
Author Contributions
N.A. is project leader for the research on how much risk reduction room for the river provides, as well as for all Deltares research in support of the Delta Program Large Rivers. She coordinated the quantifications, took the initiative for this paper and defined the set-up together with F.K. F.K. wrote the majority of the text, drawing from more than 20 years of experience in river research and flood risk management. D.W. established the consequences of flooding, did most of the calculations, produced numbers and figures, and participated in the discussions on the results and outcomes.
Acknowledgments
The research has been financially supported by The Netherlands’ Ministry of Public Works and Water Management through its regular funding of Deltares’ strategic research and research for policy support.
Conflicts of Interest
The authors declare no conflict of interest. The founding sponsors had no role in the design of the study; in the analyses or interpretation of the results; in the writing of the manuscript, nor in the decision to publish.
References
- Silva, W.; Dijkman, J.P.M.; Loucks, D.P. Flood management options for The Netherlands. Int. J. River Basin Manag. 2004, 2, 101–112. [Google Scholar] [CrossRef]
- Klijn, F.; de Bruin, D.; de Hoog, M.; Jansen, S.; Sijmons, D. Design quality of Room-for-the-River measures in The Netherlands: Role and assessment of the Quality Team (Q-team). J. River Basin Manag. 2013, 11, 287–299. [Google Scholar] [CrossRef]
- Kind, J.M. Economically efficient flood protection standards for The Netherlands. J. Flood Risk Manag. 2014, 7, 103–117. [Google Scholar] [CrossRef]
- Van der Most, H.; Tánczos, I.; de Bruijn, K.M.; Wagenaar, D. New, risk-based standards for flood protection in The Netherlands. In Proceedings of the 6th International Conference on Flood Management (ICFM6), Sao Paulo, Brazil, 16–18 September 2014. [Google Scholar]
- White, G.F. Human Adjustment to Floods; Department of Geography Research Paper No. 29; The University of Chicago: Chicago, IL, USA, 1945. [Google Scholar]
- Van Heezik, A. Battle over the Rivers. Two Hundred Years of River Policy in The Netherlands; Van Heezik Beleidsresearch: Haarlem, The Netherlands; The Hague, The Netherlands, 2008. [Google Scholar]
- Vis, M.; Klijn, F.; de Bruijn, K.M.; van Buuren, M. Resilience strategies for flood risk management in The Netherlands. J. River Basin Manag. 2003, 1, 33–40. [Google Scholar] [CrossRef]
- De Bruijn, K.M. Resilience and Flood Risk Management: A Systems Approach Applied to Lowland Rivers; Delft University Press: Delft, The Netherlands, 2005. [Google Scholar]
- De Bruijn, K.M.; Buurman, J.; Mens, M.; Dahm, R.; Klijn, F. Resilience in practice: Five principles to enable societies to cope with extreme weather events. Environ. Sci. Policy 2017, 70, 21–30. [Google Scholar] [CrossRef]
- Mens, M.J.P. System Robustness Analysis in Support of Flood and Drought Management; IOS Press BV: Amsterdam, The Netherlands, 2015. [Google Scholar]
- Mens, M.J.P.; Klijn, F. The added value of system robustness analysis for flood risk management illustrated by a case on the IJssel River. Nat. Hazards Earth Syst. Sci. 2015, 15, 213–223. [Google Scholar] [CrossRef] [Green Version]
- Mens, M.J.P.; Schielen, R.; Klijn, F. Enhancing flood risk system robustness in practice: Insights from two river valleys. J. River Basin Manag. 2015, 13, 297–304. [Google Scholar] [CrossRef]
- Pinter, N.; Jemberie, A.A.; Remo, J.W.F.; Heine, R.A.; Ickes, B.S. Flood trends and river engineering on the Mississippi River system. Geophys. Res. Lett. 2008, 35, L23404. [Google Scholar] [CrossRef]
- Pinter, N.; Jemberie, A.A.; Remo, J.W.F.; Heine, R.A.; Ickes, B.S. Cumulative impacts of river engineering, Mississippi and Lower Missouri rivers. River Res. Appl. 2010, 26, 546–571. [Google Scholar] [CrossRef]
- Heine, R.A.; Pinter, N. Levee effects upon flood levels: An empirical assessment. Hydrol. Process. 2012, 26, 3225–3240. [Google Scholar] [CrossRef]
- Asselman, N.E.M.; Klijn, F. Making room for rivers: Quantification of benefits from a flood risk perspective. In Proceedings of the 3rd European Conference on Flood Risk Management, Innovation, Implementation, Integration (FLOODrisk 2016), Lyon, France, 18–20 October 2016. [Google Scholar]
- FLOODsite. Flood Risk Assessment and Flood Risk Management. An Introduction and Guidance Based on Experiences and Findings of FLOODsite (an EU-Funded Integrated Project); Deltares|Delft Hydraulics: Delft, The Netherlands, 2009; p. 140. ISBN 978-90-814067-1-0. [Google Scholar]
- Klijn, F.; Kreibich, H.; de Moel, H.; Penning-Rowsell, E. Adaptive Flood Risk Management Planning based on a Comprehensive Flood Risk Conceptualisation. Mitig. Adapt. Strateg. Glob. Chang. 2015, 20, 845–864. [Google Scholar] [CrossRef]
- Merz, B.; Kreibich, H.; Thieken, A.; Schmidtke, R. Estimation uncertainty of direct monetary flood damage to buildings. Nat. Hazards Earth Syst. Sci. 2004, 4, 153–163. [Google Scholar] [CrossRef] [Green Version]
- Baan, P.J.A.; Klijn, F. Flood risk perception and implications for flood risk management in The Netherlands. J. River Basin Manag. 2004, 2, 113–122. [Google Scholar] [CrossRef]
- Merz, B.; Elmer, F.; Thieken, A.H. Significance of ‘high probability/low damage’ versus ‘low probability/high damage’ flood events. Nat. Hazards Earth Syst. Sci. 2009, 9, 1033–1046. [Google Scholar] [CrossRef]
- Slomp, R.M.; de Waal, J.P.; Ruijgh, E.F.W.; Kroon, T.; Snippen, E.; van Alphen, J.S.L.J. The Dutch Delta Model for policy analysis on flood risk management in The Netherlands. In Proceedings of the 6th International Conference on Flood Management (ICFM6), Sao Paulo, Brazil, 16–18 September 2014. [Google Scholar]
- Jongejan, R.; Maaskant, B.; ter Horst, W.; Havinga, F.; Roode, N.; Stefess, H. The VNK2-project: A fully probabilistic risk analysis for all major levee systems in The Netherlands. In Proceedings of the International Conference on Flood Management No 05, Tokyo, Japan, 27–29 September 2011; Volume 357, pp. 75–85. [Google Scholar]
- Kok, M.; Huizinga, H.J.; Vrouwenvelder, A.W.C.M.; van den Braak, W.E.W. Standaardmethode 2005 Schade en Slachtoffers als Gevolg van Overstromingen; Ministry of Infrastructure and Water management: Delft, The Netherlands, 2005; (In Dutch).
- Slager, K.; van der Doef, M. Handboek Overstromingsrisico’s op de Kaart: Over de Methode van Kaartproductie voor Kaarten; Deltares Report 1209425-000-VEB-0002; Deltares: Delft, The Netherlands, 2014. [Google Scholar]
- De Bruijn, K.M.; Klijn, F.; van de Pas, B.; Slager, C.T.J. Flood fatality hazard and flood damage hazard: Combining multiple hazard characteristics into meaningful maps for spatial planning. Nat. Hazards Earth Syst. Sci. 2015, 15, 1297–1309. [Google Scholar] [CrossRef]
- Hegnauer, M.; Kwadijk, J.; Klijn, F. The Plausibility of Extreme High Discharges in the River Rhine; Deltares-Report 1220042-004; Deltares: Delft, The Netherlands, 2015. [Google Scholar]
- Van der Meij, R.; ter Horst, W.; van Vuren, S.; Pol, J.; Koopmans, R.; van der Scheer, P.; Levelt, O.; Asselman, N.; de Grave, P.; de Kruif, A. Uitwerking Methode Voor Bepaling Kostenreductie Rivierverruiming; Kostenreductie Dijkverbeteringen Door Uitvoering Rivierverruiming; Ministry of Infrastructure and Environment: Plesmanweg, The Netherlands, 2016.
- Wojciechowska, K.; Pleijter, G.; Zethof, M.; Havinga, F.J.; van Haaren, D.H.; ter Horst, W.L.A. Application of Fragility Curves in Operational Flood Risk Assessment. In Geotechnical Safety and Risk V; Schweckendiek, T., Ed.; IOS Press: Amsterdam, The Netherlands, 2015; pp. 528–534. [Google Scholar]
- Hegnauer, M.; Beersma, J.J.; van den Boogaard, H.F.P.; Buishand, T.A.; Passchier, R.H. Generator of Rainfall and Discharge Extremes (GRADE) for the Rhine and Meuse Basins. Final Report of GRADE 2.0; Deltares-Rapport 1209424-004; Deltares: Delft, The Netherlands, 2014. [Google Scholar]
- Prinsen, G.; van de Boogaard, H.F.P.; Hegnauer, M. Onzekerheidsanalyse Hydraulica in GRADE; Deltares-Rapport 1220082-010; Deltares: Delft, The Netherlands, 2015. [Google Scholar]
- Wagenaar, D.J.; de Bruijn, K.M.; Bouwer, L.M.; de Moel, H. Uncertainty in flood damage estimates and its potential effect on investment decisions. Nat. Hazards Earth Syst. Sci. 2016, 16, 1–14. [Google Scholar] [CrossRef] [Green Version]
- Klijn, F.; Asselman, N.; van der Most, H. Compartmentalisation: Flood consequence reduction by splitting-up large polder areas. J. Flood Risk Manag. 2010, 3, 3–17. [Google Scholar] [CrossRef]
- Klijn, F.; Asselman, N.; Silva, W.; Stone, K. Ruimteverlies van Rijn en Maas verkend. Het Watersch. 2002, 13, 590–601. [Google Scholar]
- Kleinhans, M.G.; Klijn, F.; Cohen, K.M.; Middelkoop, H.J.H. Wat Wil de Rivier Zelf Eigenlijk; Deltares-Rapport 1207829; Universiteit Utrecht & Deltares: Utrecht, The Netherlands, 2013. [Google Scholar]
- Klijn, F.; Mens, M.J.P.; Asselman, N.E.M. Flood risk management for an uncertain future: Economic efficiency and system robustness perspectives compared for the Meuse River (Netherlands). Mitig. Adapt. Strateg. Glob. Chang. 2015, 20, 1011–1026. [Google Scholar] [CrossRef]
- Klijn, F.; ten Brinke, W.; Asselman, N.; Mosselman, E. Het Verhaal van de Rivier. Een Eerste Versie; Deltares i.o.v. Rijkswaterstaat-WVL: Delft, The Netherlands, 2017. [Google Scholar]
Figure 1.
The Meuse river enters The Netherlands from Belgium in the south and the Rhine River enters from Germany at the eastern border and then branches into Waal, Nederrijn-Lek and IJssel in a proportion of 6:2:1 during flood discharge.
Figure 1.
The Meuse river enters The Netherlands from Belgium in the south and the Rhine River enters from Germany at the eastern border and then branches into Waal, Nederrijn-Lek and IJssel in a proportion of 6:2:1 during flood discharge.

Figure 2.
The failure probability of a flood defense at a certain location is a function of the probability density function of the flood water level and the strength of the flood defense expressed in a fragility curve (conditional probability of failure).
Figure 2.
The failure probability of a flood defense at a certain location is a function of the probability density function of the flood water level and the strength of the flood defense expressed in a fragility curve (conditional probability of failure).

Figure 3.
Making room for rivers lowers the flood water level at the location of the intervention and extending upstream of this location. An example for the bypass Veessen-Wapenveld on the IJssel River, implemented 2017, and extending from kmr 961 to 973.
Figure 3.
Making room for rivers lowers the flood water level at the location of the intervention and extending upstream of this location. An example for the bypass Veessen-Wapenveld on the IJssel River, implemented 2017, and extending from kmr 961 to 973.

Figure 4.
Water depth and flooded area as a function of location of breaching (red dot) and flood level in the river in case of a breach of the eastern embankment of the IJssel River at Deventer (a,b) or Olst (c,d). Breaching under design flood level conditions (a,c) and breaching at water levels that are about 0.7 m lower due to enhanced conveyance capacity (b,d). (source: inundation simulations made for VNK2 and collected by IPO and RWS in the context of the implementation of the EU Flood Directive).

Figure 5.
Increase in economic damage resulting from 0.5 m higher river flood levels in the river.

Figure 6.
Decrease in probability of breaching (factor) resulting from 0.5 m lower flood levels in the river.
Figure 6.
Decrease in probability of breaching (factor) resulting from 0.5 m lower flood levels in the river.

Figure 7.
Increase in water level with increasing river discharge in a river with a narrow and one with a wide cross section.
Figure 7.
Increase in water level with increasing river discharge in a river with a narrow and one with a wide cross section.

Figure 8.
Cumulative decimation heights for respectively Bovenrijn-Waal (top), Bovenrijn-Pannerdensch Canal-Nederrijn/Lek (center) and Bovenrijn-Pannerdens Canal-IJssel (bottom). Mark that the rivers have different lengths.
Figure 8.
Cumulative decimation heights for respectively Bovenrijn-Waal (top), Bovenrijn-Pannerdensch Canal-Nederrijn/Lek (center) and Bovenrijn-Pannerdens Canal-IJssel (bottom). Mark that the rivers have different lengths.


Table 1.
Consequence increase that would result in The Netherlands’ dike ring areas from 0.5 m higher flood levels in case climate change impacts on river flood levels would not be counteracted by making more room for the river. Results refer to the breach location in each dike ring area with the largest consequences.
| Dike Ring Area | Damage | Increase per 0.5 m | Fatalities | Increase per 0.5 m | People Affected | Increase per 0.5 m | |||
|---|---|---|---|---|---|---|---|---|---|
| M€ | M€ | % | nr | nr | % | nr | nr | % | |
| 10 | 3232 | 630 | 20 | 168 | 37 | 22 | 29,439 | 2431 | 8 |
| 11 | 298 | 404 | 136 | 9 | 10 | 109 | 1793 | 0 | 0 |
| 15 | 25,241 | 13,446 | 53 | 1818 | 1000 | 55 | 329,568 | 188,775 | 57 |
| 16 | 27,693 | 7196 | 26 | 3808 | 3718 | 98 | 101,066 | 44,316 | 44 |
| 24 | 2685 | 886 | 33 | 336 | 53 | 16 | 40,644 | 0 | 0 |
| 34a | 453 | 142 | 31 | 29 | 10 | 34 | 6630 | 654 | 10 |
| 35 | 829 | 2983 | 360 | 122 | 159 | 131 | 15,594 | 49,083 | 315 |
| 36 | 14,835 | 9464 | 64 | 740 | 496 | 67 | 203,110 | 71,189 | 35 |
| 38 | 8259 | 824 | 10 | 467 | 58 | 12 | 45,022 | 524 | 1 |
| 40 | 85 | 26 | 31 | 13 | 40 | 314 | 854 | 159 | 19 |
| 41 | 6776 | 3766 | 56 | 344 | 188 | 55 | 91,610 | 42,665 | 47 |
| 42 | 2474 | 326 | 13 | 632 | 213 | 34 | 14,428 | 29 | 0 |
| 43 | 19,646 | 2514 | 13 | 1010 | 290 | 29 | 219,748 | 13,948 | 6 |
| 44 | 20,200 | 26,450 | 131 | 937 | 1206 | 129 | 407,094 | 363,825 | 89 |
| 45 | 19,571 | 2082 | 11 | 1007 | 144 | 14 | 222,744 | 18,929 | 8 |
| 47 | 5490 | 1935 | 35 | 320 | 135 | 42 | 35,172 | 0 | 0 |
| 48 | 584 | 7006 | 1201 | 352 | 720 | 205 | 4436 | 59,980 | 1352 |
| 50 | 376 | 797 | 212 | 6 | 30 | 476 | 5653 | 15,815 | 280 |
| 51 | 257 | 129 | 50 | 4 | 4 | 92 | 5068 | 1124 | 22 |
| 52 | 298 | 404 | 136 | 9 | 10 | 109 | 22,122 | 1868 | 8 |
| 53 | 2251 | 3015 | 134 | 58 | 116 | 201 | 50,136 | 38,387 | 77 |
Table 2.
Calculated probability of breaching per flood defense stretch, before and after lowering the flood water levels by 0.5 m, and difference between the two probabilities (factor).
Table 2.
Calculated probability of breaching per flood defense stretch, before and after lowering the flood water levels by 0.5 m, and difference between the two probabilities (factor).
| River | Defense Stretch | Probability | Difference | |
|---|---|---|---|---|
| Before (per Year) | After (per Year) | (Factor) | ||
| Waal-Merwede | 16-2 | 1:14,000 | 1:580,000 | 41.8 |
| downstream | 16-1 | 1:92,000 | 1:2,971,000 | 32.4 |
| 24-3 | 1:23,000 | 1:242,000 | 10.6 | |
| 38-1 | 1:21,000 | 1:200,000 | 9.7 | |
| 40-1 | 1:67,000 | 1:583,000 | 8.7 | |
| 41-2 | 1:6400 | 1:48,000 | 7.5 | |
| 41-1 | 1:26,000 | 1:172,000 | 6.6 | |
| 43-6 | 1:19,000 | 1:133,000 | 7.0 | |
| 43-5 | 1:19,000 | 1:128,000 | 6.7 | |
| 43-4 | 1:20,000 | 1:103,000 | 5.1 | |
| 42-1 | 1:5900 | 1:29,000 | 4.9 | |
| upstream | 48-1 | 1:18,000 | 1:112,000 | 6.0 |
| Nederrijn-Lek | 16-3 | 1:800 | 1:135,000 | 169.8 |
| downstream | 16-4 | 1:420 | 1:54,000 | 129.9 |
| 15-2 | 1:4800 | 1:63,000 | 13.2 | |
| 15-1 | 1:6800 | 1:64,000 | 9.4 | |
| 44-1 | 1:3200 | 1:47,000 | 14.9 | |
| 45-1 | 1:14,000 | 1:114,000 | 7.9 | |
| 43-1 | 1:3600 | 1:37,000 | 10.3 | |
| 43-2 | 1:170 | 1:7300 | 43,3 | |
| upstream | 43-3 | 1:3400 | 1:53,000 | 15.7 |
| IJssel | 10-3 | 1:84,000 | 1:1,887,000 | 22.4 |
| downstream | 11-1 | 1:3100 | 1:43,000 | 14.0 |
| 53-2 | ‘never’ | ∞ | ||
| 52-4 | 1:3800 | 1:47,000 | 12.2 | |
| 52-3 | 1:2,024,000 | ‘never’ | ∞ | |
| 52a-1 | 1:6400 | 1:56,000 | 8.7 | |
| 52-2 | 1:3900 | 1:36,000 | 9.3 | |
| 53-1 | 1:2200 | 1:29,000 | 12.8 | |
| 51-1 | 1:660 | 1:8100 | 12.2 | |
| 50-2 | 1:2500 | 1:26,000 | 10.6 | |
| 50-1 | 1:21,000 | 1:205,000 | 9.5 | |
| 49-1 | 1:450 | 1:1600 | 3.6 | |
| 48-3 | 1:15,000 | 1:54,000 | 3.5 | |
| 48-2 | 1:200 | 1:390 | 2.0 | |
| 49-2 | 1:6100 | 1:53,000 | 8.6 | |
| 52-1 | 1:2800 | 1:36,000 | 12.8 | |
| upstream | 47-1 | 1:270 | 1:4600 | 17.1 |
| Lower Meuse | 35-1 | 1:7600 | 1:94,000 | 12.4 |
| downstream | 24-1 | 1:6600 | 1:111,000 | 16.8 |
| 36-5 | 1:6600 | 1:76,000 | 11.5 | |
| 37-1 | 1:48,000 | 1:468,000 | 9.7 | |
| 38-2 | 1:6300 | 1:85,000 | 13.5 | |
| 36-4 | 1:5600 | 1:54,000 | 9.6 | |
| 39-1 | 1:5800 | 1:57,000 | 9.7 | |
| 36-3 | 1:18,000 | 1:153,000 | 8.4 | |
| 40-2 | 1:6000 | 1:59,000 | 9.8 | |
| 36a-1 | 1:2300 | 1:15,000 | 6.6 | |
| 41-3 | 1:6000 | 1:56,000 | 9.4 | |
| 36-2 | 1:19,000 | 1:165,000 | 8.7 | |
| 41-4 | 1:6000 | 1:45,000 | 7.1 | |
| upstream | 36-1 | 1:8000 | 1:49,000 | 6.0 |
| Meuse Valley | 54-1 | 1:530 | 1:3900 | 7.2 |
| 55-1 | 1:480 | 1:3900 | 8.0 | |
| 56-1 | 1:250 | 1:1700 | 6.8 | |
| 57-1 | 1:180 | 1:1200 | 6.5 | |
| 58-1 | 1:6400 | 1:197,000 | 30.9 | |
| 59-1 | 1:370 | 1:5200 | 13.9 | |
| 60-1 | 1:210 | 1:1800 | 8.4 | |
| 61-1 | 1:260 | 1:2400 | 9.5 | |
| 61-2 | 1:370 | 1:5000 | 13.2 | |
| 62-1 | 1:430 | 1:12,000 | 29.0 | |
| 63a-1 | 1:560 | 1:14,000 | 25.4 | |
| 63b-1 | 1:720 | 1:24,000 | 32.7 | |
| 64-1 | 1:260 | 1:1300 | 4.8 | |
| 65-1 | 1:220 | 1:1500 | 6.9 | |
| 66-1 | 1:290 | 1:2100 | 7.3 | |
| 67-1 | 1:350 | 1:2100 | 6.2 | |
| 68-1 | 1:440 | 1:2800 | 6.4 | |
| 68-2 | 1:240 | 1:1500 | 6.4 | |
| 69-1 | 1:370 | 1:2500 | 6.8 | |
| 70-1 | 1:230 | 1:1100 | 5.0 | |
| 71-1 | 1:280 | 1:1300 | 4.7 | |
| 72-1 | 1:440 | 1:3400 | 7.8 | |
| 73-1 | 1:210 | 1:930 | 4.4 | |
| 74-1 | 1:240 | 1:1200 | 4.8 | |
| 75-1 | 1:210 | 1:910 | 4.4 | |
| 76-1 | 1:220 | 1:1010 | 4.7 | |
| 76-2 | 1:130 | 1:590 | 4.5 | |
| 76a-1 | 1:150 | 1:750 | 4.9 | |
| 77-1 | 1:170 | 1:880 | 5.2 | |
| 78-1 | 1:250 | 1:2600 | 10.5 | |
| 78a-1 | 1:3000 | 1:320,000 | 107.3 | |
| 79-1 | 1:230 | 1:2400 | 10.3 | |
| 80-1 | 1:240 | 1:2000 | 8.3 | |
| 81-1 | 1:190 | 1:1700 | 9.0 | |
| 82-1 | 1:200 | 1:1500 | 7.4 | |
| 83-1 | 1:180 | 1:1500 | 8.1 | |
| 85-1 | 1:470 | 1:1600 | 3.4 | |
| 86-1 | 1:320 | 1:1600 | 4.9 | |
| 87-1 | 1:590 | 1:4500 | 7.7 | |
| 88-1 | 1:180 | 1:940 | 5.2 | |
| 89-1 | 1:410 | 1:4900 | 12.0 | |
| 90-1 | 1:3900 | 1:45,000 | 11.4 | |
| 91-1 | 1:410 | 1:3600 | 8.7 | |
| 92-1 | 1:190 | 1:1300 | 7.0 | |
| 93-1 | 1:530 | 1:5200 | 9.8 | |
| 94-1 | 1:420 | 1:3300 | 7.8 | |
| upstream | 95-1 | 1:420 | 1:3800 | 8.9 |
© 2018 by the authors. Licensee MDPI, Basel, Switzerland. This article is an open access article distributed under the terms and conditions of the Creative Commons Attribution (CC BY) license (http://creativecommons.org/licenses/by/4.0/).
Share and Cite
MDPI and ACS Style
Klijn, F.; Asselman, N.; Wagenaar, D. Room for Rivers: Risk Reduction by Enhancing the Flood Conveyance Capacity of The Netherlands’ Large Rivers. Geosciences 2018, 8, 224. https://doi.org/10.3390/geosciences8060224
AMA Style
Klijn F, Asselman N, Wagenaar D. Room for Rivers: Risk Reduction by Enhancing the Flood Conveyance Capacity of The Netherlands’ Large Rivers. Geosciences. 2018; 8(6):224. https://doi.org/10.3390/geosciences8060224
Chicago/Turabian StyleKlijn, Frans, Nathalie Asselman, and Dennis Wagenaar. 2018. "Room for Rivers: Risk Reduction by Enhancing the Flood Conveyance Capacity of The Netherlands’ Large Rivers" Geosciences 8, no. 6: 224. https://doi.org/10.3390/geosciences8060224
Note that from the first issue of 2016, this journal uses article numbers instead of page numbers. See further details here.