Morphodynamic Trends of the Ribb River, Ethiopia, Prior to Dam Construction
by
 , and
, and
Chalachew A. Mulatu
1,2,3,*, 
Alessandra Crosato
2,3,
Michael M. Moges
1,
Eddy J. Langendoen
4 and
Michael McClain
2,3 1
Faculty of Civil and Water Resources Engineering, Bahir Dar University, P.O. Box 26, Bahir Dar, Ethiopia
2
IHE Delft, Department of Water Science and Engineering, 2601 DA Delft, The Netherlands
3
Faculty of Civil Engineering and Geosciences, Delft University of Technology, 2600 GA Delft, The Netherlands
4
U.S. Department of Agriculture, Agricultural Research Service, Watershed Physical Processes Research Unit, Oxford, MS 38655, USA
*
Author to whom correspondence should be addressed.
Geosciences 2018, 8(7), 255; https://doi.org/10.3390/geosciences8070255
Submission received: 28 May 2018
/
Revised: 5 July 2018
/
Accepted: 6 July 2018
/
Published: 9 July 2018
(This article belongs to the Special Issue Beyond the Channel—Investigating Processes at Crucial Fluvial Interfaces)
Abstract
:The meandering Ribb River flows in northwest Ethiopia to Lake Tana, the source of the Blue Nile River. The river has already undergone changes due to several human interventions, such as embanking, sand mining, water extraction and lake level regulation for hydropower. At present, a dam and a weir are under construction to store and divert water for irrigation. This will strongly alter both water and sediment discharges to the downstream river reaches, causing adjustments to the morphology. Assessing the current morphodynamic trends is the first necessary step to study the future effects and find ways to mitigate them. This paper presents an analysis of the current and past river based on newly collected data, aerial photographs, SPOT and Google Earth images. The riverbed changes are derived from historical staff gauge height analysis. The effects of sediment mining and water extraction are assessed using the theory of morphodynamic equilibrium. The findings of the analysis show a reduction of sediment transport capacity in the downstream direction, which has resulted in intense sediment deposition, resulting in blockage of the Lower River reach and subsequent channel avulsion. The effects of Lake Tana level regulation on the observed processes appear to be minor.
Keywords:
Ribb River; Blue Nile Basin; Lake Tana; river morphology; river dynamics; dam construction1. Introduction
Alluvial rivers adjust their slope, planform and bed topography in response to sediment and/or water input changes due to either anthropogenic influences, natural events (landslides, etc.), or climate change [1,2]. The study of the nature, rate and causes of river channel changes has a particular relevance to areas where high levels of natural and human disturbance threaten engineering structures and property [3] as well as the biodiversity of vegetation communities within the river corridor [4,5,6]. Knowledge of morphodynamic trends and their alterations is thus key to proper management of river resources [7].
Assessing the future impact of planned works requires an exhaustive description of the river hydro-morphological characteristics and dynamics prior to the intervention. This is necessary, for instance, for the simulation of the hydro-morphological adaptation of the river with a numerical model (e.g., [8]) because it establishes the starting conditions. It is also necessary for the analysis of future field data to unravel the role of the intervention because it offers a base-case scenario for comparison. Knowledge of the current morphology and dynamics is also key to identifying the effects of on-going climate changes on the functioning of the river and its floodplain. Finally, acquiring this knowledge is the first step for the definition of mitigation strategies.
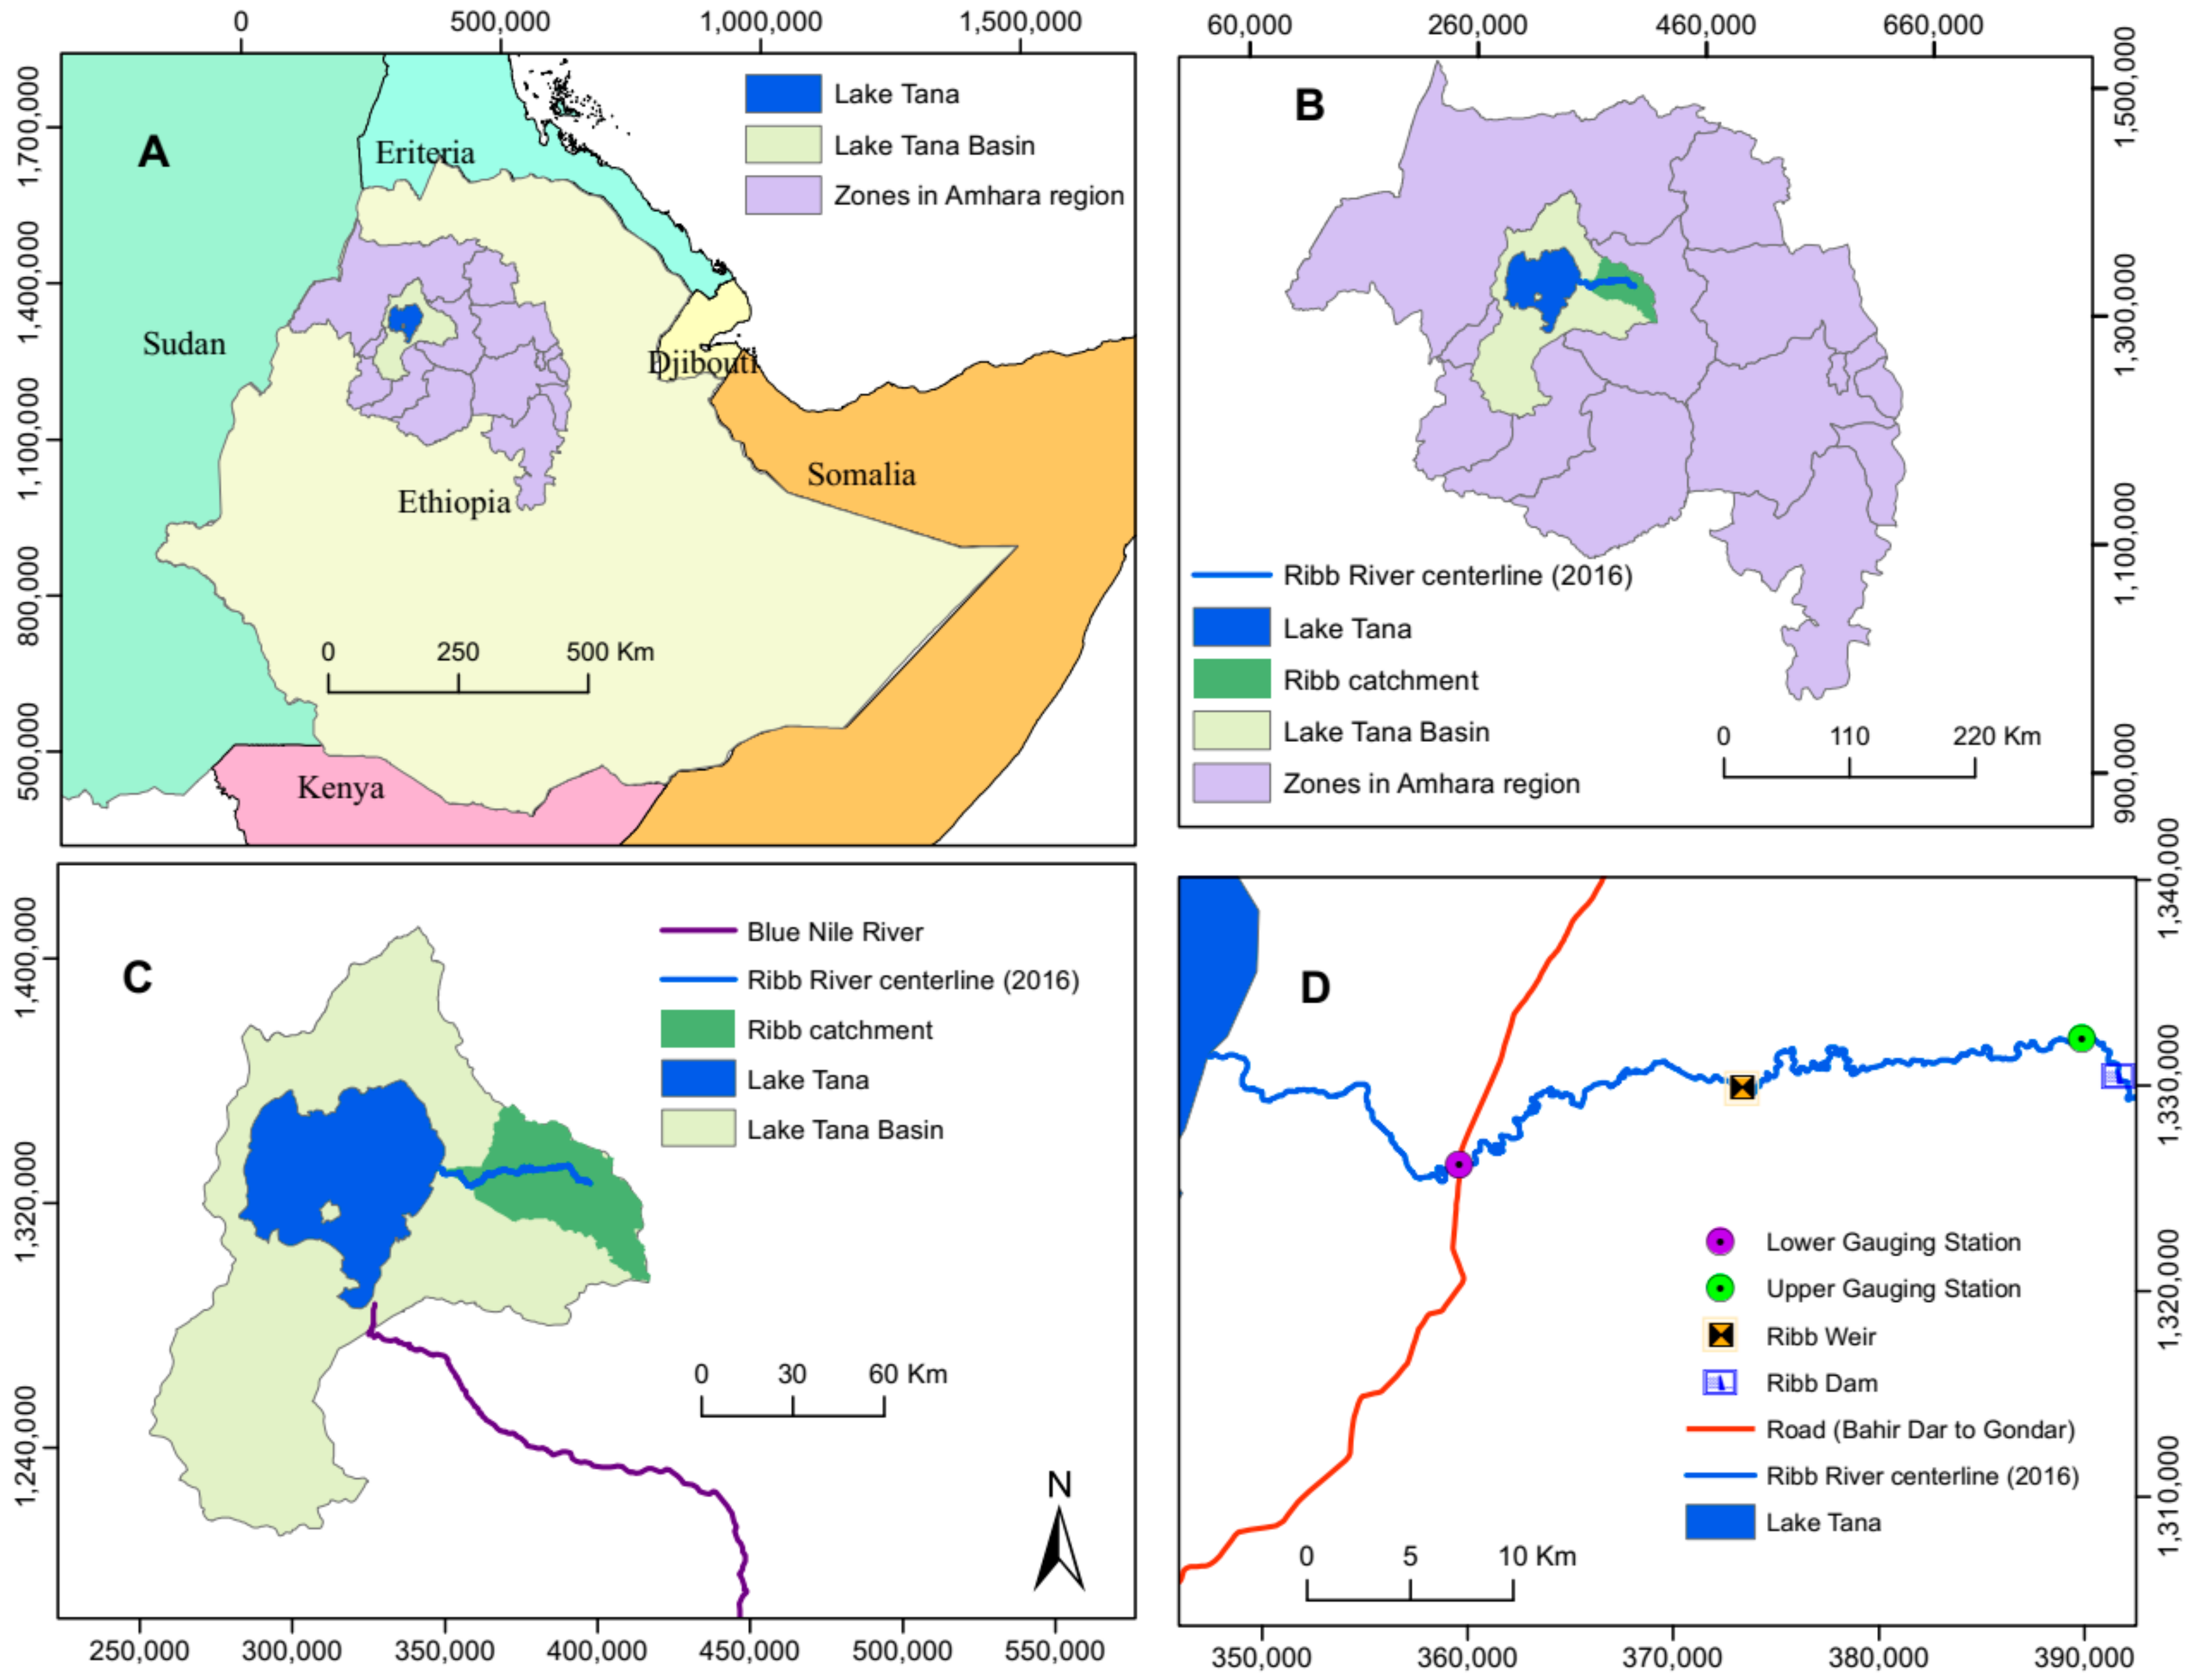
The Ribb River is one of the components of the Blue Nile River system located in the Northwestern part of Ethiopia (Figure 1). The river drains to Lake Tana, which is the source of the Blue Nile River. The Upper Blue Nile Basin is considered as one of the growth corridors by the Ethiopian government for its fertile land and ample availability of water for irrigation [9]. Due to this, a 73 m high dam to impound 234 million m3 of water and a 4 m high diversion weir 30 km downstream of the dam are under construction. The water released from the dam will flow through the river channel to the weir. This will allow diverting most of the water to two canals (both left and right of the river starting from the weir, Figure 1D) to irrigate 15,000 ha of the Fogera Plain [10]. During low flow conditions, the downstream Ribb River reaches will only receive the environmental flow, which varies between 0.15 and 0.17 m3/s. This small discharge will nevertheless be larger than the current dry-season flow, since the river is regularly dry. The operations of the dam will thus strongly affect both water discharge regime and sediment transport in the downstream reaches (e.g., [11,12,13]). In response, the river will adjust its morphology to the new conditions (e.g., [14,15].
The main objective of this study is to define the pre-dam situation of the Ribb River system and identify the current morphodynamic trends in order to allow for the assessment of the impact of the planned structures and operations on the downstream reaches. The study includes the analysis of the effects of current Lake Tana level regulation, river embankment for flood control, sand mining and water extraction for irrigation on past and present riverbed topography and planform changes.
The methodology includes the analysis of historical data, namely aerial photos, SPOT satellite images and Google Earth imagery to study the river planimetric changes. The effects of Lake Tana regulation on the Ribb River bed level adjustment propagation in the upstream direction are analyzed considering the morphological time-scale derived by De Vries [16]. The effects of sand mining and water extraction on riverbed slope are analyzed using the morphodynamic equilibrium theory developed by Jansen et al. [1]. The work includes the analysis of data provided by the Ministry of Water, Irrigation and Energy, Ethiopia, as well as data from the feasibility study and design documents of the Ribb Irrigation project [10], and new field data collected in the framework of this study during two recent field survey campaigns.
2. Study Area
2.1. General Description
The total catchment area of the Ribb River (Figure 1C) is 1865 km2, and the total length of the river is 130 km. The river originates from the Guna Mountains, reaching an elevation of 4000 m a.s.l., and debouches into Lake Tana, at an elevation of 1787 m a.s.l. The upper part of the catchment, covering 70% of the total area, is characterized by a rugged topography with average slope of 13%. The average topographic slope reduces to <1% at the Fogera Plain. The land in the catchment is degraded because of population growth, free grazing and intensive agriculture over several decades in the absence of any natural resources’ conservation practices.
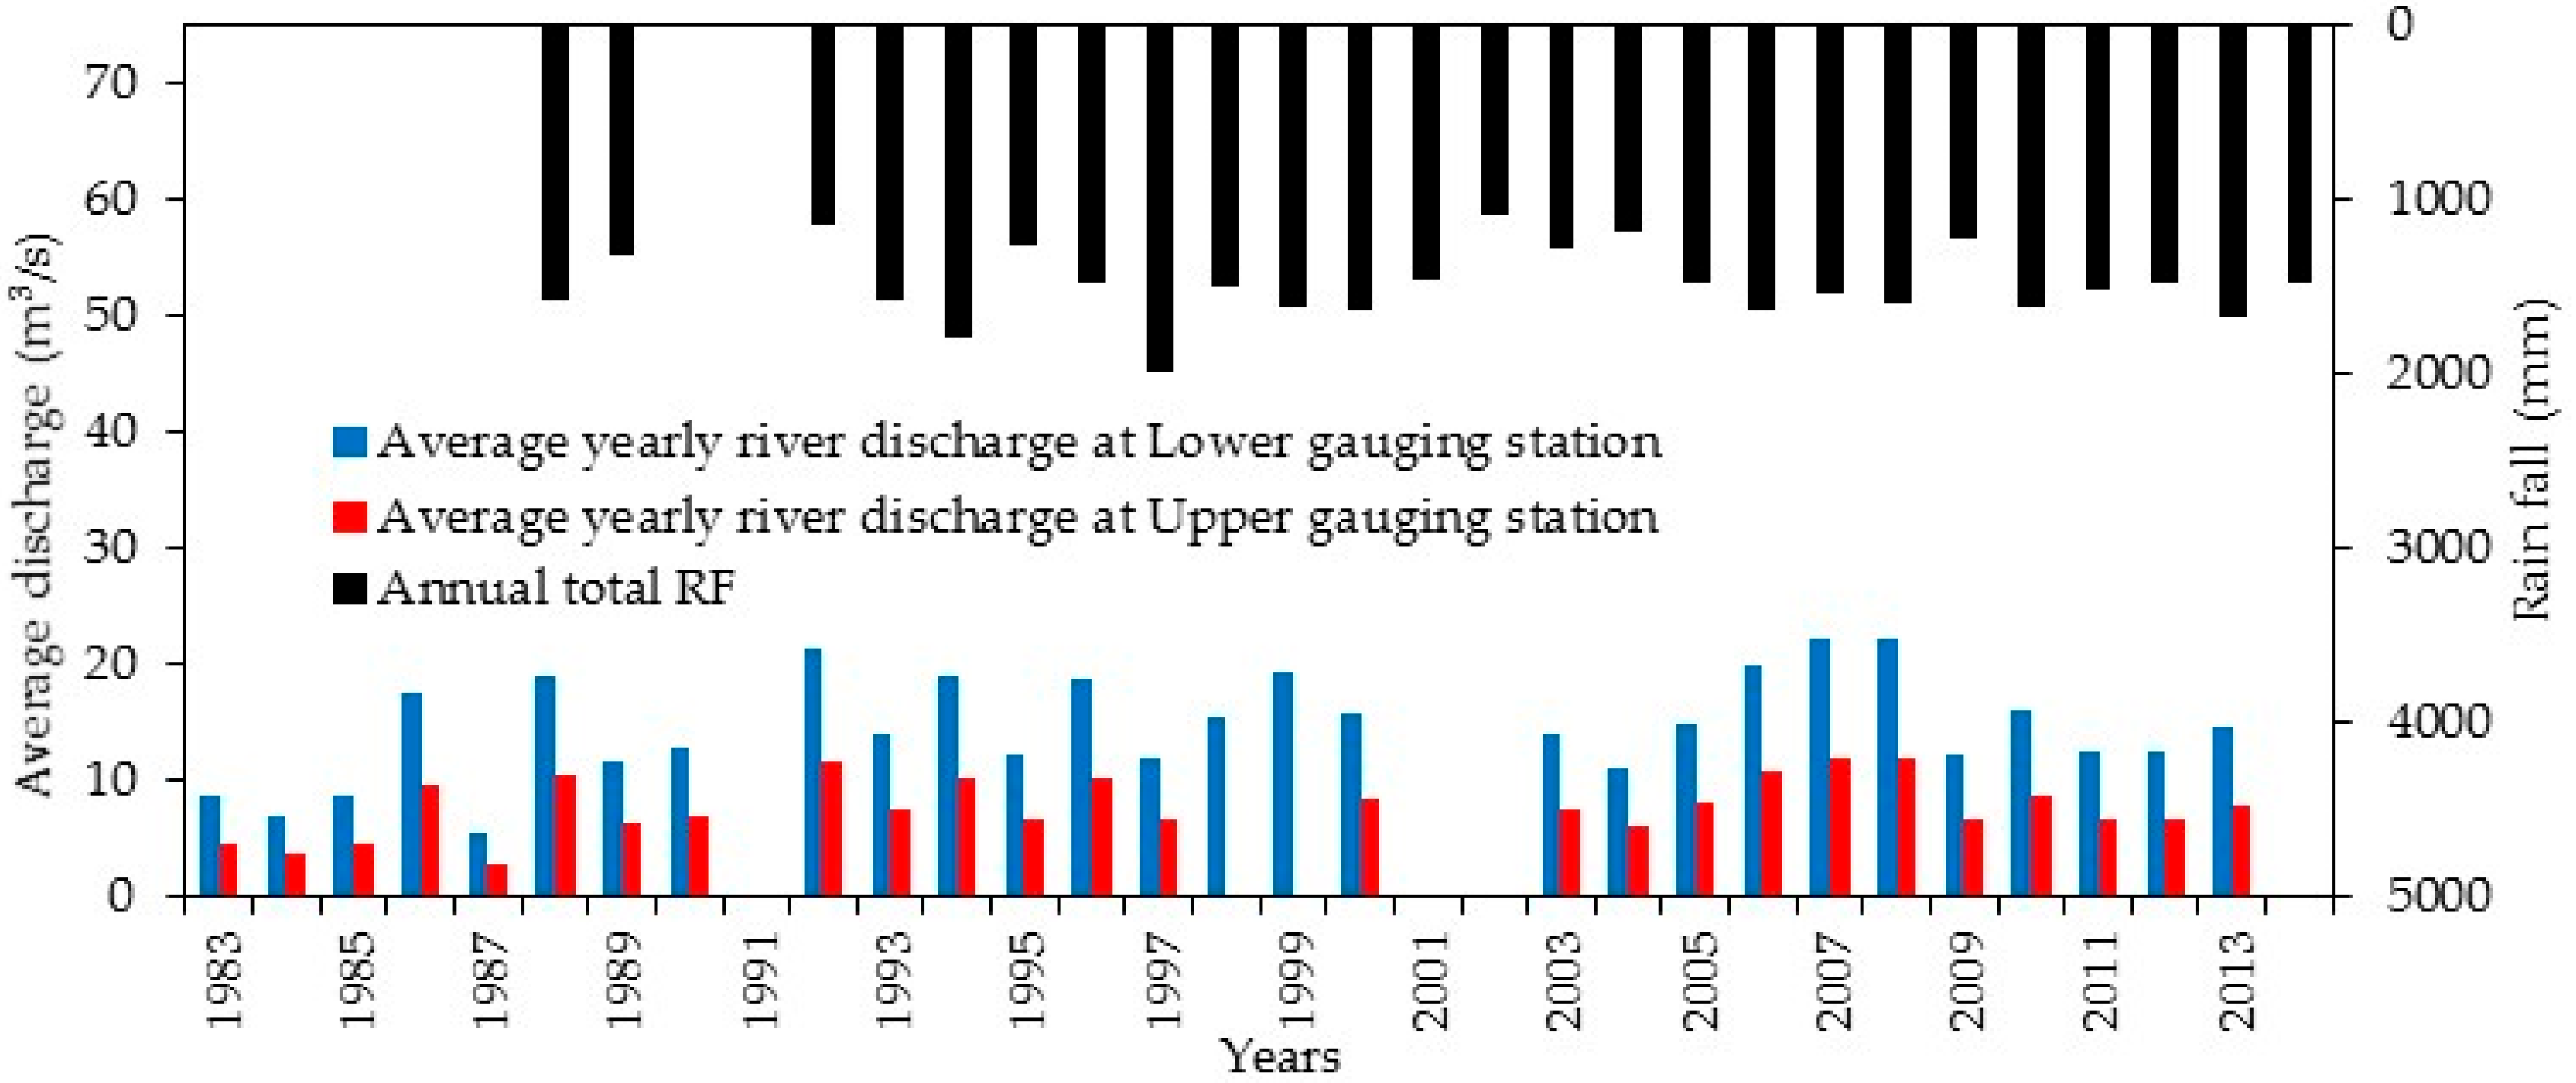
The average annual maximum temperature in the upper part of the Ribb River basin is 27 °C, while the minimum falls below 0 °C in December (Debre Tabor meteorological station). The temperature increases near Lake Tana, where the average annual maximum and minimum values become 35 and 11 °C, respectively (Addis Zemen meteorological station). The Ribb River flow depends mainly on rainfall. The catchment receives a yearly rainfall of 1300 mm (data from the period 1988–2015), of which 80% occurs between the months of June and September. The annual rainfall at Debre Tabor meteorological station, assumed here representative for the Ribb basin, does not show any increasing or decreasing trends in the last three decades (Figure 2), although there are considerable year-to-year variations. Similar results were found by Tekleab et al. [17] for the Upper Blue Nile Basin, Abate et al. [18] for the Gumara River (adjacent to the Ribb) and Tesemma et al. [19] and Hurni et al. [20] for the entire Blue Nile Basin.
The Ribb River has two gauging stations (Figure 1D): the “Lower”, located near the Ribb Bridge (road crossing that connects the cities of Bahir Dar and Gondar) and representing a catchment area of 1592 km2, and the “Upper”, located 3.5 km downstream of the Ribb Dam site and representing a catchment area of 844 km2. The dam site encompasses a catchment area of 715 km2. The average daily discharges at the Lower and Upper gauging stations are 15 m3/s and 8.3 m3/s, respectively. Regular flooding occurs in the area between the Ribb Bridge and the Lake Tana, starting from upstream of the Lower gauging station. Dessie et al. [21] found that the peak flood reduction at the lower gauging station due to floodplain overflow is up to 71%.
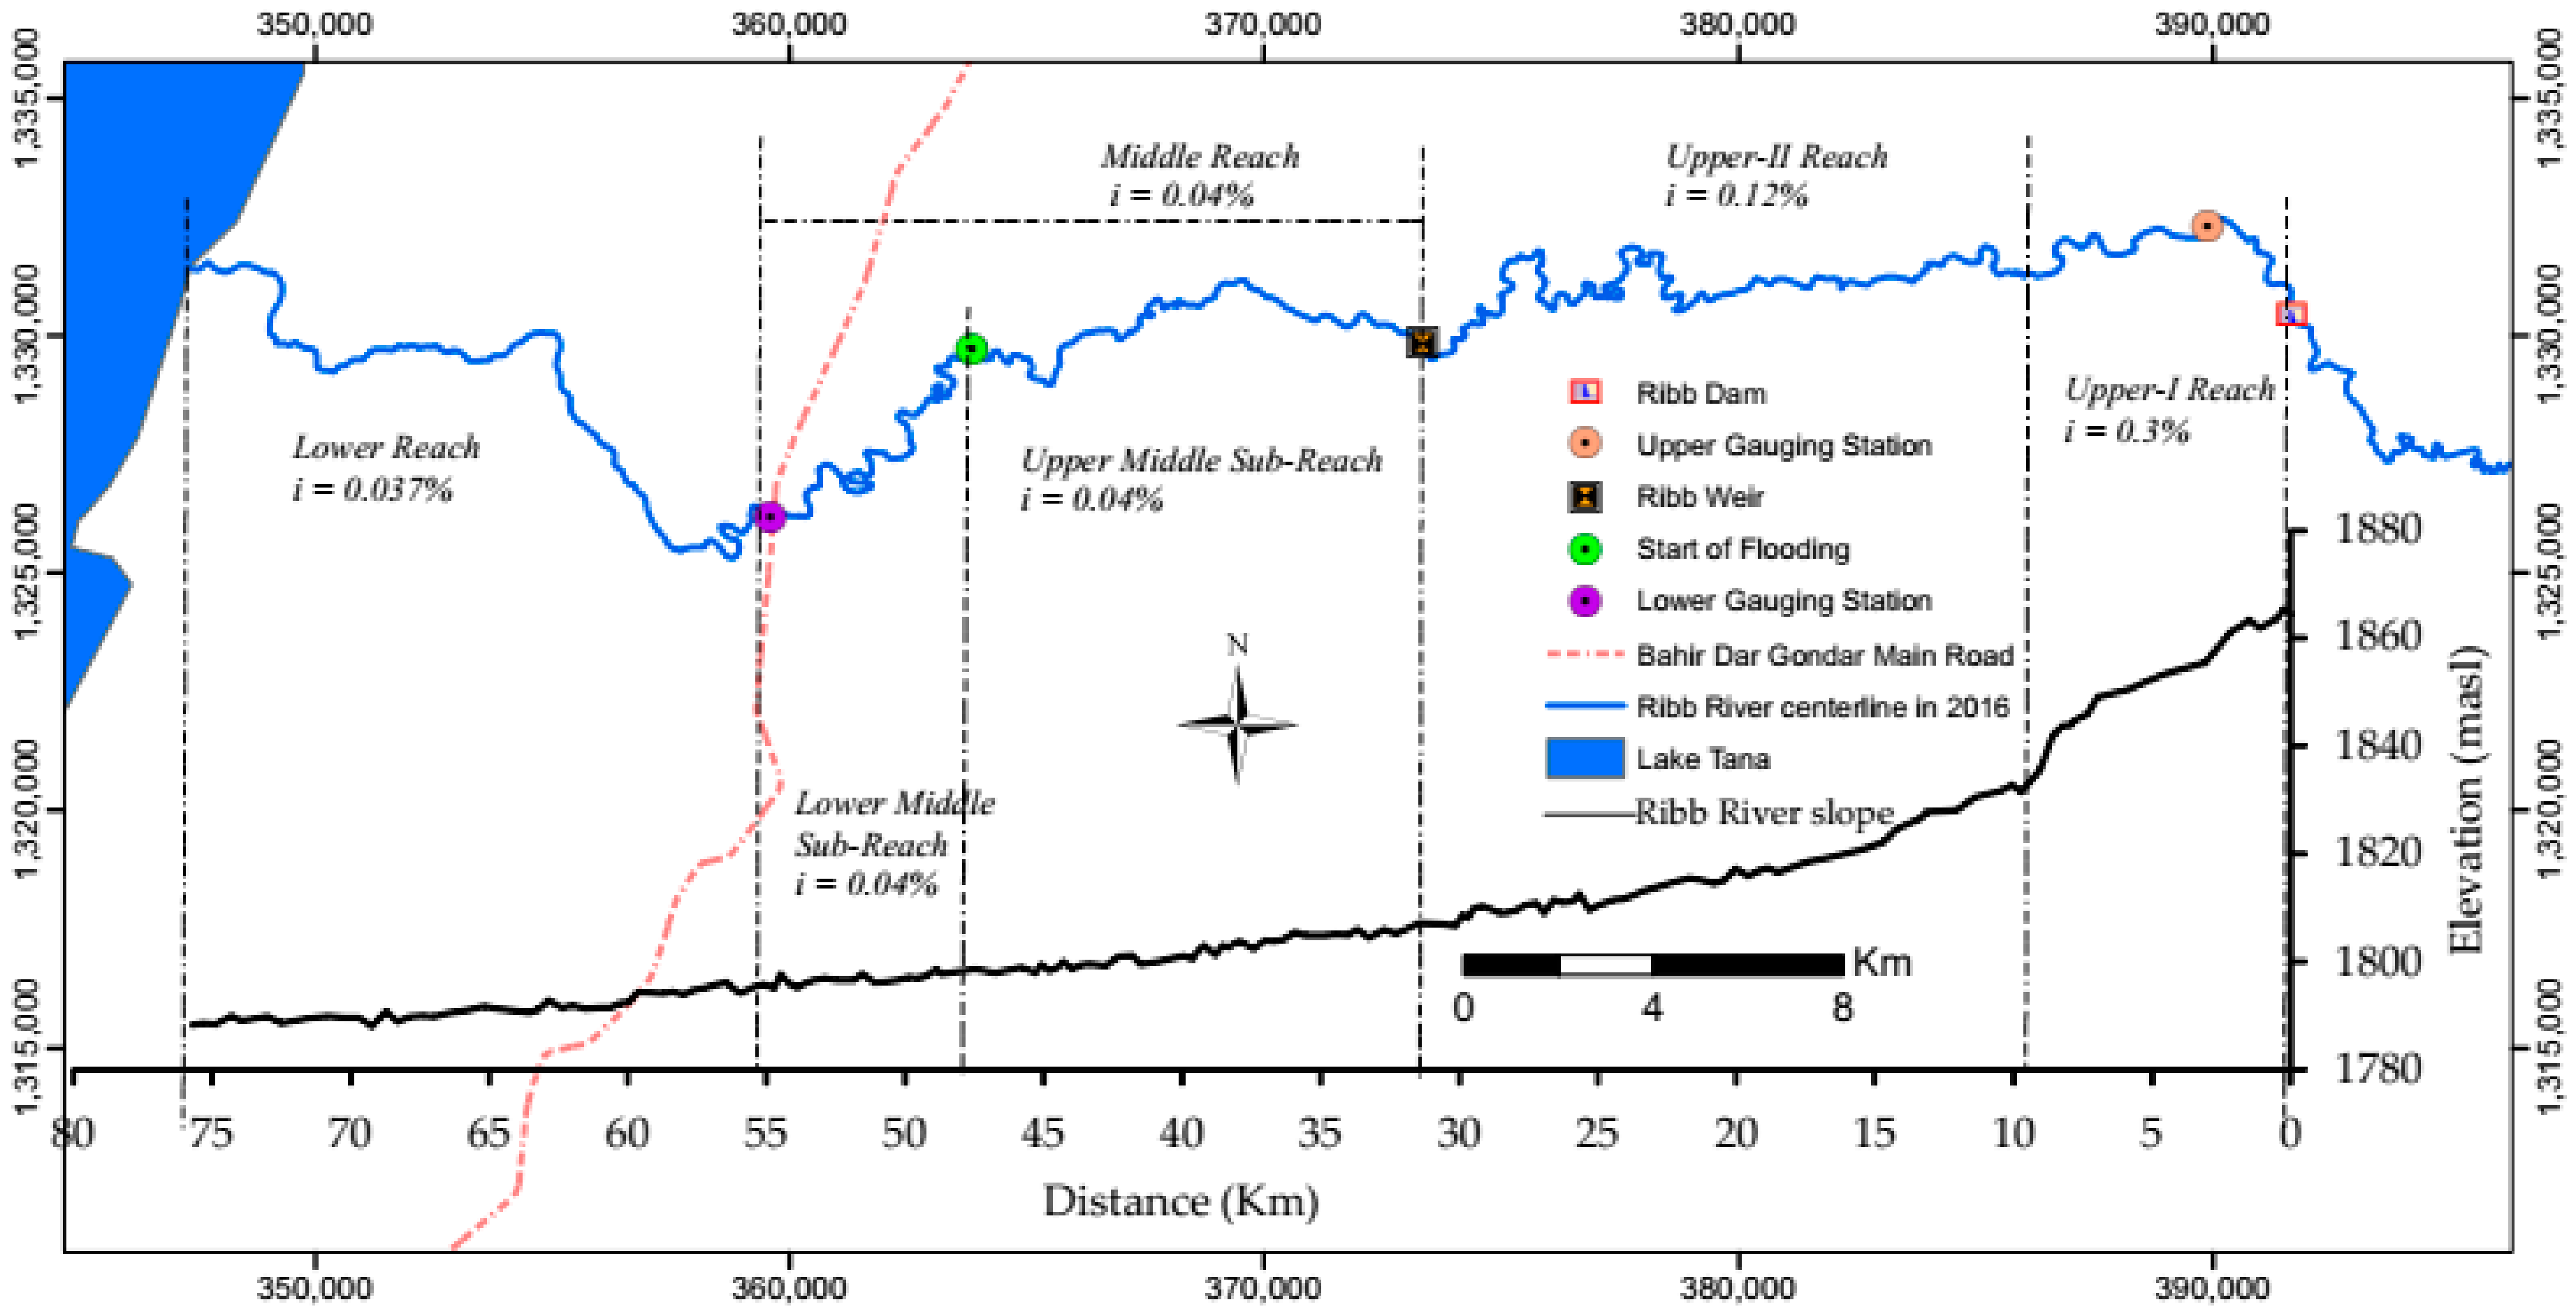
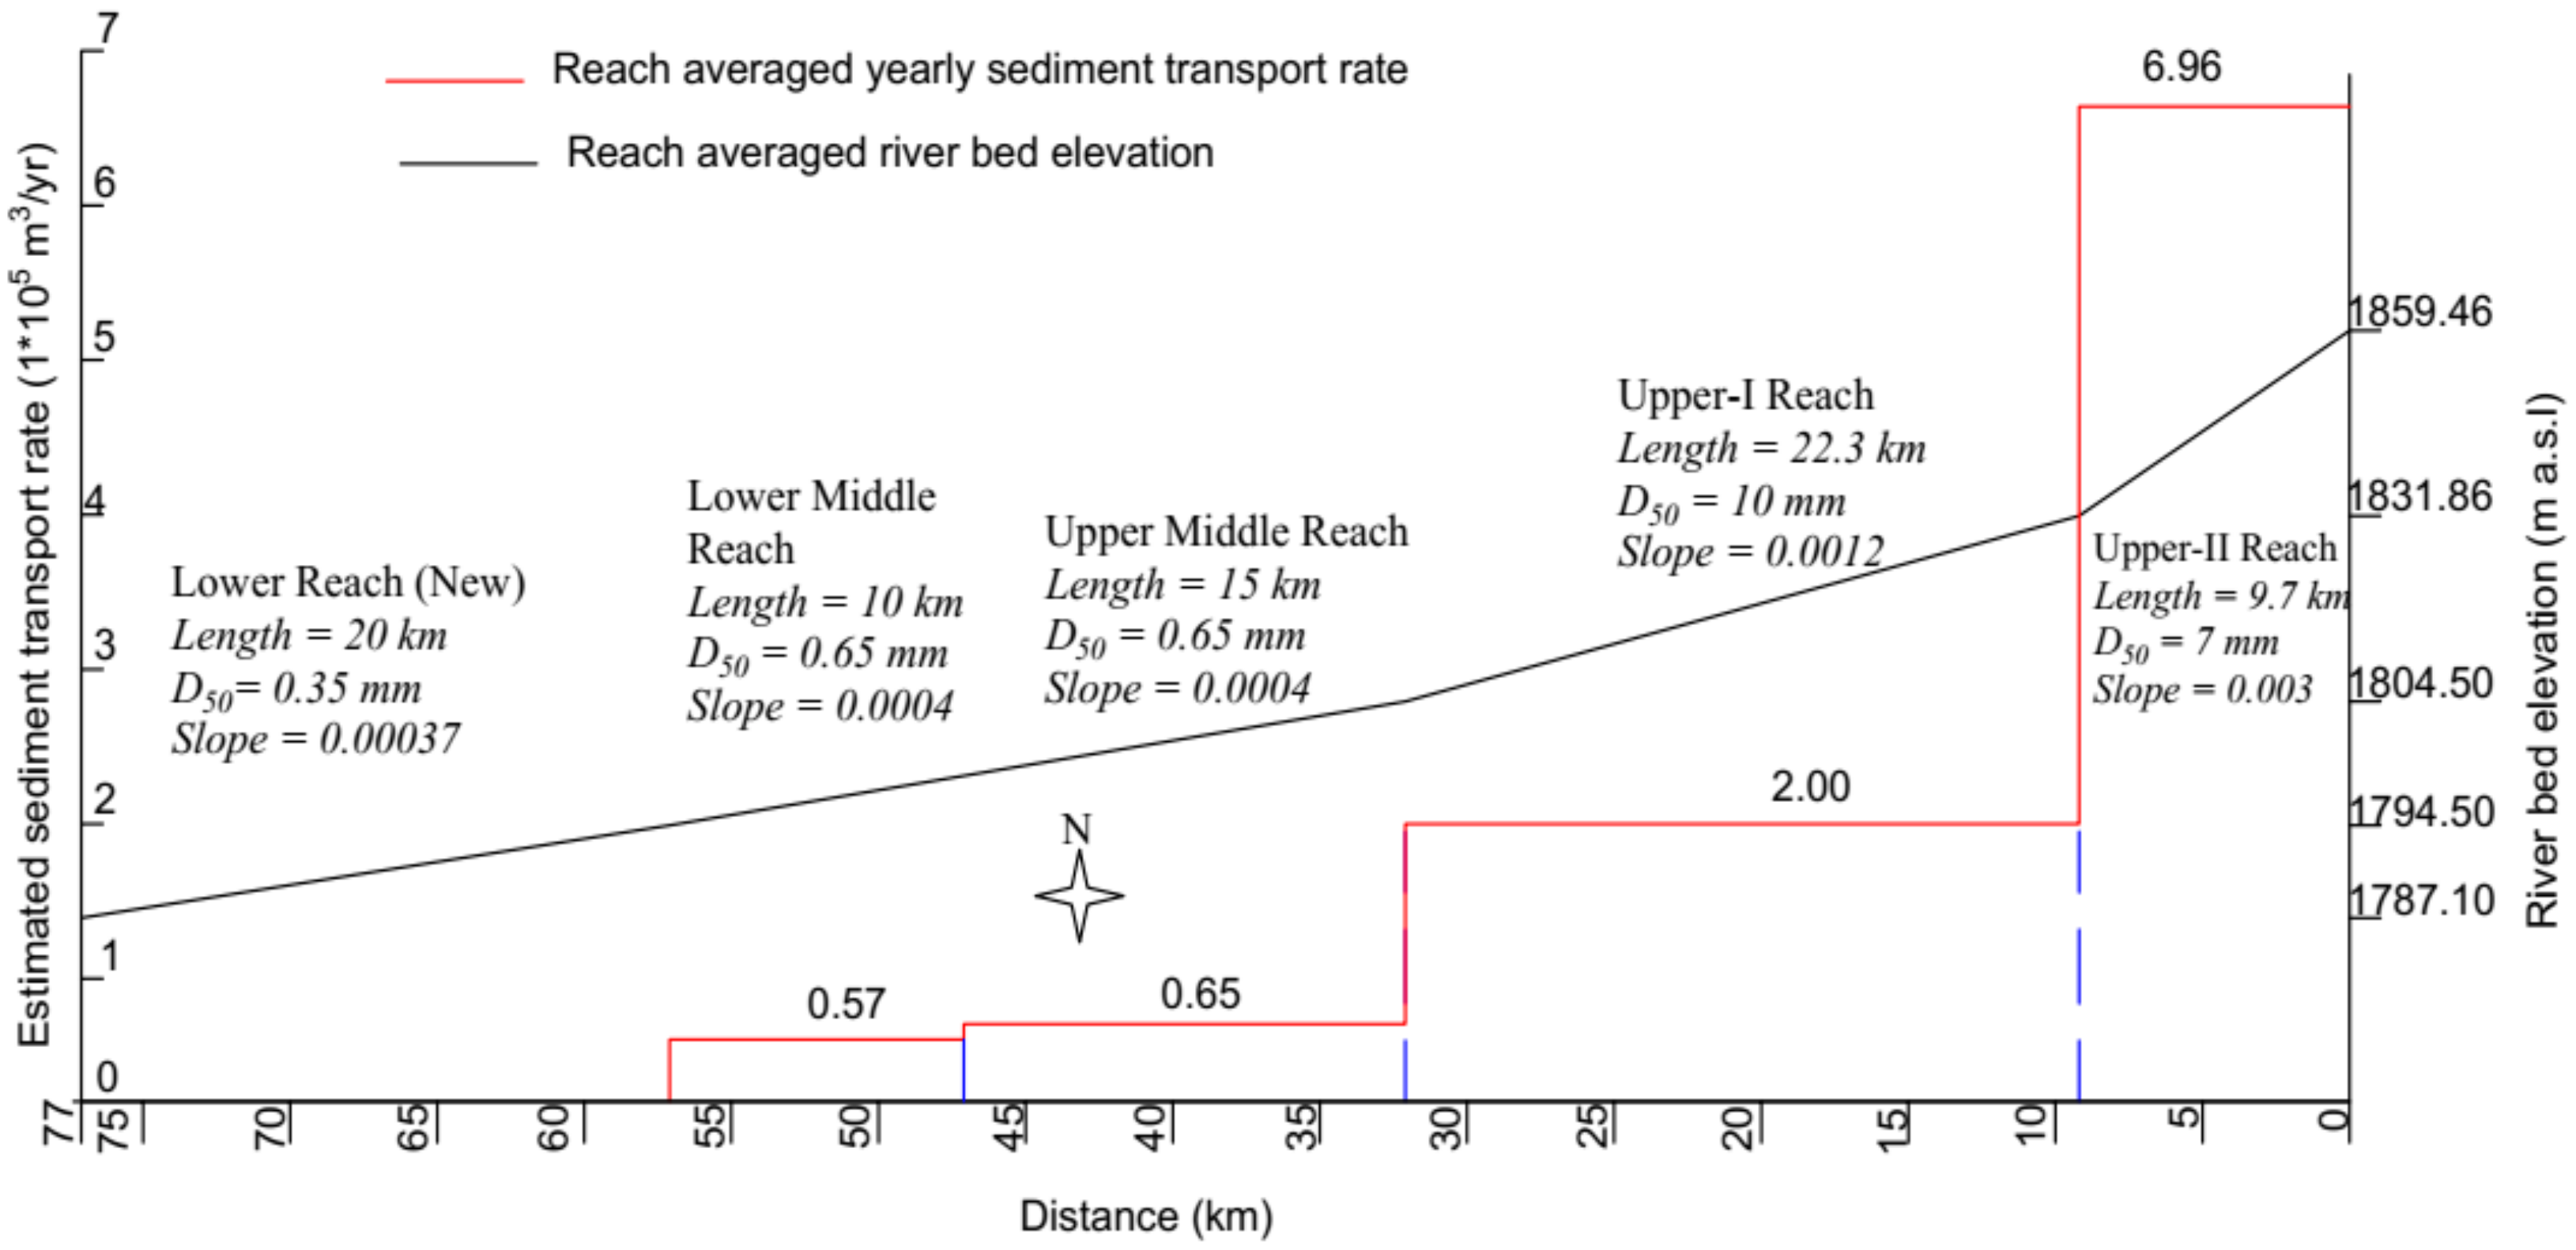
The study river reach has a length of 77 km, starting at the Ribb Dam site to Lake Tana. This reach is here sub-divided into four parts: Upper-I, Upper-II, Middle and Lower reaches (Figure 3). The presence of riverbed fixation (rock outcrops and weir), the junction of major tributaries, the longitudinal slope, the channel width and the presence of anthropogenic interventions (sand mining, embankment construction and water extraction) are the basis of this sub-division.
The Upper-I river reach comprises the first 9.7 km downstream of the dam construction site. In this reach, the river passes through a moderately deep gorge where the banks rise steeply. The reach-averaged river width and slope are 65 m and 0.3%, respectively. In the first 8.5 km, the riverbed is gravel-dominated, whereas numerous rock outcrops are present in the last 1.2 km. An old bridge crosses the river 4.25 km downstream of the dam site, whereas currently a new bridge is under-construction.
The Upper-II reach comprises 22.3 km, from the end of the rock escarpment to the weir construction site, and has a much milder slope of 0.12%. The river channel is here characterized by a meandering planform experiencing little bank erosion and accretion. The alluvial riverbed is dominated by a mixture of sand and gravel. In particular, gravel dominates the outer side of sharp bends. Further downstream, the gravel component reduces and the riverbed becomes sand-dominated. The river banks in the Upper-II reach are dominated by sandyclay soil deposit formations and show hard rocks at some locations.
After the construction of the Ribb Dam, the Upper-I and II reaches of the river will convey a strongly regulated water discharge to the weir site, from where two irrigation canals will depart. In the dry season, the flow rate will include the discharge meant for irrigation plus an environmental flow for the downstream reaches [22]. The water released from the dam will be relatively clear of sediment as most of the sediments will be stored inside the reservoir [14], and, for this reason, degradation may be expected in the alluvial parts of the reaches to attain its carrying capacity.
The Middle reach (sub-divided in Upper Middle and Lower Middle) is 25 km long, from the weir site to the Ribb Bridge (Figure 3). The reach is sub-divided based on the existence of embankments for flood protection. The Upper Middle sub-reach is 15 km long and extends from the weir site to the start of the embankment, while the Lower Middle sub-reach forms the remaining 10 km where embankments are present. This part of the reach experiences flooding due to reduced channel conveyance capacity [23]. The Middle reaches have a relatively gentle slope of 0.04% and a sandy bed.
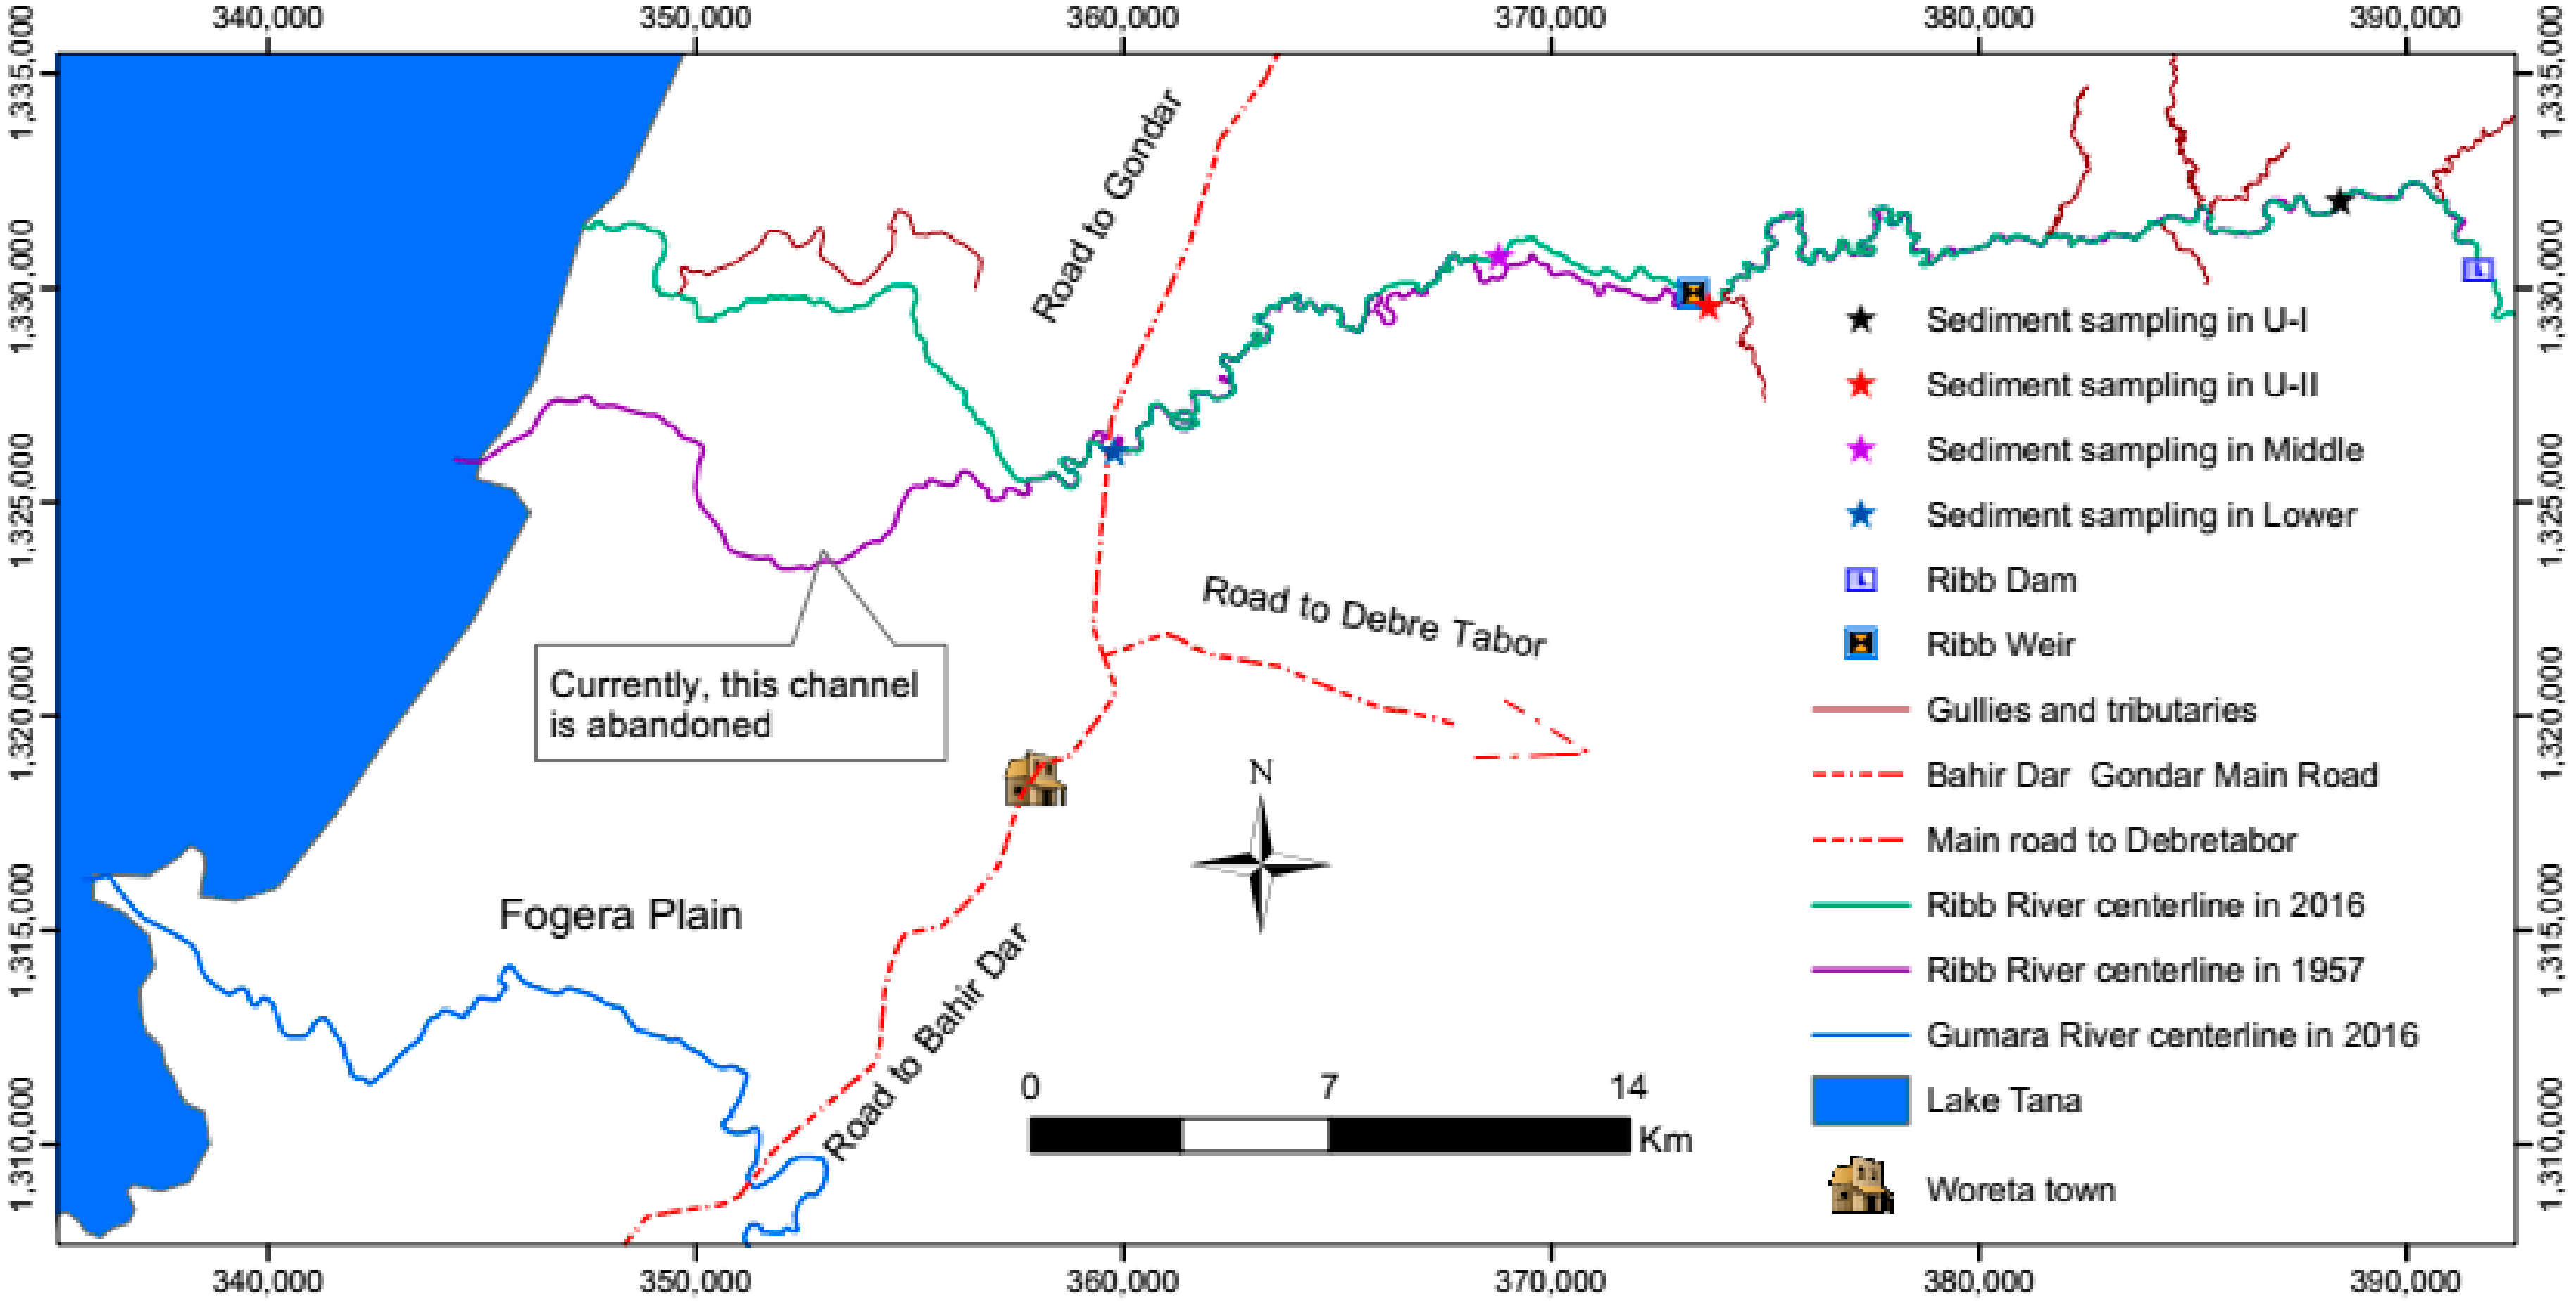
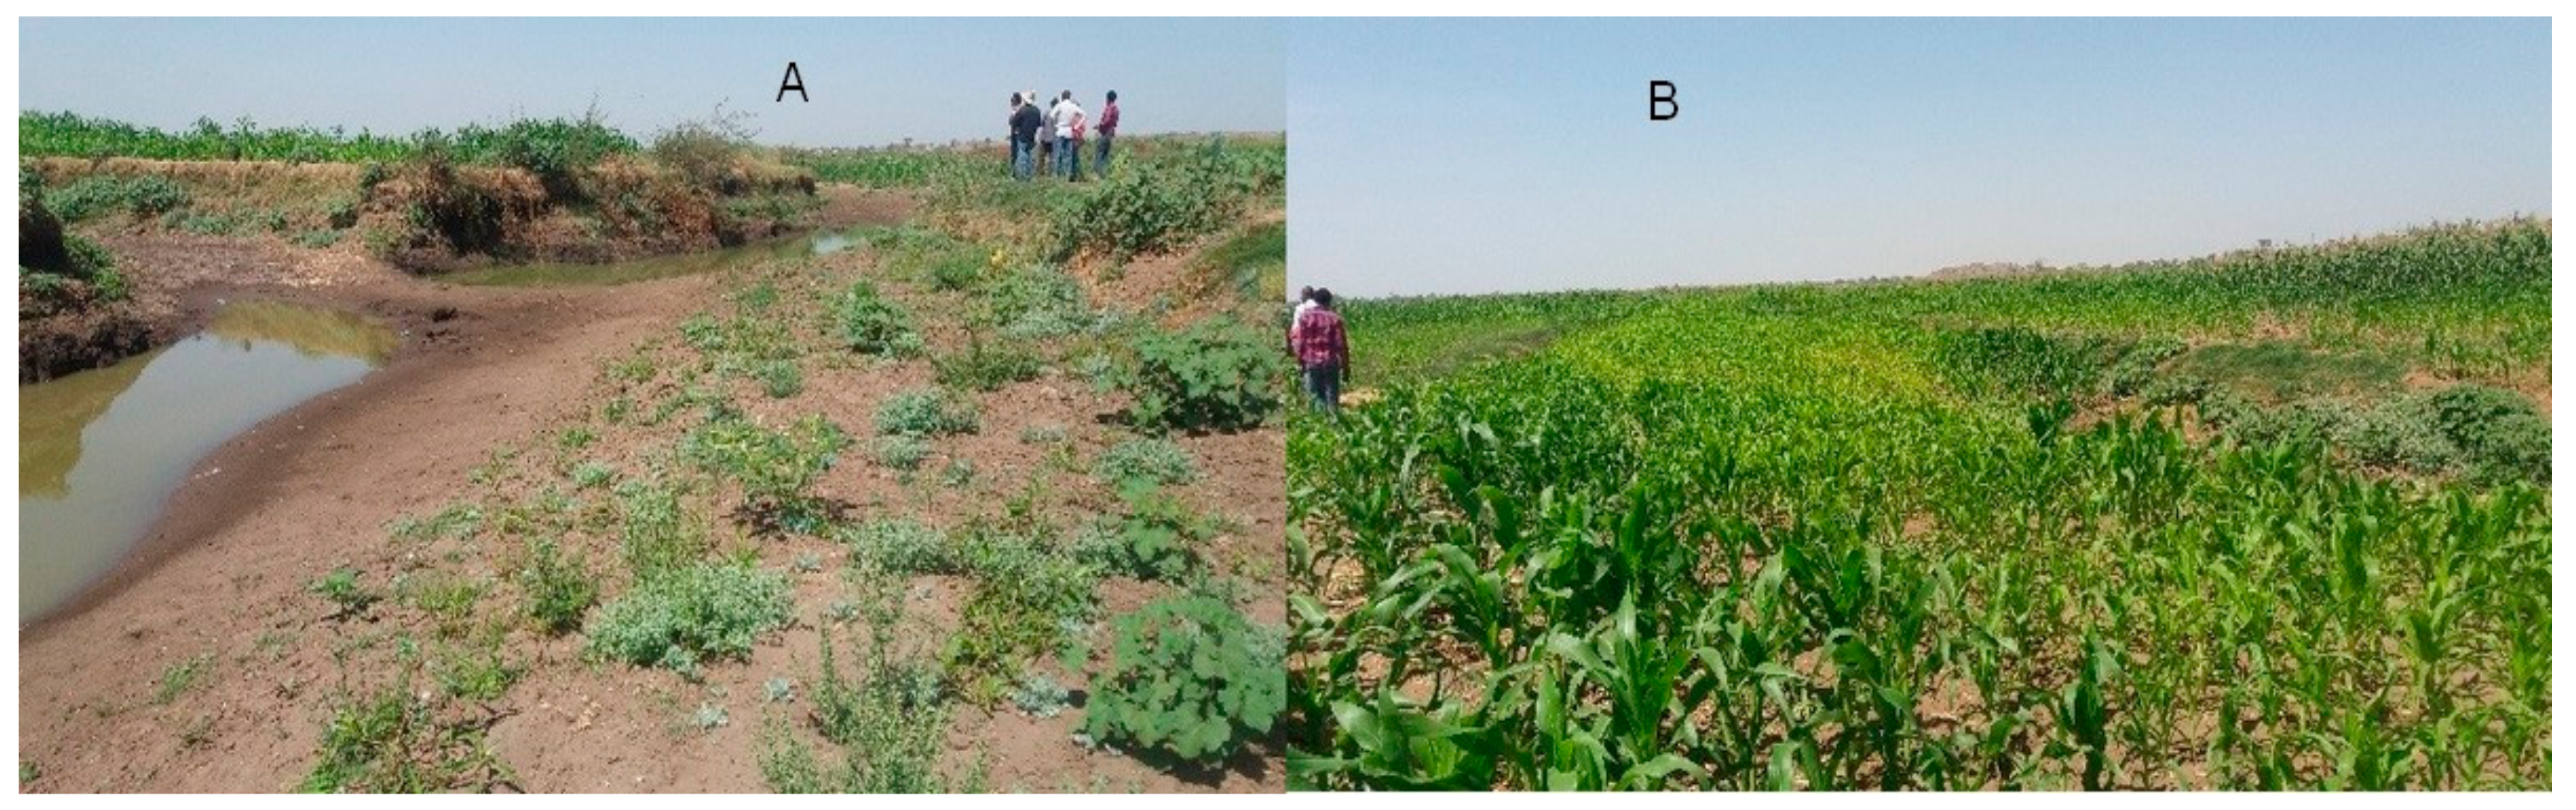
The Lower reach is 20 km long, from the Ribb Bridge to Lake Tana. In the past, the river used to bifurcate 4 km downstream of the bridge (Figure 4). Since 2008, the old left channel has been completely silted up and serves as a dry-weather road. During flow peaks, however, the silted channel still conveys a small part of the flow to Lake Tana. Further downstream, the river loses its channel for a distance of 3.5 km (i.e., from 70.2 to 73.7 km from the Ribb Dam). Here, high-flow water spreads over the floodplain until it finds a well-defined channel again near a locality called Boled Gote. Farmers plant maize in the shallow river channel during the dry season, taking advantage of residual moisture (Figure 5). The river banks in the Middle and Lower reaches are made of compacted clay and silt materials.
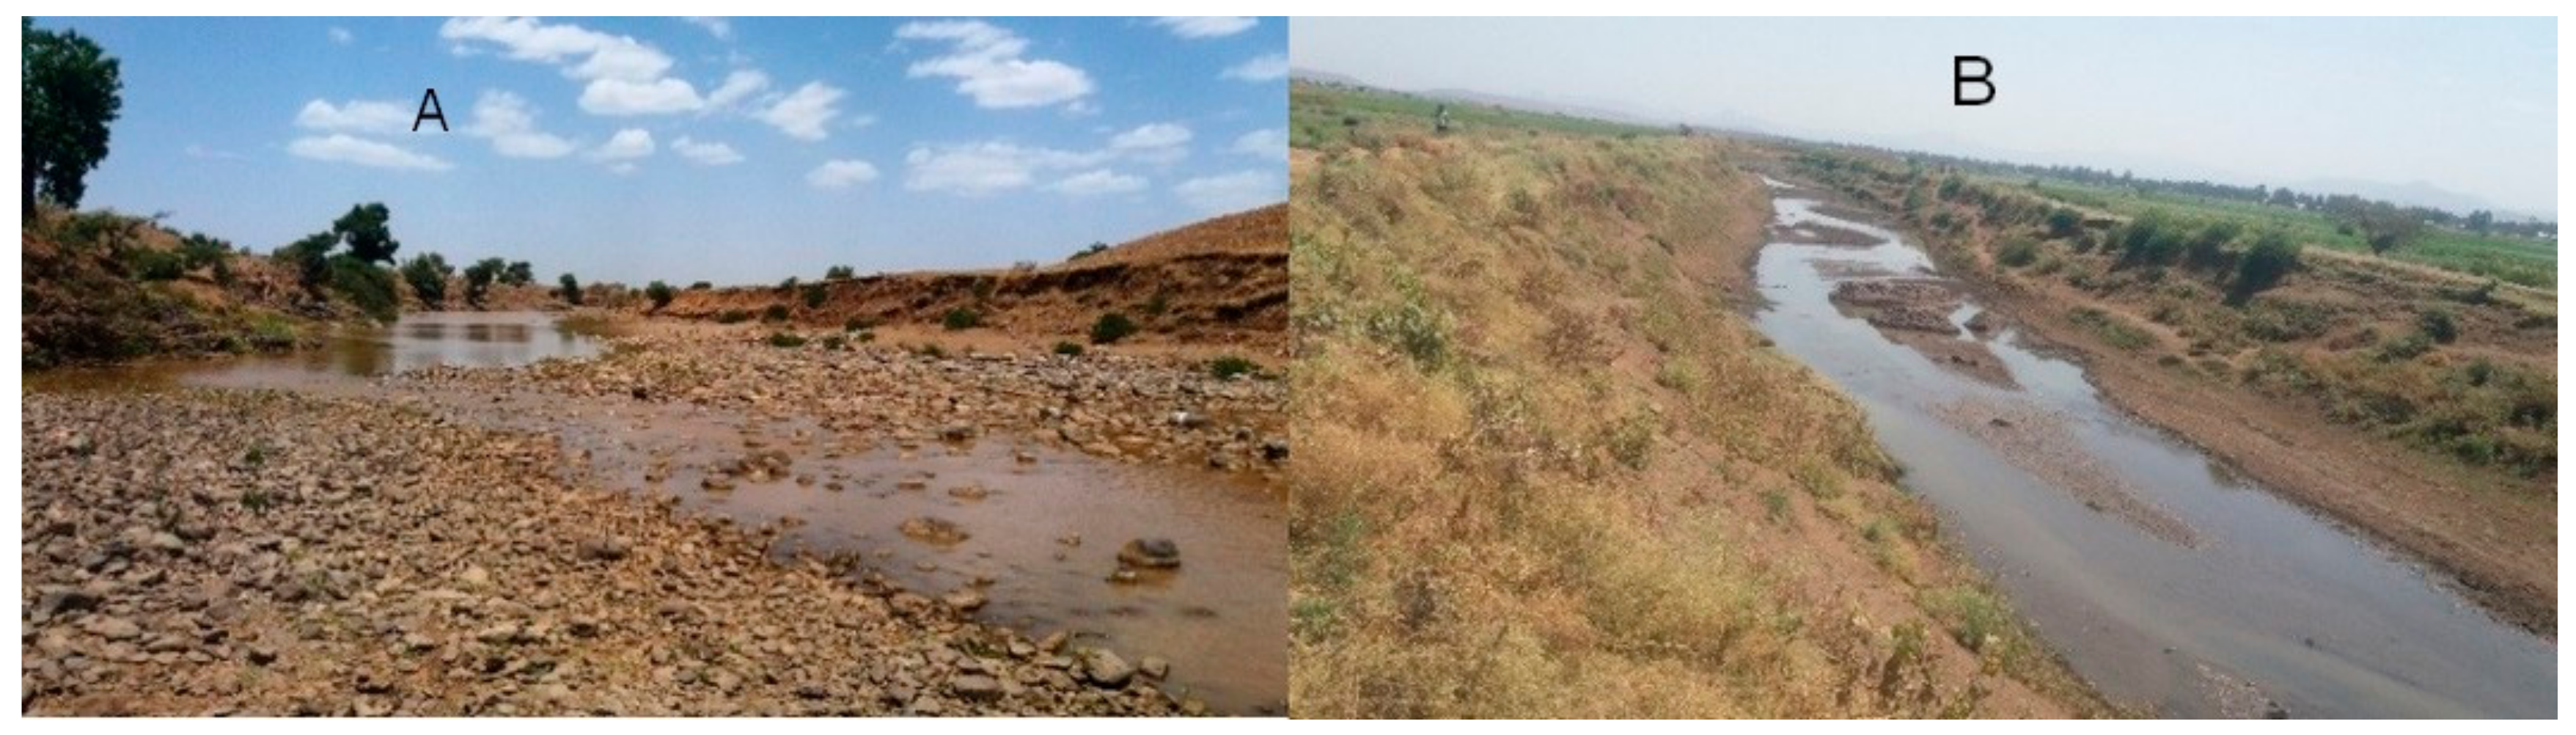
The Ribb River channel has a meandering planform with sporadic central bars in the Upper-I reach where the channel is wider. Point bars inside river bends and alternate bars are observed in the Upper-II, Middle and Lower River reaches. Figure 6 shows the riverbed and banks in the Upper-I reach and Lower Middle sub-reach.
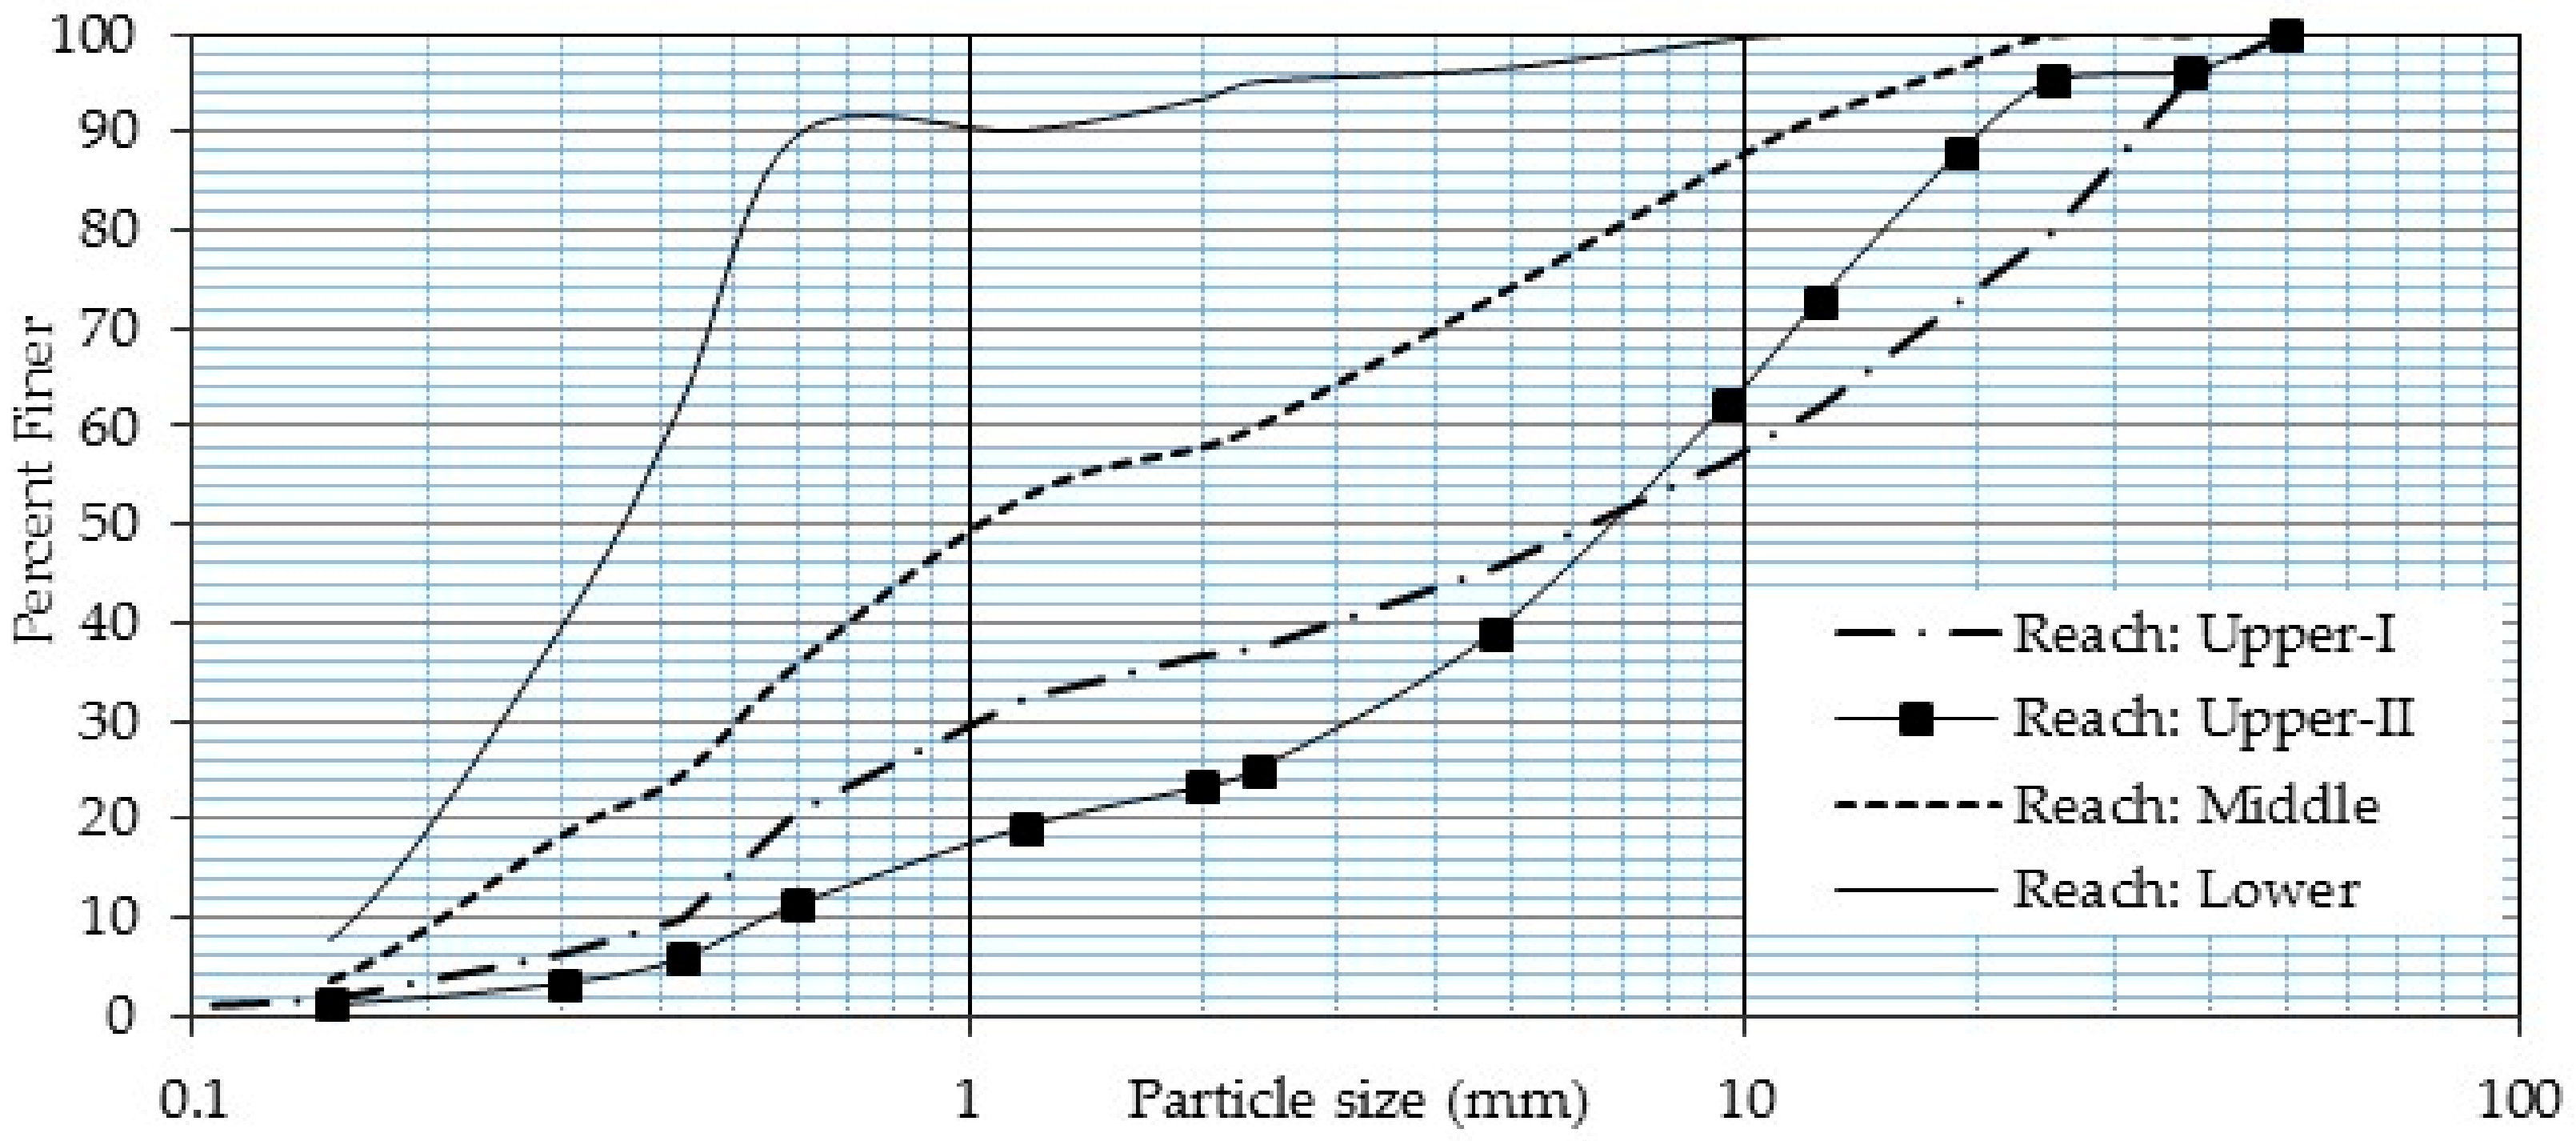
The granulometric curves of the bed material (Figure 7) show that the Ribb River sediment becomes finer in the downstream direction [13,24].
The riverbed near the dam site is dominated by a mixture of gravel (65%) and sand (35%). The bed material gradually changes to sand near the weir site (60% sand and 40% gravel). Further downstream, the riverbed is composed of 90% sand. The median grain size, D50, is 7 mm in the Upper I and Upper II reaches and decreases to 0.65 mm in the Middle (the Upper and the Lower) reaches and 0.35 mm in the Lower reaches. Historical data on sediment grain size are lacking and this does not allow for assessing their temporal evolution.
2.2. Anthropogenic Aspects
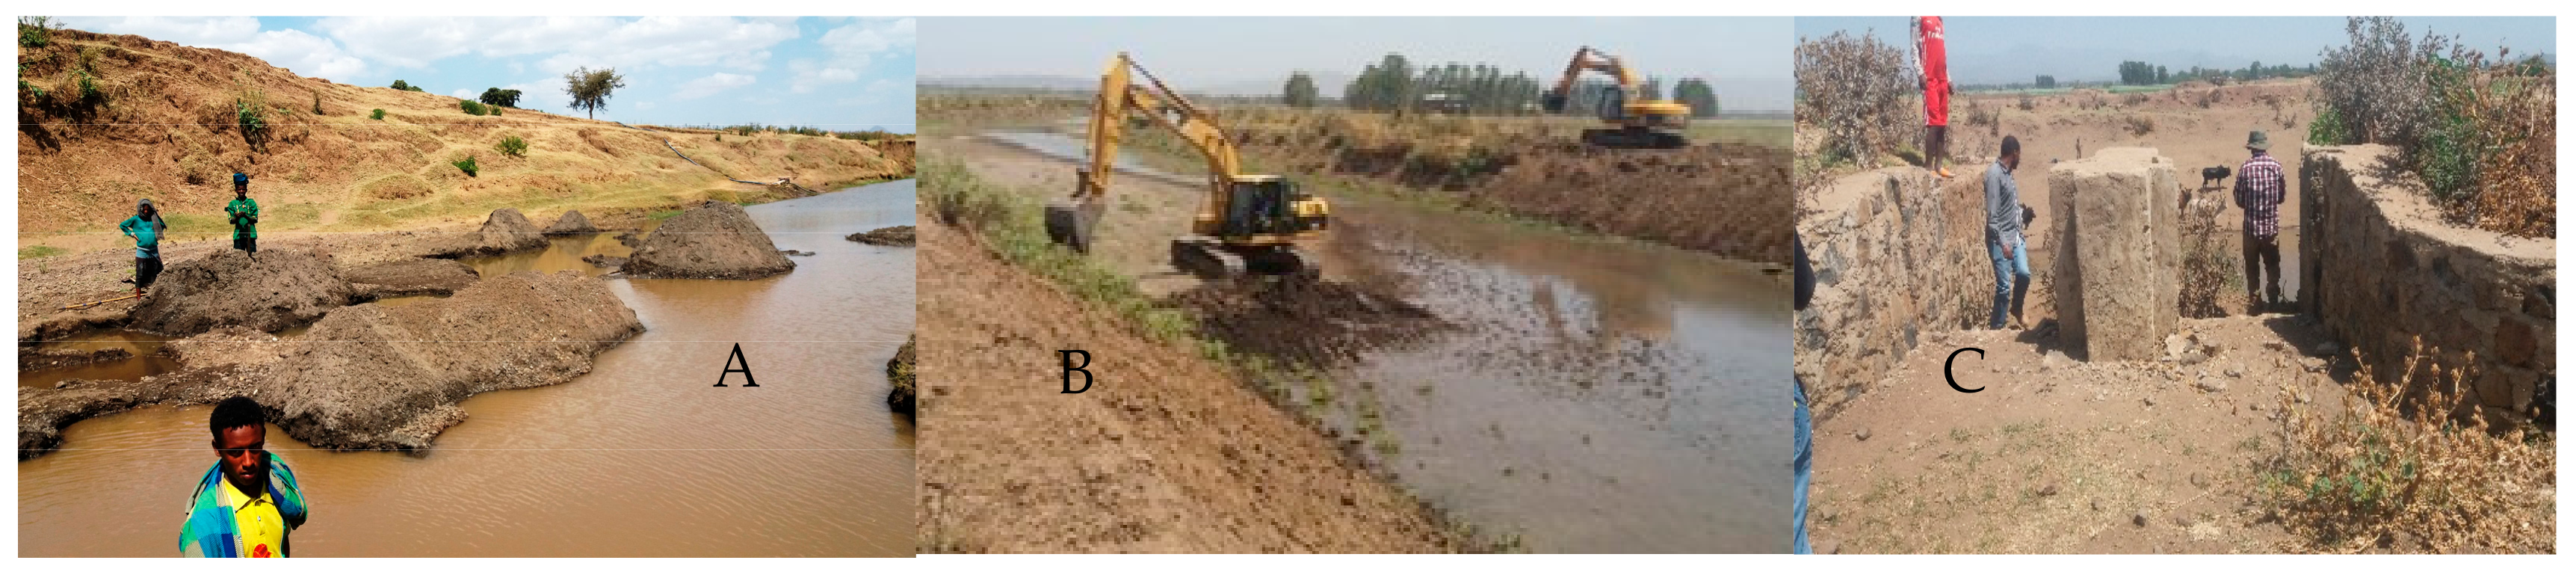
Overbank flow occurs almost yearly, starting near the Ribb Bridge [23]. Floods in this area have caused the loss of human lives, displaced people from their homes, swept agricultural lands, and adversely affected health centers, schools and water points [25]. The flooding of the Fogera Plain has been aggravated in the last decades by: (1) backwaters from Lake Tana [26], which has been regulated for hydropower production since 1995; and (2) additional water input from the Gumara River, which shares the Fogera Plain with the Ribb River [27], see Figure 4. The extent of flooding has recently increased with time due to reduced channel capacity by sedimentation. Embankments are being constructed along the Ribb River since the major 2006 event to reduce flooding in the lower reaches, although a permanent solution is in progress via the Ribb Dam. A 15 km long embankment was constructed in 2016 (8 km upstream of the bridge and 7 km downstream of the bridge). Another 7 km long embankment, starting from 7 km downstream of the Ribb Bridge, is planned. The embankments are built on bank tops without any setback distance, which increases the risk of bank failure, although there is an attempt to protect river banks at bends with gabions. In addition, channel enlargement and deepening has taken place at shallow and narrow sections to increase the flow conveyance (Figure 8B). To facilitate the release of floodwater to farmland for agricultural use, outlet structures have been constructed as low height weirs controlled by gates at selected locations (Figure 8C). However, the release of high velocity floodwater creates deep gullies unless corrective measures are taken. Farmers also excavate trenches over the embankment to reduce the length of their pump hose and suction head to extract water for dry time irrigation, which may cause breaching during high flows.
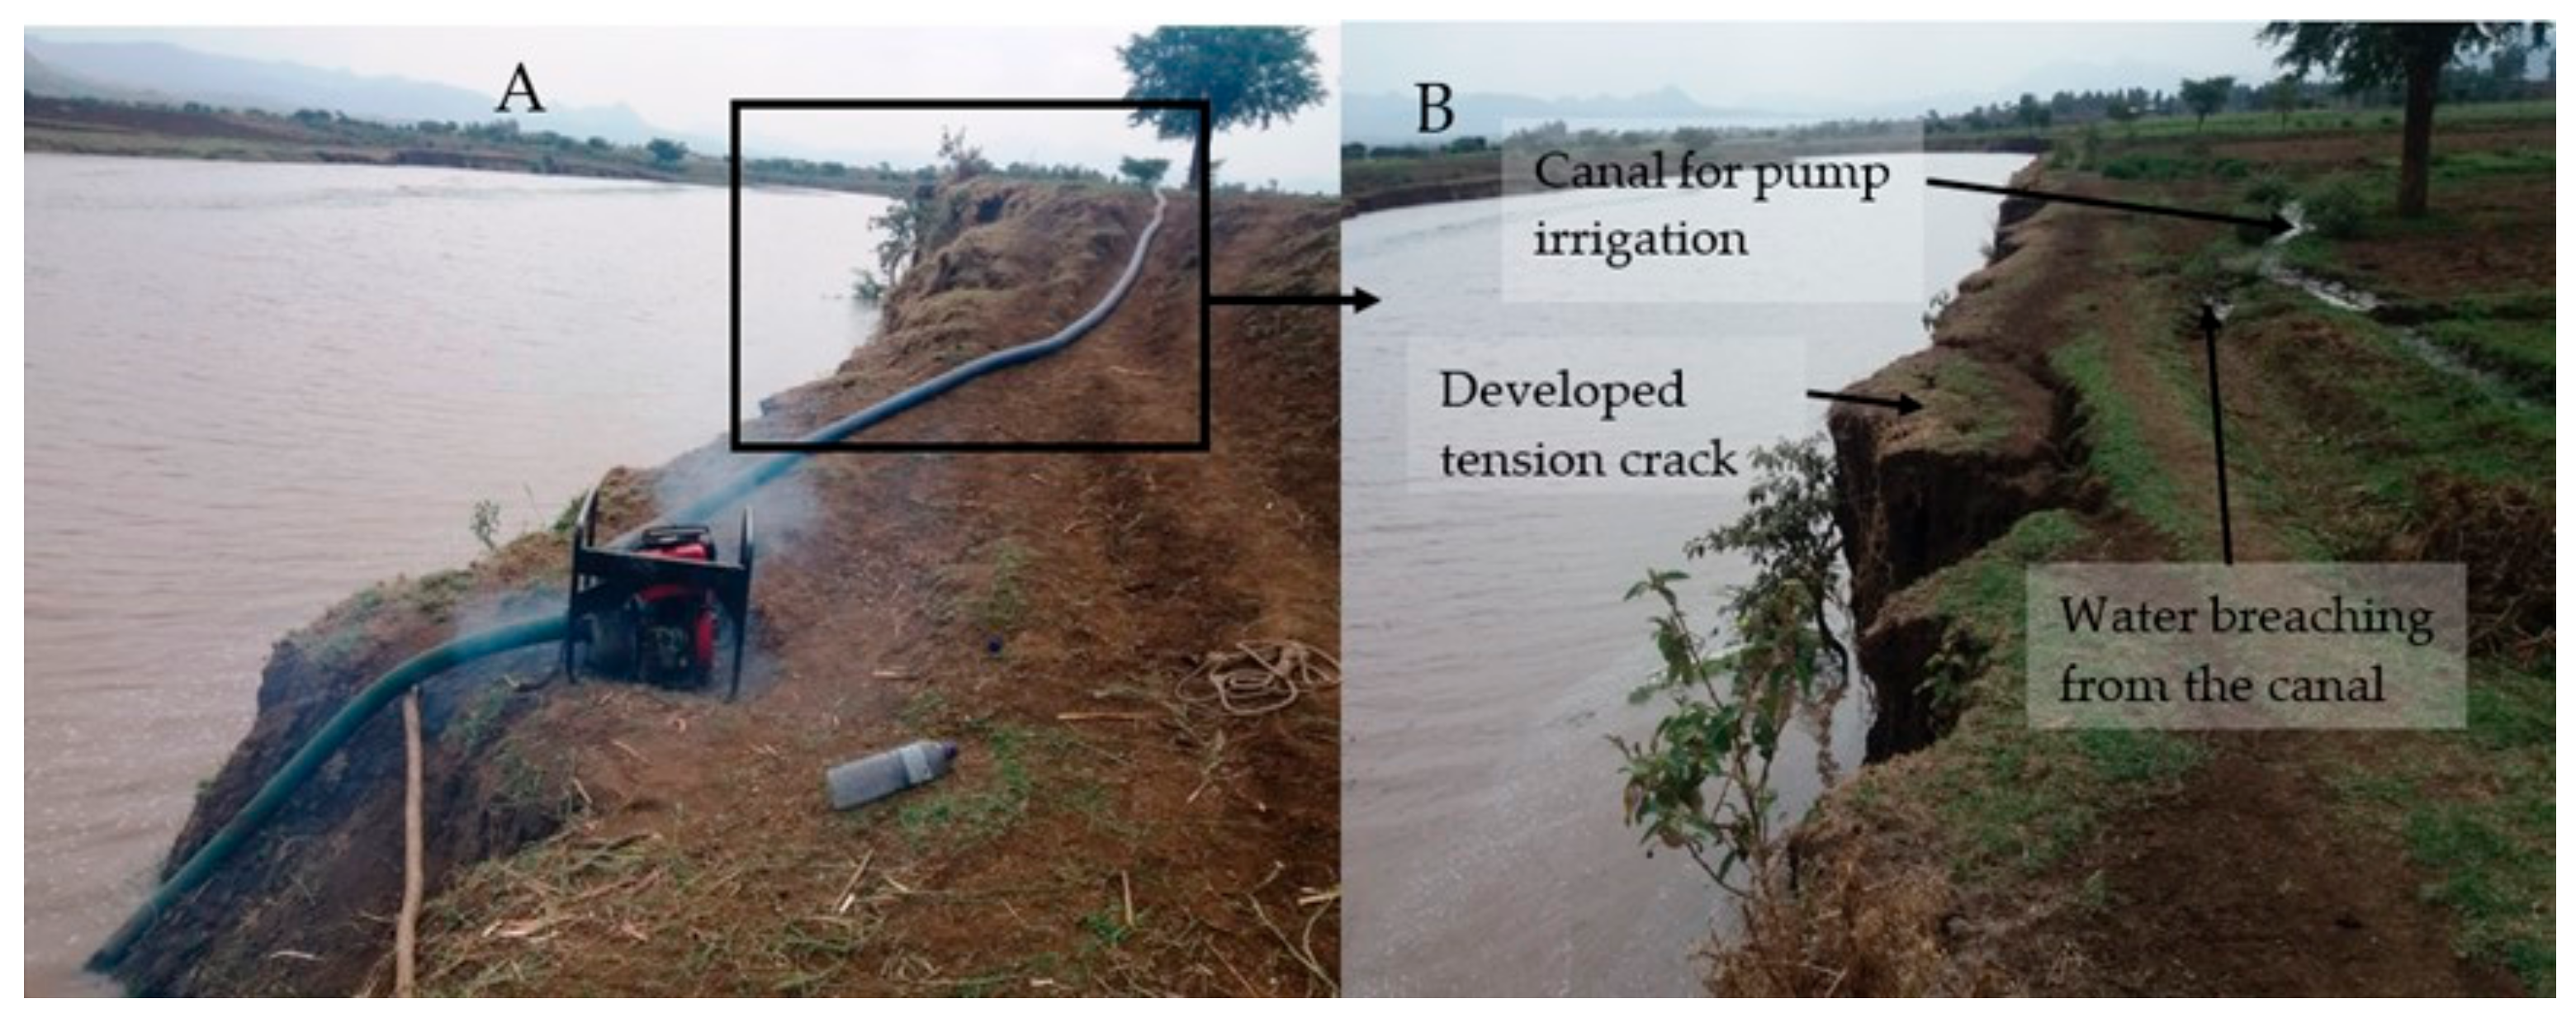
The Ribb River has been subject to long years of sand mining (Figure 8A) and water extraction for irrigation during the dry season (Figure 9A). The prolonged sand mining activity in the Middle and Lower River reaches has clearly affected the natural riverbed topography. Sand miners extract sand from bar tops during low flow conditions, altering the shape and height of sand bars, as well as the sediment balance of the river. This activity has steadily increased in the last 30 years.
In the Lower reach, intensive water pumping and a prolonged dry season occasionally result in complete drying of the river. The irrigation water may return to the river system as seepage through cracks in the soil, thereby wetting up the streambank materials. This could contribute to destabilization of the streambanks, as shown in Figure 9B, where a block of soil is about to fall in the river. Failed material accumulates at the bank toe. This material may be either transported downstream during high flows or become stabilized by the growth of vegetation during low flows.
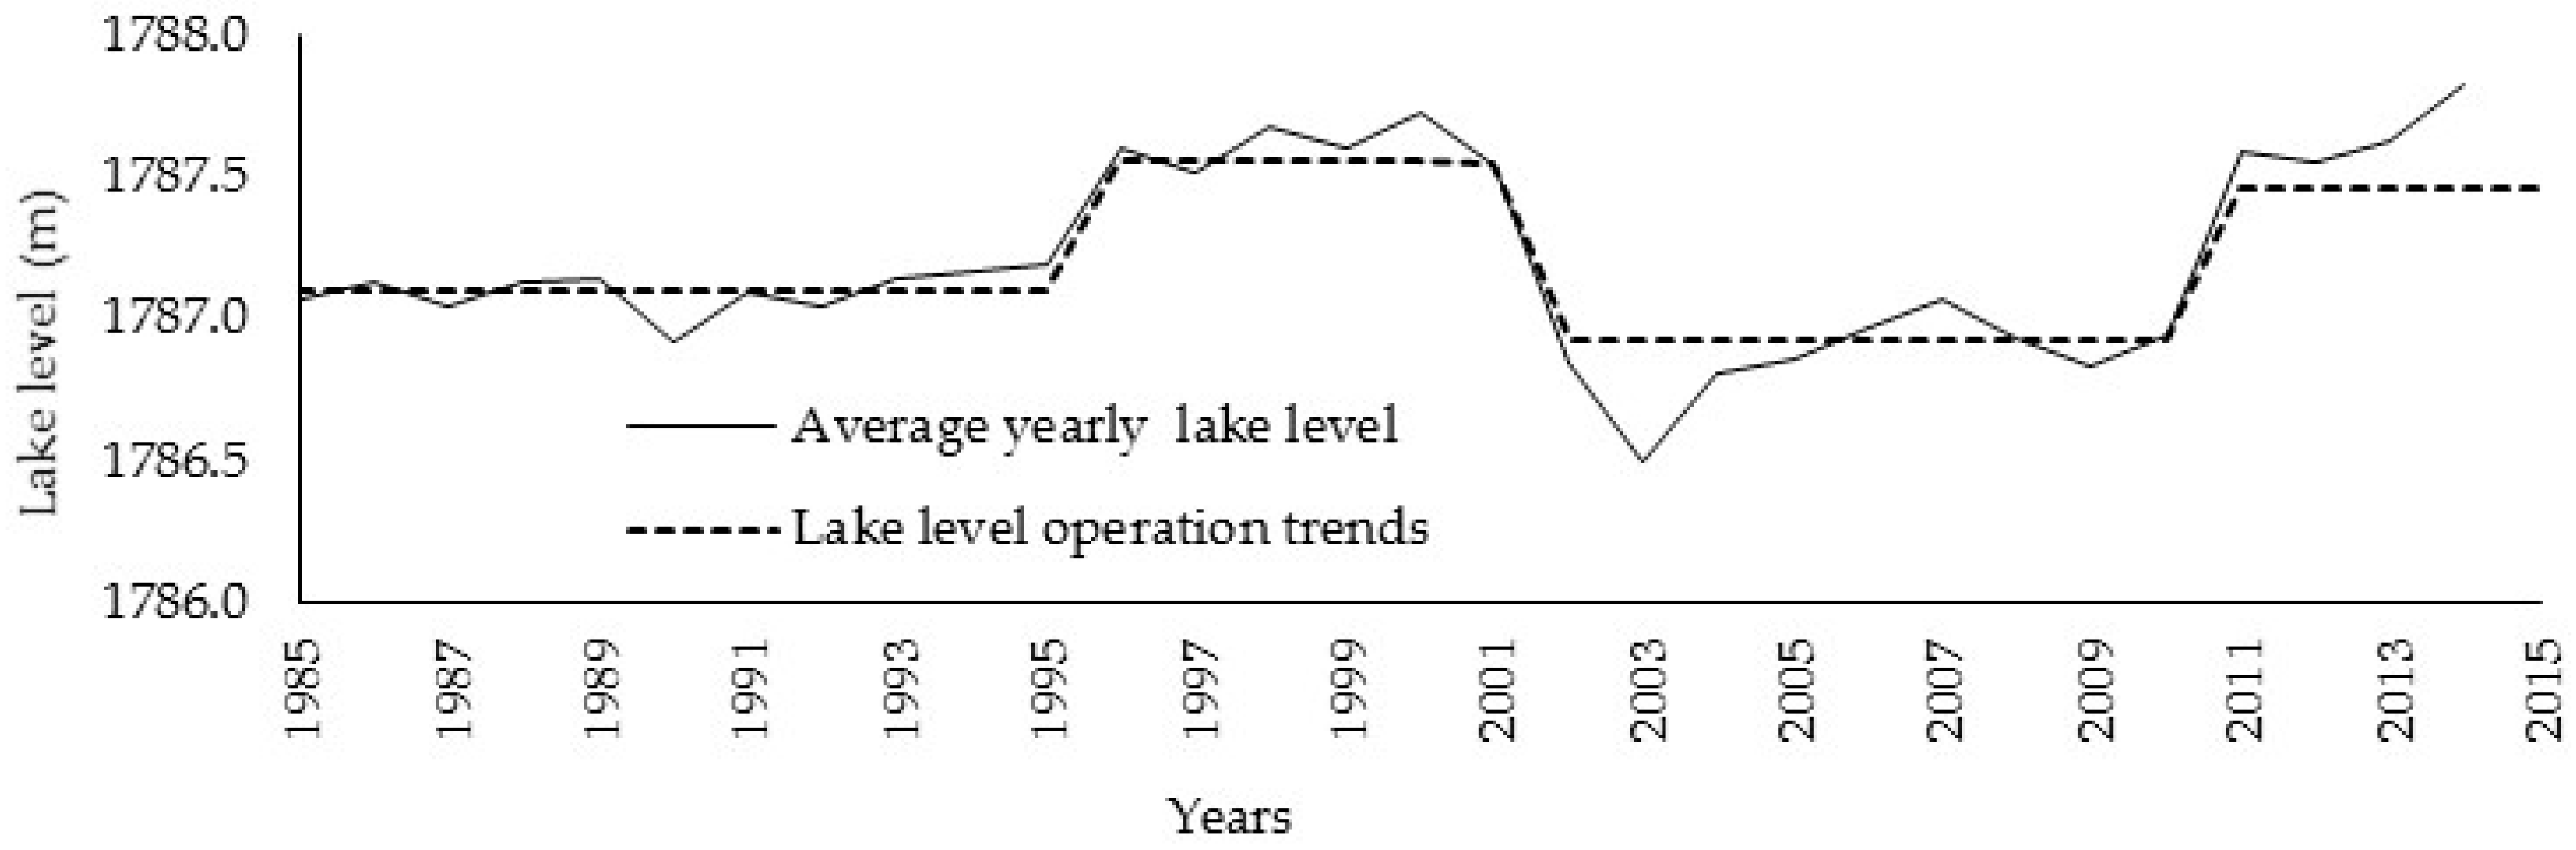
The Ribb River debouches in Lake Tana, which had a regulated level for hydropower production since 1995. It shows three distinct operation periods: (1) a rise by 45 cm in the period 1995–2001, (2) a drop by 53 cm in the period 2001–2010, and (3) a rise by 62 cm in the period 2010–2015 (Figure 10). Increased flooding and the recent channel avulsion of 2008 have been often attributed to past lake level regulation.
3. Materials and Methods
This study aims at describing the current state and morphodynamic trends of the Ribb River. It includes data collection and analysis from the literature and from two field campaigns (Table 1). The analysis includes:
- the description of the river discharge regime,
- the assessment of bed level changes and sediment transport rates,
- the description of the historical channel evolution (alignment, width),
- the assessment of the past adjustment of river slope to sediment mining and water withdrawal, and
- the assessment of propagation time of riverbed level adjustment to Lake Tana regulation.
The methods adopted are described below.
3.1. River Flow Regime
The characterization of the river discharge regime at the gauging station locations (the Lower and the Upper) is based on the Flow Duration Curves (FDCs) using the daily time-series of measured discharge covering the period 1983–2010.
The analysis includes the assessment of the bankfull discharge, an important reference condition for river flow and morphology [28,29], which can be derived following different approaches like direct measurements [30,31,32,33], stage-discharge rating curves, and flow frequency analysis of annual maximum series [34,35], even though the practical estimation of flow frequency and magnitude remains difficult [35].
Due to lack of measured data on river channel geometry and water levels along the river course, we apply here a flow frequency analysis based on Gumbel extreme distribution, assuming that the annual peak discharge is equal to the instantaneous peak discharge value of each year and that the discharges having return period of 1.5 and 2.0 years are representative for the bankfull conditions [34,36,37]. The maximum daily discharge of each year is filtered from the daily discharge time-series. The discharge magnitude (Qt) having a return period of T years is then given by:
in which Qavg is the average value of the annual peak flows (m3/s), σ is the standard deviation of the flows (m3/s), and the dimensionless frequency factor (KT) is given by:
where λ is the Euler constant (=0.5772).
The bankfull discharge is also estimated as geometrical bankfull condition [36] for the locations where the cross-sections were measured during the two field campaigns, and then compared to the values obtained by applying the Gumbel method.
3.2. Bed Level Changes and Sediment Transport Rates
River bed level changes are assessed near the Ribb Bridge based on the analysis of the temporal evolution of the relation between discharges and water levels (‘stage-discharge relationship’) at the Lower hydrometric station.
The sediment transport rates of the Ribb River are estimated using the most widely used sediment transport formulae. The Meyer–Peter and Müller [38] formula, revised by Wong and Parker [39], is applied to the Upper-I and II reaches, both dominated by gravel (Equation (3)), while the Engelund and Hansen [40] formula, is applied to the Middle (the Upper and the Lower) sub-reaches, dominated by sand (Equation (4)):
in which qs is the volume of transported bed sediment (without pores) per unit of channel width (m2/s); u is the flow velocity (m/s); C is the Chézy coefficient (m1/2/s); ∆ is the relative density of sediment (1.65) (-); D50 is the median grain size (m); Dm is the mean grain size (m); and g is the acceleration due to gravity (9.81 m/s2).
The sediment transport capacity in the Upper-I reach and in the Lower Middle sub-reach are computed using the daily river discharges measured at the Upper and Lower gauging stations, respectively, since these stations are located within the reaches. For the Upper-II reach and the Upper Middle sub-reach, the daily discharges are derived based on catchment proportion. This is done by assuming that the catchment runoff yield is not influenced by catchment properties and rainfall distribution. The Lower gauging station is located at the start of the Lower reach where a large part of the peak discharges flows on the floodplains and through the remains of the silted-up channel (old river course) [21,26]. This means that the discharge measured at the Lower gauging station is not representative of the water flowing through the (new) main channel of the river in its lowest course near Lake Tana.
In 1959, the U.S. Bureau of Reclamation installed an automatic water level recorder in a cylindrical housing at a location just upstream of the Ribb River Bridge. The height of the cylindrical housing above the floodplain is used here to roughly assess the near-channel floodplain level rise between 1959 and 2016 (Section 4.2).
3.3. Historical Channel Evolution
The historical river alignments are derived from the aerial photographs of 1957 and 1980, the SPOT satellite images of 2006 and 2016 and a Google Earth image of 2016, complemented with a field reconnaissance. The aerial photographs are scanned with 600 dpi (dots per inch) of geometric resolution and 24 bit radiometric resolution of uncompressed gray scale, whereas the camera calibration reports (fiducial marks and focal lengths) are used to adjust the interior and exterior orientation of the photographs. The Ground Control Points (GCPs) established during the field campaigns at fixed locations, like road crossings, monuments and bridges, and some additional GCPs identified from the SPOT satellite image 2012 (x and y values) are used for ortho-rectification with ENVI 4.3. Topographical elevations are derived from the 30 m resolution digital elevation model (ASTER DEM of the year 2014). The ortho-rectified images are then mosaicked to create one image covering the study river reaches. ArcGIS 10.3.1 is finally used to digitize the river centerlines and visualize the super-imposed channel alignments. To capture the river centerline well, we use a 1:4000 scale for the digitization of both aerial photographs and satellite images.
The evolution of channel sinuosity, derived from the historical channel alignments, is here used to express the temporal changes of river meandering intensity. The evolution of channel width is determined from the satellite images and from the field data collected during the river cross-sectional survey of March 2016. The current valley length and longitudinal bed slope of the river are derived from the 30 m resolution ASTER Digital Elevation Model of the year 2014.
3.4. River Slope Adjustment to Interventions
The Equilibrium Theory developed in the 1970s by Jansen et al. [1] compares two reach-scale morphodynamic equilibrium conditions, one before and the other after one or more interventions, focusing on longitudinal bed slope and reference water depth by combining the following equations:
(1) Reach-scale continuity equation of water:
(2) Momentum equation for water, reduced to Chézy’s equation for steady uniform flow, simplified for large width to depth ratios:
(3) Simplified sediment transport capacity formula expressed as a power law of flow velocity:
(4) Sediment balance equation:
where QW is the water discharge (m3/s); B, h and u are the reach-averaged channel width (m), flow depth (m) and velocity (m/s), respectively; i is the water level slope (-), which is equal to the bed level slope (equilibrium conditions); C is the Chézy coefficient (m1/2/s); uc is the critical flow velocity for initiation of sediment motion, which can be considered to approach zero in sand bed rivers (m/s); a is the sediment transport proportionality coefficient (-); Qs is the average annual sediment transport rate (m3/year); y is the proportionality constant to convert seconds to year, and b is the degree of non-linearity of the sediment transport formula (-). The value of b is equal to 5 when using the Engelund and Hansen sediment transport formula [40], Equation (4), however, in general larger than 3 and reaches the value of 10 or more in gravel-bed rivers.
The theory is used here to analyze the longitudinal channel slope evolution of the Ribb River since 1980. We apply the Equilibrium Theory to this part of the river to study the effects of those interventions on riverbed slope. It is assumed that: (1) in 1980 the river was in natural morphodynamic equilibrium (absence of relevant interventions); (2) the river hydrology has not changed in the last three decades (Figure 2); and (3) the river had reached a new morphodynamic equilibrium state by 2014, after more than 30 years of water withdrawal and sediment extraction. The assumption regarding the absence of relevant interventions is supported by the analysis of the historical satellite images (see Section 4.3). Two scenarios are considered: (1) 100% of water is extracted during each dry period (December to May), and (2) 100% of water is extracted during each dry period plus a volume of sand of about 6000 m3 is mined every year. These scenarios are realistic, based on recent field observations (see Section 4.2). The values of the percentages and the results are found in Section 4.4.
Combining the equations introduced in the previous paragraph, the longitudinal bed and water surface slope at the initial (before the intervention) morphodynamic equilibrium is given by:
in which i0 is the initial reach-averaged longitudinal bed slope (-), QS0 is the initial annual sediment transport rate (m3/year), and Qw0k is the initial average daily river discharge of k days (m3/s).
Equation (9) is valid for all equilibrium states. For the Ribb River, we denote with subscript “0” the natural equilibrium in the year 1980, just before starting the water extraction and sediment mining interventions, and with subscript “∞” the new equilibrium in 2014, after about 34 years of water and sediment extractions. Assuming constant river width, Chézy coefficient and sediment transport parameters (a and b), the ratio between the equilibrium bed slopes in 2014 and 1980 is given by:
The method is strictly valid for sand-bed rivers only, since it does not take into account the limitation to bed erosion provided by bed armoring. Consequently, for gravel-bed rivers, the method can be applied only in case of sediment deposition (slope increase). It can also be applied to only qualitatively assess the temporal morphological trends in the river (increase by upstream sedimentation or decrease by upstream erosion).
The use of this simplified approach to assess the historical river slope is justified by its successful implementation in recent works. Its predictability was tested by Duró et al. [41] who compared the slope derived using Equation (9) to the results of a 2D morphodynamic model in case of river width changes and found surprisingly strong agreements. Khan et al. [15] applied the theory to the sand-bed Middle Zambezi River concluding that the historical slope was similar to the present one.
3.5. Assessment of Propagation of Bed Level Adjustment to Lake Tana regulation
The past rise of Lake Tana level might have affected the closure of the old Ribb River channel at the bifurcation, since the long-term morphological effect of a persistent downstream rise of the water level is an equal rise of the riverbed level. The bed level adjustment propagates in the upstream direction at a speed that depends on the sediment transport rate and on the geometry of the channel. Considering a certain time interval, it is possible to estimate a reference upstream limit of this propagation using the formula derived by De Vries [16]:
where L is the distance (m) from the downstream boundary reached by the bed level adjustment in the time interval T (years), and p is the porosity of sediment deposits (assumed to be 0.4 for uniform sand [42]).
Equation (11) was derived for sand-bed rivers, assuming uc = 0 in Equation (7). This assumption is not valid for gravel-bed rivers, where the existence of a clear threshold for sediment motion limits bed erosion. However, the formula can be applied in case of sedimentation, which is the case of the Ribb River adjustment of Lake Tana level rise.
L represents the theoretical distance reached by a change in bed level that corresponds to 50% of the total change that can be expected. For the Ribb River, the downstream boundary correspond to Lake Tana water level. To assess whether Lake Tana regulation has indeed contributed to the avulsion event, the considered time interval T is the duration of the period between the first rise of lake level (1995) and the year of avulsion (2008): 13 years. Considering that, in 2001, the lake level was lowered again, it is also important to establish whether this has resulted in riverbed level lowering at the location and time of the avulsion. For this, the considered time interval is 7 years.
The average annual sediment transport capacity (Qs) of the old Lower River channel is computed adopting the Engelund and Hansen [40] formula, for which b = 5 (Equation (4)), using the historical discharge time-series at the Lower gauging station of the periods 1995–2001 and 2002–2008 (Figure 10). Two conditions are considered. In the first one, the old river channel is assumed to be big enough to convey all discharges, including those above the value that represents the current bankfull condition. In the second one, the old channel is assumed to convey all discharges up to the bankfull value, the water flowing in the channel being the bankfull flow rate for higher discharges. Considering the first condition allows assessing the upper limit of L. The second condition is more realistic, but still overestimating L, since it does not take into account the gradual reduction of channel cross-section that preceded the avulsion event. As historical channel geometry for this reach is lacking, therefore we use here the current river channel characteristics at the Lower gauging station. This adds errors in the assessment, which, considering all the uncertainties, can only result in a rough estimate.
4. Results
4.1. River Discharge Characterization
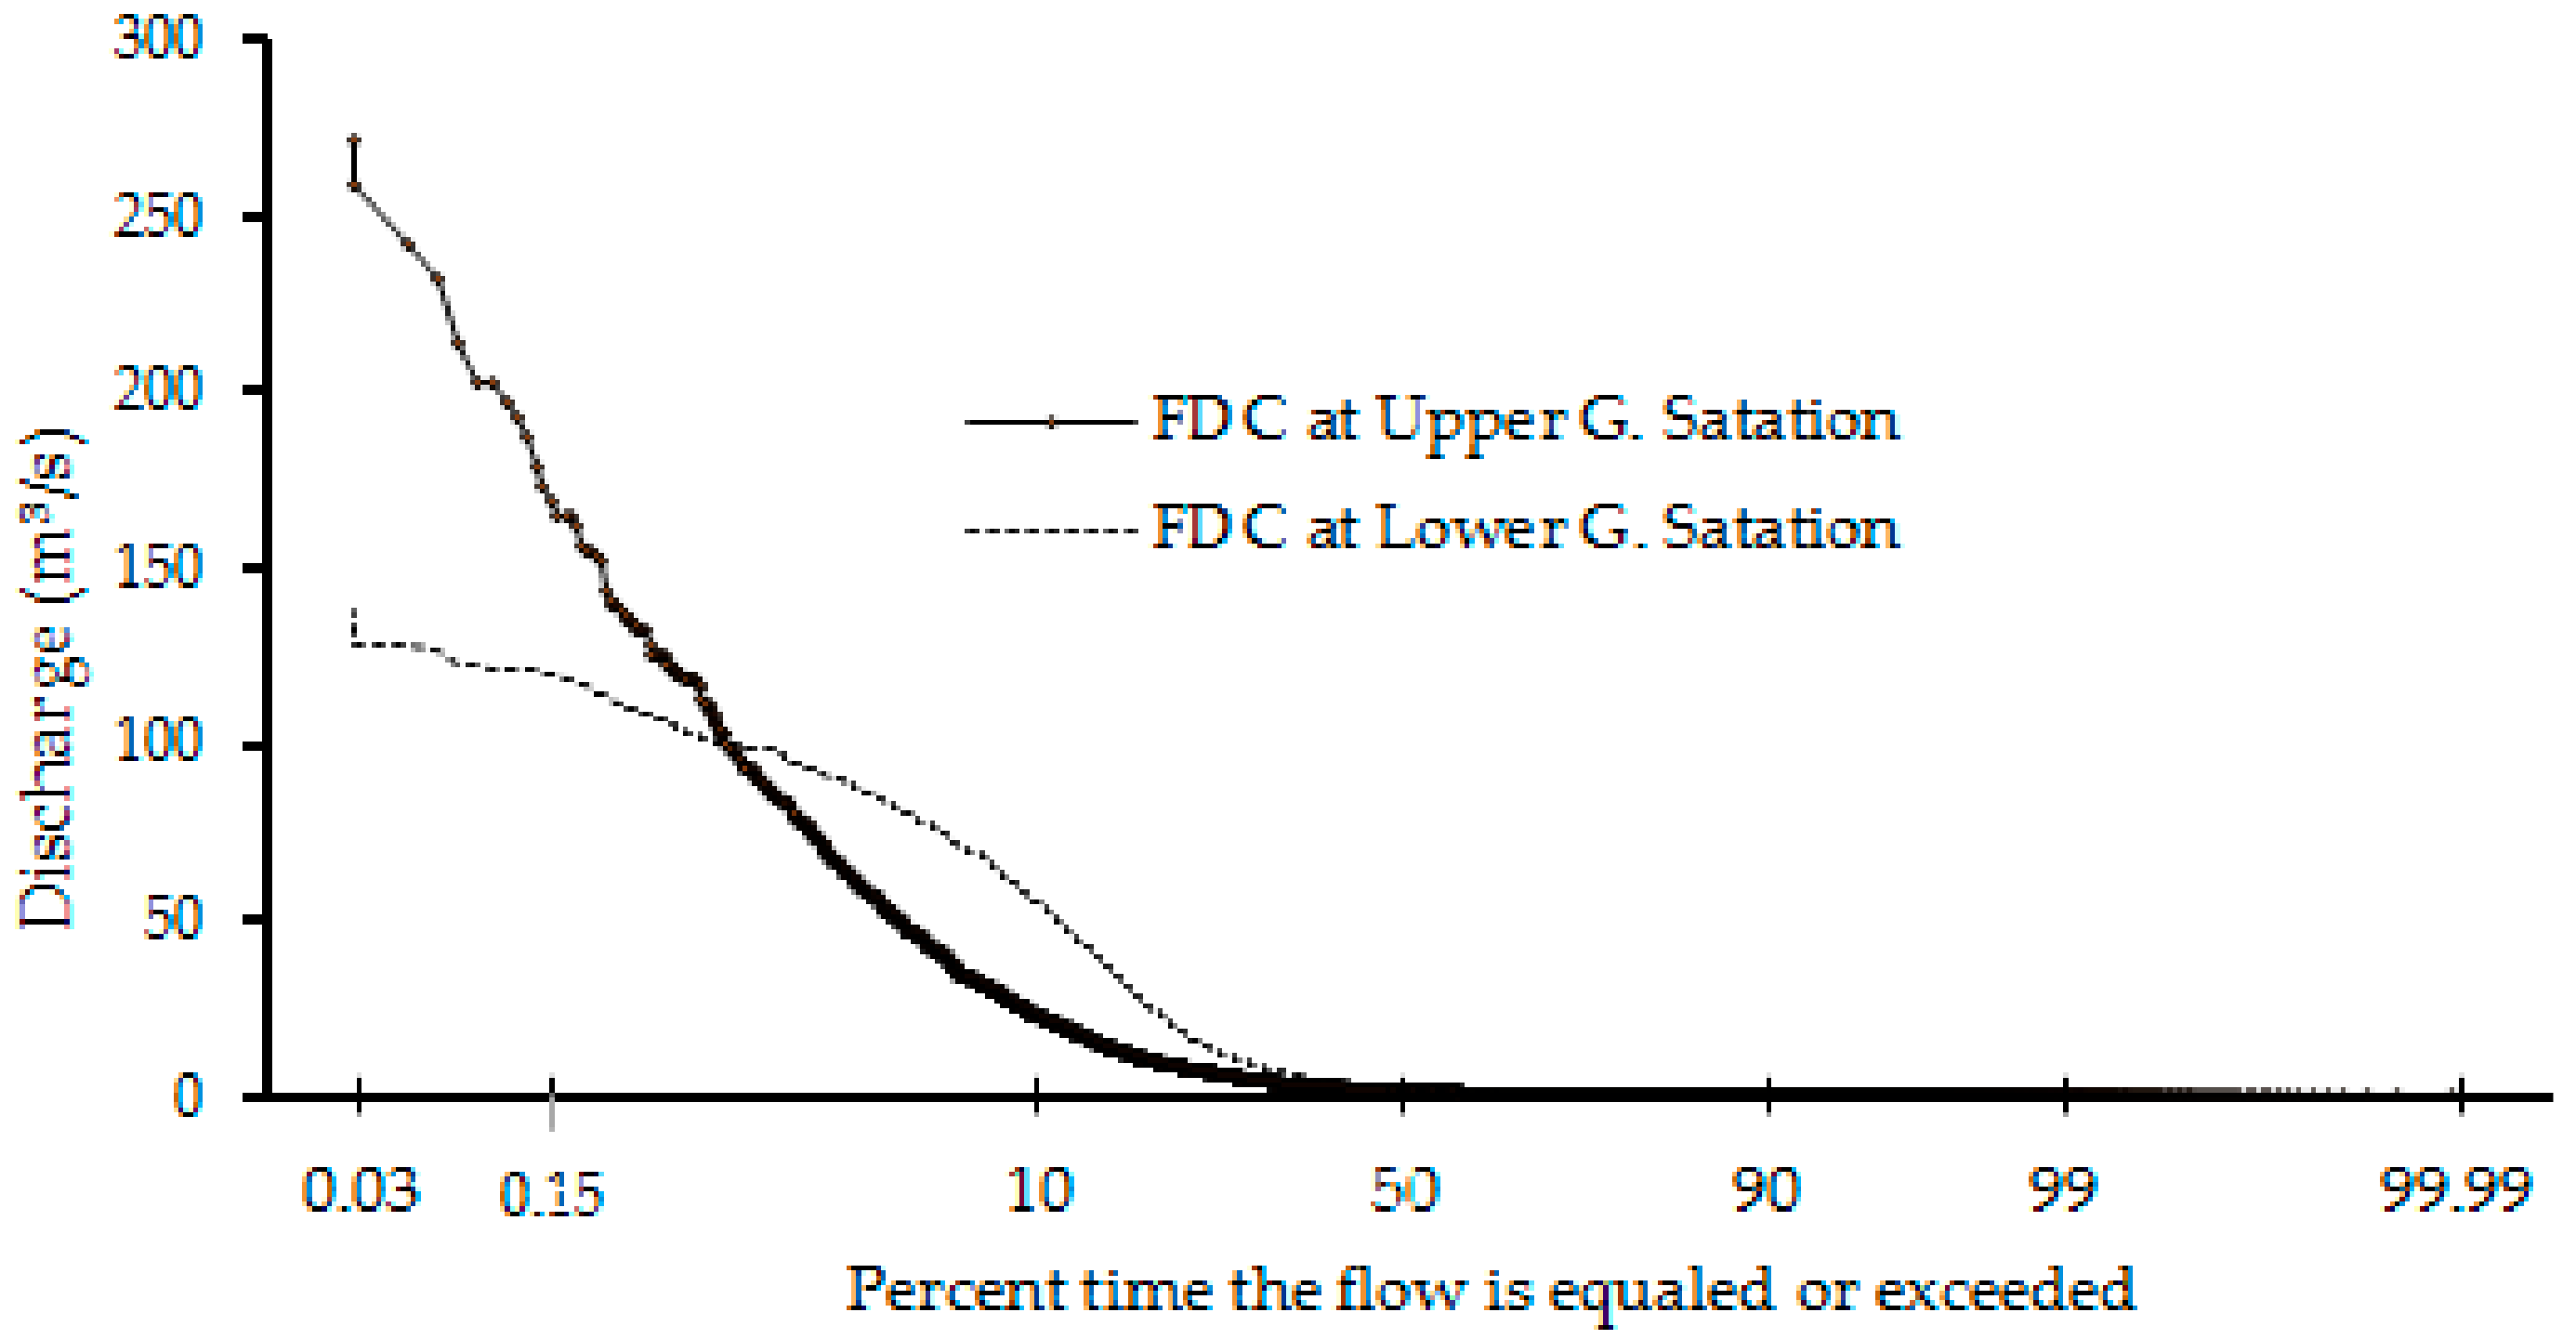
The FDCs derived for the gauging stations are shown in Figure 11. It is evident that the peak discharge at the Upper gauging station is substantially greater than the one at the Lower gauging station. This is likely due to overbank flow reducing the discharge exceeding the bankfull by as much as 71% at the Lower gauging station [21].
The values of the discharges having return periods of 1.5 and 2.0 years, here assumed to be representative of the bankfull conditions, are estimated at 125 m3/s and 196 m3/s for the Upper-I reach, and 117 m3/s and 128 m3/s for the Lower Middle sub-reach, respectively. The values of the bankfull discharge were also computed using Chézy’s equation, thus assuming uniform flow, for the measured river cross-sections near the Upper and the Lower gauging stations. Based on expert opinion, a Chézy coefficient of 35 m1/2/s can be considered appropriate for the river. The values obtained using the current longitudinal slope (Figure 3) are 150 m3/s and 110 m3/s for the Upper and the Lower gauging stations, respectively. These values are close to the values obtained using the statistical method. For this reason, it can be concluded that the bankfull discharge in the river reach immediately downstream of the Ribb Dam site has the order of magnitude of 150 m3/s and in the reach immediately upstream of the Ribb Bridge it has order of magnitude of 110 m3/s.
4.2. Bed Level Changes and Sediment Transport Rates
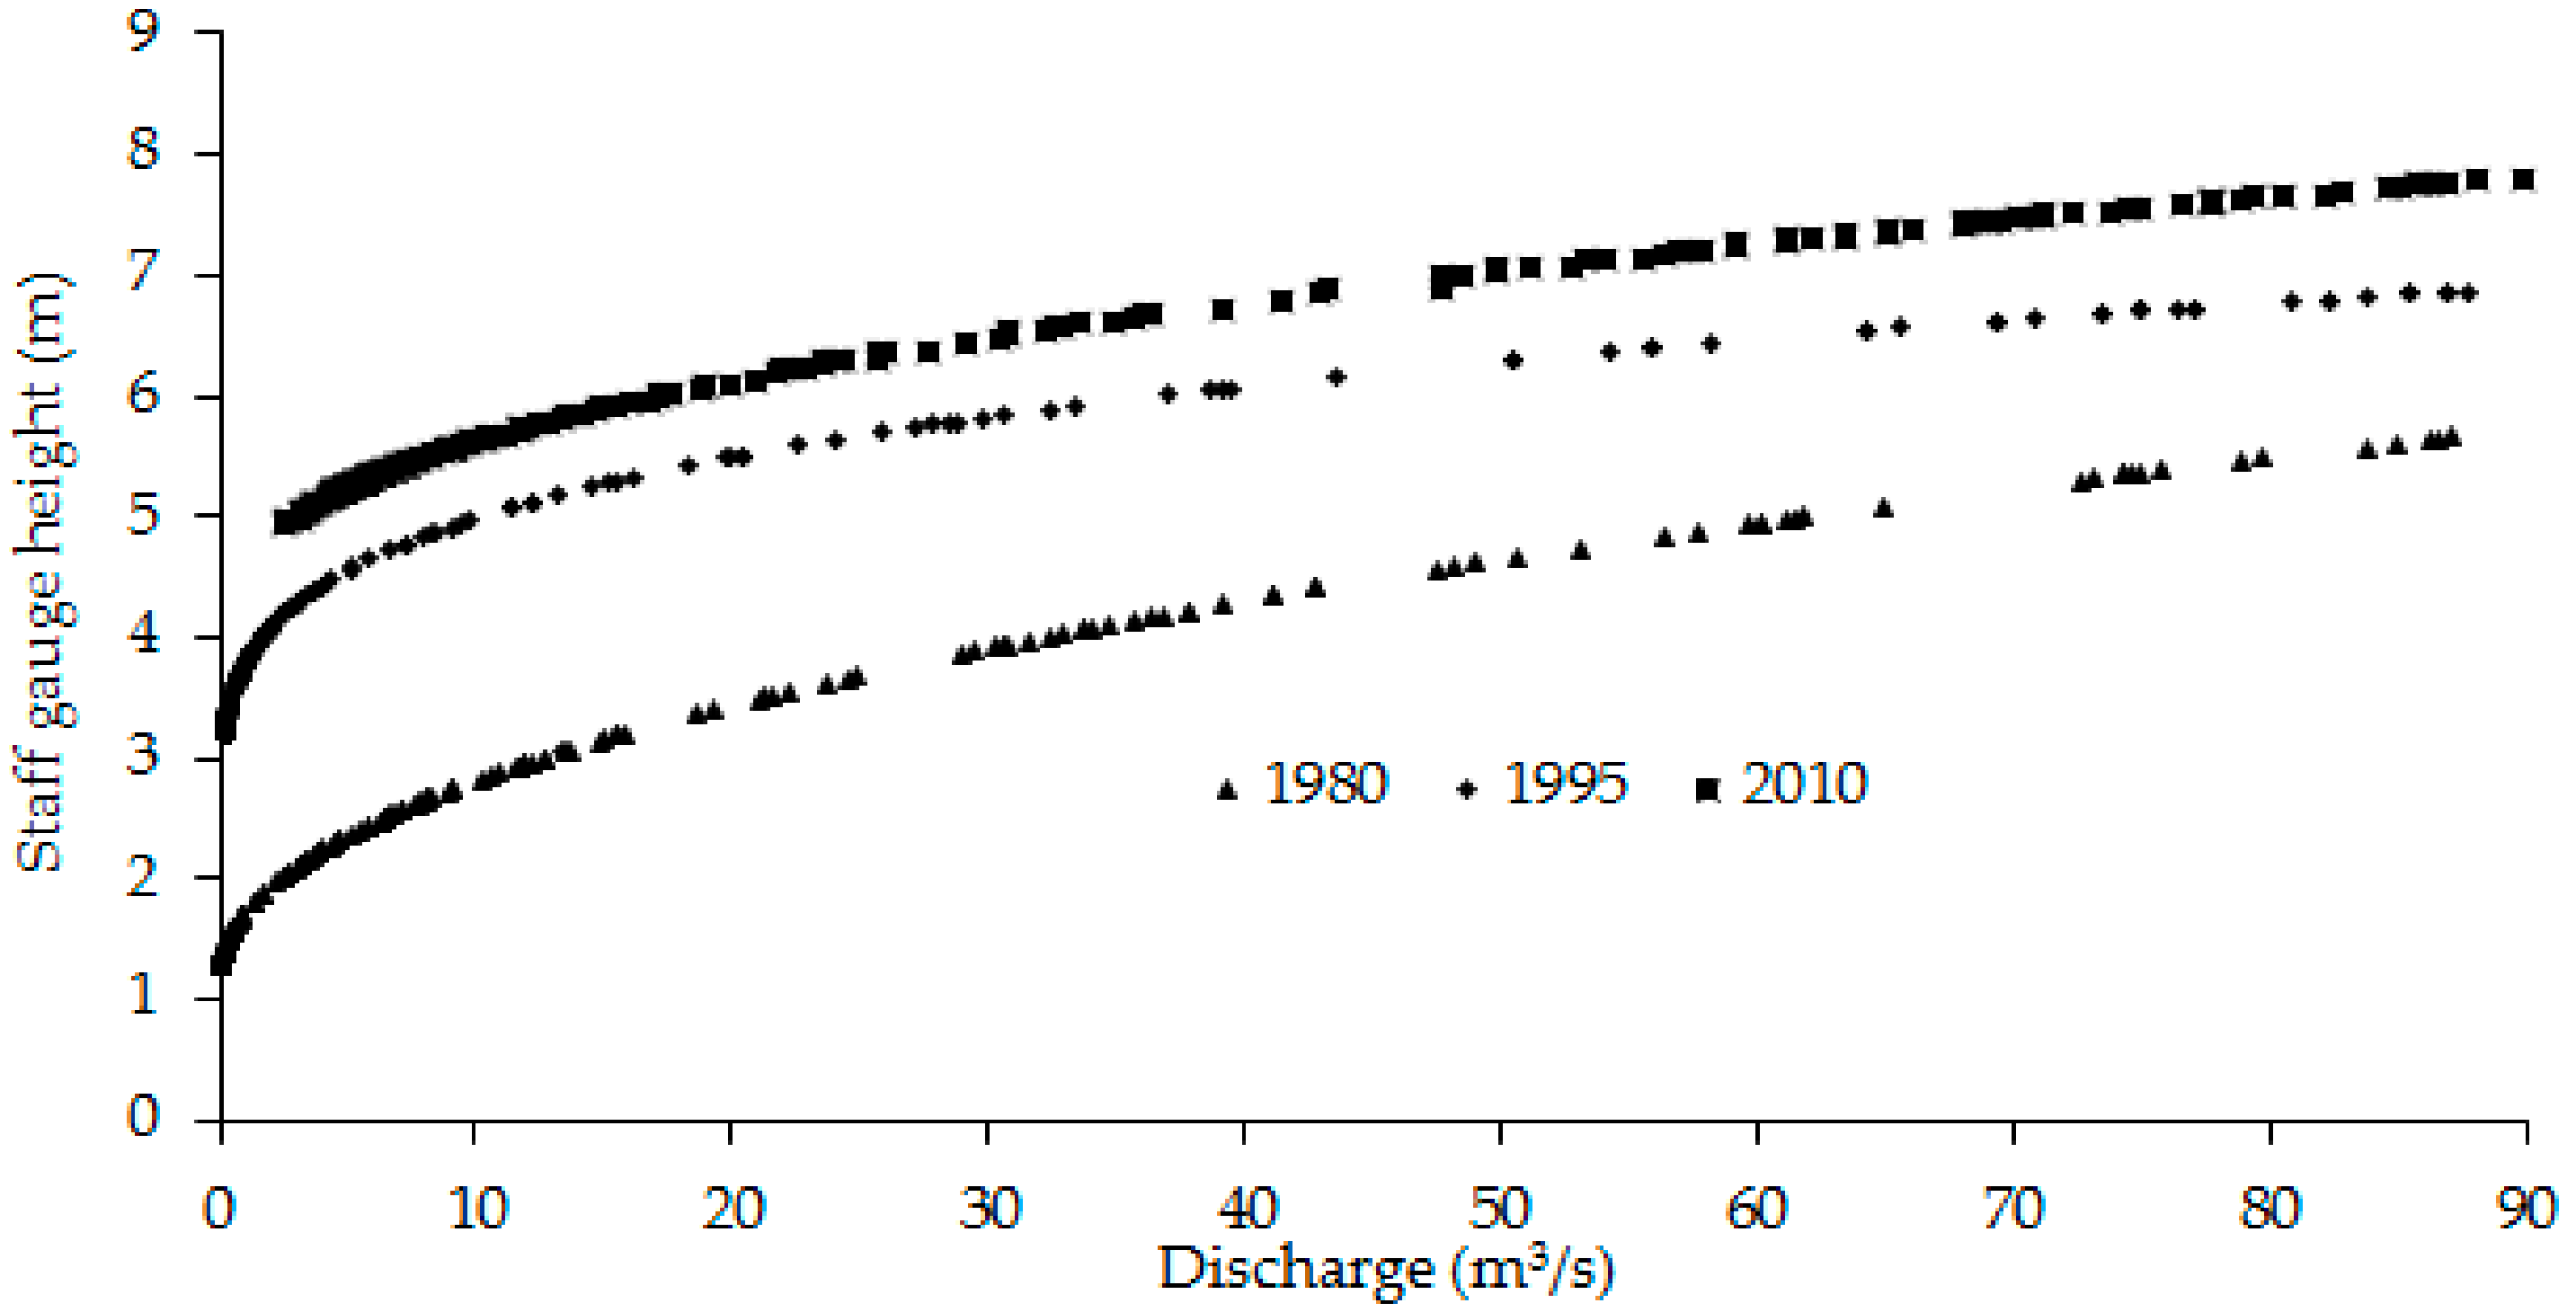
The time-series of daily water levels at the Lower gauging station shows that the riverbed rose by 2.2 m (14.7 cm/year) and 0.7 m (4.4 cm/year) between 1980 and 1995 and between 1995 and 2010, respectively, which is 2.9 m in 30 years (1980 to 2010) (Figure 12). Similarly, the nearby Gumara River bed rose by 2.91 m (6.3 cm/year) between 1963 and 2009 [18]. The adjacent Megech River to the north has similarly experienced sedimentation of the old channel downstream of a bifurcation since 1998 [23]. This means that sedimentation is observed in practically all rivers debouching in the Lake Tana from the Fogera plain.
Confirmation of the sedimentation phenomenon is given by the partial burial of several measuring stations in the region. The measurement of bed level around the old automatic water level recorder located near the Ribb Bridge shows that in 2016 the cylindrical station was buried by 2.4 m of sediment, which represents a rise of bed elevation of 4.2 cm per year. The study by Abate et al. [18] indicated a rise of 1.4 m (2.6 cm/year) over 53 years (from 1959 to 2012) for the adjacent Gumara River. There is uncertainty in the calculated change in floodplain elevation due to the natural settlement of the cylinder relative to the floodplain.
The increase in riverbed level is further supported by analyzing the computed reach-averaged annual sediment transport rates (Qs) along the river. For the sake of simplicity, the representative river cross-section for each reach was assumed to be rectangular (see Table 2 for its dimensions), the flow was assumed as uniform, and the Chézy roughness coefficient was assumed constant along the river with a value of 35 m1/2/s. Using the sediment transport Equations (3) and (4), applied to the period of available flow data, the average annual sediment transport rates were calculated as 6.96 × 10⁵ m3/year and 2.00 × 10⁵ m3/year for the Upper-I and Upper-II reaches, respectively, and 6.51 × 10⁴ m3/year and 5.70 × 10⁴ m3/year for the Upper Middle and Lower Middle sub-reaches, respectively. Assuming uniform flow and constant river dimensions to estimate the sediment transport rate for the Lower reach would give strongly uncertain results, as the river flow is highly affected by the backwaters caused by variations in Lake Tana and floodplain flooding (floodplains are not included in the simple sediment transport computations). The computation of sediment transport rate of the river from the dam site to the Ribb Bridge allows us to conceptualize the longitudinal riverbed profile changes, as depicted in Figure 13. The reduced sediment transport rate of the river in the downstream direction causes the riverbed to rise as observed at the Lower gauging station (Figure 12).
The average annual sediment transport rates in the old Lower river reach were calculated as 1.09 × 10⁵ m3/year and 1.04 × 10⁵ m3/year for the periods 1995–2001 and 2002–2008, respectively, if all discharges were conveyed by the river channel. The annual sediment transport rate result 1.09 × 10⁵ m3/year and 9.79 × 10⁴ m3/year for the periods 1995–2001 and 2002–2008, respectively, if the old Lower river channel was able to convey the discharge until bankfull. The two scenarios results in very similar sediment transport rates, which is due to the low frequency and the small duration of the flows that exceed the bankfull condition. These values are larger than the values obtained in the Upper and Lower Middle reaches. However, the actual values may be less than the estimated as it may be affected by the back water effect of Lake Tana. These values were used to analyze the effect of Lake Tana level regulation on the riverbed adjustment as described in Section 3.5 and the results are found in Section 4.5.
The average annual sediment transport rates in the old Lower river reach were calculated as 1.09 × 10⁵ m3/year and 1.04 × 10⁵ m3/year for the periods 1995–2001 and 2002–2008, respectively. These values are larger than the values obtained in the Upper and Lower Middle reaches. However, the actual values may be less than the estimated as it may be affected by the over bank flooding and back water effect of Lake Tana. These values were used to analyze the effect of Lake Tana level regulation on the riverbed adjustment as described in Section 3.5 and the results are found in Section 4.5.
4.3. Historical Channel Evolution
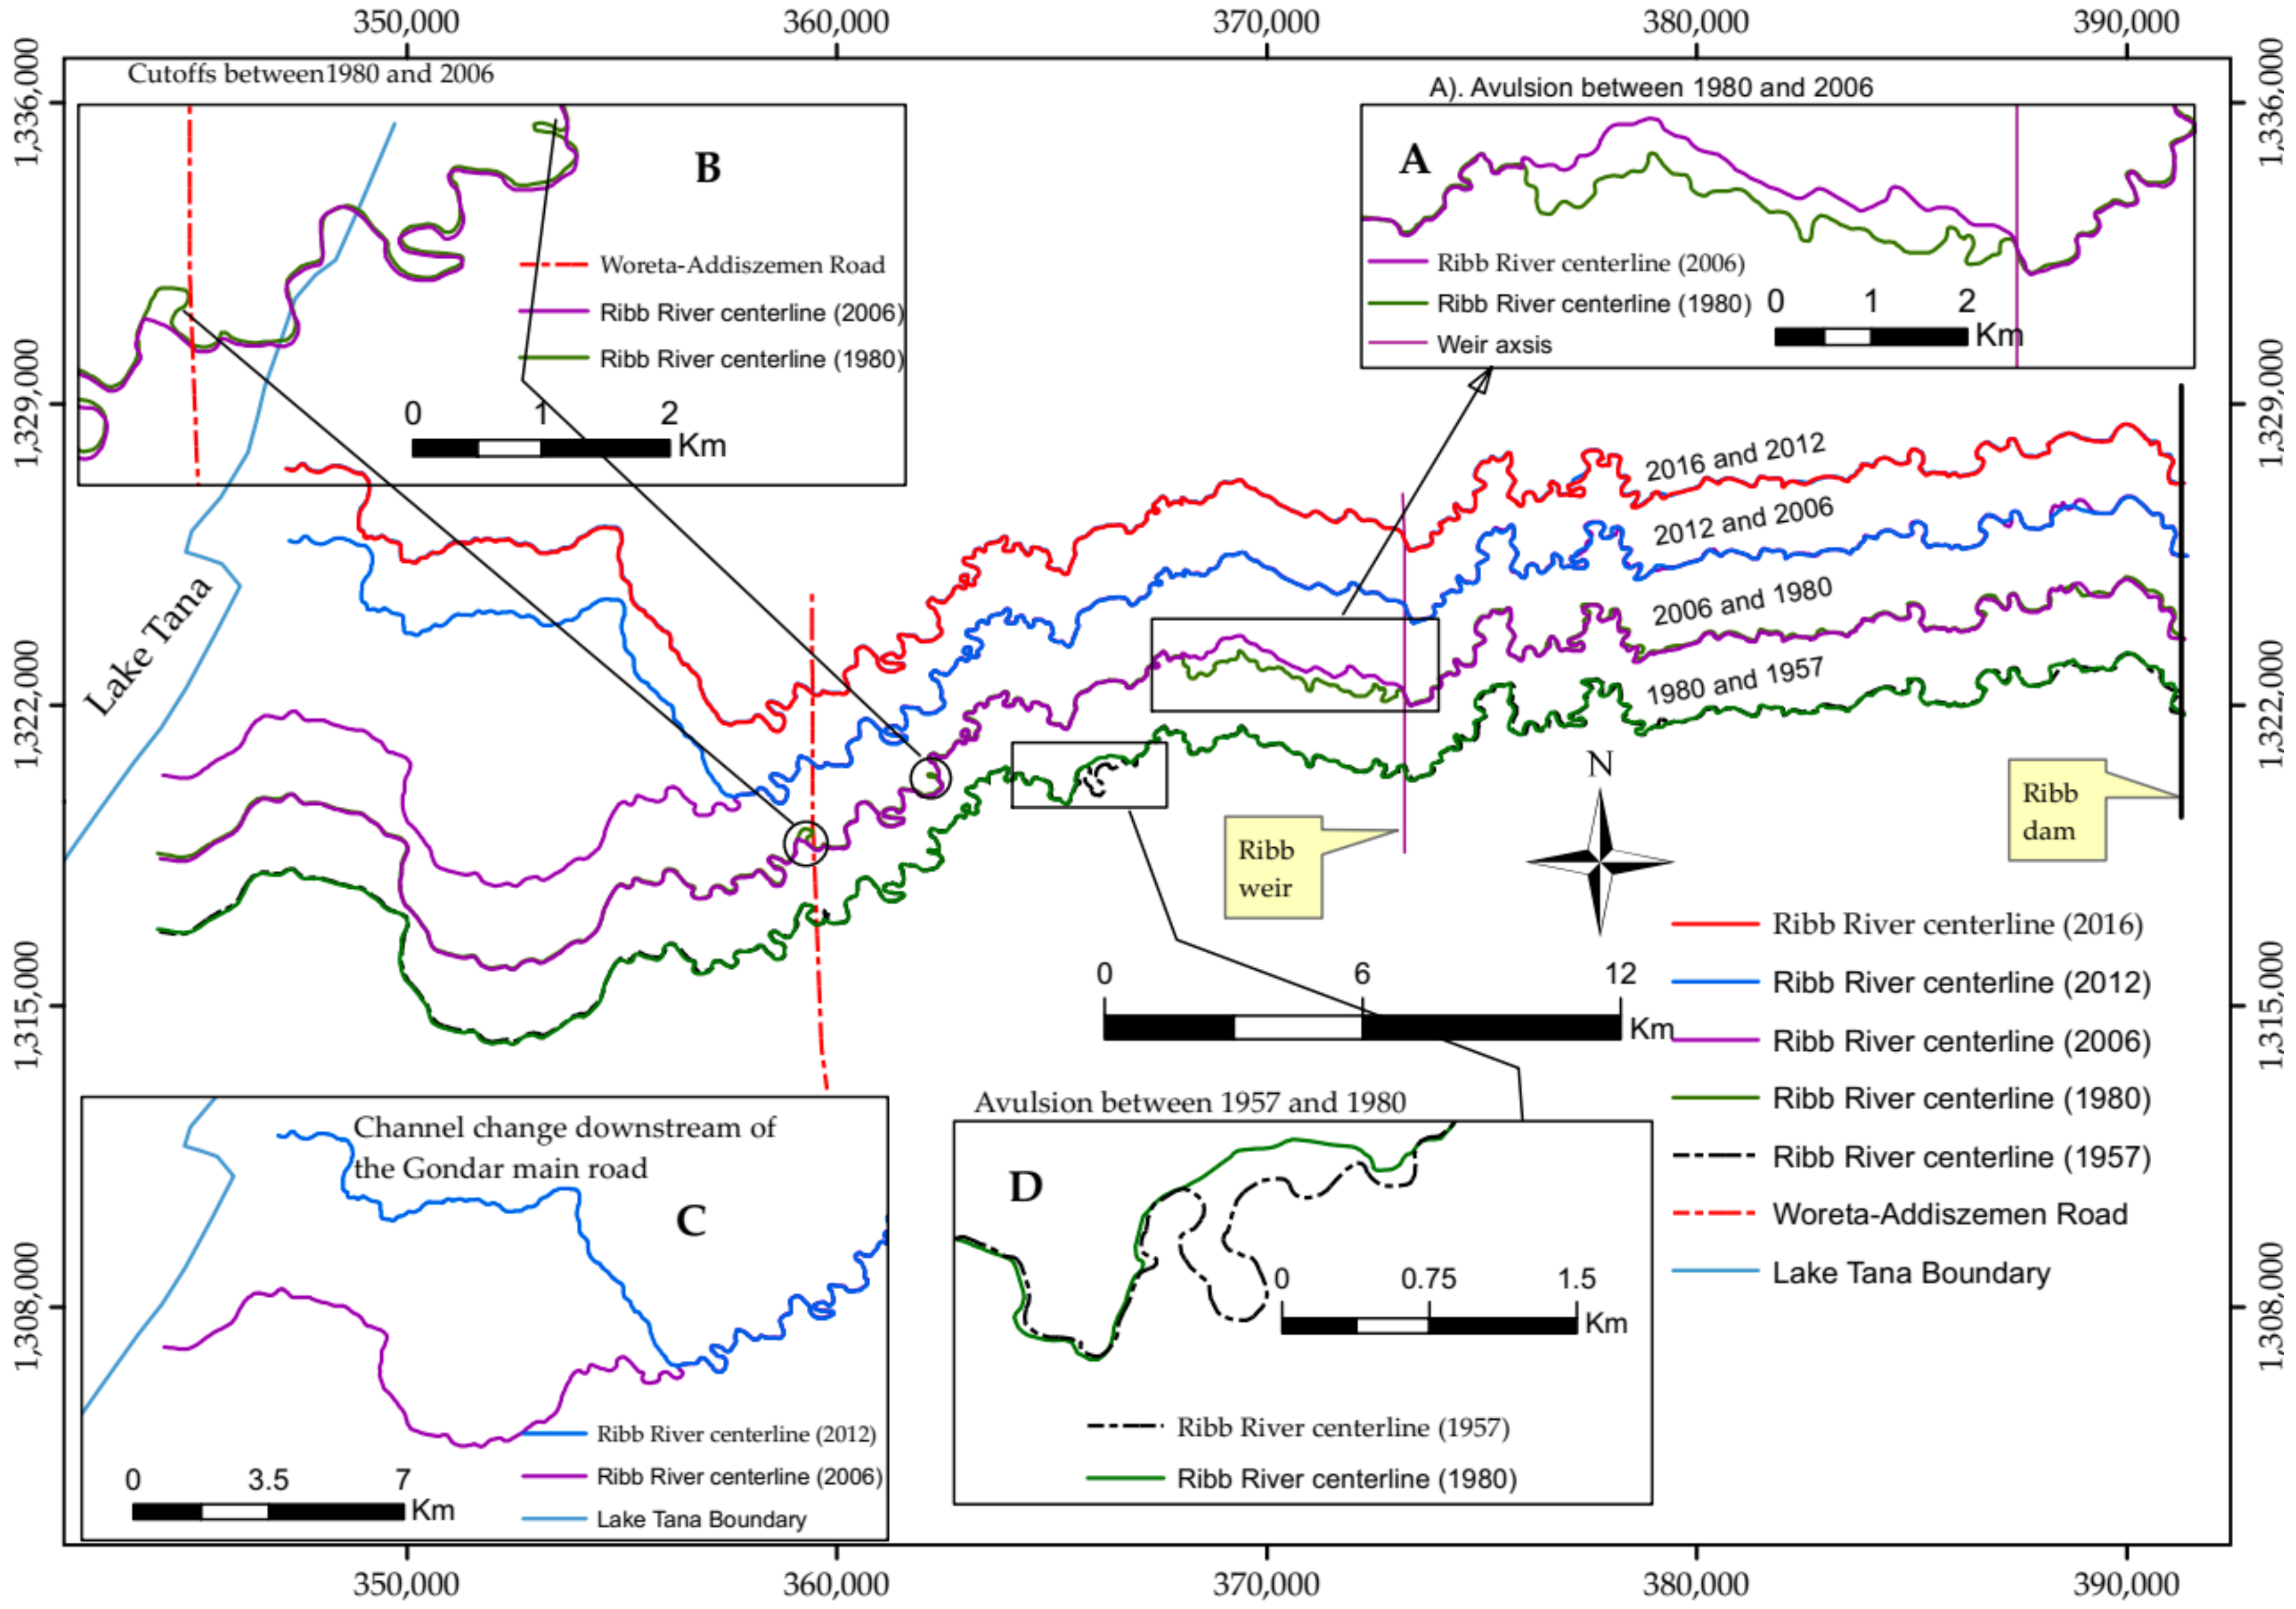
The river reach-scale characteristics in 1957, 1980, 2006, 2012 and 2016 are presented in Table 2, where negative values for sinuosity changes indicate length reduction. The river planform changes caused by bank retreat, cut-off formation, channel avulsion, and complete channel blockage between 1957 and 2016 are shown in Figure 14.
The analysis of aerial photographs and satellite images shows that the study reach of the Ribb River reduced its length from 81 to 77 km since 1957. In the Upper-I and Upper-II reaches, the river has experienced only little planform changes, with −4.08% and 11.28% sinuosity changes resulting in 0.2 km length reduction and 1.5 km length increment between 1957 and 2016, respectively. The rocky nature of the channel bed and banks in the Upper-I reach controls channel shape and width. The Middle reach reduced in length by 2.4 km, resulting in a sinuosity reduction of 16.9%. This was due to a channel avulsion event (Figure 14A) and a cut-off (Figure 14B), which occurred in the period 1980–2006. Another cut-off event (Figure 14D) occurred in the period 1957–1980. The small avulsion in Figure 14A reduced the channel length from 7.4 to 6.3 km and the sinuosity from 1.41 to 1.20, while the cut-off in Figure 14D reduced the river channel length from 3.0 to 1.4 km and the local sinuosity from 2.51 to 1.11. Generally, channel cut-offs and avulsions immediately increase the energy slope and the bed shear stress and may coarsen the riverbed materials [42]. However, in the absence of further changes, the channel tends to restore its characteristics (slope, width, etc.) as before the shortening, with channel incision as a result. Embankments have been built in the Lower Middle sub-reach to reduce flooding. These embankments have also drastically reduced local channel migration. In the Lower reach, the channel experienced sedimentation, which resulted in complete river channel blockage starting 4 km downstream of the bridge in 2008 followed by channel avulsion (Figure 14C). The length of the new river channel is 2.6 km larger than that of the old river reach, but has similar sinuosity (Table 2).
The main channel width measured from the Google Earth satellite images of the year 2016 shows gradual narrowing in the downstream direction. This may be due to decreasing bank erodibility as bank-material clay content increases downstream. In addition, the reduction of discharge in the downstream direction due to pump irrigation and flooding in the Lower reach may lead to channel narrowing as sediment may be deposited along the channel margins because of reduced transport capacity. It was not possible to derive the past channel width from historical satellite images because of poor resolution.
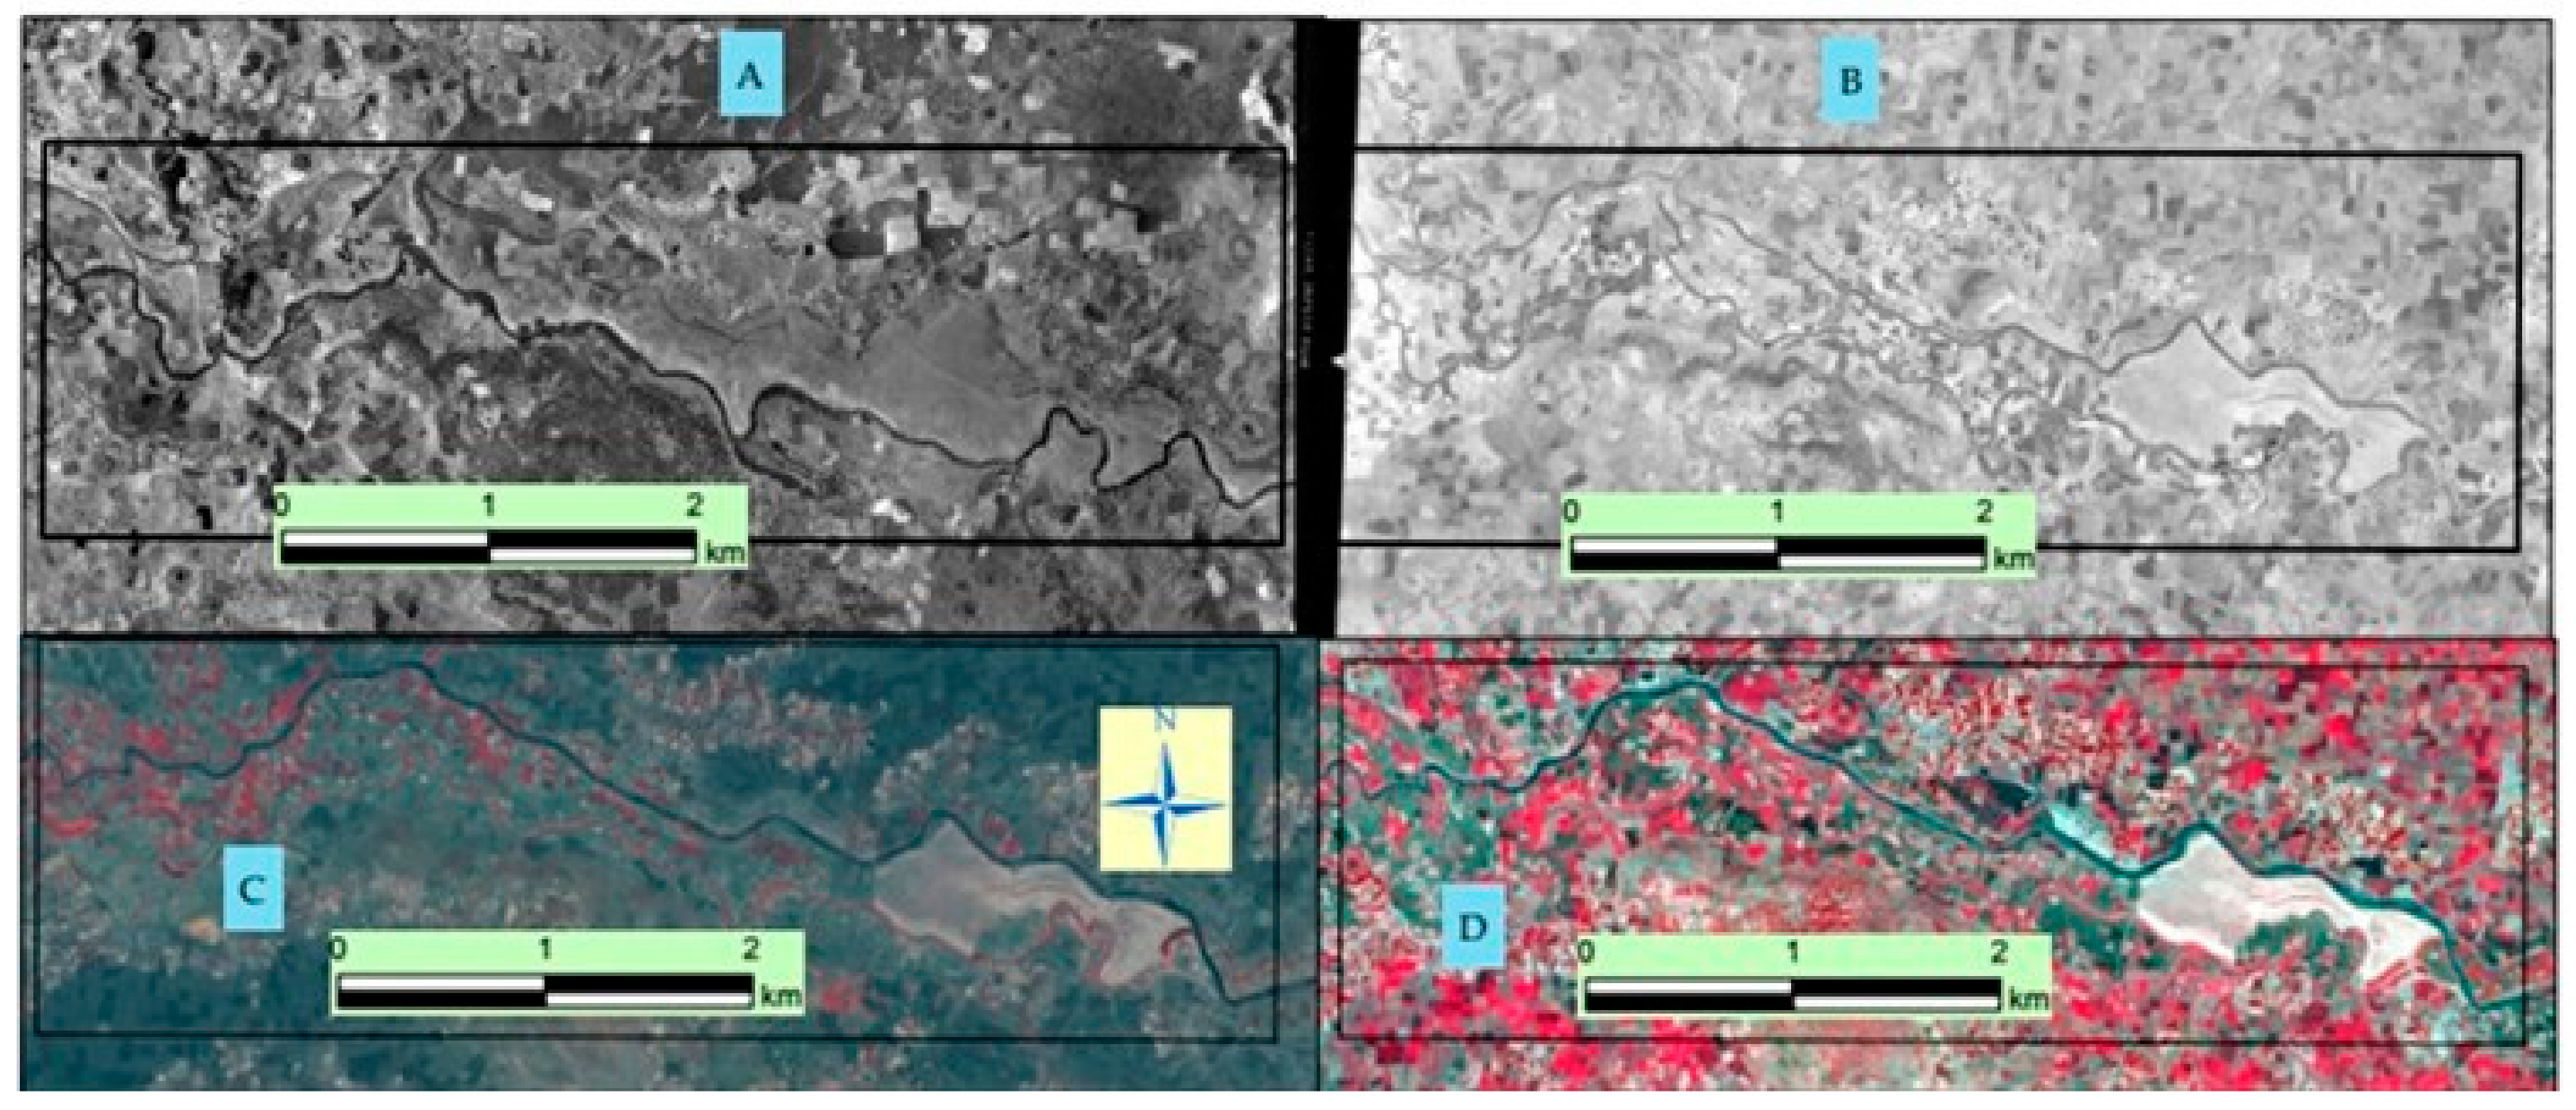
The temporal river planform changes occurred in the Middle reach in the period between 1980 and 2006 are shown using the aerial photographs 1957 and 1980 and the SPOT satellite images 2006 and 2016 (Figure 15).
4.4. River Slope Adjustment to Interventions
The long-term effects of sand mining and water extraction are assessed for the scenarios presented in Section 3.4 using the Equilibrium Theory. Table 3 lists the annual volume of river discharge for each scenario and the corresponding calculated reach-based annual sediment transport capacities, which are necessary to estimate the river slope (i0) of the year 1980 using Equation (10).
The results listed in Table 4 show that water extraction for irrigation during the dry months has little or no effect on riverbed slope. However, the river shows a response by decreasing its slope due to sand mining, considering that 6000 m3/year correspond to about 10% of the yearly reach-averaged sediment transport capacity.
4.5. Propagation of River Bed Level Adjustment to Lake Tana Regulation
Applying Equation (11) to analyze the Ribb River bed response to the Lake Tana level rise of 45 cm that was imposed in the period 1995–2001 (Figure 10) shows that, by 2008, a riverbed rise of 22.5 cm may have propagated as far as 18 km upstream (upper limit) (i.e., after 13 years from the start of Lake Tana level regulation). The computed value of L is practically the same for the two channel conveyance scenarios, due to the very similar sediment transport rates (Section 4.2). Being the distance between the avulsion location and the river mouth 19 km (computed along the old channel), the results show that a rise of channel bed of approximately 20 cm may have reached the Ribb Bridge location at the time of channel avulsion. Instead, most probably the subsequent lowering of Lake Tana level that started in 2001 did not affect the location of the bridge. In 2008, retrogressive erosion resulting in bed level lowering of about 30 cm may have reached the distance of 9 km only.
At the location of the Ribb Bridge, in 2008, the bed level rise caused by Lake Tana regulation had thus the order of magnitude of 20 cm or less. This result indicates that the artificial rise of Lake Tana level may be have influenced the closure of the old Ribb River channel and the 2008 channel avulsion. However, the sedimentation caused by Lake Tana regulation appears negligible when compared to the observed total sediment deposition at the avulsion location of almost 3 m (Section 4.2).
5. Discussion
5.1. River Channel Changes
The major planform change observed in the Ribb River system in the study period is the 2008 channel avulsion occurred 19 km upstream of Lake Tana. A slight contribution of Lake Tana level regulation on the rise of riverbed at this location is confirmed by the application of the methodology developed by De Vries [16] (Section 4.5). The analysis shows that the 45 cm rise of lake level in 1995 could have caused an increase in bed elevation of about 20 cm at the location and time of the avulsion event. However, at the same location, the riverbed level rose by about 3 m in the period 1980–2010 (Figure 12). This means that lake level regulation may have contributed to the closure of the old Ribb River channel which led to the avulsion event of 2008, but was not the main cause.
The largest part of the observed riverbed aggradation has been caused by other factors that have impacted upstream sediment supply and downstream sediment transport capacity. The results of this study show that the sediment transport rate of the Ribb River decreases in the downstream direction (Section 4.2), which means that part of the sediment that is transported by the river in its upper parts is deposited in the Middle and Lower reaches. The downstream decrease in river sediment transport capacity is most probably aggravated by the backwater effects from Lake Tana that are not accounted for in the computations of the sediment transport rates.
In addition, land use and land cover changes within the catchment may have increased the suspended sediment loads, which are not taken into account by sediment transport capacity formulas. Fine sediment settles in areas with low-flow velocity, such as floodplains and low-gradient reaches, such as the Lower reach of the Ribb River. Garede and Minale [43] showed a 20% increase of cultivated land and a 10% and 21% decrease of bush land and forest cover, respectively, between 1973 and 1995. Between 1995 and 2011 the extension of cultivated land remained approximately the same, whereas bush land and forest cover increased by just a 1.5% and 6%, respectively. At the same time, the observed catchment precipitation and river discharge do not show any increasing or decreasing trends (Figure 2), this means that the erosive power of rain has not changed within the study time. Garede and Minale’s findings therefore indicate that a possible increase of fine sediment supply may have started in the 1970s, due to land use and land cover changes.
5.2. River Response to Sand Mining and Water Withdrawal
Sand mining activities are expected to have decreased the equilibrium longitudinal bed slope of the river since 1980. The slope may reduce further if the amount of sand mining increases, which is possible if we consider the current increase of population and expansion of urbanization for the construction of buildings and other civil works. If the current sediment mining increases to, for instance, 15% of the yearly sediment transport capacity of the Middle reach (which corresponds to extracting about 9000 m3 of sand from the riverbed every year), the riverbed slope is expected to reduce to 0.036%. The operation of the planned Ribb Dam and diversion weir in the near future will reduce the sediment transport capacity in the downstream reaches and also the sediment inputs. The river will most probably respond by further decreasing its slope as a result of riverbed erosion in the upper reaches, where increased bank height may lead to channel instability [14]. Sediment mining combined with Ribb Dam operation may also create uneven riverbed topography [44,45] and coarsen the riverbed material [44] which may result in increased bed roughness and reduced flow velocity. On the long term, deficiency of fine sediment supply to the downstream reaches and sediment mining may lead to shoreline retrogression [46].
The analysis shows that water extraction during the dry months does not affect the riverbed slope (Table 4). This may be due to the small river discharge (on average 1.9 m3/s), so that the direct impact on the river morphology is minimal. However, the current reduction of flow discharge due to water withdrawal creates conditions that are favorable to sand miners who can easily excavate more sediment from the bar tops. This further contributes to channel slope decrease. In the future, the very small environmental flows (0.15 to 0.17 m3/s) will have no negative effects on sediment mining, which is thus expected to continue or even increase.
5.3. Effects of the Embankments
Continued embankment construction in the Lower river reach will contain the water flow and reduce the already limited lateral channel migration [44,47]. The volume of water through the river channel will increase whereas floodplain water and sediment flow will decrease. The latter might have a negative impact on local agriculture. Channel embankment will result in higher flow velocity and sediment transport capacity [1,44], which will reduce the observed on-going sedimentation phenomenon. The Ribb Dam will further reduce sedimentation in the future. Finally, increased bank height and flow confinement may increase the rate of bank erosion and the risk of bank failure [48].
5.4. Application of the Equilibrium Theory
Using the Equilibrium Theory, including the formula of de Vries that is based on the same approach leads to highly uncertain results, and, for this reason, all quantifications should be only considered for comparison between scenarios to identify increasing or decreasing trends. The theory was developed for sand-bed rivers, for which the threshold velocity for sediment particle motion is close to zero. This is not true for gravel-bed rivers, where the existence of a clear threshold results in limitations of riverbed degradation due to armoring.
We applied the Equilibrium Theory to the Middle reach of the Ribb River to infer the longitudinal channel slope prior to human interventions (reference year: 1980 AD). The bed material of the Middle reach is made by sand (70%) and gravel (30%), the median grain size being 1 mm. In this area, bed armoring can indeed limit riverbed degradation. The results show that the river most probably experienced a temporal decrease in bed slope due to sand mining, but no changes occurred due to water extraction. Considering the strong limitations of the approach used outside its applicability range, the computed slopes for 1980 AD should be considered only to infer past trends (increase or decrease).
The formula by de Vries was used to roughly assess whether retrogressive sedimentation due to Lake Tana level rise had reached the location of channel avulsion by 2008. The Lower reach has a sand bed and the formula is therefore applicable. Nevertheless, the results are only indicative, due to the strongly simplified approach.
6. Conclusions
The analysis of the morphodynamic trends of the Ribb River between 1980 and 2016 presents the response of a medium-size low-land river belonging to the Lake Tana sub-basin to anthropogenic drivers that are typical of the region: sand mining, water extraction, embankment construction and downstream boundary alteration. The study examines the responses of the river to these interventions by image analysis and by the application of physics-based analytical methods.
In particular, having subdivided the last 77 km of the river in four reaches, the work provides the current reach-scale sediment budgets. The results show a reduced sediment transport capacity in the downstream direction, a condition that leads to progressive sediment deposition. This is confirmed by the riverbed level rise of almost 3 m observed near the Ribb Bridge, about 20 km upstream of Lake Tana (river mouth), in the 30 year period 1980–2010. The complete silt up of the river channel 4 km more downstream, which resulted in river avulsion in 2008, was most probably the result of the observed sediment transport capacity decrease, aggravated by the backwater effects related to the artificial rise of Lake Tana level for hydropower production, which have further reduced the sediment transport capacity of the flow in the downstream direction. The analysis of the upstream propagation time of riverbed rise from Lake Tana confirms the hypothesis that lake regulation contributed to channel avulsion.
The reduction of sediment transport capacity in the downstream direction appears to be mainly caused by upstream sediment mining and water withdrawal for irrigation, the former by reducing the longitudinal riverbed slope of the river and the latter by directly reducing the water flow and its transport capacity. Sedimentation and downstream decrease of the water discharge are also responsible for the observed width reduction in the downstream direction.
By providing a full quantitative description of the river prior to the construction of the Ribb Dam, 77 km upstream of the river mouth, and related diversion weir, 30 km more downstream, the results of this work will allow for estimating the effects of the future operations on river morphology and dynamics.
Author Contributions
C.A.M. collected field data, analyze the work and wrote the main text of the manuscript. C.A.M. and A.C. prepare the layout of the research work. A.C. also supervised the overall activity and the progress of the work. A.C., M.M.M., E.J.L. and M.M. comment the manuscript and improve the English.
Acknowledgments
We would like to acknowledge Netherlands Fellowship Program (NFP) for the financial support of this research project. We also thank the Hydrological Directorate of the Ministry of Water, Irrigation and Electricity (Ethiopia) for supplying the daily river discharge, water levels and lake level records. Finally, we gratefully acknowledge the three anonymous reviewers for their constructive comments to improve the quality of the manuscript.
Conflicts of Interest
The authors declare no conflict of interest.
References
- Jansen, P.P.; Van Bendegom, L.; De Varies, M.; Zenen, A. Principles of River Engineering. The Non-Tidal Alluvial River; Delftse Uitgevers Maatschappij B.V: Delft, The Netherlands, 1979. [Google Scholar]
- Latapie, A.; Camenen, B.; Rodrigues, S.; Paquier, A.; Bouchard, J.; Moatar, F. Assessing channel response of a long river influenced by human disturbance. Catena 2014, 121, 1–12. [Google Scholar] [CrossRef]
- Gilvear, D.J. Fluvial geomorphology and river engineering: Future roles utilizing a fluvial hydrosystems framework. Geomorphology 1999, 31, 229–245. [Google Scholar] [CrossRef]
- Bravard, J.; Kondolf, G.; Piégay, H. Environmental and Societal Effects of Channel Incision and Remedial Strategies. In Incised River Channels: Processes, Forms, Engineering and Management; Wiley: Hoboken, NJ, USA, 1999. [Google Scholar]
- Gilvear, D.J. River management and conservation issues on formerly braided river systems; the case of the River Tay, Scotland. Geol. Soc. Lond. Spec. Publ. 1993, 75, 231–240. [Google Scholar] [CrossRef]
- Marston, R.A.; Girel, J.; Pautou, G.; Piegay, H.; Bravard, J.-P.; Arneson, C. Channel metamorphosis, floodplain disturbance, and vegetation development: Ain River, France. Geomorphology 1995, 13, 121–131. [Google Scholar] [CrossRef]
- Gilvear, D.; Winterbottom, S. Channel change and flood events since 1783 on the regulated River Tay, Scotland: Implications for flood hazard management. Regul. Rivers Res. Manag. 1992, 7, 247–260. [Google Scholar] [CrossRef]
- Nelson, J.M.; Shimizu, Y.; Abe, T.; Asahi, K.; Gamou, M.; Inoue, T.; Iwasaki, T.; Kakinuma, T.; Kawamura, S.; Kimura, I. The international river interface cooperative: Public domain flow and morphodynamics software for education and applications. Adv. Water Resour. 2016, 93, 62–74. [Google Scholar] [CrossRef]
- Belete, M.A. Modeling and Analysis of Lake Tana Sub-Basin Water Resources Systems, Ethiopia. Ph.D. Thesis, University of Rostock, Rostock, Germany, 2013. [Google Scholar]
- WWDSE; TAHAL. Ribb Dam Hydrological Study (Final Report); Water Works Design and Supervision Enterprise (WWDSE) and TAHAL Consulting Engineers Ltd.: Addis Ababa, Ethiopia, 2007. [Google Scholar]
- Brandt, S.A. Classification of geomorphological effects downstream of dams. Catena 2000, 40, 375–401. [Google Scholar] [CrossRef]
- Graf, W. Downstream hydrologic and geomorphic effects of large dams on American Rivers. Geomorphology 2006, 79, 336–360. [Google Scholar] [CrossRef]
- Williams, G.P.; Wolman, M.G. Downstream Effects of Dams on Alluvial Rivers; U.S. Government Printing Office: Washington, DC, USA, 1984. [Google Scholar]
- Kondolf, G.M. Hungry water—Effects of dams and gravel mining on river channels and floodplains. Aggreg. Resour. Glob. Perspect. AA Balkema Vermont 1997, 113–129. [Google Scholar] [CrossRef]
- Khan, O.; Mwelwa-Mutekenya, E.; Crosato, A.; Zhou, Y. Effects of dam operation on downstream river morphology: The case of the Middle Zambezi River. Proc. Inst. Civ. Eng. Water Manag. 2014, 167, 585–600. [Google Scholar] [CrossRef]
- De Vries, M. A morphological time scale for rivers. In Proceedings of the 16th Congress IAHR, São Paulo, Brazil, 27 July–1 August 1975; Volume 2, pp. 17–23. [Google Scholar]
- Tekleab, S.; Mohamed, Y.; Uhlenbrook, S. Hydro-climatic trends in the Abay/Upper Blue Nile Basin, Ethiopia. Phys. Chem. Earth Parts A/B/C 2013, 61, 32–42. [Google Scholar] [CrossRef]
- Abate, M.; Nyssen, J.; Steenhuis, T.S.; Moges, M.M.; Tilahun, S.A.; Enku, T.; Adgo, E. Morphological changes of Gumara River channel over 50 years, Upper Blue Nile Basin, Ethiopia. J. Hydrol. 2015, 525, 152–164. [Google Scholar] [CrossRef]
- Tesemma, Z.K.; Mohamed, Y.A.; Steenhuis, T.S. Trends in rainfall and runoff in the Blue Nile Basin: 1964–2003. Hydrol. Process. 2010, 24, 3747–3758. [Google Scholar] [CrossRef] [Green Version]
- Hurni, H.; Tato, K.; Zeleke, G. The implications of changes in population, land use, and land management for surface runoff in the Upper Nile Basin area of Ethiopia. Mt. Res. Dev. 2005, 25, 147–154. [Google Scholar] [CrossRef]
- Dessie, M.; Verhoest, N.E.; Admasu, T.; Pauwels, V.R.; Poesen, J.; Adgo, E.; Deckers, J.; Nyssen, J. Effects of the floodplain on river discharge into Lake Tana (Ethiopia). J. Hydrol. 2014, 519, 699–710. [Google Scholar] [CrossRef]
- BRLi; MCE. Pump, Drainage Schemes at Megech: Environmental and Social Impact Assessment of the Ribb Irrigation and Drainage Project; BRLi: Nîmes, France; MCE: Addis Ababa, Ethiopia, 2010. [Google Scholar]
- SMEC. Hydrological Study of the Tana-Beles Sub-basin: Main Report; Snowy Mountains Engineering Corporation (SMEC) International Pty Ltd.: Melbourne, VIC, Australia, 2008; pp. 1–110. [Google Scholar]
- Kinzel, P.; Runge, J. Summary of Bed-Sediment Measurements Along the Platte River, Nebraska, 1931–2009; U.S. Geological Survey: Reston, VA, USA, 2010. [Google Scholar]
- ENTRO. Flood Risk Mapping Consultancy for Pilot Areas in Ethiopia; Final Report to the Eastern Nile Technical Regional Office (ENTRO); ENTRO: Addis Ababa, Ethiopia, 2010; pp. 1–206. [Google Scholar]
- Snowy Mountains Engineering Corporation (SMEC). Hydrological Study of the Tana-Beles Sub-Basin: Surface Water Investigation; SMEC International Pty Ltd.: Queensland, QLD, Australia, 2008. [Google Scholar]
- Abate, M.; Nyssen, J.; Moges, M.M.; Enku, T.; Zimale, F.A.; Tilahun, S.A.; Adgo, E.; Steenhuis, T.S. Long-term landscape changes in the Lake Tana Basin as evidenced by delta development and floodplain aggradation in Ethiopia. Land Degrad. Dev. 2017, 28, 1820–1830. [Google Scholar] [CrossRef]
- Parker, G.; Wilcock, P.R.; Paola, C.; Dietrich, W.E.; Pitlick, J. Physical basis for quasi-universal relations describing bankfull hydraulic geometry of single-thread gravel bed rivers. J. Geophys. Res. Earth Surf. 2007, 112. [Google Scholar] [CrossRef] [Green Version]
- Wilkerson, G.V.; Parker, G. Physical basis for quasi-universal relationships describing bankfull hydraulic geometry of sand-bed rivers. J. Hydraul. Eng. 2010, 137, 739–753. [Google Scholar] [CrossRef]
- Leopold, L.B.; Wolman, M.G. River Channel Pattern: Braided, Meandering and Straight; U.S. Government Printing Office: Washington, DC, USA, 1957. [Google Scholar]
- Van den Berg, J.H. Prediction of alluvial channel pattern of perennial rivers. Geomorphology 1995, 12, 259–279. [Google Scholar] [CrossRef]
- Crosato, A. Analysis and Modelling of River Meandering. Ph.D. Thesis, Delft University of Technology, Nieuwe Hemweg 6b, Amsterdam, The Netherlands, 2008. [Google Scholar]
- Blom, A.; Arkesteijn, L.; Chavarrías, V.; Viparelli, E. The equilibrium alluvial river under variable flow and its channel-forming discharge. J. Geophys. Res. Earth Surf. 2017, 122, 1924–1948. [Google Scholar] [CrossRef]
- Leopold, L.B.; Wolman, M.G.; Miller, J.P. Fluvial Processes in Geomorphology; W.H. Freeman and Company: San Francisco, CA, USA, 1964; p. 522. [Google Scholar]
- Williams, G.P. Bank-full discharge of rivers. Water Resour. Res. 1978, 14, 1141–1154. [Google Scholar] [CrossRef]
- Vargas-Luna, A.; Crosato, A.; Byishimo, P.; Uijttewaal, W.S. Impact of flow variability and sediment characteristics on channel width evolution in laboratory streams. J. Hydraul. Res. 2018, 1–11. [Google Scholar] [CrossRef]
- Shaw, E.M. Hydrology in Practice, 3rd ed.; Stanley Thornes Pub.: Cheltenham, UK, 2002. [Google Scholar]
- Meyer-Peter, E.; Müller, R. Formulas for Bed-Load Transport. In Proceedings of the International Association for Hydraulic Research (IAHR) 2nd Meeting, Stockholm, Sweden, 7–9 June 1948. [Google Scholar]
- Wong, M.; Parker, G. Reanalysis and correction of bed-load relation of Meyer-Peter and Müller using their own database. J. Hydraul. Eng. 2006, 132, 1159–1168. [Google Scholar] [CrossRef]
- Engelund, F.; Hansen, E. A Monograph on Sediment Transport in Alluvial Streams; TEKNISKFORLAG Skelbrekgade: Copenhagen, Denmark, 1967. [Google Scholar]
- Duró, G.; Crosato, A.; Tassi, P. Numerical study on river bar response to spatial variations of channel width. Adv. Water Resour. 2016, 93, 21–38. [Google Scholar] [CrossRef]
- Frings, R.M.; Schüttrumpf, H.; Vollmer, S. Verification of porosity predictors for fluvial sand-gravel deposits. Water Resour. Res. 2011, 47. [Google Scholar] [CrossRef] [Green Version]
- Garede, N.M.; Minale, A.S. Land use/cover dynamics in Ribb watershed, North Western Ethiopia. J. Nat. Sci. Res. 2014, 4, 9–16. [Google Scholar]
- Frings, R.M. Sand and gravel on the move: Human impacts on bed-material load along the Lower Rhine River. In Geomorphic Approaches to Integrated Floodplain Management of Lowland Fluvial Systems in North America and Europe; Springer: New York, NY, USA, 2015. [Google Scholar]
- Thornton, E.B.; Sallenger, A.; Sesto, J.C.; Egley, L.; McGee, T.; Parsons, R. Sand mining impacts on long-term dune erosion in Southern Monterey Bay. Mar. Geol. 2006, 229, 45–58. [Google Scholar] [CrossRef]
- Jiang, S.W.; Haibier, A.; Wu, Y.X. Combined impacts of sand mining activities: The Nandu River downstream segment. Adv. Mater. Res. 2013, 671–674, 3134–3137. [Google Scholar] [CrossRef]
- Surian, N. Channel changes due to river regulation: The case of the Piave River, Italy. Earth Surf. Process. Landf. 1999, 24, 1135–1151. [Google Scholar] [CrossRef]
- Li, L.; Lu, X.; Chen, Z. River channel change during the last 50 years in the Middle Yangtze River, the Jianli Reach. Geomorphology 2007, 85, 185–196. [Google Scholar] [CrossRef]
Figure 1.
Location map of the study area. (A) Ethiopia; (B) Amhara region divided in Administrative Zones; (C) Lake Tana basin highlighting Lake Tana, Blue Nile River and Ribb River catchment; (D) studied river reach including Ribb dam, Ribb weir, Upper and Lower gauging stations, and the 2016 river centerline.

Figure 2.
Yearly rainfall from the year 1988 to 2014 and average Ribb River discharges from the year 1983 to 2013 for the Lower and Upper gauging stations. The graph does not show any increasing or decreasing trends. Data source: National Meteorological Agency and Ministry of Water, Irrigation and Energy, Ethiopia.

Figure 3.
Ribb River study reach, sub-reaches and riverbed profile from the dam site to Lake Tana. The river alignment is derived from Google Earth images of 2016. The slope is obtained from 30 m resolution Digital Elevation Models (DEM) of Advanced Spaceborne Thermal Emission and Reflection Radiometer (ASTER) satellite images of 2014.

Figure 4.
Ribb River alignments in 1957 and 2016 including gullies and tributaries and sediment sampling locations. The area between Lake Tana and the road to Gondar and Bahir Dar is part of the Fogera Plain, which is shared by the Ribb and the Gumara rivers.
Figure 4.
Ribb River alignments in 1957 and 2016 including gullies and tributaries and sediment sampling locations. The area between Lake Tana and the road to Gondar and Bahir Dar is part of the Fogera Plain, which is shared by the Ribb and the Gumara rivers.

Figure 5.
Lower Ribb River reach. (A) the point where the river loses its channel; (B) maize plantation using residual moisture along the river channel downstream of location A.
Figure 5.
Lower Ribb River reach. (A) the point where the river loses its channel; (B) maize plantation using residual moisture along the river channel downstream of location A.

Figure 6.
River bed and bank material in the Upper-I (A) and the Lower Middle (B) River reaches (March 2016).
Figure 6.
River bed and bank material in the Upper-I (A) and the Lower Middle (B) River reaches (March 2016).

Figure 7.
Grain size distribution of Ribb River bed material downstream of the Ribb Dam site, upstream and downstream of the weir site and upstream of the Ribb Bridge, at Universal Transverse Mercator (UTM) coordinates 37P 0388475, 1332080, 1872 m a.s.l.; 37P 0373692, 1329576, 1819 m a.s.l.; 37P 0368803, 1330762, 1804 m a.s.l. and 37P 0359808, 1326196, 1795 m a.s.l., respectively (Samples were collected in March 2016).

Figure 8.
(A) excavated sand accumulation by sand miners in the Middle River reach; (B) river channel enlargement and deepening to increase flow conveyance. The contractor used the material for embankment construction at the Lower reach; (C) flood outlet structure to the farmlands as low height weir (April 2016).

Figure 9.
(A) water extraction with a diesel pump for irrigation; (B) irrigation canal to transport extracted water, which has been breached, and adjacent failing banks. The photos were taken immediately upstream of the under-construction Ribb weir in April 2017.
Figure 9.
(A) water extraction with a diesel pump for irrigation; (B) irrigation canal to transport extracted water, which has been breached, and adjacent failing banks. The photos were taken immediately upstream of the under-construction Ribb weir in April 2017.

Figure 10.
Mean annual Lake Tana level since 1985 (data source: Ministry of Water, Irrigation and Energy, Ethiopia).
Figure 10.
Mean annual Lake Tana level since 1985 (data source: Ministry of Water, Irrigation and Energy, Ethiopia).

Figure 11.
Flow duration curves at the Lower and Upper gauging stations (data source: Ministry of Water, Irrigation and Energy).
Figure 11.
Flow duration curves at the Lower and Upper gauging stations (data source: Ministry of Water, Irrigation and Energy).

Figure 12.
Ribb River staff level at the Lower gauging station with corresponding discharges (Data source: Ministry of Water, Irrigation and Energy, Ethiopia).
Figure 12.
Ribb River staff level at the Lower gauging station with corresponding discharges (Data source: Ministry of Water, Irrigation and Energy, Ethiopia).

Figure 13.
Sedimentation trend along the Ribb River based on estimated sediment transport rates. Distance of 0 km corresponds for dam site while 77 km is Lake Tana.
Figure 13.
Sedimentation trend along the Ribb River based on estimated sediment transport rates. Distance of 0 km corresponds for dam site while 77 km is Lake Tana.

Figure 14.
Successive Ribb River centerlines. (A) avulsion developed between the years 1980 and 2006; (B) cut-off developed between the years 1980 and 2006; (C) complete channel change between the years 2006 and 2012; (D) cut-off developed between the years 1957 and 1980.
Figure 14.
Successive Ribb River centerlines. (A) avulsion developed between the years 1980 and 2006; (B) cut-off developed between the years 1980 and 2006; (C) complete channel change between the years 2006 and 2012; (D) cut-off developed between the years 1957 and 1980.

Figure 15.
Aerial photographs and SPOT satellite images of the Middle river section downstream of the weir. (A,B) aerial photograph and river pattern of the year 1957 and 1980, respectively, and (C,D) SPOT satellite image and river pattern of the year 2006 and 2012, respectively.
Figure 15.
Aerial photographs and SPOT satellite images of the Middle river section downstream of the weir. (A,B) aerial photograph and river pattern of the year 1957 and 1980, respectively, and (C,D) SPOT satellite image and river pattern of the year 2006 and 2012, respectively.


Table 1.
Collected data and their source.
| Data Type | Data Period | Resolution | Source |
|---|---|---|---|
| Black and white aerial photographs | 1957 (November and December) | Approx. 1:55,000 | Ethiopian Mapping Agency |
| February 1980 | Approx. 1:45,000 | ||
| SPOT satellite images | 6 January 2006 | 2.5 m by 2.5 m | Airbus Defence |
| 28 November 2012 | 2.5 m by 2.5 m | and Space | |
| ASTER DEM | 23 September 2014 | 30 m by 30 m | Maps.google.be |
| Google Earth satellite images | 2016 | https://earthexplorer.usgs.gov/ | |
| River cross-sectional survey | March 2016 | Field campaign | |
| River flow discharge at the Lower gauging station | 1964–2014 | Daily | Ministry of Water, Irrigation and Energy |
| River flow discharge at the Upper gauging station | 1980–2013 | Daily | Ministry of Water, Irrigation and Energy |
| Water level at the Lower gauging station | 1980–2010 | Daily | Ministry of Water, Irrigation and Energy |
| Lake Tana level at Bahir Dar station | 1960–2015 | Daily | Ministry of Water, Irrigation and Energy |
| River bed-material samples | March 2016 | Field campaign | |
| Rainfall at Debre Tabor Meteorological station | 1988–2015 | Daily | National Meteorological Agency, Ethiopia |
Table 2.
Reach-scale planimetric and geometric characteristics of Ribb River.
| Reach | Year | Length of Channel (km) | Valley Length (km) | Sinuosity (-) | Change of Sinuosity from 1957 (%) | Average River Width (m) | Average River Depth (m) | Valley Slope (%) | River Channel Slope (%) |
|---|---|---|---|---|---|---|---|---|---|
| Upper-I | 1957 | 9.9 | 4.9 | 1.61 | - | - | - | - | |
| 1980 | 10.0 | 1.63 | 2.04 | - | - | - | |||
| 2006 | 10.4 | 1.71 | 10.20 | - | - | - | |||
| 2012 | 9.6 | 1.55 | −6.12 | - | - | - | |||
| 2016 | 9.7 | 1.57 | −4.08 | 65 | 4.3 | 0.64 | 0.3 | ||
| Upper-II | 1957 | 20.8 | 13.3 | 1.71 | - | - | - | - | |
| 1980 | 21.1 | 1.74 | 2.26 | - | - | - | |||
| 2006 | 21.8 | 1.79 | 7.52 | - | - | - | |||
| 2012 | 21.7 | 1.78 | 6.77 | - | - | - | |||
| 2016 | 22.3 | 1.83 | 11.28 | 58 | 4.8 | 0.21 | 0.07 | ||
| Middle | 1957 | 27.4 | 14.2 | 1.93 | - | - | - | - | |
| 1980 | 25.2 | 1.77 | −15.49 | - | - | - | |||
| 2006 | 24.7 | 1.74 | −19.01 | - | - | - | |||
| 2012 | 24.8 | 1.75 | −18.31 | - | - | - | |||
| 2016 | 25.0 | 1.76 | −16.90 | 46 | 5.2 | 0.1 | 0.06 | ||
| Lower, (old) | 1957 | 22.8 | 15.3 | 1.49 | - | - | - | - | |
| 1980 | 23.0 | 1.50 | 1.31 | - | - | - | |||
| 2006 | 22.9 | 1.50 | 0.65 | - | - | - | |||
| Lower, (new) | 2012 | 20.1 | 13.4 | 1.50 | - | - | - | - | |
| 2016 | 20.2 | 1.51 | 1.73 | 38 | 5.5 | 0.05 | 0.03 |
Table 3.
Average annual river discharge volume and calculated reach-averaged annual sediment transport capacity without and with interventions represented by Scenarios 1 and 2.
Table 3.
Average annual river discharge volume and calculated reach-averaged annual sediment transport capacity without and with interventions represented by Scenarios 1 and 2.
| Reach Name | Catchment Area (km2) | Average Annual River Discharge Volume (×106 m3) | Reach-Averaged Annual Sediment Transport Volume (×104 m3) | |||
|---|---|---|---|---|---|---|
| Without Intervention | Scenarios 1 | Without Intervention | Scenario 1 | Scenario 2 | ||
| Upper-I | 844 | 268.52 | 268.52 | 69.58 | 69.58 | 69.58 |
| Upper-II | 1162 | 369.95 | 369.95 | 20.02 | 20.02 | 20.02 |
| Upper Middle | 1381 | 440.37 | 425.27 | 6.51 | 6.49 | 5.84 |
| Lower Middle | 1592 | 478.45 | 458.57 | 5.7 | 5.66 | 5.09 |
Table 4.
Calculated reach-averaged riverbed slope in the year 1980 (before intervention) for the Middle River reach for Scenario 1 and Scenario 2.
Table 4.
Calculated reach-averaged riverbed slope in the year 1980 (before intervention) for the Middle River reach for Scenario 1 and Scenario 2.
| Reach | i∞, Slope in 2014 as Determined from 2014 ASTER DEM (%) | io, Estimated Slope of the Year 1980 for Scenario 1 (%) | io, Estimated Slope of the Year 1980 for Scenario 2 (%) |
|---|---|---|---|
| Middle (Upper and Lower) | 0.04 | 0.04 | 0.0426 |
© 2018 by the authors. Licensee MDPI, Basel, Switzerland. This article is an open access article distributed under the terms and conditions of the Creative Commons Attribution (CC BY) license (http://creativecommons.org/licenses/by/4.0/).
Share and Cite
MDPI and ACS Style
Mulatu, C.A.; Crosato, A.; Moges, M.M.; Langendoen, E.J.; McClain, M. Morphodynamic Trends of the Ribb River, Ethiopia, Prior to Dam Construction. Geosciences 2018, 8, 255. https://doi.org/10.3390/geosciences8070255
AMA Style
Mulatu CA, Crosato A, Moges MM, Langendoen EJ, McClain M. Morphodynamic Trends of the Ribb River, Ethiopia, Prior to Dam Construction. Geosciences. 2018; 8(7):255. https://doi.org/10.3390/geosciences8070255
Chicago/Turabian StyleMulatu, Chalachew A., Alessandra Crosato, Michael M. Moges, Eddy J. Langendoen, and Michael McClain. 2018. "Morphodynamic Trends of the Ribb River, Ethiopia, Prior to Dam Construction" Geosciences 8, no. 7: 255. https://doi.org/10.3390/geosciences8070255
Note that from the first issue of 2016, this journal uses article numbers instead of page numbers. See further details here.