Communication

Suspended Sediment Variability at the Solimões and Negro Confluence between May 2013 and February 2014

1
Department of Geography, Universidade Federal do Amazonas, 69080-900 Manaus, Brazil
2
Department of Geosciences, Universidade Federal do Amazonas, 69080-900 Manaus, Brazil
3
GET, UMR 5563, IRD/CNRS, Université Toulouse 3, 31400 Toulouse, France
4
Instituto Geofísico del Perú—IGP, 15012 Lima, Peru
*
Author to whom correspondence should be addressed.
Geosciences 2018, 8(7), 265; https://doi.org/10.3390/geosciences8070265
Submission received: 5 July 2018 / Revised: 14 July 2018 / Accepted: 16 July 2018 / Published: 19 July 2018

Abstract

:
This study focuses on the confluence of two major rivers of the world, the Solimões River (white waters) and Negro River (black waters). Surface suspended sediment samples (SSC) and spectroradiometer taken along transverse profiles at 500 m intervals over a distance of 10 km, as well as satellite images (MODIS) during the hydrological year, were used to follow suspended sediment variability. In January and February, the confluence is dominated by white waters from the Solimões River in the two banks, and in June and July in the right bank by black waters from the Negro River and in the left bank by clear waters from the Solimões River. We found that indirect tools, such as reflectance obtained by spectrometer or MODIS images, can be used to determine surface suspended sediments in a contrasting zone.

1. Introduction

The Solimões-Negro confluence is an important zone for studying the mixture of water from two major tropical rivers with different hydraulic and physiochemical characteristics. The Solimões River represents approximately 60% of discharge and suspended sediments in the Amazon River [1]. Its white waters are rich in suspended and dissolved sediments from the Andes Mountains, while the Negro River, with black water rich in organic matter but poor in suspended sediments, originating from the Guyana Shield, is considered the fifth-longest tropical River [2]. The mixing processes and changes in nutrients are significant for aquatic biodiversity, and their effects can be observed as much as 1000 km beyond Óbidos, the last gauging station before the Atlantic Ocean [3,4,5].
Using measurements in the field, Gualteri et al. [6] showed the velocity variability and energy generated by the velocity gradient through the M1 and M2 metric. They indicate that M2 best describes the hydrodynamic characteristics of the confluence, and the nutrients and species are accumulating in the area. Studies also show that during the period of rising waters (January to May) several fish species migrate from tributaries to the main River to spawn, and that turbulence and turbidity in the main River help protect fish larvae from predators [7]. In Lake Catalão, near the Solimões-Negro confluence, there is an increase in the number of species between January and February because of the high concentration of nutrients. The peak of suspended sediments in the Solimões River was observed during these months [8].
The hydraulic difference of tributaries in confluence determines geomorphologic changes such as the formation of islands, formation of large lateral bars, and zones of high turbulence [9]. The Solimões-Negro confluence presents the differences in hydraulic and physicochemical characteristics between the two rivers. The water from the Solimões River has a basic pH, while that of the Negro River has an acid pH. Conductivity exceeds 60 µS/cm in the Solimões River and in the Negro River this is below 20 µS/cm. The temperature of the black waters is two or three degrees higher than that of the white waters [10]. The velocity in the Solimões River (average 1.5 m·s−1) is two to three times greater that of the Negro River (average 0.4 m·s−1) [5,10]. Studies have shown that there are significant velocity changes in the first kilometer before the confluence [5,10,11,12,13]. During the dry period, the Solimões River arrives the confluence at an 80° angle and with a gradual increase in velocity to 2.5 m·s−1. This velocity then gradually decreases to 2.2 m·s−1. This decrease in velocity at the beginning of the confluence causes a decrease in the velocity of water on the right bank (the Solimões River) and an increase in velocity along the left bank (the Negro River). Because the Solimões River provides the suspended sediments, the decrease in velocity causes sedimentation, especially of coarse sediments.
Remote sensing techniques have been used to determine the spatial and temporal variability of water characteristics, such as suspended sediments, and dissolved organic carbon and chlorophyll, with good results [1,11,14,15,16]. Martinez et al. [14] and Espinoza et al. [15] show that water characteristics influence radiance, depending on particle size and the concentration of material. It is therefore important to calibrate the sensing method with field samples. The spectroradiometer is a good indirect technique for measurement in the field because of ease of operation once it is calibrated [17]. Using Moderate Resolution Imaging Spectroradiometer (MODIS) images, Park and Latrubesse [11] investigated the Solimões-Negro confluence and showed the interrelationship between the white and black waters. That study, however, did not consider a field survey in concomitance with MODIS data obtained at the confluence during the hydrological regime. Szupiany et al. [18] show that the different characteristics of rivers can influence suspended sediments and bed transport. Despite progress made in previous studies in this region using a Doppler current meter to understand hydraulic changes (velocity, bed shear stress, depth) at large confluences, there is a lack of studies that include sediment measurements to help explain and validate the results obtained so far and to better explain the suspended sediment dynamics.
This study provides the scientific community with a data set of five cross sections, with a total of 40 sampling points, to understand the spatial distribution and temporal variability of suspended sediments at the Solimões-Negro confluence during the hydrologic regime. Field data also served to calibrate indirect measurements, such as radiometry and satellite images (MODIS), information that is also important for studies of ecology and geomorphology.

2. Materials and Methods
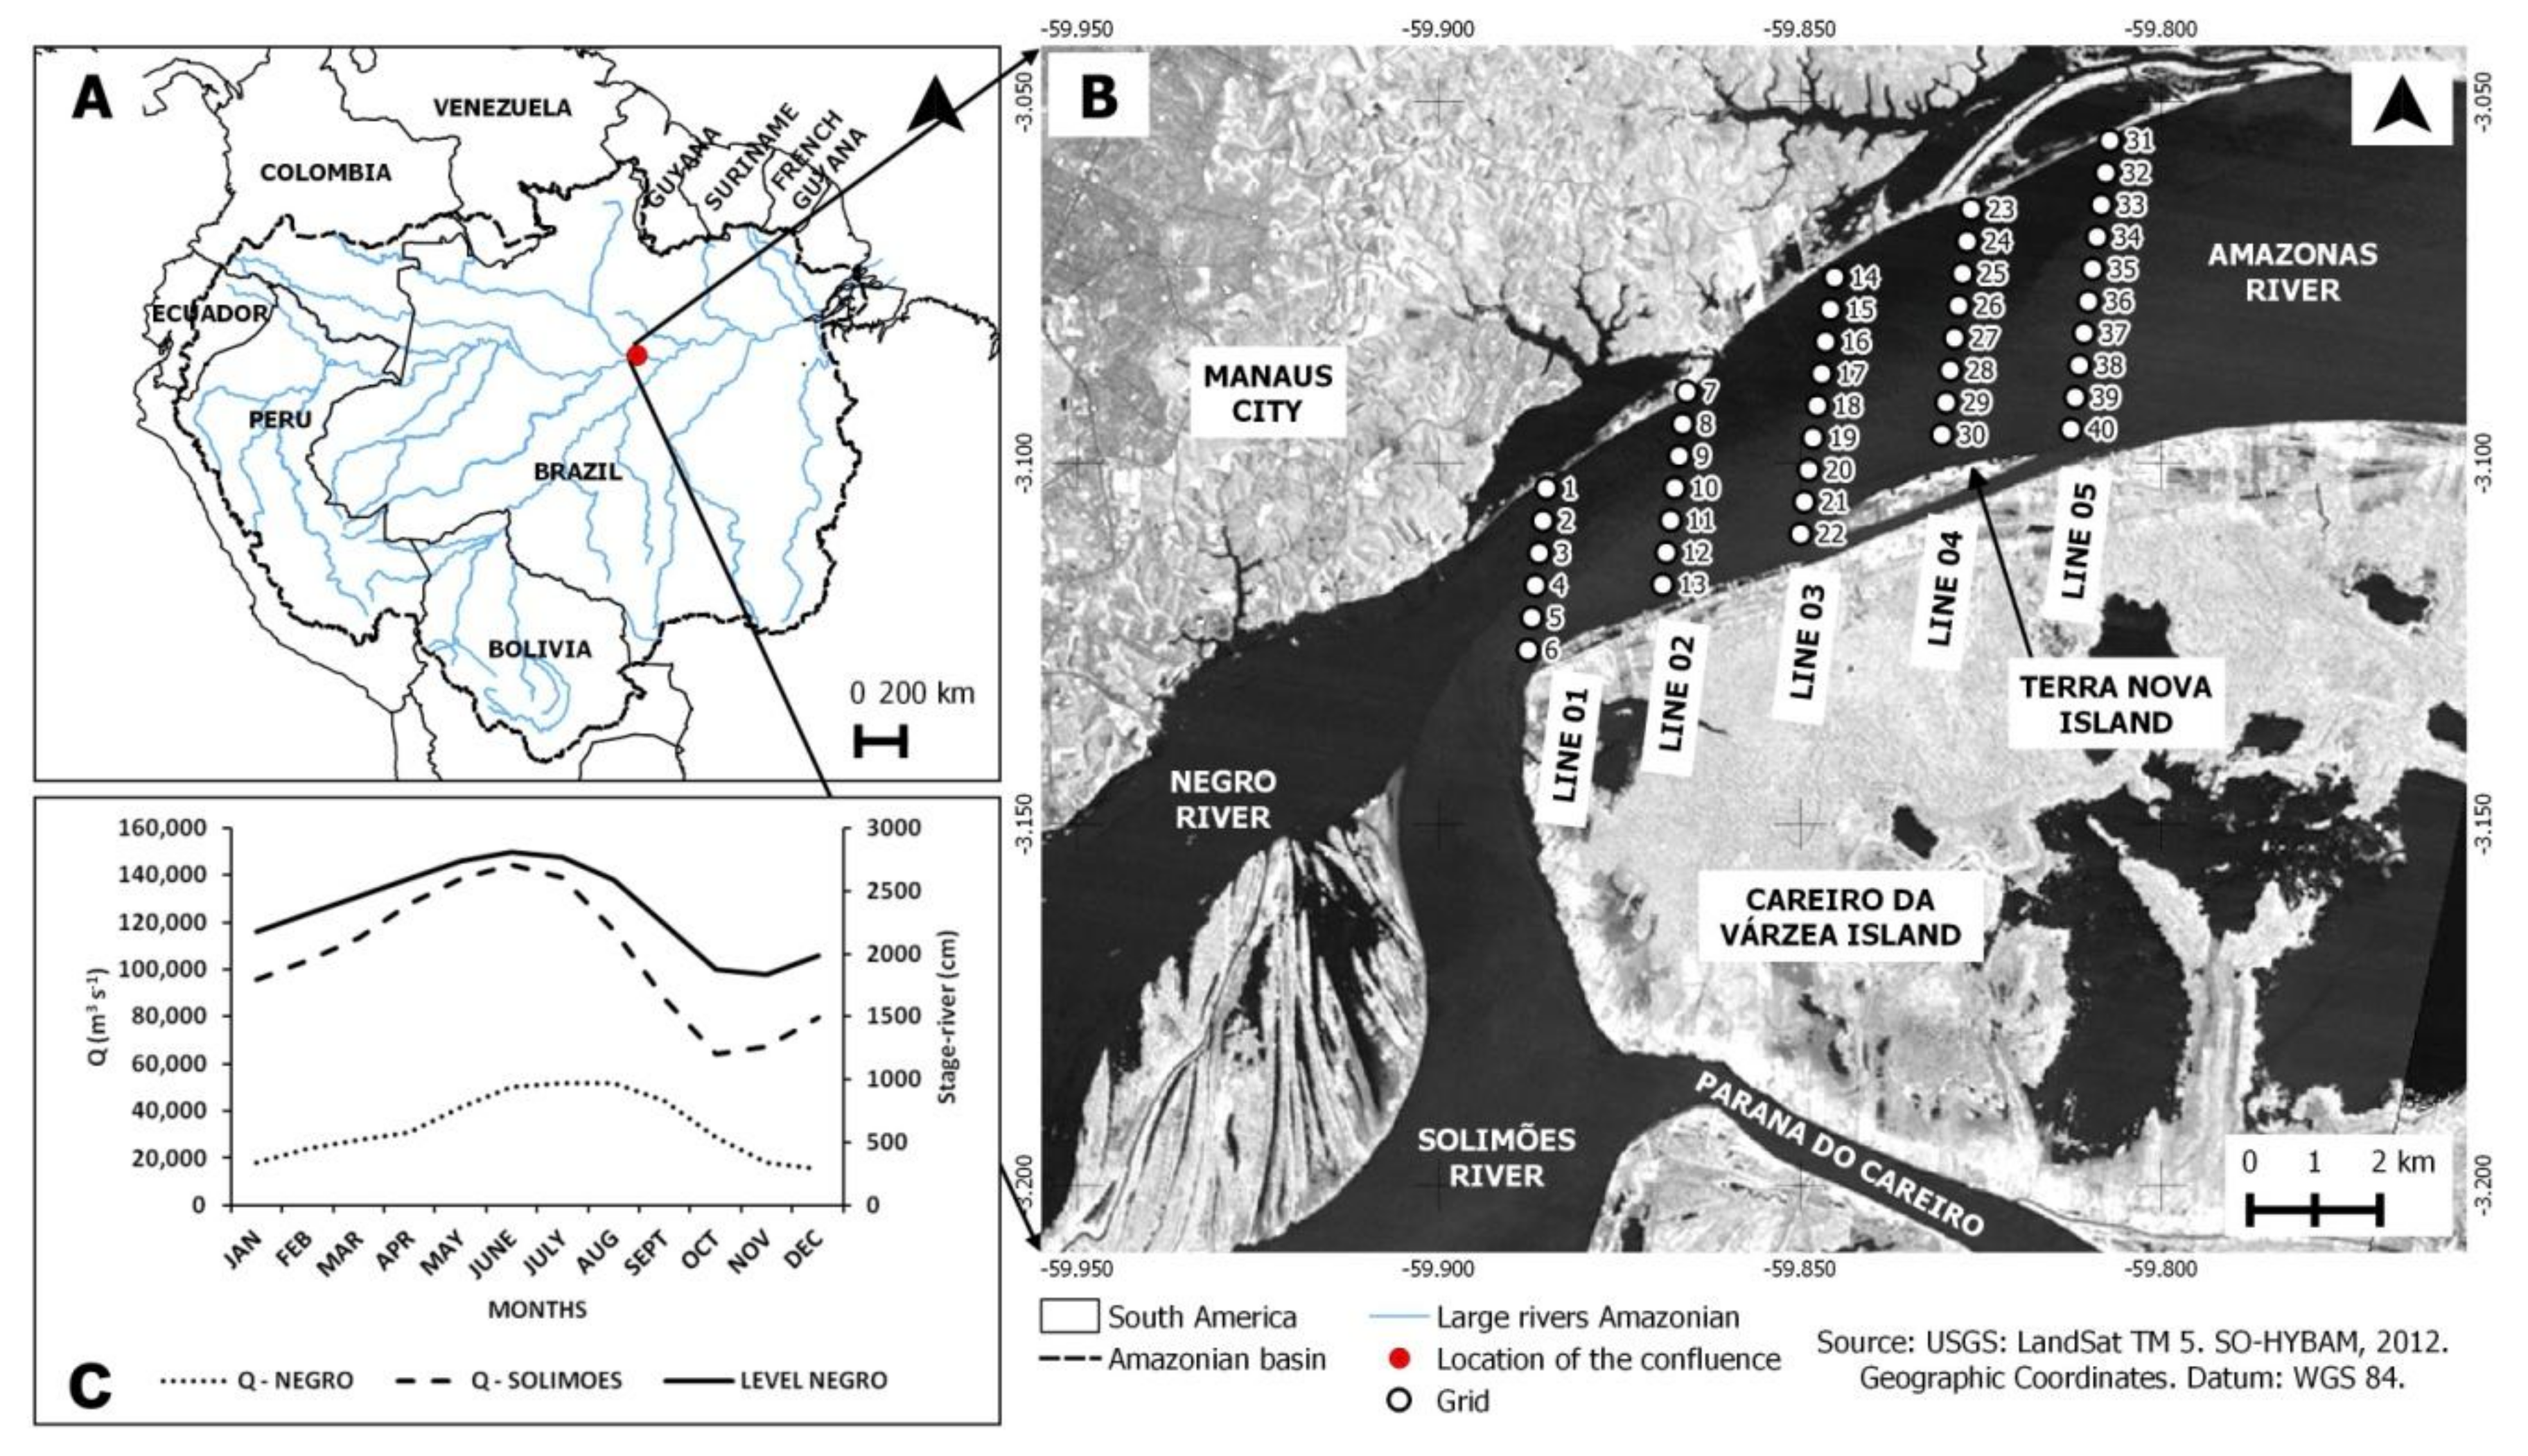
2.1. Study Area

The Solimões River, the name given to the Amazon River from the point where it enters Brazil until its confluence with the Negro River, drains an area of 2,147,740 km2, with a discharge at Manacapuru (the gauging station before the confluence) of 103,000 m3·s−1, and provides approximately 875 Mt·year−1 of suspended sediment flux. In contrast, the Negro River drains an area of 696,810 km2 with a discharge of about 28,400 m3·s−1 and provides an average of 8 Mt·year−1 of suspended sediment flux [19,20].
The monitoring was located 3 km from the beginning of the confluence of the Solimões and Negro rivers, with a length of 10 km and a total area of 80 km2. This area was divided into 5 cross sections spaced 2.5 km apart. Collection points were spaced at 500 m intervals along each line, for a total of 40 points in the gridded area (Figure 1A,B). Monthly samples were taken from May 2013 to February 2014. Figure 1C shows the hydrologic regime of the Solimões registered at the Manacapuru gauging station, located 30 km upstream from the confluence, and the estimation of the hydrological regime of the Negro River. This figure shows that the flood occurs in the Solimões River between May and July and in the Negro River between June and August. The lowest discharges are registered during September and October in the Solimões and between November and December in the Negro River.

2.2. Surface Water Sampling

To determine the Suspended Sediment Concentrations (SSC), 500 mL of surface water were collected by bucket from the boat at each grid point. Each sample was filtered using a 0.45 μm porosity filter following the American Society for Testing and Materials [21] at the Amazonian Potamology Laboratory at the Federal University of the Amazon (Lapa-Ufam).

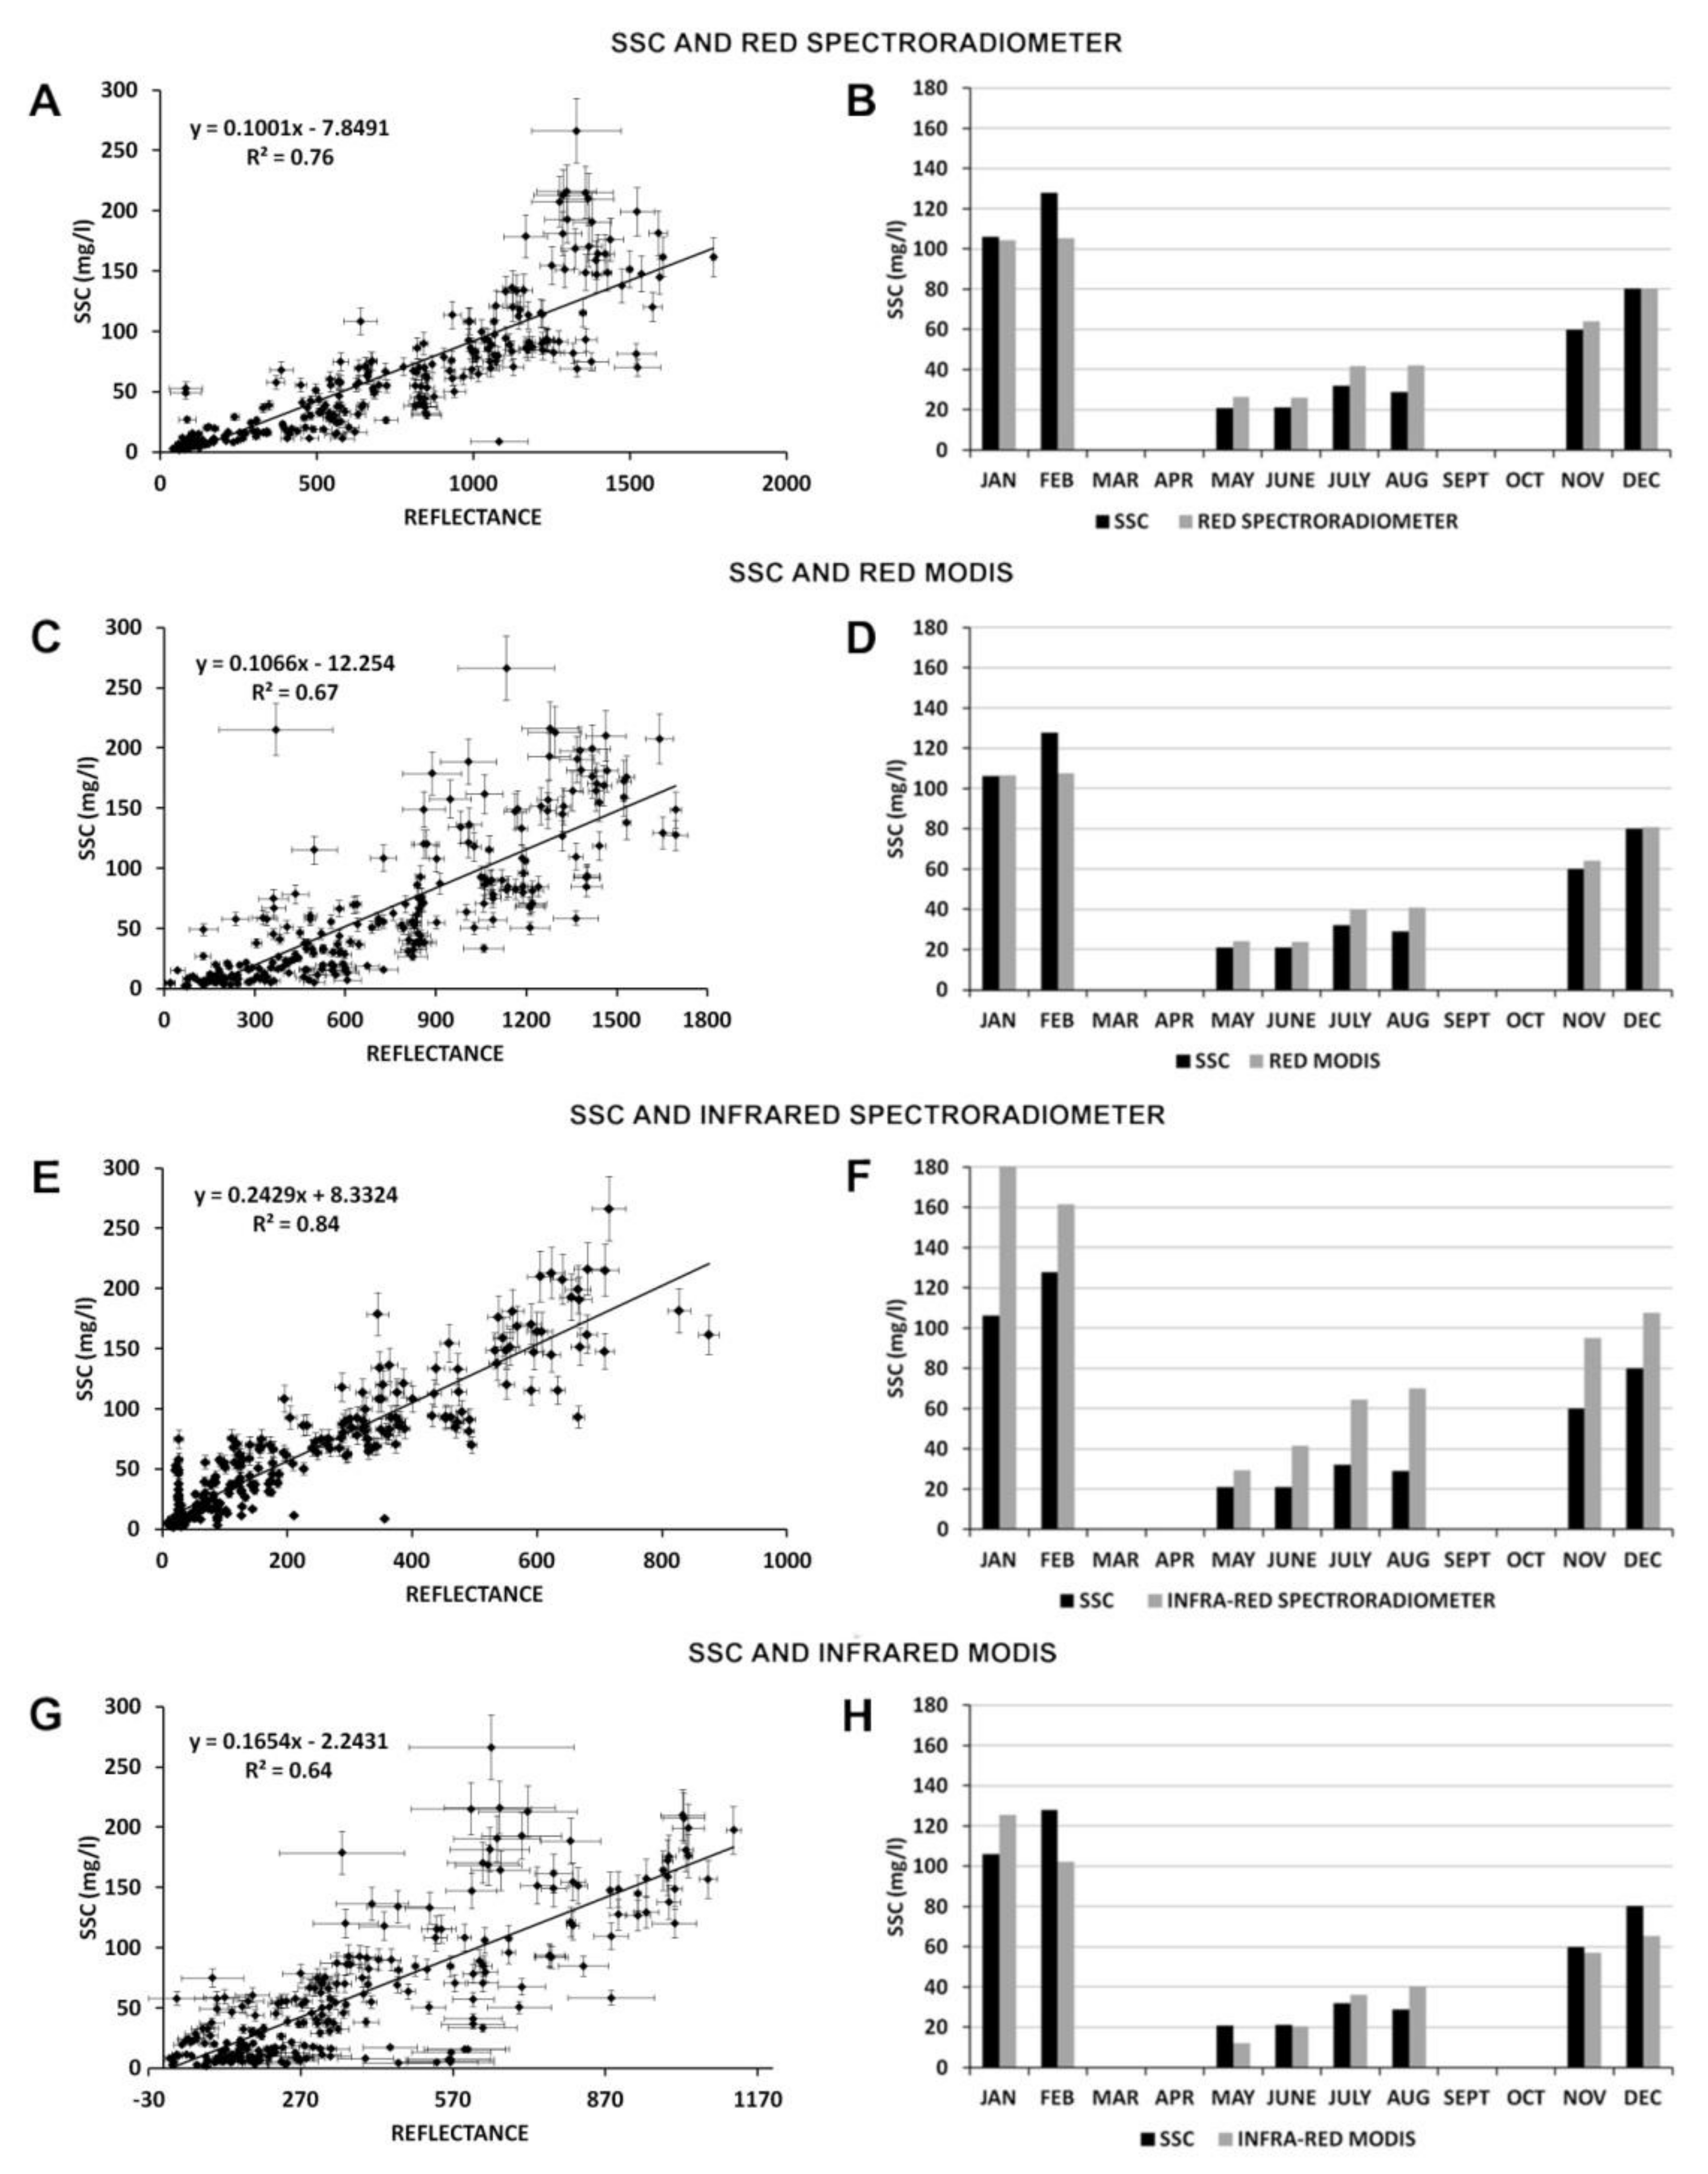
2.3. Spectroradiometer

At each grid point, reflectance data were taken from the surface water using a RAMSES model TriOS spectroradiometer, which operates between the ultraviolet and near-infrared spectral bands. It is composed of three sensors (two for radiance and one for irradiance) positioned outside the water in a geometric spatial distribution. The first measures upward water radiance (Lu) at 30° off nadir; the second, at 30° with the zenith, measures downward radiance from the sky reflected by the water (Ld); and the third, positioned at 90°, measures irradiance arriving at a specific point (Ed). To calculate reflectance, the following Equation (1) was used [15,22]:
Reflectance = (Lu − f × Ld)/Ed,
in which f is a factor that depends on the wavelength size and is used to correct a portion of blue from the sky reflected by the water; 0.028 is generally used, as suggested by [23].

2.4. MODIS (Moderate Resolution Imaging Spectroradiometer)

Two sensors located on Terra (MOD09) and Aqua (MYD09) satellites produce MODIS images; they were downloaded from the NASA website (https://lpdaac.usgs.gov/data_access/data_pool). To preprocess and analyze the monthly images for a period between 2013–2014, the methodology used was the same applied in [15].
Images were selected using ENVI 4.7, re-projected to geographic coordinates and WGS 1984 datum. The quality bands were then analyzed according to the NASA parameters for both products (MOD09 and MYD09). For this study, the 8-day composite images were used because they had better atmospheric results per pixel. When the best images of each month were selected, the values for the gray tones were used for the 40 grid points, and reflectance was analyzed for the red and near-infrared bands.

2.5. Reflectance Calibration

Collected SSC were used to calibrate the reflectance data measured by the spectroradiometer. When the best calibration was found, it was used to estimate SSC through the remote-sensing reflectance. To correlate reflectance measured in the field with MODIS reflectance, band homogenization was needed. This was done because remote-sensing data use one band for red and another for near infrared, while the spectroradiometer measures 16 bands for red and 12 for near infrared. The units were also homogenized by multiplying the spectroradiometer reflectance by (10,000·π), because MODIS data are in area units and the measured reflectance is in stereo-radian units [15].

3. Results and Discussion
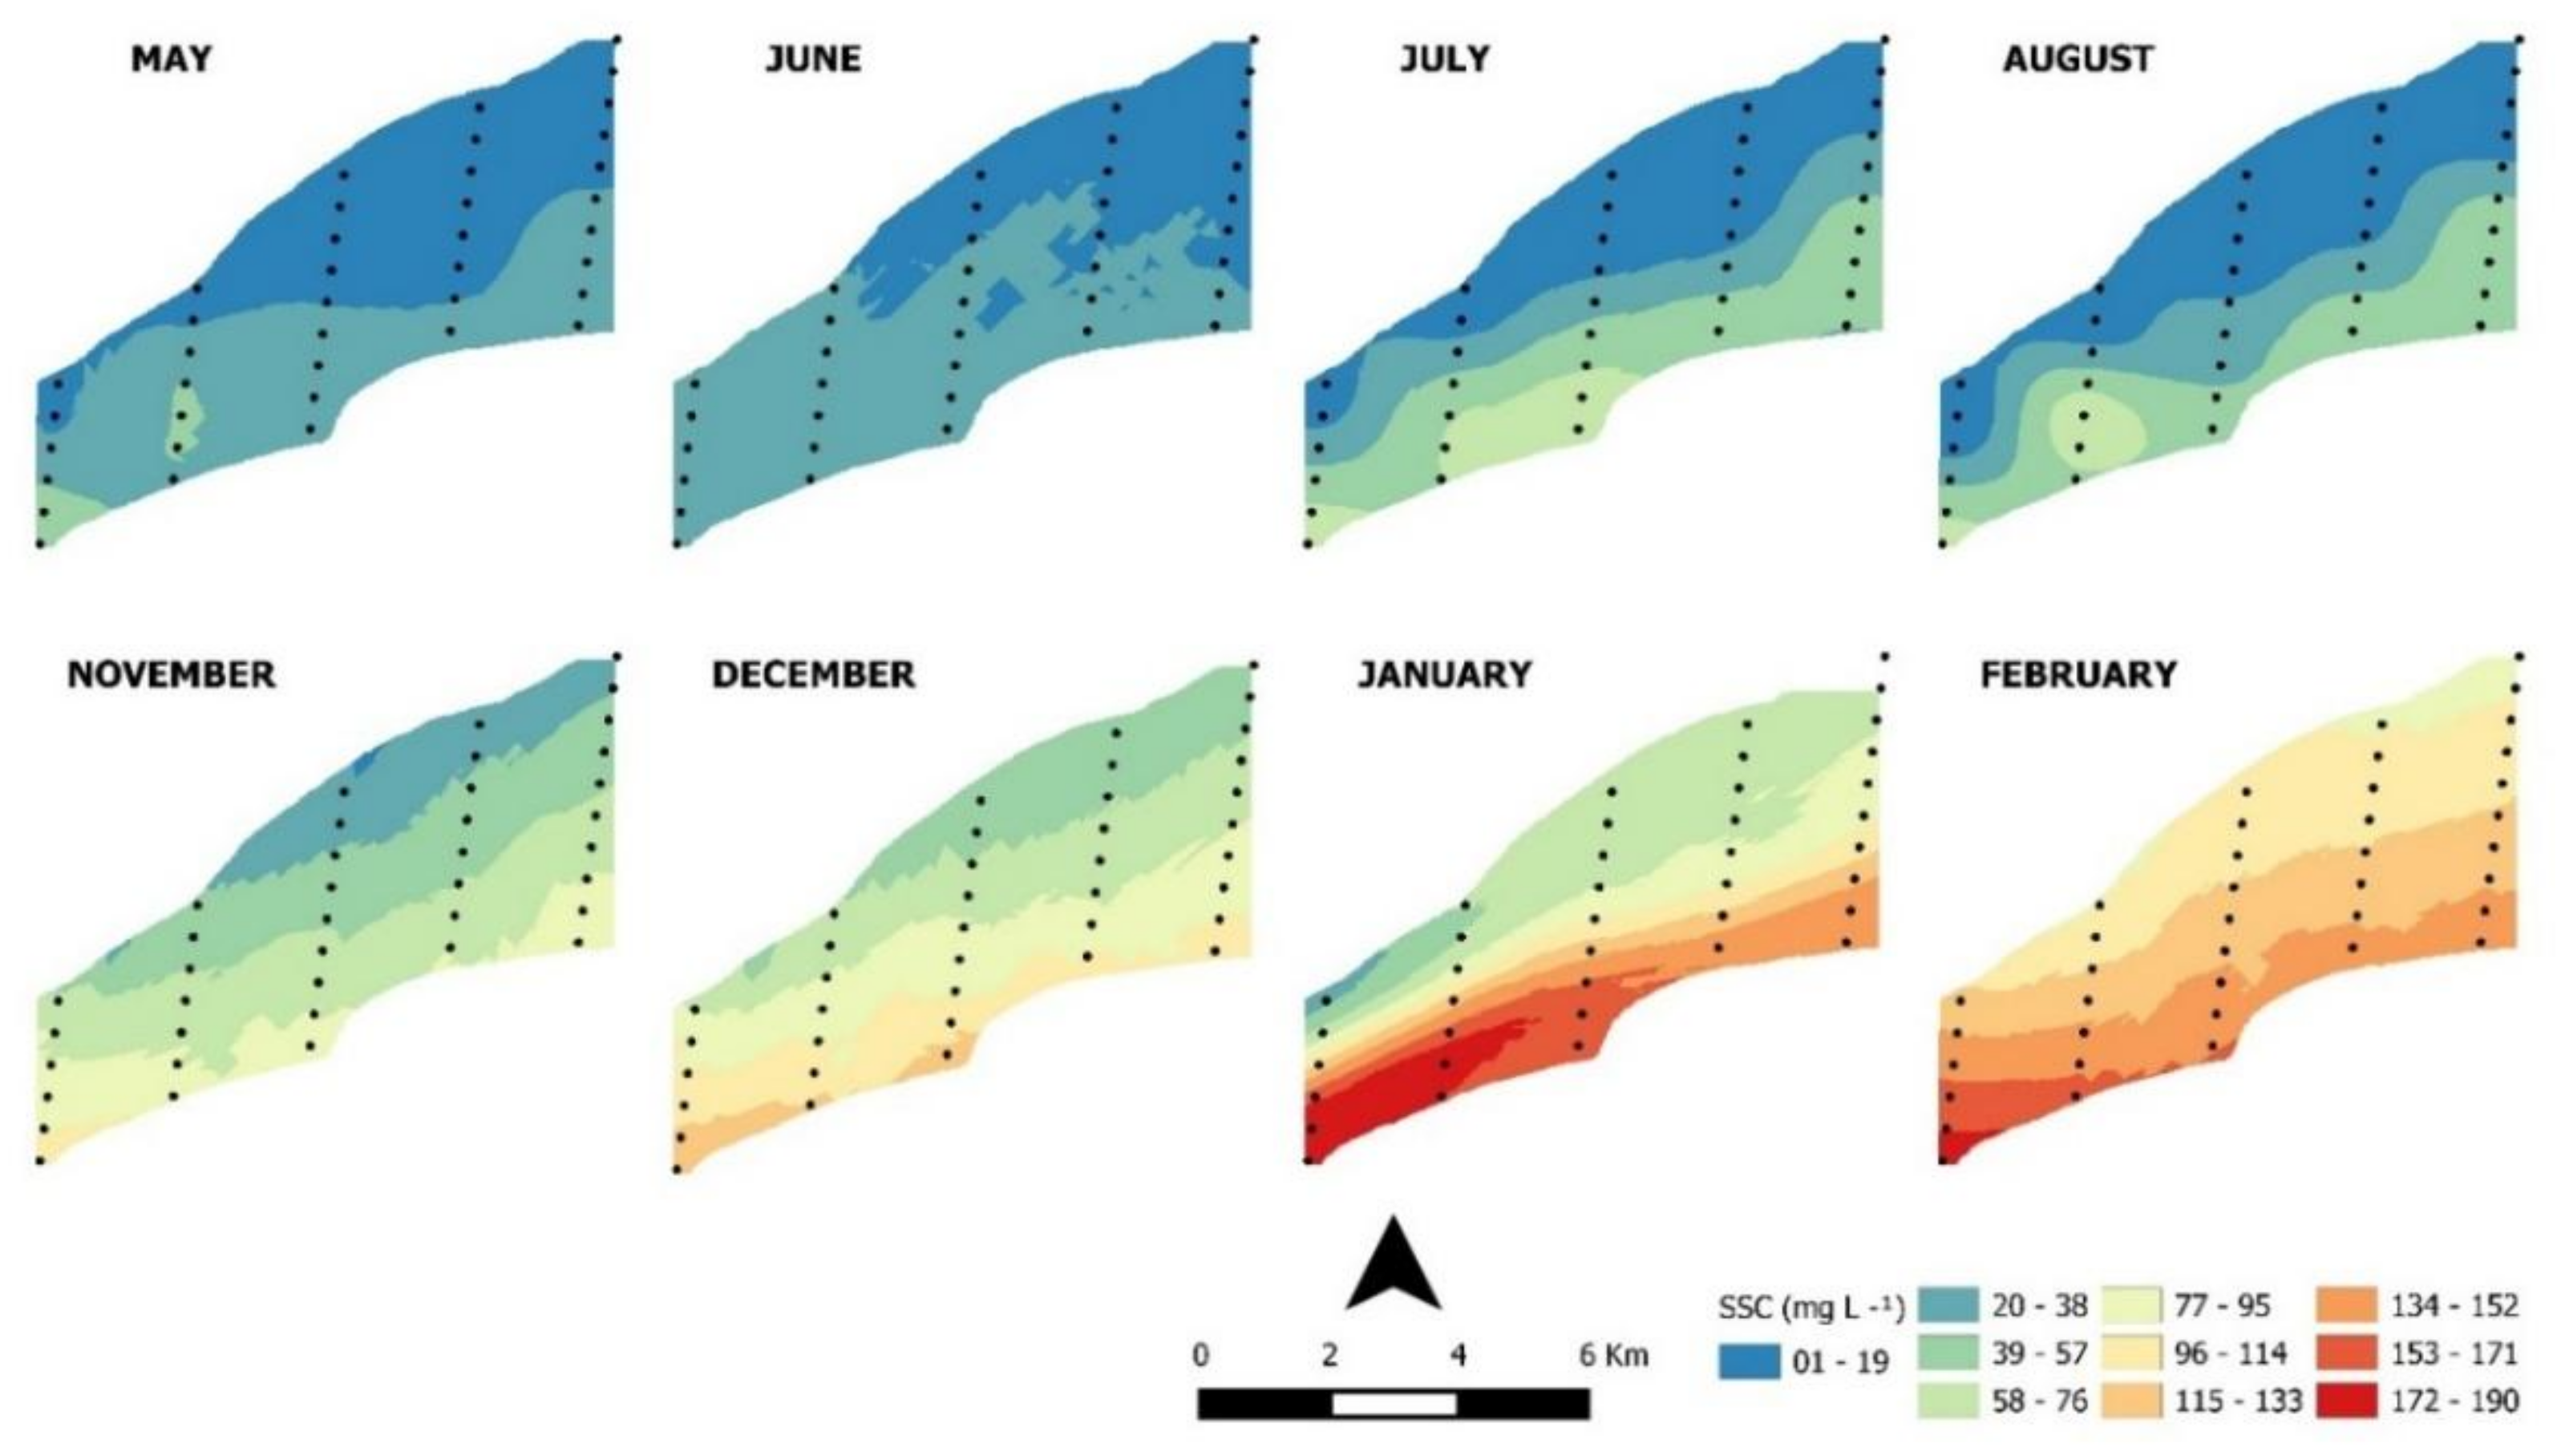
3.1. Water Samples

Table 1 lists the point data set collected monthly in the field during 2013–2014, and Figure 2 shows spatial and temporal variability of SSC. During the flood period between May and August, the SSC value shows less variability (21 to 29 mg·L−1). Nevertheless, the minimum SSC values were registered between June and August; this could be due to two processes: (i) The Solimões River is in a period of greater dilution because of the contribution of tributaries free of suspended sediments [24]; and/or (ii) the Negro River storage space expands in a north-south direction at the confluence, further strengthening the dilution process in this area.
In the rising period, between November and February, the SSC increased twofold (60 to 128 mg·L−1). During this period, the Solimões River is dominant and expands in a south-north direction, pushing the black waters of the Negro River to the left bank, with black waters disappearing from the surface level in some areas. This dominance was also described by [11]. The processes of expansion and retraction of the two rivers in terms of SSC values can be understood from the dynamics of the hydrological regime of the Solimões and Negro River system. The discharge of waters from the Negro River is one-third that of waters from the Solimões River, and its backwater effect (natural dam caused by a main river over other minor before the confluence) starts in December and lasts for eight months [25]. This observation is evident from the water level at the Manaus gauging station on the Negro River. Its values follow the Solimões hydrological regime, and only during July to November does the water level correspond to the discharge of the Negro River (Figure 1C).
Park and Latrubesse show the same temporal and spatial variability, but do not show SSC values greater than 100 mg·L−1. This is because their study was conducted in April, June and September, and we observed that SSC peaks occur between January and February. It is also important to observe the transition period between the falling and rising periods (November and December). During these months, Solimões River dominance begins, as indicated by Gualtiere et al. [6], as the velocity begins to increase. This is an important fish spawning period.

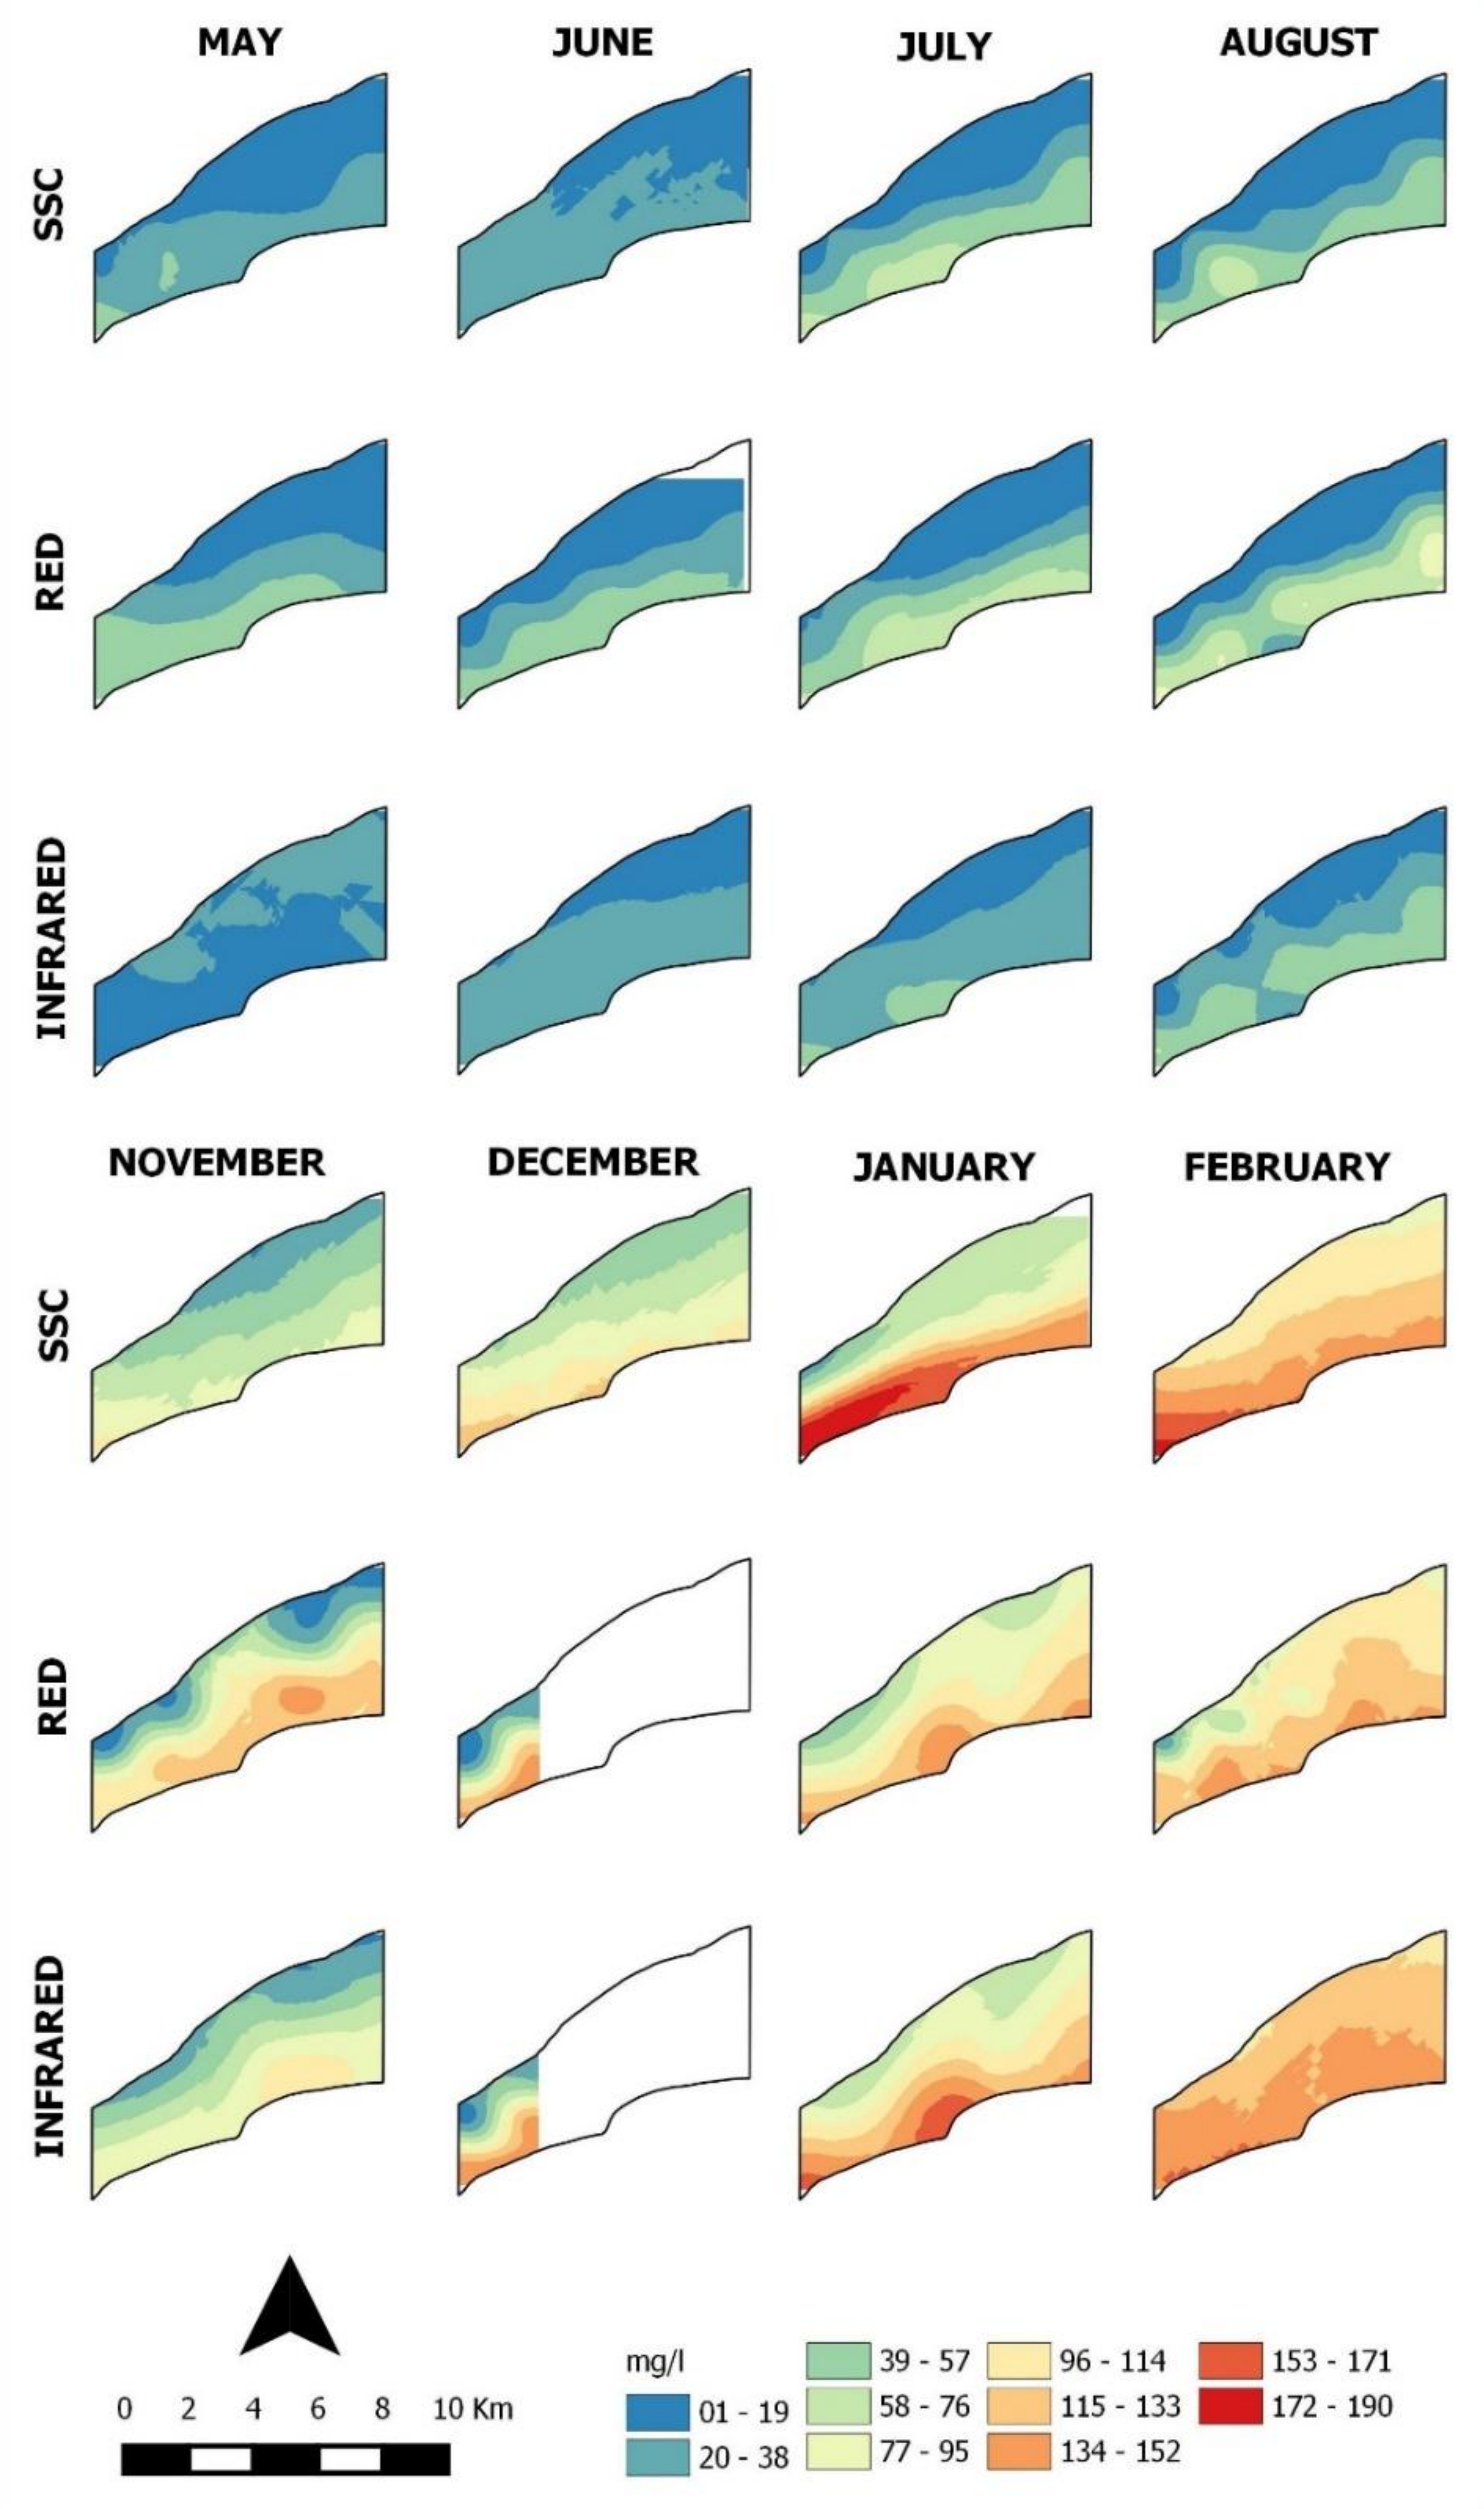
3.2. Estimates of Suspended Sediment Concentration: Spatial Spectrometry Using MODIS Images

There is a relationship between SSC and reflectance (R2 = 0.76 for red and R2 = 0.84 for near infrared), however, the best relationship between SSC and reflectance is obtained with the spectroradiometer that directly with the MODIS images, this happens because the MODIS’s reflectance is the average of eight daily images, while the spectroradiometer‘s is obtained in the field in the same temp that is take the sampling. In the red band, it was observed that as of 100 mg·L−1 there is a wider dispersion between the SSC and spectroradiometer’s reflectance. So, this means the reflectance is above the saturation. This observation is valid to MODIS’ reflectance (Figure 3A,C). In this case, others studies [14,15,17,22,26] suggest using the infrared band, SSC exceeding 100 mg·L−1, in the confluence area, would be for the period from January to February (Figure 3E,G).
Estimates of SSC from MODIS images were made using the equation generated from the correlation of SSC values and reflectance measured by both spectroradiometer and MODIS. In the infrared band, the average monthly values calculated from reflectance are quite good for both the MODIS images and the spectroradiometer, especially during the May to December period, when SSC concentrations are below the threshold (Figure 3B,D). In the near-infrared band, MODIS overestimates SSC values, including for the months of January and February (Figure 3F,H). This could be related to the different discharge and SSC values in the confluence. Another factor that could influence those differences is atmospheric correction; the spectroradiometer sensors are installed a few meters above the water surface and are not affected by the atmosphere, but satellite data depend on favorable atmospheric conditions. This creates a need for complex corrections, which are integrated into the images used (products MOD09 and MYD09). The positive robustness of the atmospheric corrections of the MODIS sensors is well recognized [26]. In situations of low reflectance, however, such as backscattering from water in the near infrared, the accuracy of the corrections is reduced. Another factor that can generate noise by the response in the near infrared is the adjacency process that causes light photons from the edges (forest and urban zone) to mix with photons from the water surface. This process generates noise, particularly in a situation of low reflectance, which can change the reflectance values of the satellite over water. In addition, while the spectroradiometer captures the reflectance value at a specific point, the correlation is done using the reflectance value of the pixels of the MODIS images that have dimensions of 250 m × 250 m. These dimensions had never been a problem for previous works, because the methodology considered a single point in the center of the channel where the zone is reasonably homogeneous [26].
To assess SSC variability in the Solimões-Negro confluence, it was necessary to consider the hydrological period and concentration values due to the saturation of the red band. Because of lower concentrations between May and December, the red band equation was used for that period, while the equation for the near-infrared band was used during the high-concentration months of January and February. Figure 4 shows interpolated SSC values from sampling and MODIS image estimates to red and near infrared. MODIS data for December are incomplete because of atmospheric conditions. From June to August, on the surface, the Negro River takes on a larger portion of the left bank, while the right bank is dominated by the Solimões/Amazon. In contrast, from January to February, the surface of the confluence behaves like a white water River only; during this period, the confluence is controlled by the Solimões River, which changes flow direction due to an increase in velocity that may exceed 2 m·s−1 in the months of April/May [5].

4. Conclusions

By taking monthly measurements during the hydrological year, the spatial and temporal variability of suspended sediments could be determined at the Solimões-Negro confluence. This is a contrast zone of suspended sediments that depends on the greater or lesser influence of its tributaries. Between January and February, the Solimões River dominates the confluence, while in July to August, the confluence presents characteristics of black waters.
This study shows that after calibration in situ, reflectance is a good tool for following spatial and temporal variability in a confluence where there are black and white waters. The MODIS images show a larger variance than the spectroradiometer, due to resolution and because the MODIS result is an average of eight daily images. The MODIS images have resolution problems during the rainy months due to low visibility; this period coincides with the peaks of suspended sediments.
It was necessary to consider the red band saturation; the near-infrared band should be used for high concentrations and the red band for lower concentrations.
These results provide important information for understanding others studies that examine aquatic life at the confluence of rivers.

Author Contributions

Conceptualization, T.M., N.F., J.-M.M. and E.A.; Methodology, N.F. and J.-M.M.; Validation, N.F. and J.-M.M.; Formal Analysis, T.M. and A.N.; Investigation, T.M.; Writing-Review & Editing, T.M., N.F., E.A.; Funding Acquisition, N.F.

Funding

This research was funded by CNPq (the National Council for Scientific and Technological Development) and FINEP (Brazilian company of innovation and research) by following projects: IHESA (Spatial Hydrology Initiative in the Amazon) and FLUMAS (Flow of Matter in the Solimões-Amazonas System: factors of control and morphodynamic functioning of the Holocene to the present day).

Acknowledgments

We would like to thank Research Group H2A (Hydrology and Human in the Amazon) at the Federal University of Amazonas (UFAM) and SO-HYBAM Observatory.

Conflicts of Interest

The authors declare no conflict of interest.

References

  1. Espinoza, R.; Martinez, J.M.; Armijos, E.; Espinoza, J.C.; Filizola, N.; Dos Santos, A.; Willems, B.; Fraizy, P.; Santini, W.; Vauchel, P. Spatio-temporal monitoring of suspended sediments in the Solimões River (2000–2014). C. R. Geosci. 2017, 350, 4–12. [Google Scholar] [CrossRef]
  2. Latrubesse, E.; Stevaux, J.; Sinha, R. Tropical Rivers. Geomorphology 2005, 70, 187–206. [Google Scholar] [CrossRef]
  3. Maurice-Bourgoin, L.; Quemerais, B.; Moreira-Turcq, P.; Seyler, P. Transport, distribution and speciation of mercury in the Amazon River at the confluence of black and white waters of the Negro and Solimoes Rivers. Hydrol. Process. 2003, 17, 1405–1417. [Google Scholar] [CrossRef]
  4. Filizola, N.; Spínola, N.; Arruda, W.; Seyler, F.; Calmant, S. The Rio Negro and Rio Solimões confluence point—Hydrometric observations during the 2006/2007 cycle. In River, Coastal, Estuarine Morphodynamics: RCEM-2009; Vionnet, C., Garcia, M.H., Latrubesse, E.M., Perillo, G.M.E., Eds.; Taylor & Francis Group: London, UK, 2009; Volume 2, pp. 1003–1006. ISBN 978-0-415-55426-8. [Google Scholar]
  5. Gualtieri, C.; Filizola, N.; de Oliveira, M.; Santos, A.; Ianniruberto, M. A field study of the confluence between Negro and Solimões Rivers. Part 1: Hydrodynamics and sediment transport. C. R. Geosci. 2018, 350, 31–42. [Google Scholar] [CrossRef]
  6. Gualtieri, C.; Ianniruberto, M.; Filizola, N.; Ventura Santos, R.; Endreny, T. Hydraulic complexity at a large River confluence in the Amazon Basin. EcoHydrology 2017, 10, e1863. [Google Scholar] [CrossRef]
  7. Leite, R.; Silva, J.; Freitas, C. Abundância e distribuição das larvas de peixes no Lago Catalão e no encontro dos rios Solimões e Negro, Amazonas, Brasil. Acta Amaz. 2006, 36, 557–562. [Google Scholar] [CrossRef]
  8. Armijos, E.; Crave, A.; Espinoza, R.; Fraizy, P.; Santos, A.; Sampaio, F.; Oliveira, E.; Santini, W.; Martinez, J.-M.; Autin, P.; et al. Measuring and modeling vertical gradients in suspended sediments in the Solimões/Amazon River. Hydrol. Process. 2016, 31, 654–667. [Google Scholar] [CrossRef]
  9. Stevaux, J.; Franco, A.; Etchebehere, M.; Fujita, R. Flow structure and dynamics in large tropical River confluence: Example of the Ivaí and Paraná Rivers, southern Brazil. Geociências 2009, 28, 5–13. [Google Scholar]
  10. Laraque, A.; Guyot, J.-L.; Filizola, N. Mixing processes in the Amazon River at the confluences of the Negro and Solimões River, Encontro das Águas, Manaus, Brazil. Hydrol. Process. 2009, 23, 3131–3140. [Google Scholar] [CrossRef]
  11. Park, E.; Latrubesse, E. Surface water types and sediments distribution patterns at the confluence of mega Rivers: The Solimões-Amazon and Negro Rivers junction. Water Resour. Res. 2015, 51, 6197–6213. [Google Scholar] [CrossRef]
  12. Trevethan, M.; Martinelli, A.; Oliveira, M.; Ianniruberto, M.; Gualtieri, C. Fluid mechanics, sediment transport and mixing about the confluence of Negro and Solimoes Rivers, Manaus, Brazil. In Proceedings of the 36th IAHR World Congress, Hague, The Netherlands, 28 June–3 July 2015. [Google Scholar]
  13. Trevethan, M.; Santos, R.; Ianniruberto, M.; Oliveira, M.; Martinelli, A.; Gualtieri, C. Influence of tributary water chemistry on hydrodynamics and fish biogeography about the confluence of Negro and Solimoes River, Brazil. In Proceedings of the 11th International Symposium on Ecohydraulics, Melbourne, Australia, 7–12 February 2016. [Google Scholar]
  14. Martinez, J.-M.; Guyot, J.-L.; Filizola, N.; Sondag, F. Increase in suspended sediment discharge of the Amazon River assessed by monitoring network and satellite data. Catena 2009, 79, 257–264. [Google Scholar] [CrossRef]
  15. Espinoza, R.; Martinez, J.M.; Texier, M.; Guyot, J.-L.; Fraizy, P.; Menezes, P.; Oliveira, E. A study of sediment transport in the Madeira River, Brazil, using MODIS remote-sensing images. J. S. Am. Earth Sci. 2013, 44, 45–54. [Google Scholar] [CrossRef]
  16. Park, E.; Latrubesse, E. Modeling suspended sediment distribution patterns of the Amazon River using MODIS data. Remote Sens. Environ. 2014, 147, 232–242. [Google Scholar] [CrossRef]
  17. Santos, A.; Filizola, N.; Martinez, J.-M.; Armijos, E.; Alves, L. Purus River suspended sediment variability and contributions to the Amazon River, from satellite data (2000–2015). C. R. Geosci. 2018, 350, 13–19. [Google Scholar] [CrossRef]
  18. Szupiany, R.; Amsler, M.; Parsons, D.; Best, J. Morphology, flow structure, and suspended bed sediment transport at two large braid-bar confluences. Water Resour. Res. 2009, 45, 1–19. [Google Scholar] [CrossRef]
  19. Sioli, H. Studies in Amazonian Waters; Limnologia; Atlas do Simpósio sobre a Biota Amazônica: Rio de Janeiro, Brasil, 1967; Volume 3, pp. 9–50. [Google Scholar]
  20. Molinier, M.; Guyot, J.-L.; Oliveira, E.; Guimarães, V.; Chaves, A. Hidrologia da bacia do rio Amazonas. Contacto 1994, 6, 31–36. [Google Scholar]
  21. ASTM Internacional. Standard Test Method for Dynamic Young’s Modulus, Shear Modulus, and Poisson’s Ratio by Impulse Excitation of Vibration; ASTM Internacional: West Conshohocken, PA, USA, 2003; pp. 1876–1878. [Google Scholar]
  22. Espinoza, R.; Martinez, J.M.; Guyot, J.-L.; Fraizy, P.; Armijos, E.; Crave, A.; Bazán, H.; Vauchel, P.; Lavado, W. The integration of field measurements and satellite observations to determine River solid loads in poorly monitored basins. J. Hydrol. 2012, 444–445, 221–228. [Google Scholar] [CrossRef]
  23. Mobley, C. Estimation of the remote-sensing reflectance from above-surface measurements. Appl. Opt. 1999, 38, 42–55. [Google Scholar] [CrossRef]
  24. Armijos, E. Propagação dos Fluxos de Sedimentos em Suspensão do Rio Amazonas-Trecho Tamshiyacu (Peru) até Óbidos (Brasil)-Variabilidade Espacial e Temporal. Ph.D. Thesis, Instituto Nacional de Pesquisas da Amazônia, Manaus, Brazil, Universidade Estadual de Amazonas e Universidade Paul Sabatier, Toulouse, France, 2015. [Google Scholar]
  25. Meade, R.; Rayol, J.; Conceição, S.; Natividade, J. Backwater effects in the Amazon River basin of Brazil. Environ. Geol. Water Sci. 1991, 18, 105–114. [Google Scholar] [CrossRef]
  26. Martinez, J.-M.; Espinoza, R.; Armijos, E.; Moreira, L. The optical properties of River and floodplain waters in the Amazon River Basin: Implications for satellite-based measurements of suspended particulate matter. J. Geophys. Res. Earth Surf. 2015, 120, 1274–1287. [Google Scholar] [CrossRef]
Figure 1. (A) Amazon Basin, confluence location, (B) Solimões-Negro confluence and grid of sampling points, (C) Inter-annual mean monthly discharge in the Negro River, obtained from the difference between the Amazon River and Solimões River, Solimões River at Manacapuru gauging station (SO-HYBAM www.ore-hybam.org), and Negro River water level at the Manaus gauging station (Porto de Manaus www.portodemanaus.com.br).
Geosciences 08 00265 g001
Figure 2. Temporal variation of Suspended Sediment Concentrations (SSC) by interpolation of monthly SSC grid point values.
Geosciences 08 00265 g002
Figure 3. To red band: (A) Relationship between reflectance and SSC for spectroradiometer; (B) Mean monthly of SSC obtained by MODIS image to red band; (C) Relationship between reflectance and SSC for MODIS image; (D) Mean monthly of SSC obtained by MODIS image to red band; To infrared band: (E) Relationship between reflectance and SSC for spectroradiometer; (F) Mean monthly of SSC obtained by MODIS image to infrared band; (G) Relationship between reflectance and SSC for MODIS image; (H) Mean monthly of SSC obtained by MODIS image to infrared band.
Geosciences 08 00265 g003
Figure 4. Interpolate SSC values from samples and red and infrared bands of MODIS image.
Geosciences 08 00265 g004
Table 1. Values of Suspended Sediment Concentrations (SSC) obtained in the field every month during the 2013–2014 period. Geographic coordinates and data are in WGS 1984.
PointsLatitudeLongitudeSSC (mg·L−1)
20132014
MayJuneJulyAugustNovemberDecemberJanuaryFebruary
01−3.10351−59.8851122124471614
02−3.10799−59.885592273451767
03−3.11246−59.8861232010995115215
04−3.11693−59.8866258597038179198208213
05−3.12140−59.8871258336455137181210216
06−3.12589−59.8876647335870134176199193
07−3.09014−59.8656958-108413798
08−3.09459−59.86626156108221610979
09−3.09903−59.8667411917171871312
10−3.10346−59.8673475615158120121189266
11−3.10793−59.867923844768693159172191
12−3.11238−59.868515030404692138176182
13−3.11683−59.8690328376361108120149152
14−3.07429−59.845234611136426596
15−3.07873−59.84581767964469106
16−3.08318−59.846469775165778108
17−3.08762−59.84700171088458580133
18−3.09205−59.847611618291987347190
19−3.09650−59.848212956673887149162169
20−3.10093−59.848812531373183152162171
21−3.10537−59.849413315713782140156164
22−3.10981−59.8499333117553----
23−3.06486−59.82632649988356895
24−3.06930−59.82687427969336489
25−3.07375−59.827518551613396891
26−3.07821−59.828058661138447693
27−3.08269−59.828611212101346517185
28−3.08714−59.8292211511729705168116
29−3.09161−59.82977212156418259110147
30−3.09607−59.830372530535575130158148
31−3.05534−59.80712478107396186
32−3.05980−59.80768548616426383
33−3.06424−59.8083053141016467089
34−3.06869−59.808889721767509394
35−3.07313−59.8095011162716938084113
36−3.07760−59.81009202439531188592114
37−3.08200−59.8107058205651909394134
38−3.08646−59.811342215564469119155151
39−3.09091−59.811912419557085128149164
40−3.09533−59.812512421273289127145157
AVERAGE212132296080106128

