1. Introduction
The way we breathe is influenced by several factors, such as lung mechanics, neurological drive, and emotional status [
1]. Changes in lung ventilation are achieved via changes in breathing rate, regularity, and depth [
2]. In the presence of lung disease when lung mechanics are altered, the airflow profile is also altered [
3]. In obstructive lung disease, such as chronic obstructive disease (COPD) and cystic fibrosis, the change in expired airflow profile is linked to the severity of the airway obstruction [
4,
5,
6,
7]. In idiopathic pulmonary fibrosis (IPF), a largely restrictive disease, tidal breathing is altered via an increase in minute volume,
, with the increase in
being met by an increased tidal volume rather than breathing rate [
8,
9]. In IPF, the airflow flow profile is also characterised by an increase in peak inspired and expired flow [
9]. These parameters provide an insight into how breathing changes with disease but fail to provide unique time or flow characteristics of the airflow signal.
The aim of this study is to use unsupervised hierarchal cluster analysis on data sets of tidal breathing airflow profiles in people with and without IPF. The advantages of these data mining methods are that they can distinguish any post-priori patterns in the airflow profiles. This is in comparison to supervised learning techniques such as naive Bayesian and decision tree techniques, which assume a priori classification of the data and identification of its key attributes [
10]. The clusters of patterns defined by hierarchal cluster analysis once identified can be compared for their biological characteristics. Cluster analysis has been used to identify phenotypes in asthma, but this is the first time it has been applied to respiratory breathing patterns [
11].
2. Methods
2.1. Subjects
Thirty-one patients with a diagnosis of IPF attending the Cardiff Interstitial Lung Diseases Clinic and 17 healthy, age-matched, non-smoking controls were recruited for a study investigating breathing patterns [
9]. The study was approved by the South East Wales Regional Ethics Committee (REC reference number: 13/WA/0200). The Faculty of Life Sciences and Education ethics committee, University of South Wales, approved the protocol for the control group. Informed written consent was provided by all participants in the study.
2.2. Pulmonary Function Testing
The tidal breathing and pulmonary function tests were performed using Jaeger Masterscreen Systems PFT suite (Carefusion, UK). All tests were performed with the subject seated whilst wearing nose-clips. Whilst breathing for two minutes through a mouthpiece, connected in series to a bacterial filter and pneumotach, tidal airflow was collected (at 100 Hz).
The severity of the IPF was categorised into three stages (1: mild,
n = 10; 2: moderate
n = 12; 3: severe,
n = 9) based on gender (G), age (A), and physiological variables (P) (Forced Vital Capacity %predicted and TLCO %predicted) using the GAP index [
9,
12].
2.3. Hierarchal Cluster Analysis
From each participant’s tidal breathing recording, the last 10% and first 20% were removed, and the reaming recording was conditioned and smoothed using a running average of 200 ms, enabling each breath to be defined and isolated. The extraordinary breaths, either larger or smaller that fell outside one standard deviation of the recording being analysed were discarded. Each of the remaining breaths were normalised by time and a single mean breath was then derived for each participant (n = 48); these single breaths were used in all further analyses.
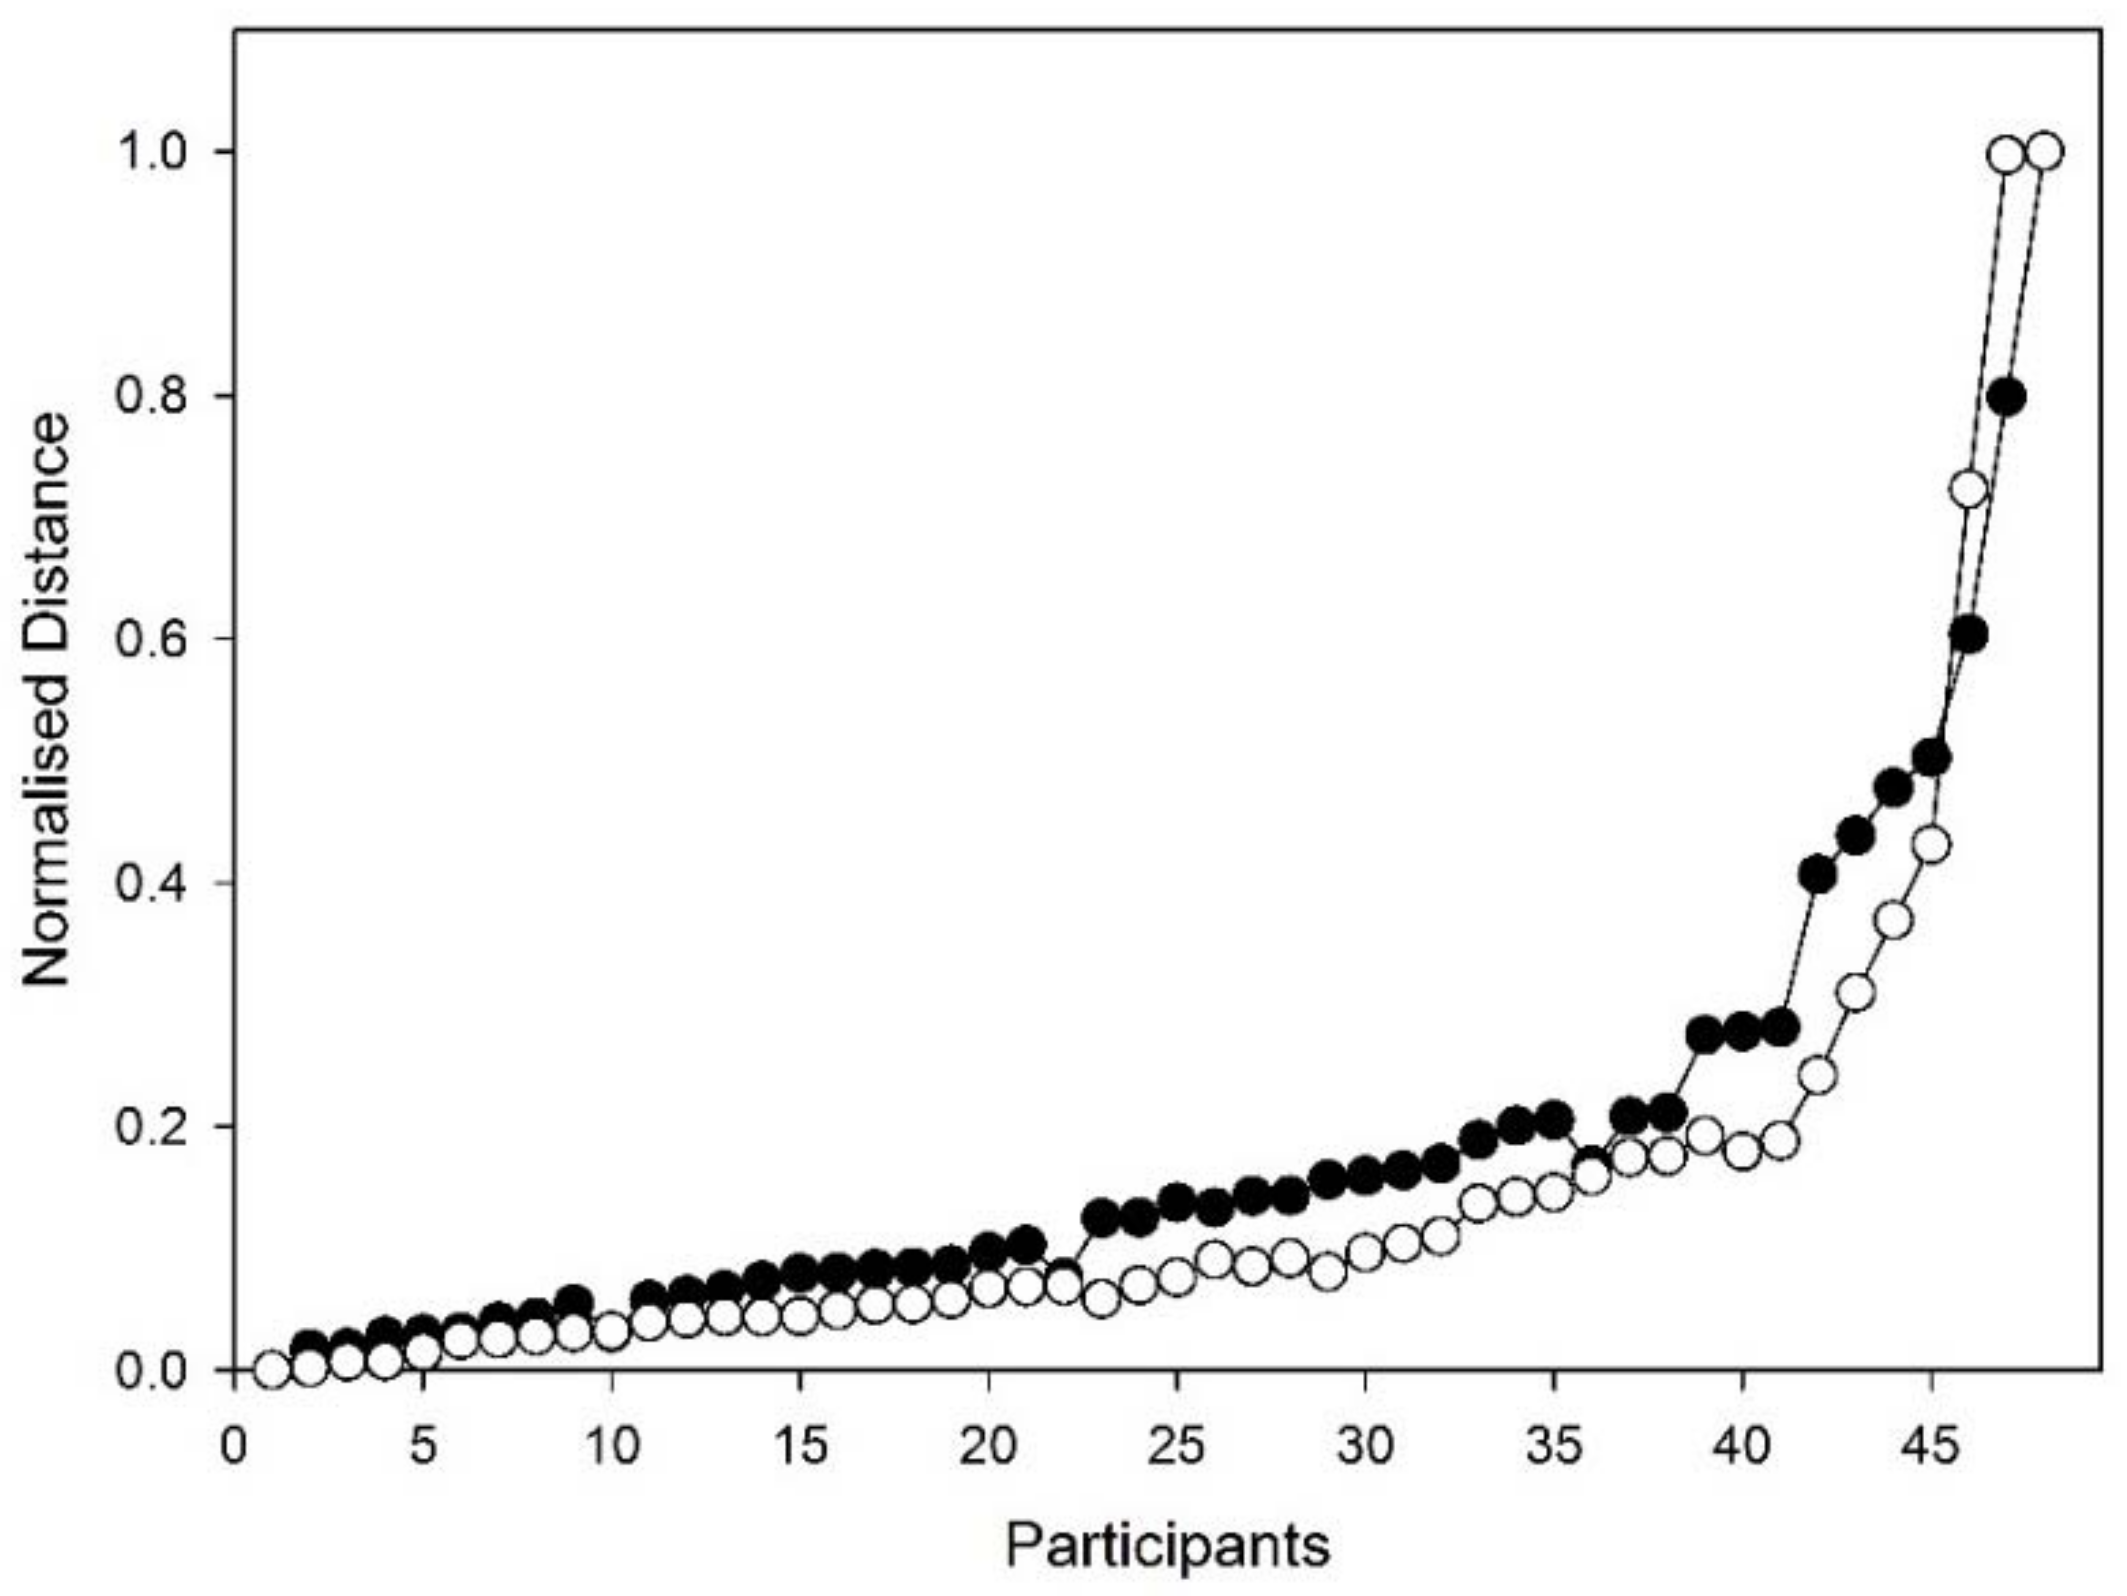
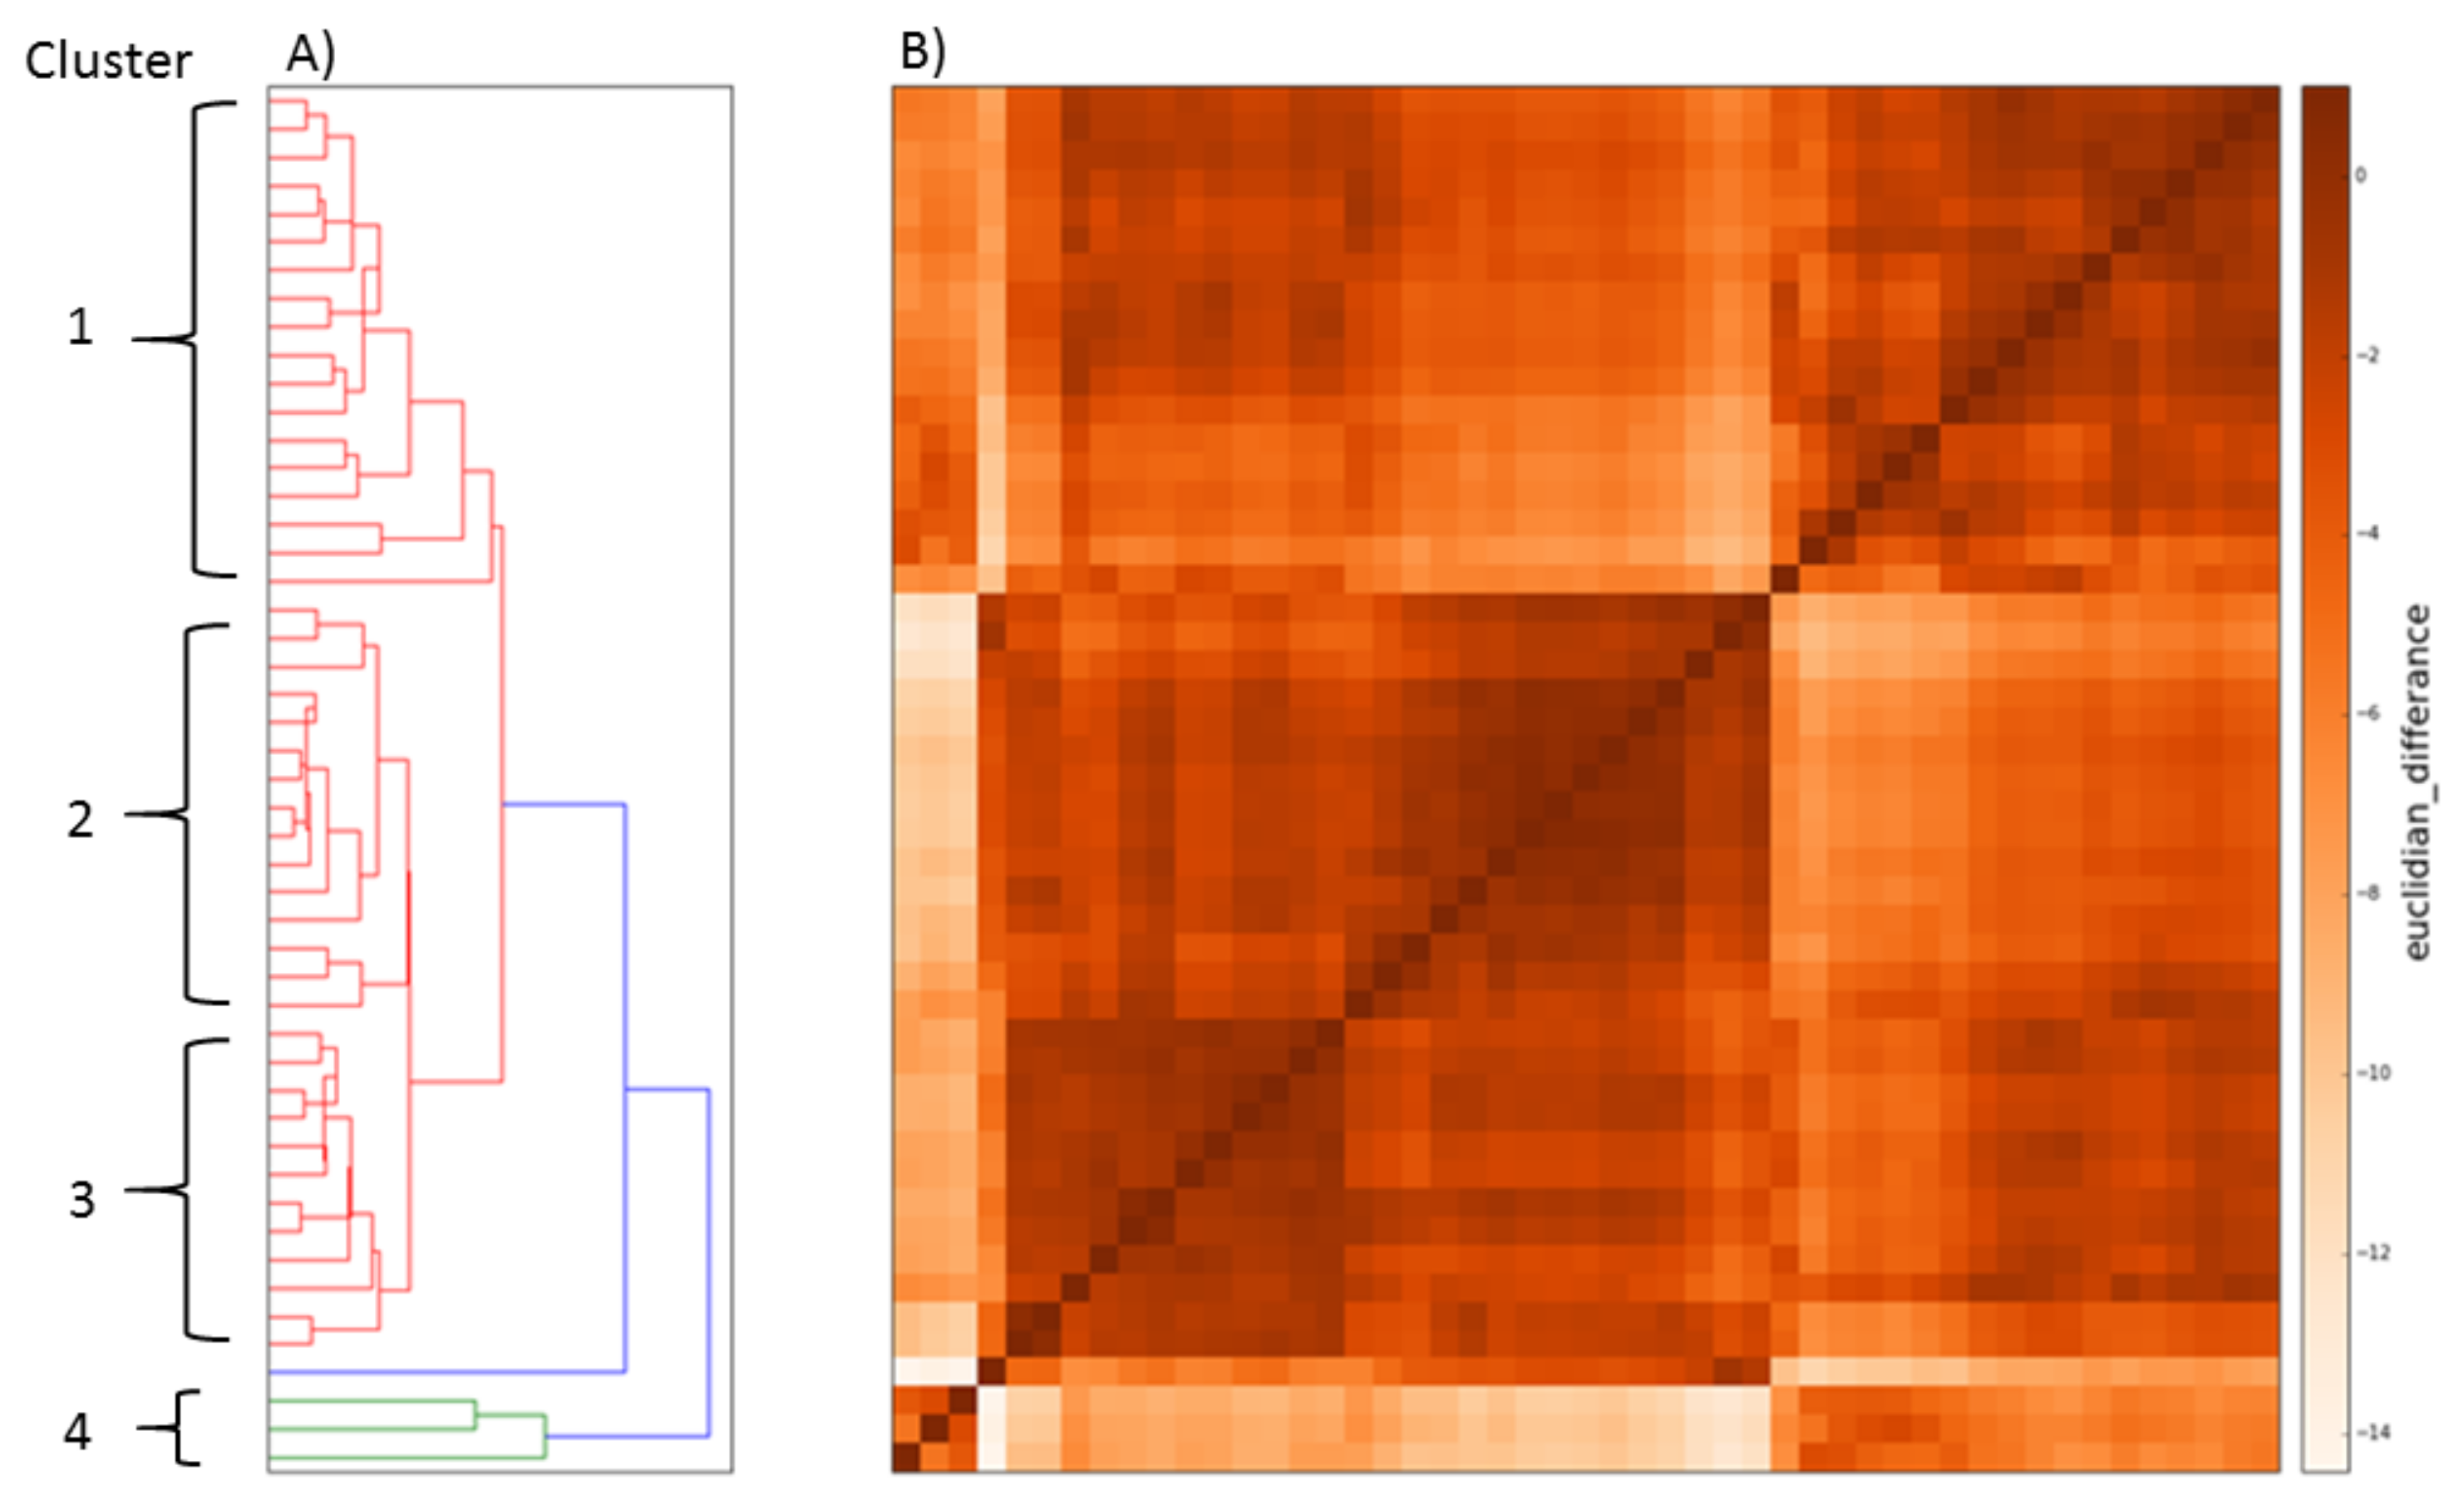
Hierarchal analysis began with each breath being compared to all other breaths. In each case, the same time point was used. This produced a 30 × 30 data matrix. Two matrices were created using a Euclidian distance technique and Pearson correlation [
13]; two further matrices were created using breath data that was normalised for time and amplitude. The hierarchical clustering methods were compared using a number-distance plot (
Figure 1), which suggested that time only normalised Euclidian clustering was the best method.
The programme script for data conditioning was written in Python using the SCIPY library [
14] and the algorithms performing the Euclidian and Pearson’s analysis along with the hierarchal clustering analysis were written by RC.
2.4. Statistical Analysis
Data were expressed as means and standard deviations for normally distributed data and the median plus the range for non-normally distributed parameters. Differences between clusters were tested by analysis of variance, with post-hoc analysis where appropriate. Linear correlations were assessed by linear regression. Statistical significance is defined when p < 0.05. All statistical analyses were performed using Sigmaplot v14 (Systat Software Inc., London, UK).
3. Results
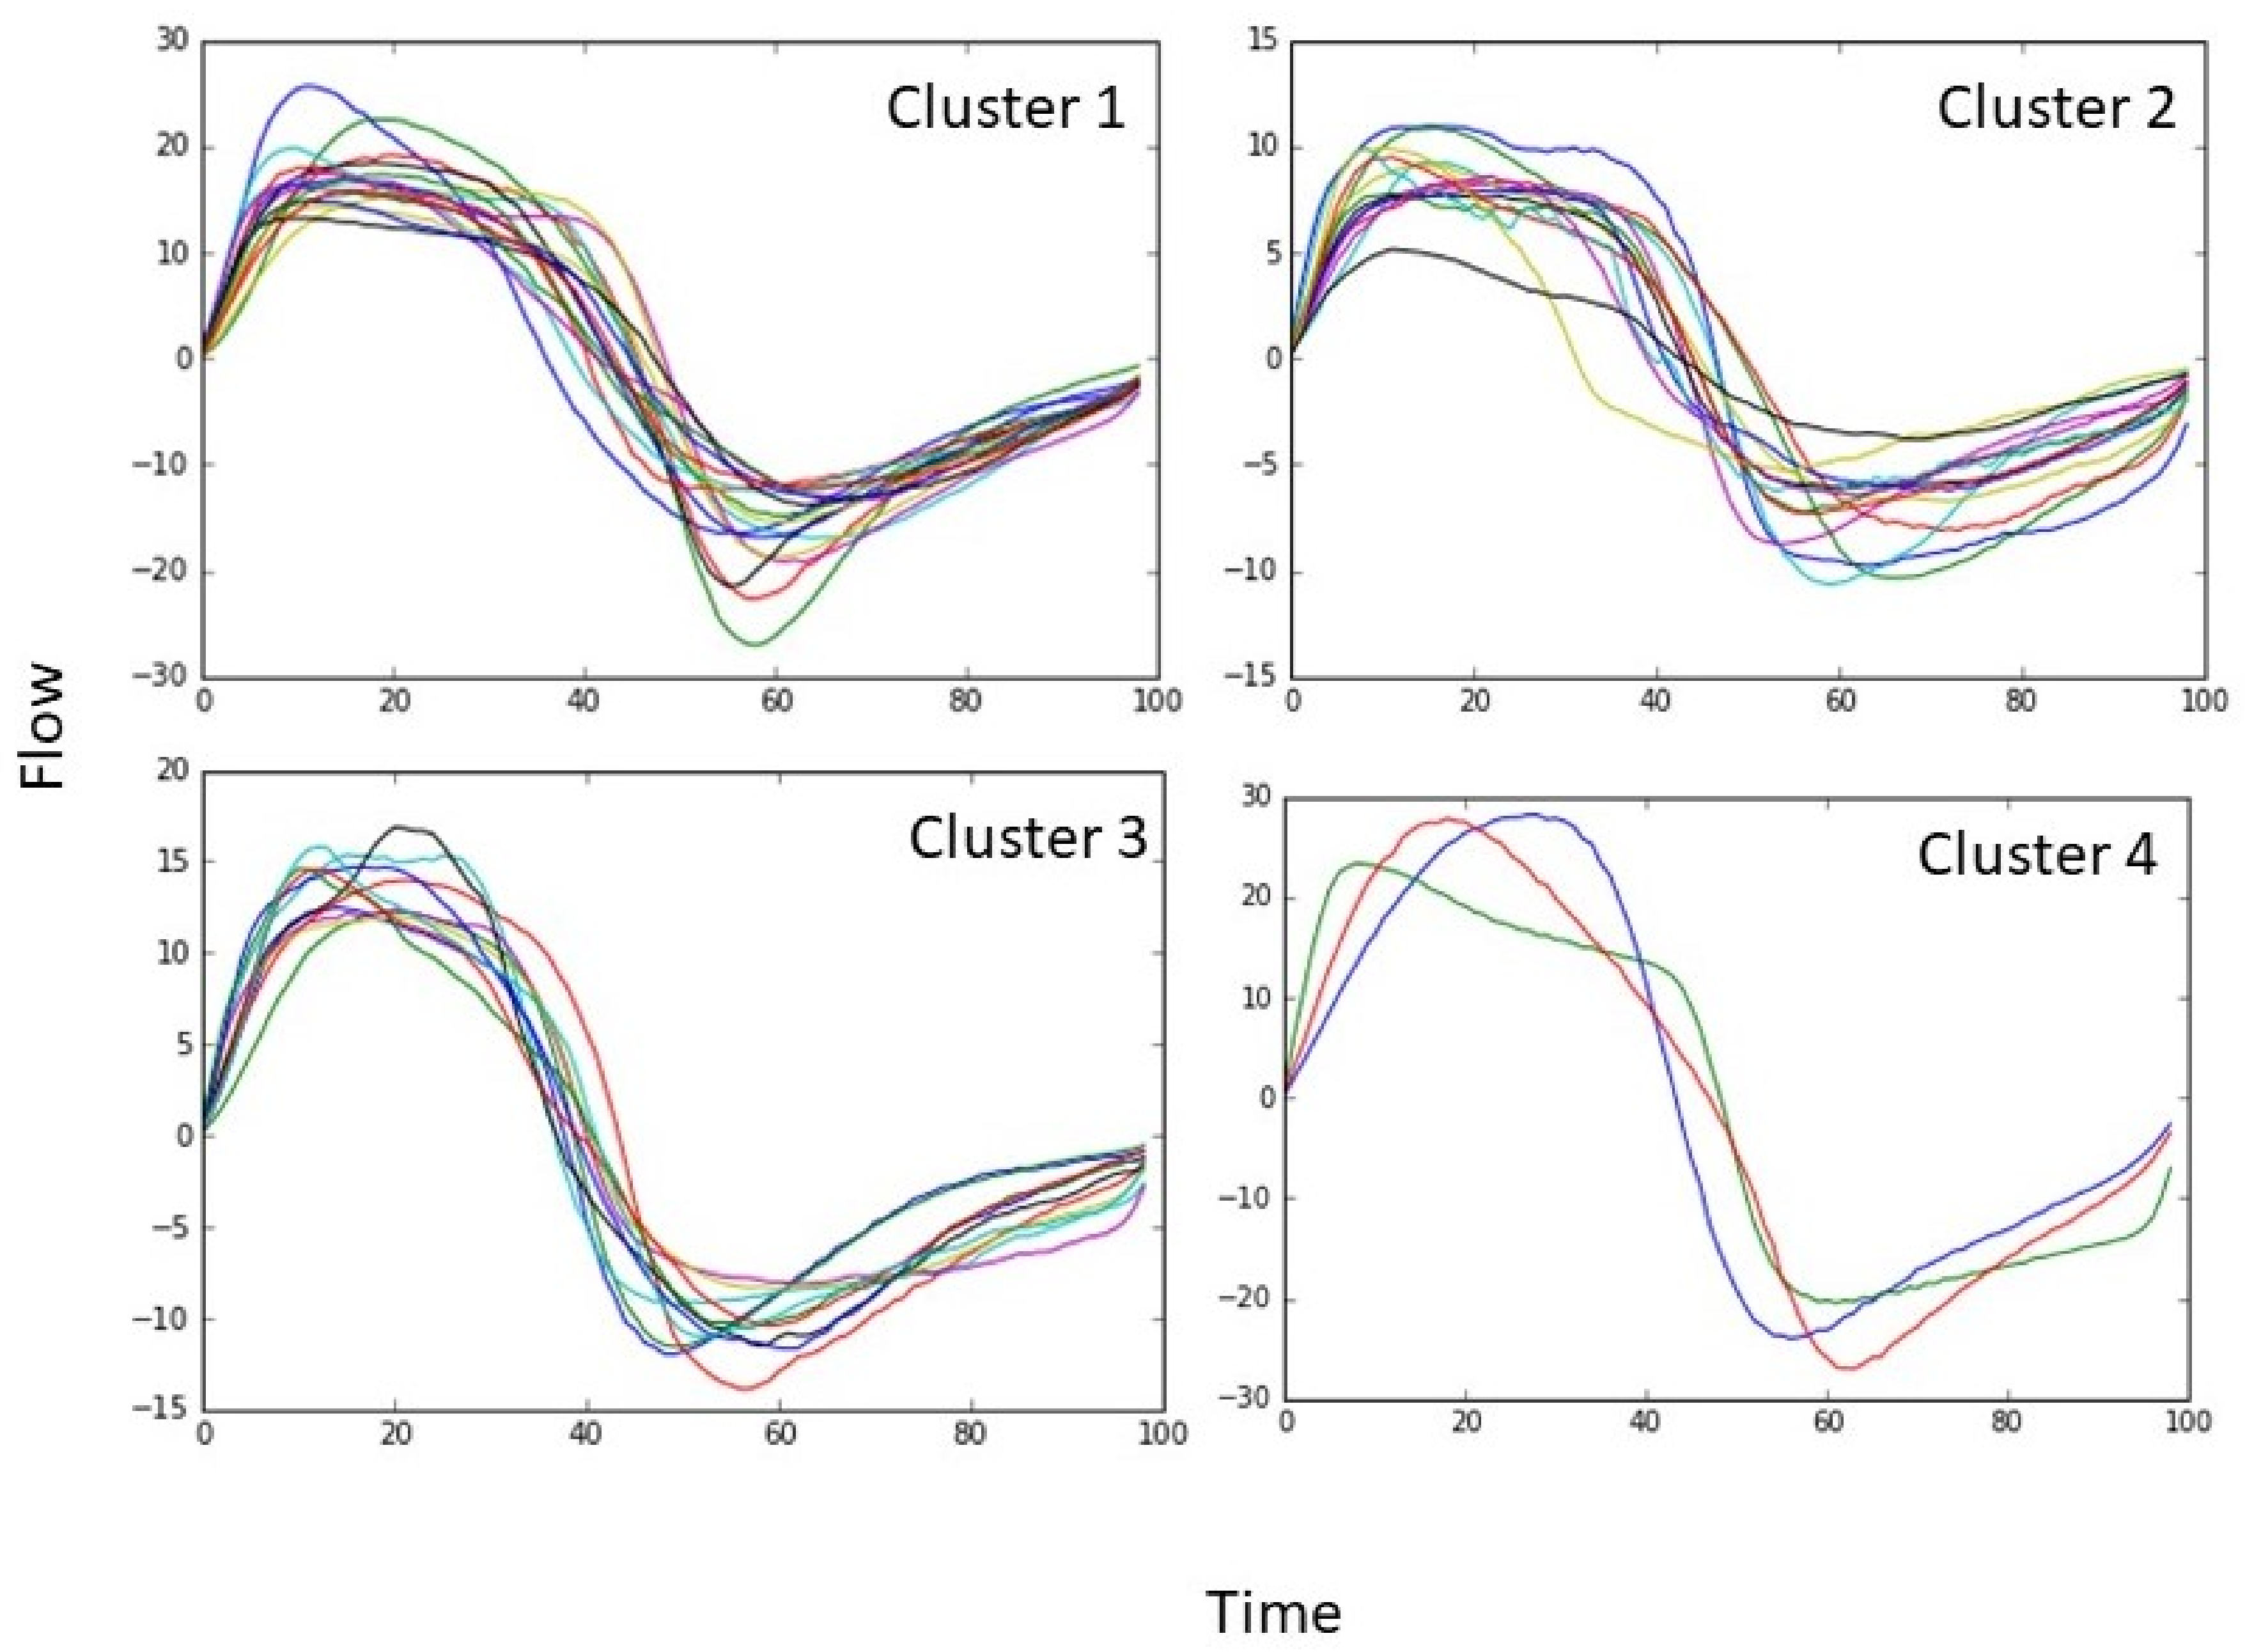
The time-normalised mean breath was analysed for all participants (
n = 48) irrespective of disease status or health. Euclidean distance cluster analysis (EDCA) grouped the data set into four distinct clusters characterized in
Table 1 (
Figure 2,
Figure 3 and
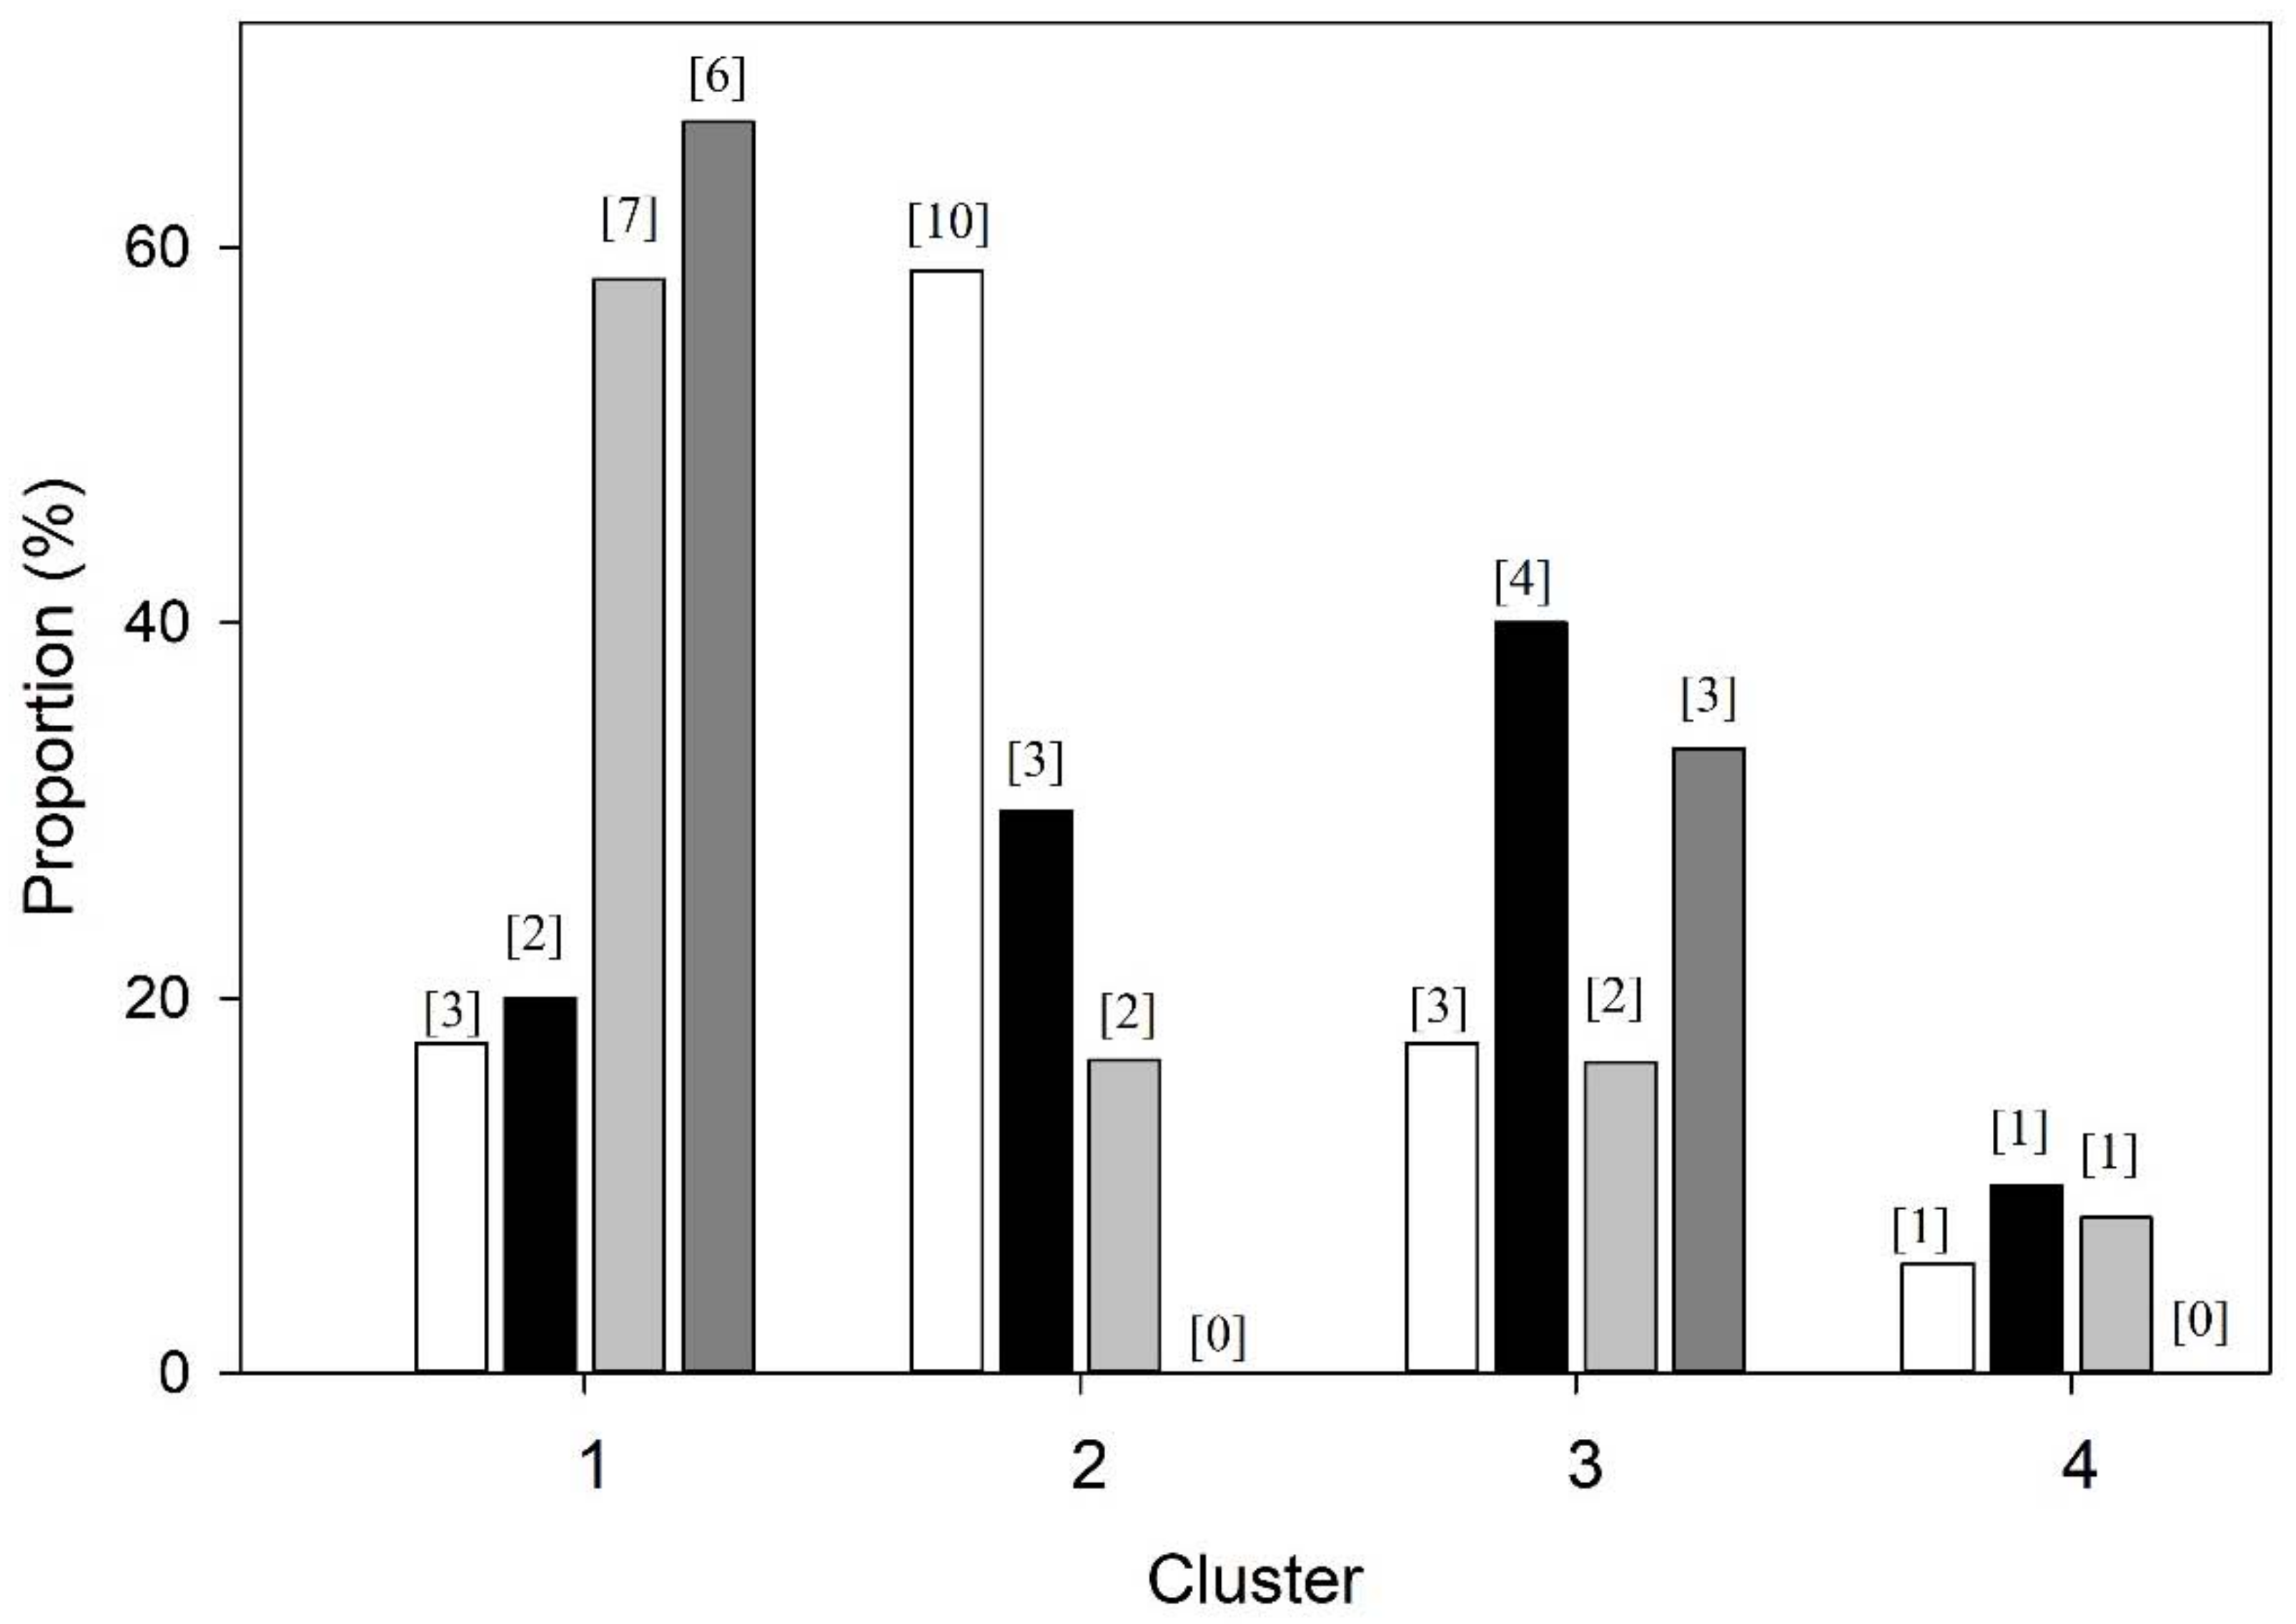
Figure 4). Breaths from the controls appear in all four cluster groups, but the majority (59%) were found in Cluster 2, whereas those IPF patients with Stage 3 disease were only found in only two clusters, with two-thirds (67%) being classified in Cluster 1 and the remainder in Cluster 3 (
Figure 2 and
Figure 4). Clusters 2 and 4 consisted of controls as well as Stage 1 and 2 patients (
Figure 2 and
Figure 4).
A statistical comparison of the non-normalised data between clusters using ANOVA (
Table 1) show differences in timing indices and flow characteristics (
p < 0.05) (
Table 1). The largest cluster (Cluster 1,
n = 18) had a high
, 16.5 ± 2.0 L min
−1 (mean ± SD), resulting from a rapid breathing rate, 20 ± 3 breaths min
−1, and tidal volume, V
T 0.83 L (0.62–1.05) (median (range)). Cluster 2 (
n = 14) was characterized by a low
of 8.1 ± 2.3 L min
−1 consisting of a breathing rate of 16 ± 3 breaths min
−1 and V
T of 0.51(0.26–0.88). Cluster 3 (
n = 12) had a higher
than Cluster 2 but lower than Cluster 1, at 11.4 ± 1.3 L min
−1, achieved by a low breathing rate, 14 ± 4 breaths min
−1, and high V
T 0.81 L (0.55–1.45). Cluster 4 (
n = 3) had the highest
, 25.7 ± 1.3 L min
−1, and was characterized by a high breathing rate of 26 ± 3 breaths min
−1, and V
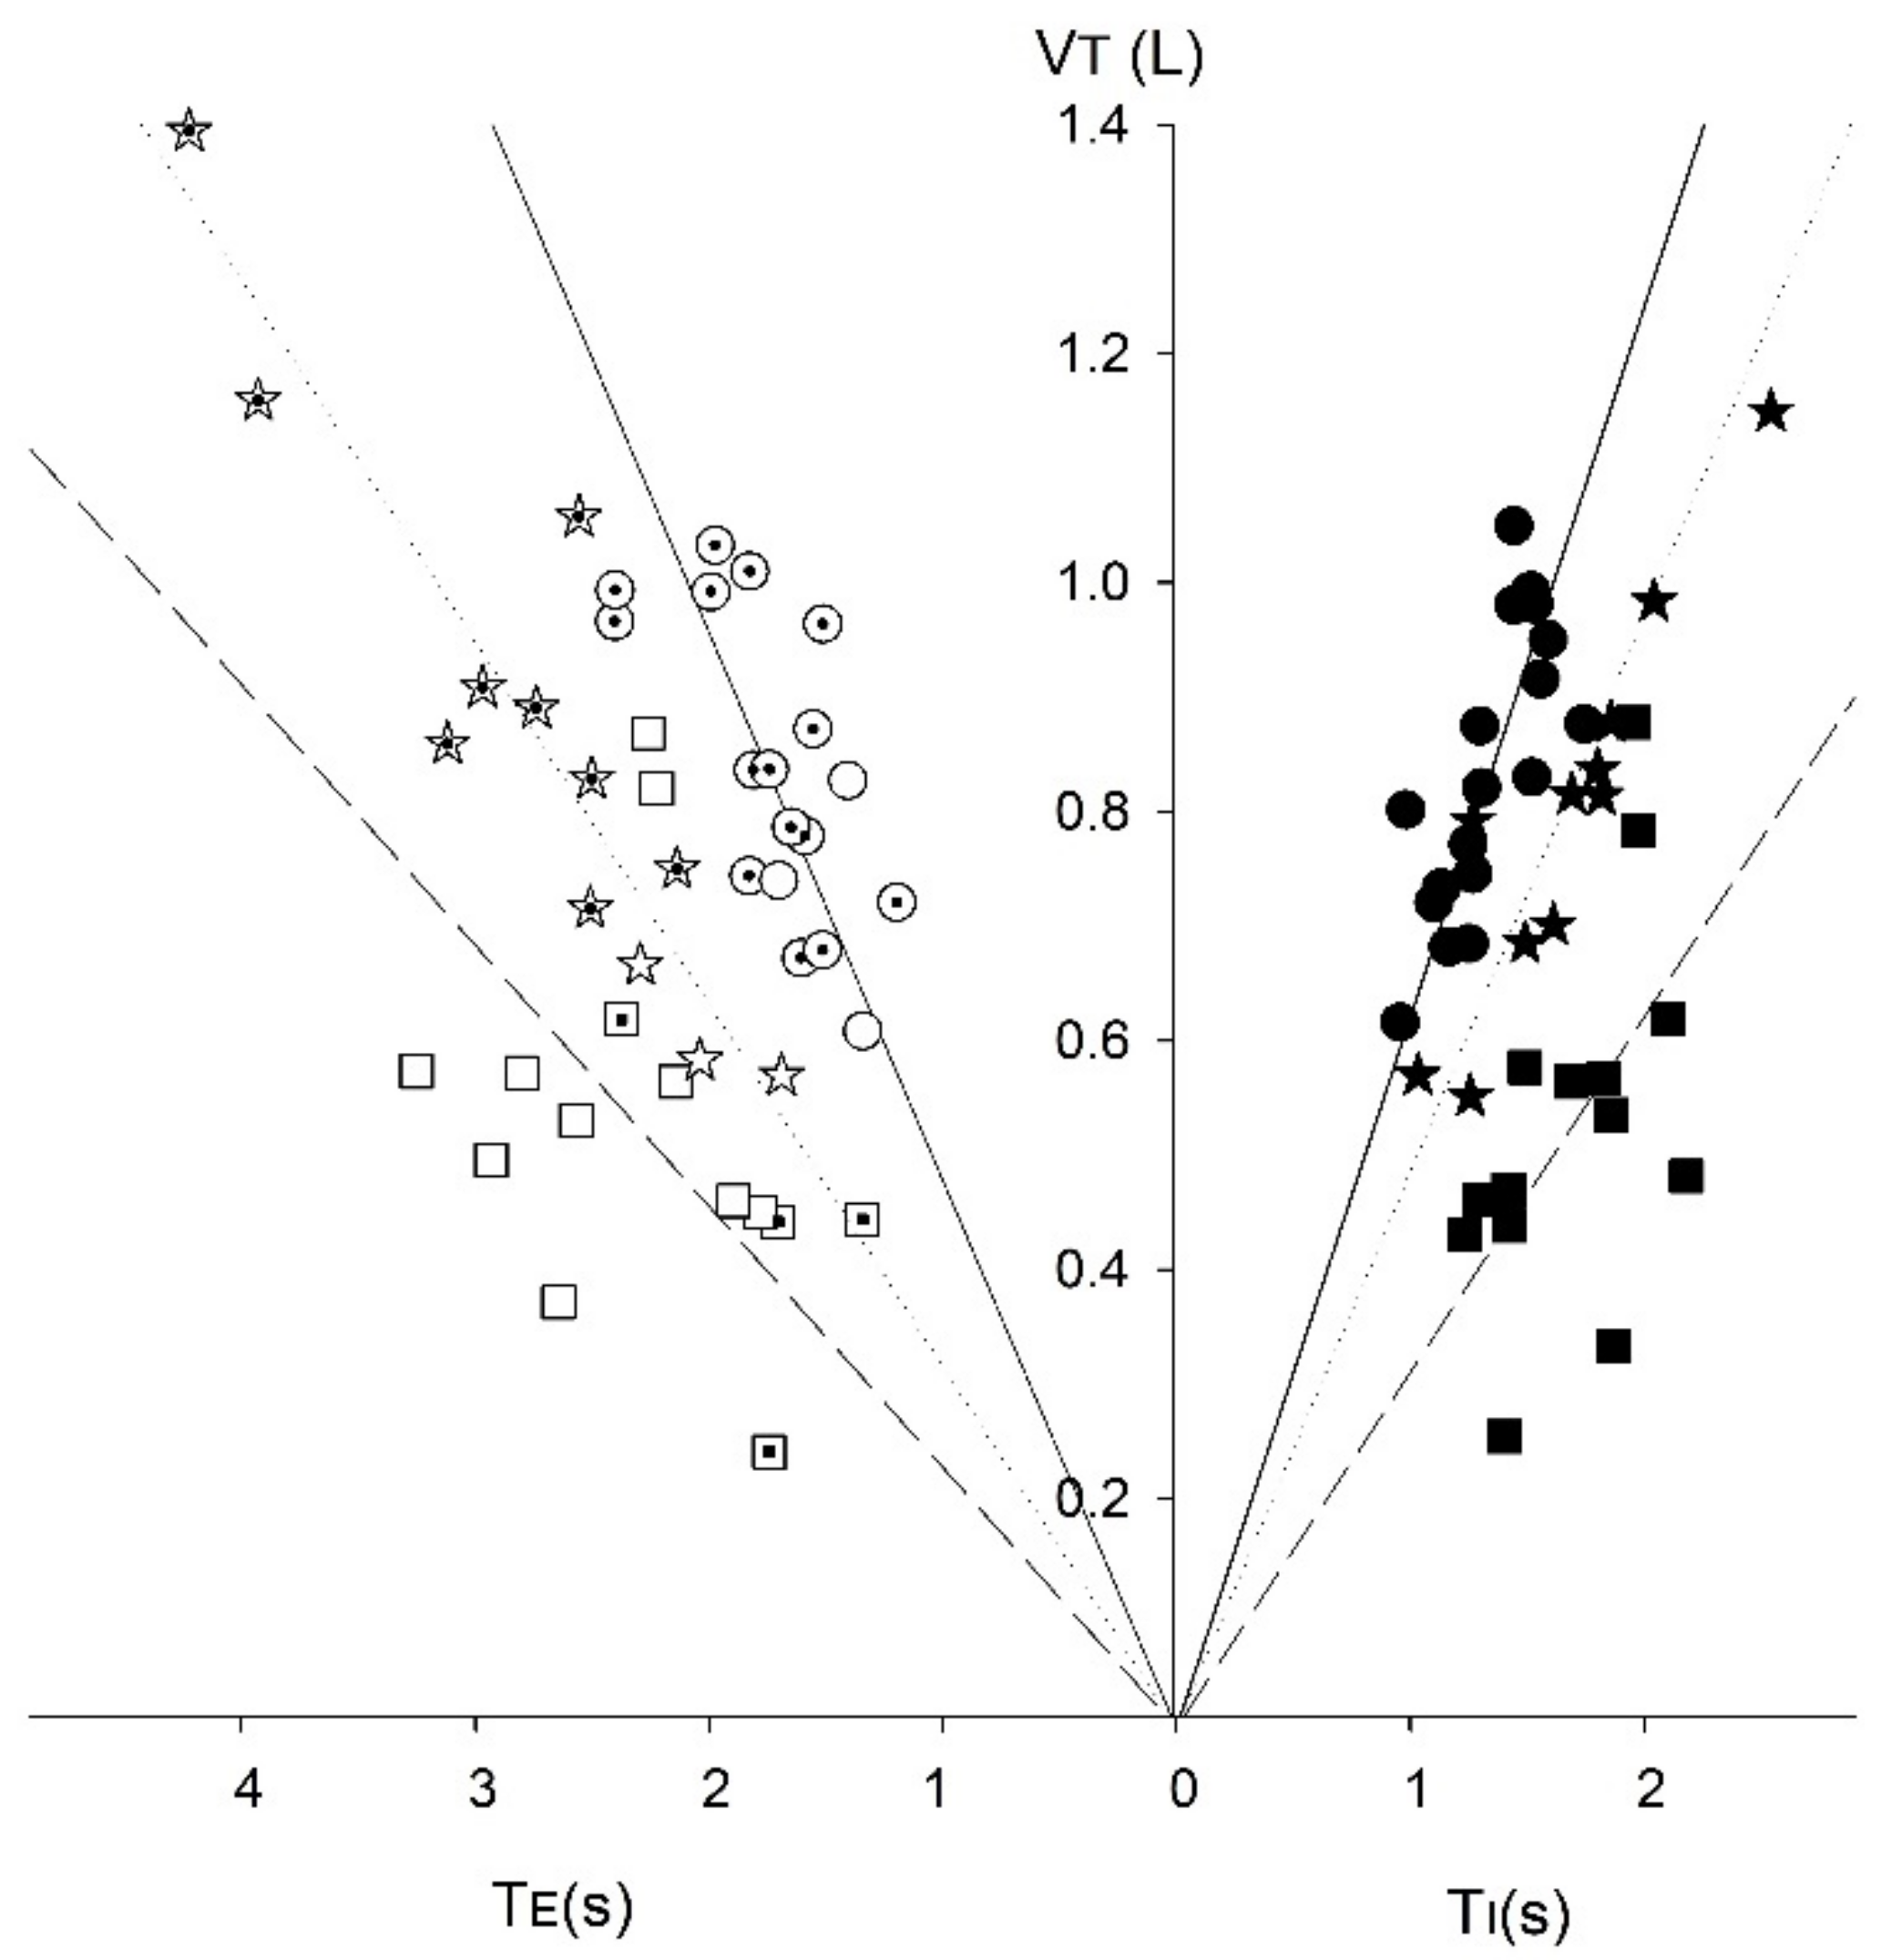
T, 1.04 L (0.84–1.07). Further analysis shows that each group has its own distinct respiratory drive, as indicated by the differing slope of the isoflow lines (
Figure 5) [
15]. Cluster 1 (high
), exhibiting the strongest drive, indicated by the steepest isoflow line, whilst Cluster 2 (low
) exhibited the lowest drive.
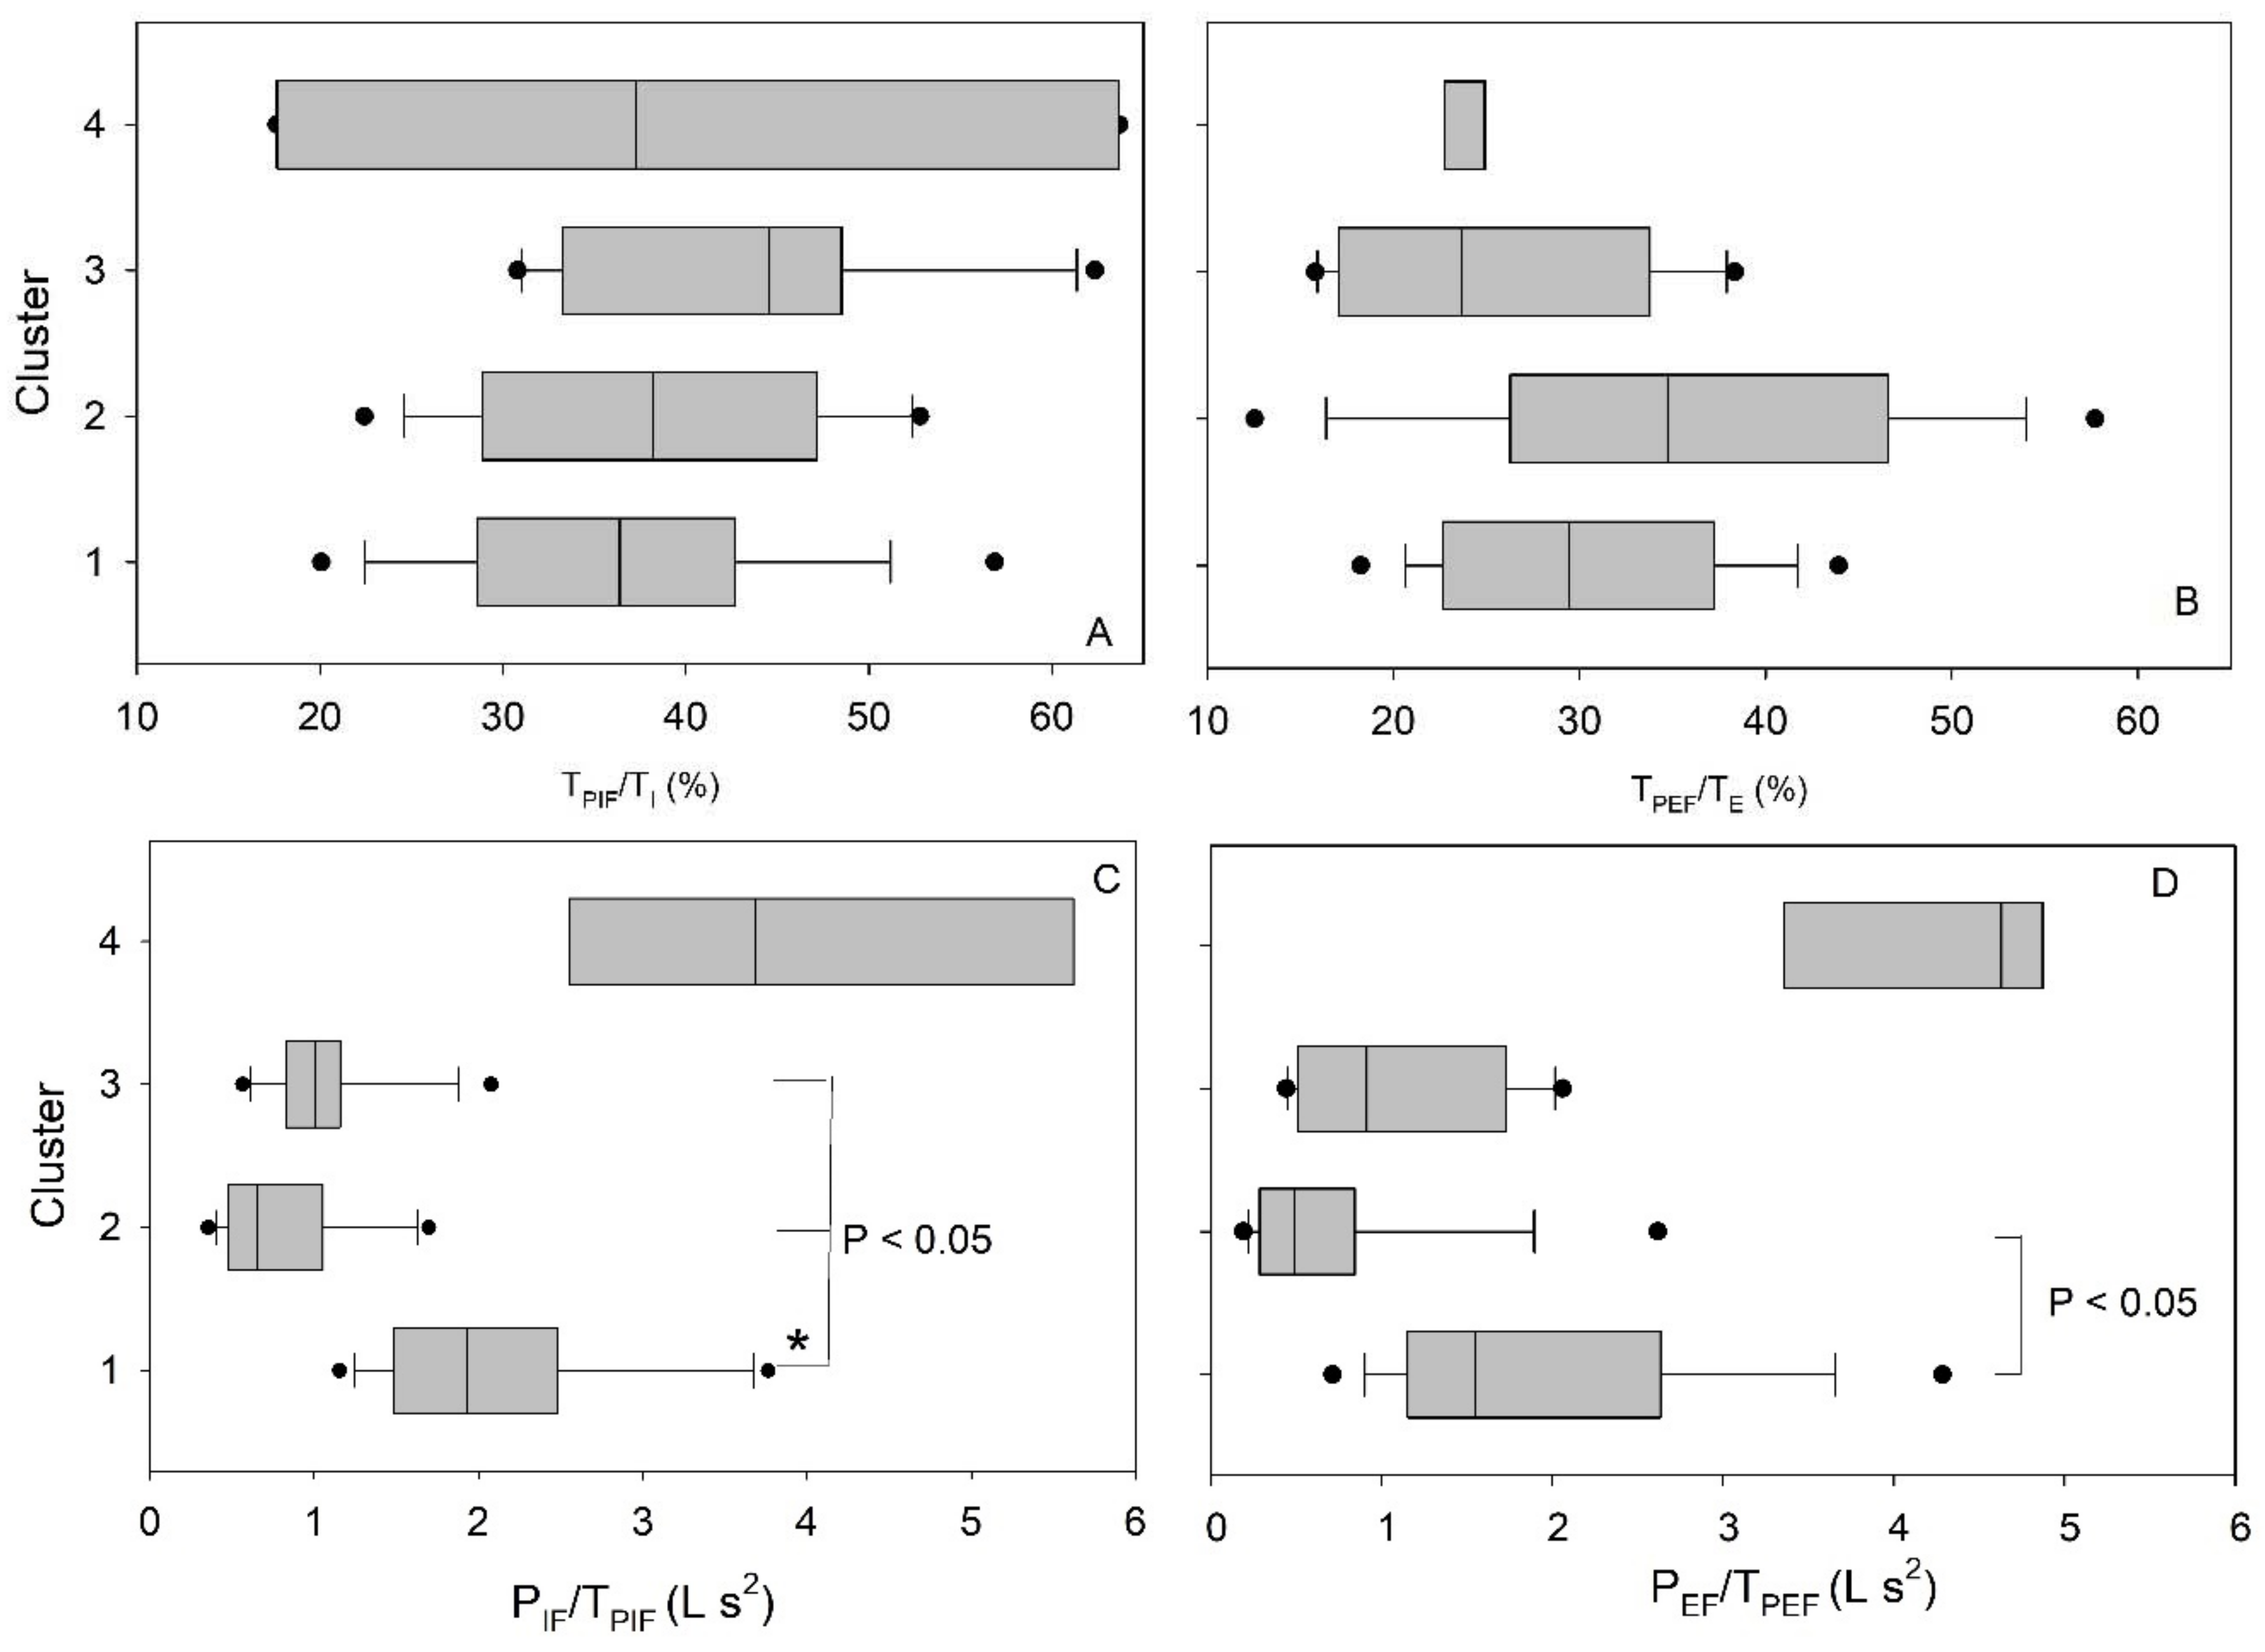
Differences in the relationship between peak inspiratory and expiratory flow and group were observed (
Figure 6). The rate to reach maximum flow, P
IF/T
PIF and P
EF/T
PEF, (P
IF: peak inspiratory flow, P
EF: Peak expiratory flow, T
PIF: time to peak inspiratory flow, T
PEF: time to peak expiratory flow) was lengthened in Cluster 1 (high
) only. An analysis of the clinical parameters between the clusters show that the FVC % predicted, FEV
1/FVC ratio, and TLCO % predicted were different (
Table 2). Cluster 1 (high
) exhibited values akin to diminished lung function (
Table 2). The IPF Stage 3 patients, clustered into Cluster 1 (high
) and 3 (low Bf), had different PaCO
2 partial pressures at 4.6 ± 0.5 and 5.2 ± 0.5 kPa, respectively (
p = 0.015), whilst arterial PO
2, O
2 saturation, and cough were not different (
p < 0.05).
4. Discussion
Undirected statistical hierarchal cluster (USHC) analysis of the resting tidal breathing airflow profiles recorded from patients with IPF and age-similar controls revealed four distinct clusters: three major and one minor cluster (
Figure 2). Each cluster consisted of a mixture of both patients and controls, with cluster membership unrelated specifically to disease status or symptoms (
Table 1 and
Table 2). Statistical analysis of each cluster’s characteristics showed that clustering was based on differences in ventilation rate,
. However, the distribution of patients and controls across the cluster does suggest that most of the patients with Stage 2 and 3 IPF had altered breathing patterns, with an intermittent
(in Cluster 1 and 3).
The use of a single representative (normalised) breath for each participant, rather than analysing multiple breaths, was important for pattern recognition. When recording a series of breaths, there is always breath-to-breath variation in duration and magnitude of each breath, a phenomenon determined largely by neural drive. Time normalisation removes this variability, and thus any differences remaining in the airflow profile result from altered mechanical function. Normalisation was successfully used in the previous studies, where time and flow indices were used to define disease status [
6,
7].
USHC analysis without a priori selection of any flow, time, disease, or symptom characteristics allows any intrinsic profile phenomenon associated with breathing mechanics to be isolated. The four clusters are characterised by their ventilation patterns, Cluster 1 (
n = 18) has a high
, which results in this case from both a fast breathing rate and raised VT, which is unlike the IPF group alone (
Table 1) [
9]. This is the largest group and consists of largely participants with IPF (83%) and does illustrate that IPF does alter breathing patterns, thus supporting the conclusion that minute ventilation is raised in this group [
9]. Cluster 2 (
n = 14), the second largest group, is characterised by a low
, reflecting a breathing rate and VT range seen in healthy subjects, and consists principally of control participants (67% of the cluster). Cluster 3 (
n = 12) has an intermediate
, again composed of a slow breathing rate but countered by a high VT. This cluster has a mixture of participants; the hypoventilatory features apparent in this cluster are reflected by the Class 3 IPF participants who have a significantly raised PaCO
2 (in comparison to Cluster 1). The forth cluster (
n = 3) is characterised by hyperventilation, having a high
, high breathing rate, and high tidal volume (
Table 1). Overall, the analysis shows that the IPF-free participants breathed using a variety of patterns, whereas those with IPF were less variable. Tracking this loss of variability with disease progression via a longitudinal study may prove to have some prognostic value.
The clustering by ventilation is further exemplified by the V
T/T
I-T
E relationship, with Cluster 1 showing the steepest relationship between these parameters (
Figure 5) and consisting mainly of IPF participants. The steeper gradient of the V
T/T
I and V
T/T
E relationship in Cluster 1 also implies that the maximum ventilation rate, V
max, would be reached sooner in exercise [
15]. Thus, resting breathing patterns in people with IPF (and Cluster 1 controls) may be a predictor for exercise intolerance, especially if this were linked to PaCO
2 and arterial O
2 saturation levels.
Defining resting tidal breathing via its shape time profile using cluster analysis provides a different view than using specific volumetric/flow parameters used in previous studies [
6,
7]. The mixing of patterns between those with healthy and fibrotic lungs illustrates that resting tidal breathing (RTB) patterns are complex and not just based on respiratory mechanics.
Limitations
This study is limited by using a small diverse group of participants, including a clinical group of varying severity. Larger participant numbers across all health and IPF classifications would better inform the cluster analysis, which might then find more than four clusters, or may even better define the IPF stages and controls.


