Income and Self-Rated Mental Health: Diminished Returns for High Income Black Americans


1
Center for Research on Ethnicity, Culture, and Health (CRECH), School of Public Health, University of Michigan, Ann Arbor, MI 48104, USA
2
Department of Psychiatry, University of Michigan, 4250 Plymouth Rd.; Ann Arbor, MI 48109-2700, USA
3
Department of Public Health and Health Sciences, University of Michigan, Flint, MI 48502, USA
4
Division of Public Health, College of Human Medicine, Michigan State University, Flint, MI 48502, USA
*
Author to whom correspondence should be addressed.
Behav. Sci. 2018, 8(5), 50; https://doi.org/10.3390/bs8050050
Submission received: 10 April 2018
/
Revised: 11 May 2018
/
Accepted: 13 May 2018
/
Published: 17 May 2018
Abstract
:Background: The minorities’ diminished return theory suggests that socioeconomic position (SEP) generates smaller health gains for racial/ethnic minorities compared to Whites. The current study was a Black–White comparison of the association between household income and self-rated mental health (SRMH). Methods: This cross-sectional study used data from the 2017 State of the State Survey (SOSS). With representative sampling, the SOSS generates results that are generalizable to the state of Michigan. This study included 881 adults, (n = 92) Black and (n = 782) White. The independent variable was household income. The dependent variable was SRMH, measured using a single item. Age, gender, and participation in the labor force were covariates. Race/ethnicity was the focal moderator. Logistic regression models were used for data analysis. Results: Overall, higher household income was associated with better SRMH, net of covariates. An interaction was found between race/ethnicity and household income on SRMH, suggesting a smaller, or nonexistent, protective effect for Blacks compared to Whites. In race/ethnicity-stratified models, higher household income was associated with better SRMH for Whites but not Blacks. Conclusion: Supporting the minorities’ diminished return theory, our study documents differential effects for income on SRHM for Blacks and Whites, where Whites but not Blacks appear to benefit from their income. Given this, researchers and policy makers are cautioned against making assumptions that racial groups benefit equally from similar economic resources.
1. Introduction
A large body of research has shown that high socioeconomic position (SEP) promotes populations’ physical and mental health [1,2,3]. The health effects of education [4], employment [5,6], and income [7] against morbidity [8] and mortality [1,2] are well established. High income promotes populations’ self-rated mental health (SRMH) [9,10,11,12] by reducing risk of depression [13], suicide [14,15,16], substance use [9,17].
According to the minorities’ diminished return theory, racial and ethnic minorities do not gain the same health benefits from SEP as White Americans [18,19,20,21,22,23,24,25,26,27]. For example, the protective effect of SEP on physical and mental health is shown to be smaller for Black Americans in comparison to Whites [21,22,27]. Specifically, the protective effects of education [19], employment [23], and income [28] on physical health outcomes are shown to be larger for Whites than Blacks. Despite equal resources across racial groups, the diminished gains experienced by Black Americans are attributed to their disproportionately higher exposure to racism compared to Whites [21,22]. Other structural factors such as residential segregation, higher psychological costs of upward social mobility, as well as interpersonal discrimination may also contribute to the diminished gains of SEP among Blacks compared to Whites [21,22].
Although a protective effect of high SEP against poor mental health is shown by both original studies [29,30,31,32,33,34,35,36,37] and a meta-analysis [9], less is known about the differential effects of income on SRMH across race/ethnic groups. Thus, the purpose of the current study is twofold: (1) to examine whether high SEP is associated with better SRMH and (2) to test for racial variation in the above association. Informed by recent literature on larger mental health gains of SEP indicators for Whites than non-Whites [23,38,39], we hypothesized a weaker association between household income and SRMH for Blacks than for Whites who reside in the State of Michigan.
2. Methods
2.1. Design and Setting
Using a cross-sectional design, the current study utilizes data from the 2017 State of the State Survey (SOSS). Conducted by the Institute for Public Policy & Social Research (IPPSR), Michigan State University (MSU), SOSS is the only survey conducted in Michigan designed to systematically monitor social, political, and economic attitudes and beliefs in major regions throughout the state [40].
The SOSS is a telephone survey that includes a random sample of approximately 1000 Michigan residents. The survey takes approximately 20 min to complete. The first seven minutes of the telephone survey collect basic demographic information and monitors the public’s satisfaction with existing economic conditions [40].
The SOSS enrolls participants using a stratified random sample of adults (i.e., age 18 and older) living in the state of Michigan. The SOSS data include “weights” that should be adjusted so the results are representative of the adult population of Michigan residents [40].
2.2. Sampling Eligibility
The eligibility criteria for the SOSS include: (1) age 18 and over; (2) residence in Michigan; (3) being non-institutionalized; and (4) being English-speaking. As SOSS is a telephone survey, only adults who lived in a household with a landline telephone or individuals with a Michigan cell phone number could be interviewed [41].
2.3. Sampling Procedure
The SOSS sample is comprised of both new and old participants. Usually, 60–80% of the sample are new participants who are interviewed for the first time. This sample is drawn from a newly generated list of random-digit-dial (RDD) phone numbers for Michigan. The remainder of the SOSS sample is comprised of previous SOSS participants. This proportion of the sample includes participants who had been interviewed two years prior (i.e.; 2015 participants who agree to be re-interviewed). In general, 80–90% of all SOSS respondents agree to be re-contacted. Both sub-samples constitute a representative random sample. Given that many households have opted not to have a landline telephone, in favor of cell phones, the SOSS includes a sample of cell phone users. The SOSS sampling frame is a sample of randomly generated telephone numbers (landline or cell phone) provided by the Survey Sampling, Inc. (SSI; https://www.surveysampling.com) [41].
For the 2017 SOSS sample, 12,007 phone numbers were used. From this number, 584 were in the re-contact segment, 5897 were in the new RDD segment, and 6500 were in the new cell phone segment. Overall, 48.2% of phone numbers were working (79.8% for the re-contact segment, 50.2% for the new RDD segment, and 43.6% for the new cell phone segment) [41].
2.4. Data Collection
Data were collected by the of IPPSR’s Office for Survey Research (OSR). Interviews were conducted between 19 April and 30 July 2017. All interviews used a computer-assisted telephone interviewing system (CATI). In CATI, interviews are scripted and executed from a computer workstation. During the interview, the questions and the instructions are provided for the interviewers on their computer screens. The computer also indicates what numeric codes or text can be potentially entered as responses to each item. For interviews, the Computer Assisted Survey Execution System (CASES, version 5.5) software was used. CASES is collectively developed by the U.S. Department of Agriculture, the U.S. Census Bureau, and University of California—Berkeley [41].
2.5. Interviewer Training
Approximately 38 people were trained to collect the 2017 SOSS data. Interviewers received training regarding the study protocols, the interview instrument, and the objectives of the various questions. Experienced interviewers received two hours of study-specific training. New interviewers were given 13 training hours of training, including one shift of practice interviewing. All the interviewer trainees received training manuals with instructional materials such as procedures, forms, and a full description of all operations [41].
2.6. Ethical Considerations
The study was approved by the Institutional Review Board of the Michigan State University (MSU). Informed consent was obtained from all participants (Appendix A). All SOSS participants received financial compensation for their time.
2.7. Measures
2.7.1. Independent Variable
Household income was the primary independent variable in this study. Household income was self-reported. Household Income was composed of the following 11 categories: (1) below $10,000; (2) $10,000–$20,000; (3) $20,000–$30,000; (4) $30,000–$40,000; (5) $40,000–$50,000; (6) $50,000–$60,000; (7) $60,000–$70,000; (8) $70,000–$90,000; (9) $90,000–$100,000; (10) $10,000–$150,000; (11) above $150,000. Income was operationalized as a continuous measure.
2.7.2. Dependent Variable
The outcome variable of interest was self-rated mental health (SRMH). Participants were asked “How would you rate your overall mental health?” Responses included five categories: (1) excellent; (2) very good; (3) good; (4) fair; and (5) poor. Single-item SRMH measure correlates with psychiatric disorders and mental health [42]. Test-retest reliability of SRMH is 0.7–0.8 [42]. Single-item self-rated health measures are repeatedly used across racial groups [43]. In this study, we dichotomized SRMH as poor/fair = 1 versus excellent to good = 0.
2.7.3. Covariates
Sociodemographic covariates in the current study included age, gender, labor market participation, and education. Age was operationalized as a continuous variable. Gender was a dichotomous variable (male 1 vs. female 0). Education was measured as a dichotomous variable: (1) has not completed college; (2) completed college. Employment was measured as a dichotomous variable (non-participation vs. participation) in the labor market.
2.7.4. Moderator
Self-identified race/ethnicity was measured. Race/ethnicity was treated as a dichotomous variable with Whites as the reference category (Blacks = 1 vs. Whites = 0).
2.8. Statistical Analysis
Using 5-year estimates from the 2010–2014 American Community Survey, SOSS participants are weighted so that the proportions of Whites and Blacks in the sample are equivalent to the White and Black adult population of Michigan.
We applied the SOSS sampling weights using Stata 13.0 (Stata Corp.; College Station, TX, USA) to perform all the data analyses. Thus, the results presented here are representative of Michigan residents (adults). For our analyses, design-based standard errors were estimated using Taylor series linearization. As we were only interested in Whites and Blacks in this study, we used sub-population survey commands that accommodate subsample analysis.
For descriptive purposes, we used mean (SE) and proportions in the overall sample and race/ethnicity. For bivariate analyses, we applied a Pearson correlation test, independent sample t test, and Pearson Chi-square. For multivariable analysis, we used logistic regression models. From logistic regression models, adjusted odds ratios (OR), 95% confidence intervals (CI), and associated p value levels are reported.
We ran four logistic regression models in which household income was the independent variable, poor/fair SRMH was the dependent variable, and age, gender, education, and labor market participation were the control variables. The first two logistic regression models were estimated in the overall sample while the last two models examined relationships by race/ethnicity. Model 1 did not explore the moderating effect of race/ethnicity and income on SRMH and thus did not include an interaction term; however, Model 2 included the race/ethnicity by household income interaction term. Model 3 was estimated for Whites and Model 4 was calculated for Blacks.
3. Results
3.1. Descriptive Statistics
Table 1 provides descriptive statistics in the overall sample as well as by race/ethnicity. Blacks had lower education, employment, and household income compared to Whites. Blacks also had worse SRMH than Whites.
3.2. Bivariate Correlations
Table 2 summarizes the bivariate correlations between study variables in the overall sample. Age, education and household income showed negative correlations with poor SRMH.
3.3. Logistic Regressions in the Overall Sample
Table 3 summarizes the results of two logistic regressions in the overall sample. Both models had household income as the independent variable, poor SRMH as the dependent variable, and age, gender, employment, and education as covariates. Model 1 only included the main effects. Model 2 also included the race/ethnicity by household income interaction term. Model 1 showed an inverse association between household income and odds of poor SRMH above and beyond the covariates. Model 2 also showed a significant interaction between race/ethnicity and household income on poor SRMH, indicating smaller protective effects of household income against poor SRMH for Blacks than Whites.
3.4. Logistic Regressions by Race/Ethnicity
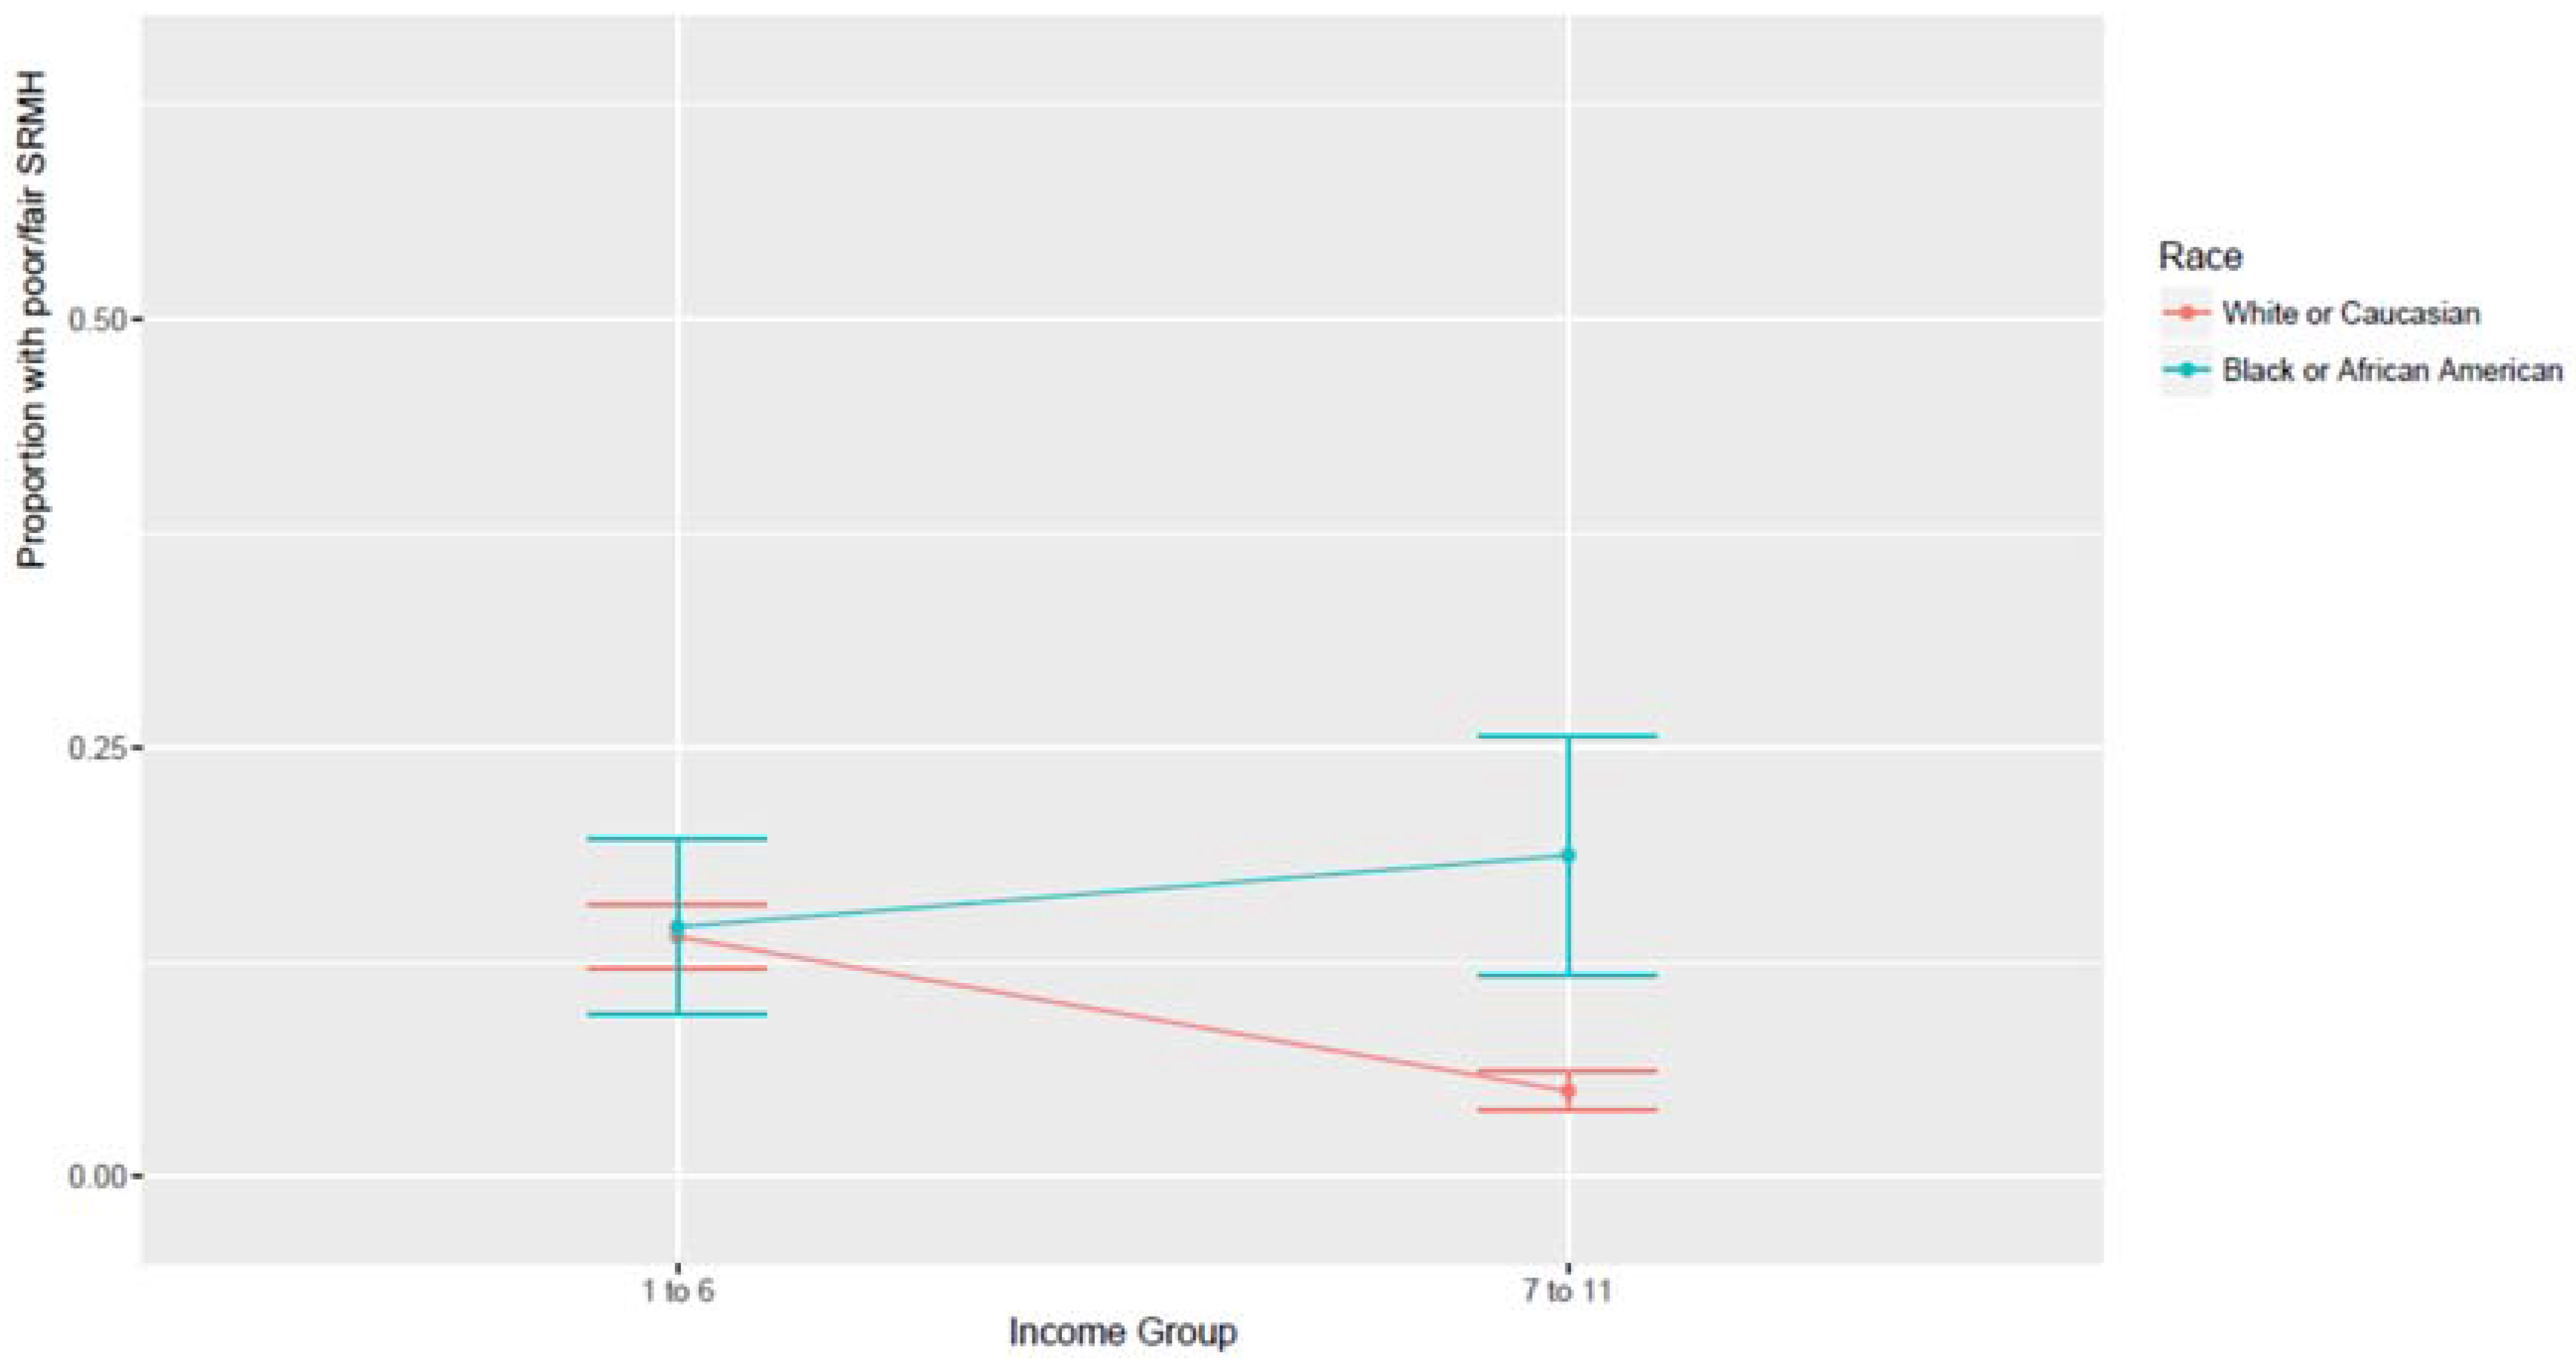
Table 4 provides a summary of two additional logistic regression models which were estimated specifically for Whites and Blacks. Model 3 showed that in Whites, higher household income was associated with lower odds of poor SRMH. Model 4 showed that in Blacks, higher household income was not associated with lower odds of poor SRMH. Figure 1 shows the association between income and SRMH by race/ethnicity. As this figure shows, the largest Black–White difference in SRMH exists at the highest income levels, and Blacks and Whites are no different for low levels of income.
4. Discussion
The current study had two aims: first, to test whether high SEP is associated with lower risk of poor SRMH, and second, to explore racial variation in the association between household income and poor SRMH. Our first finding showed that higher household income is associated with better SRMH overall. Our second finding showed that this mental health gain is smaller for Blacks than for Whites.
The first finding on the overall association between higher household income and better SRMH is consistent with the fundamental cause [44,45] and social determinants of health [46,47] theories that consider low SEP as root cause of poor health. This finding is also supported by a considerable amount of empirical evidence documenting the link between high SEP and better SRMH [10,11,12]. In addition to SRMH, higher income protects people against depression [13], suicide [14,15,16], and substance use [9,17]. The protective effects of income on mental health seem to be non-specific as the health benefits of higher income extend to multiple outcomes [48].
This is not the first study to show that race/ethnicity alters the protective health effect of SEP. Most of this literature, however, has focused on physical rather than mental health outcomes [49,50,51,52,53]. The current study makes an important contribution to the literature on the differential mental health effects of SEP by race/ethnicity by extending the minorities’ diminished return theory [21,22] with empirical evidence on how race/ethnicity modifies the impact of higher income on self-reported mental health.
These results are consistent with the minorities’ diminished return theory [21,22], which has documented a smaller health return of high SEP for Blacks compared to Whites [19,20,23]. Household income reduces chronic medical conditions significantly more for Whites than Blacks [23], which has been attributed to such factors as the racial segregation of Blacks to communities where access to health resources are limited and more costly, thus diminishing Blacks’ purchasing power [54]. Employment also protects health disproportionately more for Whites than Blacks [23], as the types of jobs held by Blacks are more likely to expose them to health hazardous work conditions, while also failing to offer employee sponsored health insurance [23,55]. Further, education is more strongly related to impulse control [56], drinking [20], smoking [57], diet [58], self-rated health [59], and oral health [60] for Whites than Blacks. These may, in part, be explained by the fact that education generates higher income for White compared to Black families [61].
The smaller effects of lower income on the mental health of Blacks may be due to systemic resilience or system blaming of Blacks who live under adversity [62,63]. This view is supported by studies showing equal mental health outcomes of low and high-income Blacks [64]. Poor Blacks’ high mental health may also be a result of thriving and flourishing under economic adversities [65,66]. In a unique study of 34 Black female, 32 Black male, 31 White female, and 37 White male upper- and middle-class adults, Steele found an interaction between race and direction of social mobility on mental health; upwardly-mobile Blacks and downwardly-mobile Whites felt more self-critical [67].
The results are relevant to a literature that has documented poorer mental health among high SEP Blacks compared to their low SEP counterparts [18,68]. However, more information is available on depression than SRMH [26,38]. Studies have found higher risk of depression in high income Black boys [38] and men [26] compared to their lower income counterparts. Another study showed that Black men with higher educational attainment were the only race by gender group that showed an increase in their depressive symptoms over time [18]. These findings were partially attributed to the higher risk of discrimination in high SEP Blacks [24,69].
Not only economic resources but psychological assets such as affect, coping, sleep, and self-efficacy may better serve the mental health of Whites than Blacks [70,71,72,73,74,75,76,77,78]. As these psychological constructs are mediators for the effects of SEP on health, their differential effects by race may explain our finding on racial variation in the effects of SEP on SRMH. Future research should test whether coping and other psychosocial factors explain racial variation in the SEP-SRMH link.
The minorities’ diminished return theory attributes the diminished return of SEP for Blacks to racism, discrimination, and the unfair treatment of Blacks in the United States [21,22]. One-hundred and fifty-five years after slavery was abolished, and decades after the Civil Rights Movement, structural racism remains embedded in many aspects of the U.S. U.S. cultural values emphasize the importance of individual responsibility, which often ignores societal barriers that are more common in the lives of Blacks. Through the lens of American individualism, structural factors that disproportionately affect Blacks are systemically overlooked by policy makers [79,80]. Without a dramatic change to the social structure of the United States, policy-makers will continue to maintain White privilege, which is a significant determinant of the diminished mental health returns for Black Americans [21,22].
These effects of racism and racial discrimination have biological implications [81,82]. Racism, racial discrimination, and the resulting trauma not only damage health over the course of life; they also result in transgenerational harm. There is evidence to suggest that the chronic stress to which Black Americans are exposed has lasting effects on telomere length, a biomarker for physiologic damage. Specifically, shortened telomere length may play a significant role in the diminished health returns experienced by Black Americans. Chae, et al. [81], and several other scholars [82,83,84,85,86] have all discussed the physiologic damaging effects of prolonged, chronic stress. Geronimus et al. propose the “weathering” process and its age-related patterns for allosteric load scores [87]. Although these explanatory models have differences, they share an emphasis on how adversity, trauma, and stress can result in health consequences at the biological level. The combination of exposure to race-based chronic stress, biopsychosocial coping responses, and structural barriers to medical treatment can have trans-generational consequences together, especially through mechanisms (e.g., fetal exposure to maternal stress) related to the health of pregnant Black women [88,89].
The minorities’ diminished return theory does not attribute the smaller mental health gains of higher SEP for Blacks as a consequence of mismanaged economic resources. Nor does this theory argue that Whites are more effective in using financial resources. Rather, the minorities’ diminished return theory focuses on the inability of the current U.S. opportunity structure (i.e., education, employment, housing, etc.) to provide an equitable distribution of benefits across race. Racial discrimination results in additional structural barriers Blacks must overcome in order to achieve the typical mental health benefits of improved socioeconomic position. The persistent and robust nature of racial health disparities makes this abundantly clear—racial/ethnic health disparities are not reduced or eliminated by SEP. In general, Black Americans display higher rates of morbidity and mortality at every level of socioeconomic position. This means that high SEP Blacks who have successfully climbed the social ladder, earning high incomes, are typically in poorer health than similarly situated Whites. Indeed, U.S. society may make upper-status Blacks pay extra psychological costs for upward social mobility. For instance, high SEP Blacks may have higher goal striving stress or John Henryism than low SEP Blacks that increase their risk of poorer physical and mental health [90,91,92,93,94,95,96].
The current study has implications for theory. Most of the research on disparities has focused on differential exposure rather than the combination of exposure and differential response [21,22]. As a result, the contribution of differential gain from similar resources as a mechanism behind health disparities is traditionally overlooked [19,27]. Researchers working on Black–White differences should systemically explore interactions among race/ethnicity, financial, personal, and social resources as determinants of mental health [21,22]. The results of this study demonstrate that it is Whites, not Blacks, whose mental health is more closely associated with SEP indicators. This finding is in contrast to the theories such as double jeopardy [38], triple jeopardy [97], multiple jeopardy [98] and multiple disadvantage [99]. All of these theories conceptualize racial and ethnic minorities as vulnerable populations, assuming that their mental health outcomes will be more strongly affected by the absence or presence of any additional risk factor, compared to Whites [98].
Limitations
This study is not without limitations. Participants were limited to a sample with landlines and local cellphones, and the study excluded non-English speakers. Given the cross-sectional design of our study, we are unable to establish causal associations. SEP indicators such as household income and mental health have reciprocal associations. Further, changes in SEP over the life course have important implications for understanding the SES-health relationship as health assaults encountered early in one’s life are found to take a significant toll on the health of upwardly mobile Blacks [100]. Future research should use longitudinal data to rule out reverse causality between poor mental health and household income as well as explore how changes is SEP over one’s life course contribute to between and within group differences in mental health among Blacks and Whites. This is particularly important as the downwardly-mobile Blacks may have a different mental well-being than persistently poor Blacks [62].
Another limitation of the study was unmeasured confounders. We did not include several confounding factors such health insurance, poverty status, or physical health. Our outcome (SRMH) was also a single item measure. Future research should replicate these findings using more comprehensive measures such as psychiatric disorders, mental health care use, mental health care need, and mental health care costs. Differential validity may also be a threat to the current study. SRMH may have different meanings and poor SRMH may reflect different health problems in Whites and Blacks [43]. All the variables in the current study were limited to individual characteristics. Thus, future research should include contextual measures such as high-level SES, urbanity, the availability of resources, community safety, social capital, and density of Whites and Blacks in the community, as these factors have also been shown to impact mental health [101,102,103]. More research is also needed on the non-significant relationship of income to SRMH for Blacks. There is a need to replicate this finding in other data sets, particularly those with a national sample.
5. Conclusions
While household income is associated with better mental health, the magnitude of this association depends on race/ethnicity. Additional research is needed to better understand the conditional associations among SEP, race/ethnicity, and SRMH. Policies are also needed to narrow Blacks’ diminished returns.
Author Contributions
S.A. designed and analyzed this work and drafted the paper. L.M.L. and H.W.N. contributed to the drafts and revisions. All authors approved the final draft.
Acknowledgments
Shervin Assari is partially supported by the Heinz C. Prechter Bipolar Research Fund and the Richard Tam Foundation at the University of Michigan Depression Center. Harold W. Neighbors is supported by an endowed professorship from the C.S. Mott Foundation. Funding sources for the Spring 2017 SOSS came from (1) the Man Up Man Down Program at the Michigan State University College of Human Medicine, Division of Public Health; (2) Michigan College Access Network; (3) Michigan State University Department of Educational Administration; (4) Michigan State University Department of Political Science; (5) Michigan State University Institute for Public Policy and Social Research; (6) Michigan State University School of Social Work; and (7) W.K. Kellogg Foundation.
Conflicts of Interest
The authors declare no conflict of interest.
Appendix A. State of the State Survey (SOSS) Consent
Before we begin, let me tell you that this interview is completely voluntary. You may choose not to participate and you may end your participation at any time without penalty. Should we come to any question that makes you feel too uncomfortable or you do not want to answer, just let me know and we can go on to the next question. Information collected for this study will be kept confidential to the extent allowed by local, state and federal law, and no reference will be made in any oral or written report that would link you individually to this study. If you have any questions about this study or would like contact information for the investigators, you can ask me at any time. This call may be recorded or monitored for quality assurance.
Appendix B. State of the State Survey (SOSS) Regions
- Upper Peninsula: Alger, Baraga, Chippewa, Delta, Dickinson, Gogebic, Houghton, Iron, Keweenaw, Luce, Ontonagon, Mackinac, Marquette, Menominee, Schoolcraft
- Northern Lower Peninsula: Alcona, Alpena, Antrim, Benzie, Charlevoix, Cheboygan, Crawford, Emmet, Grand Traverse, Iosco, Kalkaska, Leelanau, Missaukee, Montmorency, Ogemaw, Oscoda, Otsego, Presque Isle, Roscommon, Wexford
- West Central: Allegan, Barry, Ionia, Kent, Lake, Manistee, Mason, Mecosta, Montcalm, Muskegon, Newaygo, Oceana, Osceola, Ottawa
- East Central: Arenac, Bay, Clare, Clinton, Gladwin, Gratiot, Huron, Isabella, Midland, Saginaw, Sanilac, Shiawassee, Tuscola
- Southwest: Berrien, Branch, Calhoun, Cass, Eaton, Hillsdale, Ingham, Jackson, Kalamazoo, St. Joseph, Van Buren
- Southeast: Genesee, Lapeer, Lenawee, Livingston, Macomb, Monroe, Oakland, St. Clair, Washtenaw, Wayne [excluding Detroit]
- Detroit
References
- Marmot, M.G.; Shipley, M.J. Do socioeconomic differences in mortality persist after retirement? 25 year follow up of civil servants from the first Whitehall study. Br. Med. J. 1996, 313, 1170–1180. [Google Scholar] [CrossRef]
- Van Groenou, M.I.B.; Deeg, D.J.; Penninx, B.W. Income differentials in functional disability in old age: Relative risks of onset, recovery, decline, attrition and mortality. Aging Clin. Exp. Res. 2003, 15, 174–183. [Google Scholar] [CrossRef]
- Berkman, C.S.; Gurland, B.J. The relationship among income, other socioeconomic indicators, and functional level in older persons. J. Aging Health 1998, 10, 81–98. [Google Scholar] [CrossRef] [PubMed]
- Baker, D.P.; Leon, J.; Smith Greenaway, E.G.; Collins, J.; Movit, M. The education effect on population health: A reassessment. Popul. Dev. Rev. 2011, 37, 307–332. [Google Scholar] [CrossRef] [PubMed]
- Morris, J.K.; Cook, D.G.; Shaper, A.G. Loss of employment and mortality. Br. Med. J. 1994, 308, 1135–1139. [Google Scholar] [CrossRef]
- Burgard, S.A.; Elliott, M.R.; Zivin, K.; House, J.S. Working conditions and depressive symptoms: A prospective study of US adults. J. Occup. Environ. Med. 2013, 55, 1007–1014. [Google Scholar] [CrossRef] [PubMed]
- Brodish, P.H.; Massing, M.; Tyroler, H.A. Income inequality and all cause mortality in the 100 counties of North Carolina. South Med. J. 2000, 93, 386–391. [Google Scholar] [CrossRef] [PubMed]
- Herd, P.; Goesling, B.; House, J.S. Socioeconomic position and health: The differential effects of education versus income on the onset versus progression of health problems. J. Health Soc. Behav. 2007, 48, 223–238. [Google Scholar] [CrossRef] [PubMed]
- Lowry, R.; Kann, L.; Collins, J.L.; Kolbe, L.J. The effect of socioeconomic status on chronic disease risk behaviors among US adolescents. J. Am. Med. Assoc. 1996, 276, 792–797. [Google Scholar] [CrossRef]
- Callan, M.J.; Kim, H.; Matthews, W.J. Predicting self-rated mental and physical health: The contributions of subjective socioeconomic status and personal relative deprivation. Front. Psychol. 2015, 6, 1415. [Google Scholar] [CrossRef] [PubMed]
- Meyer, O.L.; Castro-Schilo, L.; Aguilar-Gaxiola, S. Determinants of mental health and self-rated health: A model of socioeconomic status, neighborhood safety, and physical activity. Am. J. Public Health 2014, 104, 1734–1741. [Google Scholar] [CrossRef] [PubMed]
- Assari, S.; Lankarani, M.M. Demographic and Socioeconomic Determinants of Physical and Mental Self-rated Health across 10 Ethnic Groups in the United States. Int. J. Epidemiol. Res. 2017, 4, 185–193. [Google Scholar]
- Lorant, V.; Deliège, D.; Eaton, W.; Robert, A.; Philippot, P.; Ansseau, M. Socioeconomic inequalities in depression: A meta-analysis. Am. J. Epidemiol. 2003, 157, 98–112. [Google Scholar] [CrossRef] [PubMed]
- Assari, S. Ethnic and Gender Differences in Additive Effects of Socio-economics, Psychiatric Disorders, and Subjective Religiosity on Suicidal Ideation among Blacks. Int. J. Prev. Med. 2015, 6, 53. [Google Scholar] [CrossRef] [PubMed]
- Rehkopf, D.H.; Buka, S.L. The association between suicide and the socio-economic characteristics of geographical areas: A systematic review. Psychol. Med. 2006, 36, 145–157. [Google Scholar] [CrossRef] [PubMed]
- Purselle, D.C.; Heninger, M.; Hanzlick, R.; Garlow, S.J. Differential association of socioeconomic status in ethnic and age-defined suicides. Psychiatry Res. 2009, 167, 258–265. [Google Scholar] [CrossRef] [PubMed]
- Goodman, E.; Huang, B. Socioeconomic status, depressive symptoms, and adolescent substance use. Arch. Pediatr. Adolesc. Med. 2002, 156, 448–453. [Google Scholar] [CrossRef] [PubMed]
- Assari, S. Combined racial and gender differences in the long-term predictive role of education on depressive symptoms and chronic medical conditions. J. Racial Ethn. Health Dispar. 2016, 4, 385–396. [Google Scholar] [CrossRef] [PubMed]
- Assari, S.; Lankarani, M.M. Race and urbanity alter the protective effect of education but not income on mortality. Front. Public Health 2016, 4, 100. [Google Scholar] [CrossRef] [PubMed]
- Assari, S.; Lankarani, M.M. Education and alcohol consumption among older Americans. Black-White Differences. Front. Public Health 2016, 4, 67. [Google Scholar] [CrossRef] [PubMed]
- Assari, S. Health Disparities Due to Diminished Return among Black Americans: Public Policy Solutions. Soc. Issues Policy Rev. 2018, 12, 112–145. [Google Scholar] [CrossRef]
- Assari, S. Unequal gain of equal resources across racial groups. Int. J. Health Policy Manag. 2017, 6, 1–6. [Google Scholar] [CrossRef] [PubMed]
- Assari, S. Life expectancy gain due to employment status depends on race, gender, education, and their intersections. J. Racial Ethn. Health Dispar. 2018, 5, 375–386. [Google Scholar] [CrossRef] [PubMed]
- Assari, S.; Caldwell, C.H. Social Determinants of Perceived Discrimination among Black Youth: Intersection of Ethnicity and Gender. Children 2018, 5, 24. [Google Scholar] [CrossRef] [PubMed]
- Assari, S.; Thomas, A.; Caldwell, C.H.; Mincy, R.B. Blacks’ Diminished Health Return of Family Structure and Socioeconomic Status; 15 Years of Follow-up of a National Urban Sample of Youth. J. Urban Health 2017, 95, 21–35. [Google Scholar] [CrossRef] [PubMed]
- Assari, S. Social Determinants of Depression: The Intersections of Race, Gender, and Socioeconomic Status. Brain Sci. 2017, 7, 156. [Google Scholar] [CrossRef] [PubMed]
- Farmer, M.M.; Ferraro, K.F. Are racial disparities in health conditional on socioeconomic status? Soc. Sci. Med. 2005, 60, 191–204. [Google Scholar] [CrossRef] [PubMed]
- Assari, S. The Benefits of Higher Income in Protecting against Chronic Medical Conditions Are Smaller for African Americans than Whites. Healthcare 2018, 6, 2. [Google Scholar] [CrossRef] [PubMed]
- Holzer, C.; Shea, B.; Swanson, J.; Leaf, P.; Myers, J.; George, L.; Weissman, M.; Bednarski, P. The increased risk for specific psychiatric disorders among persons of low socioeconomic status: Evidence from the Epidemiologic Catchment Area Surveys. Am. J. Soc. Psychiatry 1986, 4, 259–271. [Google Scholar]
- Weissman, M.; Bruce, M.; Leaf, P.; Florio, L.; Holzer, C. Affective Disorders. In Psychiatric Disorders in America; Robins, K., Reiger, D., Eds.; The Free Press: New York, NY, USA, 1991; pp. 53–80. [Google Scholar]
- Reiger, D.; Farmer, M.; Rae, D.; Myers, J.; Kramer, M.; Robins, L.; George, L.; Karno, M.; Locke, B. One-month prevalence of mental disorders in the United States and sociodemographic characteristics: The Epidemiologic Catchment Area study. Acta Psychiatr. Scand. 1993, 88, 35–47. [Google Scholar] [CrossRef]
- Alegria, M.; Bijl, R.; Lin, E.; Walters, E.; Kessler, R. Income differences in persons seeking outpatient treatment for mental disorders: A comparison of the United States with Ontario and the Netherlands. Arch. Gen. Psychiatry 2000, 57, 383–391. [Google Scholar] [CrossRef] [PubMed]
- Blazer, D.; George, K.; Landerman, R.; Pennybacker, M.; Melville, M.; Woodbury, M.; Manton, K.; Jordan, K.; Locke, B. Psychiatric disorders: A rural/urban comparison. Arch. Gen. Psychiatry 1985, 42, 651–656. [Google Scholar] [CrossRef] [PubMed]
- Leaf, P.; Weissman, M.; Myers, J.; Holzer, C.; Tischler, G. Psychosocial risks and correlates of major depression in one United States urban community. In Mental Disorders in the Community: Progress and Challenge; Barrett, D., Rose, R., Eds.; The Guilford Press: New York, NY, USA, 1986; pp. 47–66. [Google Scholar]
- Bruce, M.; Takeuchi, D.; Leaf, P. Poverty and psychiatric status: Longitudinal evidence from the New Haven Epidemiologic Catchment Area Study. Arch. Gen. Psychiatry 1991, 48, 470–474. [Google Scholar] [CrossRef] [PubMed]
- Kessler, R.; Zhao, S.; Blazer, D.; Swartz, M. Prevalence, correlates, and course of minor depression and major depression in the national comorbidity survey. J. Affect. Disord. 1997, 45, 19–30. [Google Scholar] [CrossRef]
- Kessler, R.; Berglund, P.; Demler, O.; Jin, R.; Koretz, D.; Merikangas, K.; Rush, J.; Walters, E.; Wang, P. The epidemiology of major depressive disorder: Results from the National Comorbidity Survey Replication (NCS-R). J. Am. Med. Assoc. 2003, 289, 3095–3105. [Google Scholar] [CrossRef] [PubMed]
- Assari, S.; Caldwell, C.H. High Risk of Depression in High-Income African American Boys. J. Racial Ethn. Health Dispar. 2017, 1–12. [Google Scholar] [CrossRef] [PubMed]
- Gavin, A.R.; Walton, E.; Chae, D.H.; Alegria, M.; Jackson, J.S.; Takeuchi, D. The associations between socio-economic status and major depressive disorder among Blacks, Latinos, Asians and non-Hispanic Whites: Findings from the Collaborative Psychiatric Epidemiology Studies. Psychol. Med. 2010, 40, 51–61. [Google Scholar] [CrossRef] [PubMed]
- State of the State Survey (SOSS). Institute for Public Policy and Social Research. Michigan State University. Available online: http://ippsr.msu.edu/survey-research/state-state-survey-soss/about-soss (accessed on 1 April 2018).
- Pierce, G.L. Methodological Report: Michigan State University State of the State Survey 74 (Spring 2017 Round); Institute for Public Policy and Social Research, Michigan State University: East Lansing, MI, USA, 2017. [Google Scholar]
- McDowell, I. Measuring Health: A Guide to Rating Scales and Questionnaires, 3rd ed.; Oxford University Press: New York, NY, USA, 2006. [Google Scholar]
- Assari, S.; Dejman, M.; Neighbors, H.W. Ethnic Differences in Separate and Additive Effects of Anxiety and Depression on Self-rated Mental Health Among Blacks. J. Racial Ethn. Health Dispar. 2016, 3, 423–430. [Google Scholar] [CrossRef] [PubMed]
- Phelan, J.C.; Link, B.G.; Diez-Roux, A.; Kawachi, I.; Levin, B. “Fundamental causes” of social inequalities in mortality: A test of the theory. J. Health Soc. Behav. 2004, 45, 265–285. [Google Scholar] [CrossRef] [PubMed]
- Link, B.G.; Northridge, M.E.; Phelan, J.C.; Ganz, M.L. Social epidemiology and the fundamental cause concept: On the structuring of effective cancer screens by socioeconomic status. Milbank Q. 1998, 76, 375–402. [Google Scholar] [CrossRef] [PubMed]
- Marmot, M.; Allen, J.J. Social determinants of health equity. Am. J. Public Health 2014, 104, S517–S519. [Google Scholar] [CrossRef] [PubMed]
- Braveman, P.; Gottlieb, L. The social determinants of health: It’s time to consider the causes of the causes. Public Health Rep. 2014, 129, 19–31. [Google Scholar] [CrossRef] [PubMed]
- Ross, C.; Mirowsky, J. Education, Social Status, and Health (Social Institutions and Social Change); Aldine Transaction: Piscataway, NJ, USA, 2003. [Google Scholar]
- Hayward, M.D.; Hummer, R.A.; Sasson, I. Trends and group differences in the association between educational attainment and U.S. adult mortality: Implications for understanding education’s causal influence. Soc. Sci. Med. 2015, 127, 8–18. [Google Scholar] [CrossRef] [PubMed]
- Backlund, E.; Sorlie, P.D.; Johnson, N.J. A comparison of the relationships of education and income with mortality: The national longitudinal mortality study. Soc. Sci. Med. 1999, 49, 1373–1384. [Google Scholar] [CrossRef]
- Everett, B.G.; Rehkopf, D.H.; Rogers, R.G. The nonlinear relationship between education and mortality: An examination of cohort, race/ethnic, and gender differences. Popul. Res. Policy Rev. 2013, 32, 893–917. [Google Scholar] [CrossRef] [PubMed]
- Cutler, D.M.; Lleras-Muney, A. Education and Health: Evaluating Theories and Evidence. National Bureau of Economic Research. Available online: Http://www.nber.org/papers/w12352/ (accessed on 9 September 2017).
- Holmes, C.J.; Zajacova, A. Education as “the great equalizer”: Health benefits for black and white adults. Soc. Sci. Q. 2014, 95, 1064–1085. [Google Scholar] [CrossRef]
- Williams, D.R.; Mohammed, S.A.; Leavell, J.; Collins, C. Race, Socioeconomic Status and Health: Complexities, Ongoing Challenges and Research Opportunities. Ann. N. Y. Acad. Sci. 2010, 1186, 69–101. [Google Scholar] [CrossRef] [PubMed]
- Duckett, P.; Artiga, S. Health Coverage for the Black Population Today and Under the Affordable Care Act; Henry, J., Ed.; Kaiser Family Foundation: San Francisco, CA, USA, 2013. [Google Scholar]
- Assari, S.; Caldwell, C.H.; Mincy, R. Family Socioeconomic Status at Birth and Youth Impulsivity at Age 15; Blacks’ Diminished Return. Children 2018, 5, 58. [Google Scholar] [CrossRef] [PubMed]
- Assari, S.; Mistry, R. Educational Attainment and Smoking Status in a National Sample of American Adults; Evidence for the Blacks’ Diminished Return. Int. J. Environ. Res. Public Health 2018, 15, 763. [Google Scholar] [CrossRef] [PubMed]
- Assari, S.; Lankarani, M.M. Blacks’ diminished return of education on fruit and Vegetable intake. J. 2018, in press. [Google Scholar]
- Assari, S.; Caldwell, C.H.; Mincy, R.B. Maternal Educational Attainment at Birth Promotes Future Self-Rated Health of White but Not Black Youth: A 15-Year Cohort of a National Sample. J. Clin. Med. 2018, 7, 93. [Google Scholar] [CrossRef] [PubMed]
- Assari, S. Socioeconomic Status and Self-Rated Oral Health; Diminished Return among Hispanic Whites. Dent. J. 2018, 6, 11. [Google Scholar] [CrossRef] [PubMed]
- Assari, S. Diminished Economic Return of Socioeconomic Status at Birth among Black than White Youth. Soc. Sci. 2018, 7, 74. [Google Scholar] [CrossRef]
- Parker, S.; Kleiner, R.J. The culture of poverty: An adjustive dimension. Am. Anthropol. 1970, 72, 516–527. [Google Scholar] [CrossRef]
- Neighbors, H.W.; Jackson, J.S.; Broman, C.; Thompson, E. Racism and the mental health of African Americans: The role of self and system blame. Ethn. Dis. 1996, 6, 167–175. [Google Scholar] [PubMed]
- Bronder, E.C.; Speight, S.L.; Witherspoon, K.M.; Thomas, A.J. John Henryism, depression, and perceived social support in Black women. J. Black Psychol. 2014, 40, 115–137. [Google Scholar] [CrossRef]
- Ryff, C.D.; Keyes, C.L.M. The structure of psychological well-being revisited. J. Pers. Soc. Psychol. 1995, 69, 719–727. [Google Scholar] [CrossRef] [PubMed]
- Keyes, C.L. The Black–White paradox in health: Flourishing in the face of social inequality and discrimination. J. Pers. 2009, 77, 1677–1706. [Google Scholar] [CrossRef] [PubMed]
- Steele, R.E. Relationship of race, sex, social class, and social mobility to depression in normal adults. J. Soc. Psychol. 1978, 104, 37–47. [Google Scholar] [CrossRef] [PubMed]
- Chen, E.; Martin, A.D.; Matthews, K.A. Understanding health disparities: The role of race and socioeconomic status in children’s health. Am. J. Public Health 2006, 96, 702–708. [Google Scholar] [CrossRef] [PubMed]
- Hudson, D.L.; Bullard, K.M.; Neighbors, H.W.; Geronimus, A.T.; Yang, J.; Jackson, J.S. Are benefits conferred with greater socioeconomic position undermined by racial discrimination among African American men? J. Men’s Health 2012, 9, 127–136. [Google Scholar] [CrossRef] [PubMed]
- Lampe, F.C.; Walker, M.; Lennon, L.T.; Whincup, P.H.; Ebrahim, S. Validity of a self-reported history of doctor-diagnosed angina. J. Clin. Epidemiol. 1999, 52, 73–81. [Google Scholar] [CrossRef]
- Assari, S.; Lankarani, M.M.; Burgard, S. Black-white difference in long-term predictive power of self-rated health on all-cause mortality in United States. Ann. Epidemiol. 2016, 26, 106–114. [Google Scholar] [CrossRef] [PubMed]
- Assari, S.; Burgard, S.; Zivin, K. Long-term reciprocal associations between depressive symptoms and number of chronic medical conditions: Longitudinal support for black-white health paradox. J. Racial Ethn. Health Dispar. 2015, 2, 589–597. [Google Scholar] [CrossRef] [PubMed]
- Assari, S.; Moazen-Zadeh, E.; Lankarani, M.M.; Micol-Foster, V. Race, depressive symptoms, and all-cause mortality in the United States. Front. Public Health 2016, 4, 40. [Google Scholar] [CrossRef] [PubMed]
- Assari, S.; Lankarani, M.M. Depressive symptoms are associated with more hopelessness among white than black older adults. Front. Public Health 2016, 4, 82. [Google Scholar] [CrossRef] [PubMed]
- Assari, S.; Burgard, S. Black-White differences in the effect of baseline depressive symptoms on deaths due to renal diseases: 25 year follow up of a nationally representative community sample. J. Ren. Inj. Prev. 2015, 4, 127–134. [Google Scholar] [CrossRef] [PubMed]
- Assari, S. Hostility, anger, and cardiovascular mortality among Blacks and Whites. Res. Cardiovasc. Med. 2017, 6. [Google Scholar] [CrossRef]
- Assari, S. Race, sense of control over life, and short-term risk of mortality among older adults in the United States. Arch. Med. Sci. 2017, 13, 1233. [Google Scholar] [CrossRef] [PubMed]
- Assari, S. Perceived neighborhood safety better predicts 25-year mortality risk among Whites than Blacks. J. Racial Ethn. Health Dispar. 2017, 4, 937–948. [Google Scholar] [CrossRef] [PubMed]
- Smith, C.W. Younger Blacks Are Less Likely to Suggest That Discrimination Explains Racial Disparities, Tending to Ascribe Them to Blacks’ Lack of Will to “Pull up Their Bootstraps”; LSE American Politics and Policy: London, UK, 2014. [Google Scholar]
- Lee, W.; Roemer, J.E. Racism and redistribution in the United States: A solution to the problem of American exceptionalism. J. Public Econ. 2006, 90, 1027–1052. [Google Scholar] [CrossRef]
- Chae, D.H.; Nuru-Jeter, A.M.; Adler, N.E.; Brody, G.H.; Lin, J.; Blackburn, E.H.; Epel, E.S. Discrimination, racial bias, and telomere length in African-American men. Am. J. Prev. Med. 2014, 46, 103–111. [Google Scholar] [CrossRef] [PubMed]
- Drury, S.S.; Esteves, K.; Hatch, V.; Woodbury, M.; Borne, S.; Adamski, A.; Theall, K.P. Setting the trajectory: Racial disparities in newborn telomere length. J. Pediatr. 2015, 166, 1181–1186. [Google Scholar] [CrossRef] [PubMed]
- Oliveira, B.S.; Zunzunegui, M.V.; Quinlan, J.; Fahmi, H.; Tu, M.T.; Guerra, R.O. Systematic review of the association between chronic social stress and telomere length: A life course perspective. Ageing Res. Rev. 2016, 26, 37–52. [Google Scholar] [CrossRef] [PubMed]
- Karpin, I. Regulatory Responses to the Gendering of Transgenerational Harm. Aust. Fem. Stud. 2016, 31, 139–153. [Google Scholar] [CrossRef]
- Anderson, K. The Epigenome. In The Physiology of Sexist and Racist Oppression; Oxford University Press: Oxford, UK, 2015; Volume 99. [Google Scholar]
- Zahran, S.; Snodgrass, J.G.; Maranon, D.G.; Upadhyay, C.; Granger, D.A.; Bailey, S.M. Stress and telomere shortening among central Indian conservation refugees. Proc. Natl. Acad. Sci. USA 2015, 112, E928–E936. [Google Scholar] [CrossRef] [PubMed]
- Geronimus, A.T.; Hicken, M.; Keene, D.; Bound, J. “Weathering” and age patterns of allostatic load scores among blacks and whites in the United States. Am. J. Public Health 2006, 96, 826–833. [Google Scholar] [CrossRef] [PubMed]
- Goosby, B.J.; Heidbrink, C. Transgenerational Consequences of Racial Discrimination for African American Health. Soc. Compass 2013, 7, 630–643. [Google Scholar] [CrossRef]
- Kuzawa, C.W.; Sweet, E. Epigenetics and the embodiment of race: Developmental origins of US racial disparities in cardiovascular health. Am. J. Hum. Biol. 2009, 21, 2–15. [Google Scholar] [CrossRef] [PubMed]
- Sellers, S.L.; Neighbors, H.W.; Zhang, R.; Jackson, J.S. The impact of goal-striving stress on physical health of white Americans, African Americans, and Caribbean blacks. Ethn. Dis. 2012, 22, 21–28. [Google Scholar] [PubMed]
- Sellers, S.L.; Neighbors, H.W.; Bonham, V.L. Goal-striving stress and the mental health of college-educated Black American men: The protective effects of system-blame. Am. J. Orthopsychiatry 2011, 81, 507–518. [Google Scholar] [CrossRef] [PubMed]
- Sellers, S.L.; Neighbors, H.W. Effects of goal-striving stress on the mental health of black Americans. J. Health Soc. Behav. 2008, 49, 92–103. [Google Scholar] [CrossRef] [PubMed]
- Sellers, S.L.; Neighbors, H.W. Goal-striving stress, social economic status, and the mental health of black Americans. Ann. N. Y. Acad. Sci. 1999, 896, 469–473. [Google Scholar] [CrossRef] [PubMed]
- James, S.A.; Hartnett, S.A.; Kalsbeek, W.D. John Henryism and blood pressure differences among black men. J. Behav. Med. 1983, 6, 259–278. [Google Scholar] [CrossRef]
- James, S.A. John Henryism and the health of African-Americans. Cult. Med. Psychiatry 1994, 18, 163–182. [Google Scholar] [CrossRef] [PubMed]
- Neighbors, H.W.; Sellers, S.L.; Zhang, R.; Jackson, J.S. Goal-striving stress and racial differences in mental health. Race Soc. Probl. 2011, 3, 51–62. [Google Scholar] [CrossRef]
- Dowd, J.J.; Bengtson, V.L. Aging in minority populations an examination of the double jeopardy hypothesis. J. Gerontol. 1978, 33, 427–436. [Google Scholar] [CrossRef] [PubMed]
- Bowleg, L.; Huang, J.; Brooks, K.; Black, A.; Burkholder, G. Triple jeopardy and beyond: Multiple minority stress and resilience among Black lesbians. J. Lesbian Stud. 2003, 7, 87–108. [Google Scholar] [CrossRef] [PubMed]
- King, D.K. Multiple jeopardy, multiple consciousness: The context of a Black feminist ideology. J. Women Cult. Soc. 1988, 14, 42–72. [Google Scholar] [CrossRef]
- Cole, E.R.; Omari, S.R. Race, class and the dilemmas of upward mobility for African Americans. J. Soc. Issues 2003, 59, 785–802. [Google Scholar] [CrossRef]
- Short, S.E.; Mollborn, S. Social Determinants and Health Behaviors: Conceptual Frames and Empirical Advances. Curr. Opin. Psychol. 2015, 5, 78–84. [Google Scholar] [CrossRef] [PubMed]
- Bécares, L.; Nazroo, J.; Jackson, J. Ethnic density and depressive symptoms among African Americans: Threshold and differential effects across social and demographic subgroups. Am. J. Public Health 2014, 104, 2334–2341. [Google Scholar] [CrossRef] [PubMed]
- Cutrona, C.E.; Wallace, G.; Wesner, K.A. Neighborhood Characteristics and Depression: An Examination of Stress Processes. Curr. Dir. Psychol. Sci. 2006, 15, 188–192. [Google Scholar] [CrossRef] [PubMed]
Figure 1.
Association between income and SRMH by race.


Table 1.
Descriptive statistics in the pooled sample and by race.
| Characteristics | All | Whites | Blacks | |||
|---|---|---|---|---|---|---|
| % | 95% CI | % | 95% CI | % | 95% CI | |
| Race | ||||||
| Whites | 84.76 | 80.94–87.93 | ||||
| Blacks | 15.24 | 12.07–19.06 | ||||
| Gender | ||||||
| Women | 52.80 | 48.72–56.84 | 51.98 | 47.75–56.18 | 57.34 | 44.42–69.33 |
| Men | 47.20 | 43.16–51.28 | 48.02 | 43.82–52.25 | 42.66 | 30.67–55.58 |
| Education (≥12 years) *a | ||||||
| Less than college | 55.46 | 51.36–59.49 | 52.47 | 48.22–56.69 | 72.08 | 59.22–82.10 |
| Completed college | 44.54 | 40.51–48.64 | 47.53 | 43.31–51.78 | 27.92 | 17.90–40.78 |
| Employment *a | ||||||
| Not in labor force | 36.59 | 32.89–40.45 | 38.62 | 34.68–42.72 | 25.28 | 16.71–36.31 |
| In labor force | 63.41 | 59.55–67.11 | 61.38 | 57.28–65.32 | 74.72 | 63.69–83.29 |
| SRMH *a | ||||||
| Good–excellent | 88.22 | 85.06–90.78 | 90.03 | 87.21–92.29 | 78.11 | 64.35–87.58 |
| Poor/Fair | 11.78 | 9.22–14.94 | 9.97 | 7.71–12.79 | 21.89 | 12.42–35.65 |
| Mean | 95% CI | Mean | 95% CI | Mean | 95% CI | |
| Age (years) * | 48.24 | 46.63–49.86 | 50.25 | 48.57–51.94 | 43.48 | 38.17–48.79 |
| Household income (USD10,000) *b | 6.60 | 6.33–6.86 | 6.70 | 6.43–6.97 | 5.54 | 4.62–6.47 |
* p < 0.05 for comparisons of Whites and Blacks. a Pearson Chi square; b independent samples t test. Source: State of the State Survey (SOSS), 2017.
Table 2.
Spearman correlations in the pooled sample and by race.
| Characteristics | 1 | 2 | 3 | 4 | 5 | 6 | 7 |
|---|---|---|---|---|---|---|---|
| 1 Race/ethnicity (Black) | 1.00 | ||||||
| 2 Gender (men) | −0.07 | 1.00 | |||||
| 3 Age | −0.16 * | −0.05 | 1.00 | ||||
| 4 Employment (in labor force) | 0.06 | 0.09 * | −0.46 * | 1.00 | |||
| 5 Education (completed college) | −0.09 * | 0.01 | −0.01 | 0.11 * | 1.00 | ||
| 6 Household Iincome | −0.09 * | 0.16 * | −0.14 * | 0.29 * | 0.37 * | 1.00 | |
| 7 Poor SRMH | 0.05 | −0.07 | −0.10 * | −0.04 | −0.11 * | −0.15 * | 1.00 |
* p < 0.05; Source: State of the State Survey (SOSS), 2017. SRMH: self-rated mental health.
Table 3.
Summary of logistic regressions between household income and poor SRMH in the pooled sample.
Table 3.
Summary of logistic regressions between household income and poor SRMH in the pooled sample.
| Characteristics | Model 1 Main Effects | Model 2 Model 1 + Interactions | ||
|---|---|---|---|---|
| B | 95% CI | B | 95% CI | |
| Race/ethnicity (Black) | 1.93 | 0.87–4.30 | 0.48 | 0.09–2.53 |
| Gender (men) | 0.80 | 0.43–1.48 | 0.76 | 0.41–1.41 |
| Age | 0.96 * | 0.95–0.98 | 0.96 * | 0.95–0.98 |
| Employment (in labor force) | 0.58 | 0.28–1.22 | 0.59 | 0.29–1.20 |
| Education (Completed college) | 0.57 | 0.28–1.14 | 0.59 | 0.30–1.18 |
| Household income | 0.88 ** | 0.78–0.99 | 0.82 * | 0.73–0.92 |
| Household income * race/ethnicity | -- | 1.29 * | 1.01-1.66 | |
* p < 0.05, ** p < 0.01. Outcome: poor self-rated mental health (SRMH). Source: State of the State Survey (SOSS), 2017.
Table 4.
Summary of logistic regressions between household income and poor SRMH in Whites and Blacks.
Table 4.
Summary of logistic regressions between household income and poor SRMH in Whites and Blacks.
| Characteristics | Model 3 Whites | Model 4 Blacks | ||
|---|---|---|---|---|
| B | 95% CI | B | 95% CI | |
| Gender (men) | 0.55 # | 0.28–1.09 | 1.14 | 0.14–9.01 |
| Age | 0.98 * | 0.96–1.00 | 0.89 ** | 0.83–0.95 |
| Employment (in labor force) | 0.72 | 0.35–1.48 | 0.27 | 0.02–3.87 |
| Education (completed college) | 0.89 | 0.44–1.81 | 0.08 # | 0.01–1.34 |
| Household income | 0.81 ** | 0.72–0.90 | 1.10 | 0.74–1.62 |
#p < 0.1, * p < 0.05, ** p < 0.001. Outcome: poor SRMH. Source: State of the State Survey (SOSS), 2017.
© 2018 by the authors. Licensee MDPI, Basel, Switzerland. This article is an open access article distributed under the terms and conditions of the Creative Commons Attribution (CC BY) license (http://creativecommons.org/licenses/by/4.0/).
Share and Cite
MDPI and ACS Style
Assari, S.; Lapeyrouse, L.M.; Neighbors, H.W. Income and Self-Rated Mental Health: Diminished Returns for High Income Black Americans. Behav. Sci. 2018, 8, 50. https://doi.org/10.3390/bs8050050
AMA Style
Assari S, Lapeyrouse LM, Neighbors HW. Income and Self-Rated Mental Health: Diminished Returns for High Income Black Americans. Behavioral Sciences. 2018; 8(5):50. https://doi.org/10.3390/bs8050050
Chicago/Turabian StyleAssari, Shervin, Lisa M. Lapeyrouse, and Harold W. Neighbors. 2018. "Income and Self-Rated Mental Health: Diminished Returns for High Income Black Americans" Behavioral Sciences 8, no. 5: 50. https://doi.org/10.3390/bs8050050
Note that from the first issue of 2016, this journal uses article numbers instead of page numbers. See further details here.