Article

Wildlife Habitat Quality (Sward Structure and Ground Cover) Response of Mixed Native Warm-Season Grasses to Harvesting

1
Agricultural Research Station, Virginia State University, 238 M.T. Carter Bldg, Box 9061, Petersburg, VA 23806, USA
2
Plant and Soil Sciences Department, Mississippi State University, Mississippi State, MS 39762, USA
3
Wildlife, Fisheries & Aquaculture Department, Mississippi State University, Mississippi State, MS 39762, USA
*
Author to whom correspondence should be addressed.
These co-authors contributed equally to this work.
Environments 2014, 1(1), 75-91; https://doi.org/10.3390/environments1010075
Submission received: 4 July 2014 / Revised: 5 August 2014 / Accepted: 6 August 2014 / Published: 15 August 2014

Abstract

:
Agricultural intensification in America has replaced native warm-season grasses (NWSG) with introduced forages causing wildlife habitat loss and population declines for the northern bobwhite (Colinus virginianus) and similar ground-nesting birds. Reintroducing NWSGs onto managed grasslands to reverse grassland bird population declines lacks information about appropriate multi-purpose management. Post-season nesting habitat quality of mixed NWSGs (indiangrass (IG, Sorghastrum nutans), big bluestem (BB, Andropogon gerardii) and little bluestem (LB, Schizachyrium scoparium)) responding to previous-year(s) harvest intervals (treatments, 30-, 40-, 60-, 90 or 120-d) and duration (years in production), were assessed on late-spring-early-summer re-growths. Yearly phased harvestings were initiated in May on sets of randomized plots, ≥90-cm apart, in five replications (blocks) to produce one-, two-, and three-year old stands by the third year. Sward heights and canopy closure were recorded a day before harvest, followed a week after by visual estimates of ground cover of plant species and litter. Harvesting increased post-season grass cover and reduced forbs following a high rainfall year. Harvested plot swards showed no treatment differences, but were shorter and intercepted more sunlight. Similarly, harvest duration increased grass cover with no year effect but reduced forbs following a high rainfall year. One- or two-year full-season harvesting of similar stands may not compromise subsequent bobwhite nesting-cover provided post-season harvesting starts after the breeding cycle is completed.

1. Introduction

Agricultural intensification contributed to bird population declines on farmlands in Europe and America [1]. This mainly resulted from the influence of anthropogenic disturbances on interactions between ecosystem components in the plant communities. Practices such as clearing and burning to prepare seedbeds or remove standing dead mass usually produce dense swards with simple structure and less species diversity, which decrease availability or access to food and leave farm-land birds more exposed to predators and weather [1]. While prescribed burning stimulates new growth of forage plants and reduces bush encroachment [2], tillage favors growth of annual grasses and forbs. Though infrequent application of these practices may not drastically impact habitat quality for wildlife, the reverse is true for extensive and mechanized farm operations. These operations may lead to total loss of wildlife habitat or fragmentation and isolation of their remnant patches thus impacting availability of food and cover [1,3]. This increases predation risks and mortality of young birds unable to escape machinery operations.
In the southeastern U.S., intensive agricultural production also involved replacing native warm season grasses (NWSG) with introduced warm-season forages, such as bermudagrass (Cynodon dactylon), which lack desirable quality features for wildlife habitat [4]. The introduction and cultivation of the introduced species impacted populations of ground-nesting birds, which declined rapidly [4,5]. The northern bobwhite quail (Colinus virginianus), hereafter referred to as “bobwhite”, was the most negatively affected [5]. To reverse the bobwhite population trends, habitat improvement measures have been promoted under initiatives such as the Conservation Reserve Program (CRP) [6]. There have been several federal programs on tallgrass prairie restoration and replacing introduced forage grasses with their dual-purpose native counterparts [7]. In the US southeastern region, the most preferred NWSGs have been the big bluestem (BB, Andropogon gerardii), indiangrass (IG, Sorghastrum nutans), little bluestem (LB, Schizachyrium scoparium), eastern gamagrass (GG, Tripsacum dactyloides) and switchgrass (SG, Panicum virgatum) [7]. These NWSGs are morphologically unique for creating stands with open canopies and free ground space, which also makes room for non-grass species [7,8] and are, therefore, good for grassland bird habitat.

1.1. Sward Structure for Ground-Nesting Birds

Usually, bobwhites and similar ground-nesting birds require visibility while foraging, vigilance to predators, concealment, and easy mobility in the stand [9,10]. Bobwhites require at least 30 to 40 cm of grass height for cover [9]. They also require at least 20% bare ground for good visibility and access to food [9,10], hence their habit to nest in grassy areas located in dead NWSG clumps left over from previous growth. Owing to their unique morphological features, most NWSGs can provide good nesting cover for bobwhites, if managed appropriately.
In managed NWSG communities, sustaining such habitat quality features is challenging and involves strategic ecological management [11,12]. Practices such as disking, mowing, and prescribed burning [13] are often adopted to meet basic habitat requirements of particular grassland birds. Mowing, a common management practice for grassland bird habitat is primarily intended to set back vegetation succession [8,14]. In tallgrass stands, mowing reduces the hormonal suppressive effects of lead tillers in favor of the auxiliary ones. However, it may also have undesirable outcomes if the vegetation response is not closely monitored. In Missouri, for example, annual mowing has been found to encourage dense stands of perennial grasses and a buildup of litter that inhibits bobwhite movements [8]. This was consistent with differences in plant response to defoliation, growing conditions, time allowed for recovery, and nutrient availability [15]. As a result, yield reduction plant−1 due to defoliation is often greater than the respective average ecosystem primary production [15]. Such species differences in response to defoliation have been reported for mixed grass stands of Lolium perenne and Agrostis tenuis with proportions of the latter increasing as clipping interval decreased [16]. Similar observations from a greenhouse study on BB have also been reported [17] for different clipping heights and frequencies. From ecological and agronomic standpoints, management recommendations for mixed NWSG stands should be based on findings from studies conducted in comparable vegetation community settings.

1.2. Justification and Objectives

The southeastern USA has experienced a growing need for farmers to efficiently utilize natural resources on farmlands to diversify and increase their farm incomes, which calls for sustainable ecological management strategies. There is also a growing interest in forage and bio-energy potentials of NWSGs as well as their ecological role in reversing the population declines of the bobwhite and other ground-nesting birds in agricultural landscapes. While the unique morphological features of NWSGs make them good candidates for both forage and grassland-bird habitat, a typical management practice for one aspect may compromise the other. For example, while timing and intensity of defoliation are key decision elements in forage production, these may also impact wildlife habitat quality. There is a paucity of information on appropriate management strategies to improve forage production without negative effects on ground-nesting bird habitat. Therefore, the objective of this study was to evaluate effects of haying frequency on key ground-nesting bird habitat in mixed NWSGs stands dominated by IG, BB, and LB. The study focused on effects of summer defoliation on post-season sward structure and ground cover with reference to bobwhite nesting habitat.

2. Experimental Section

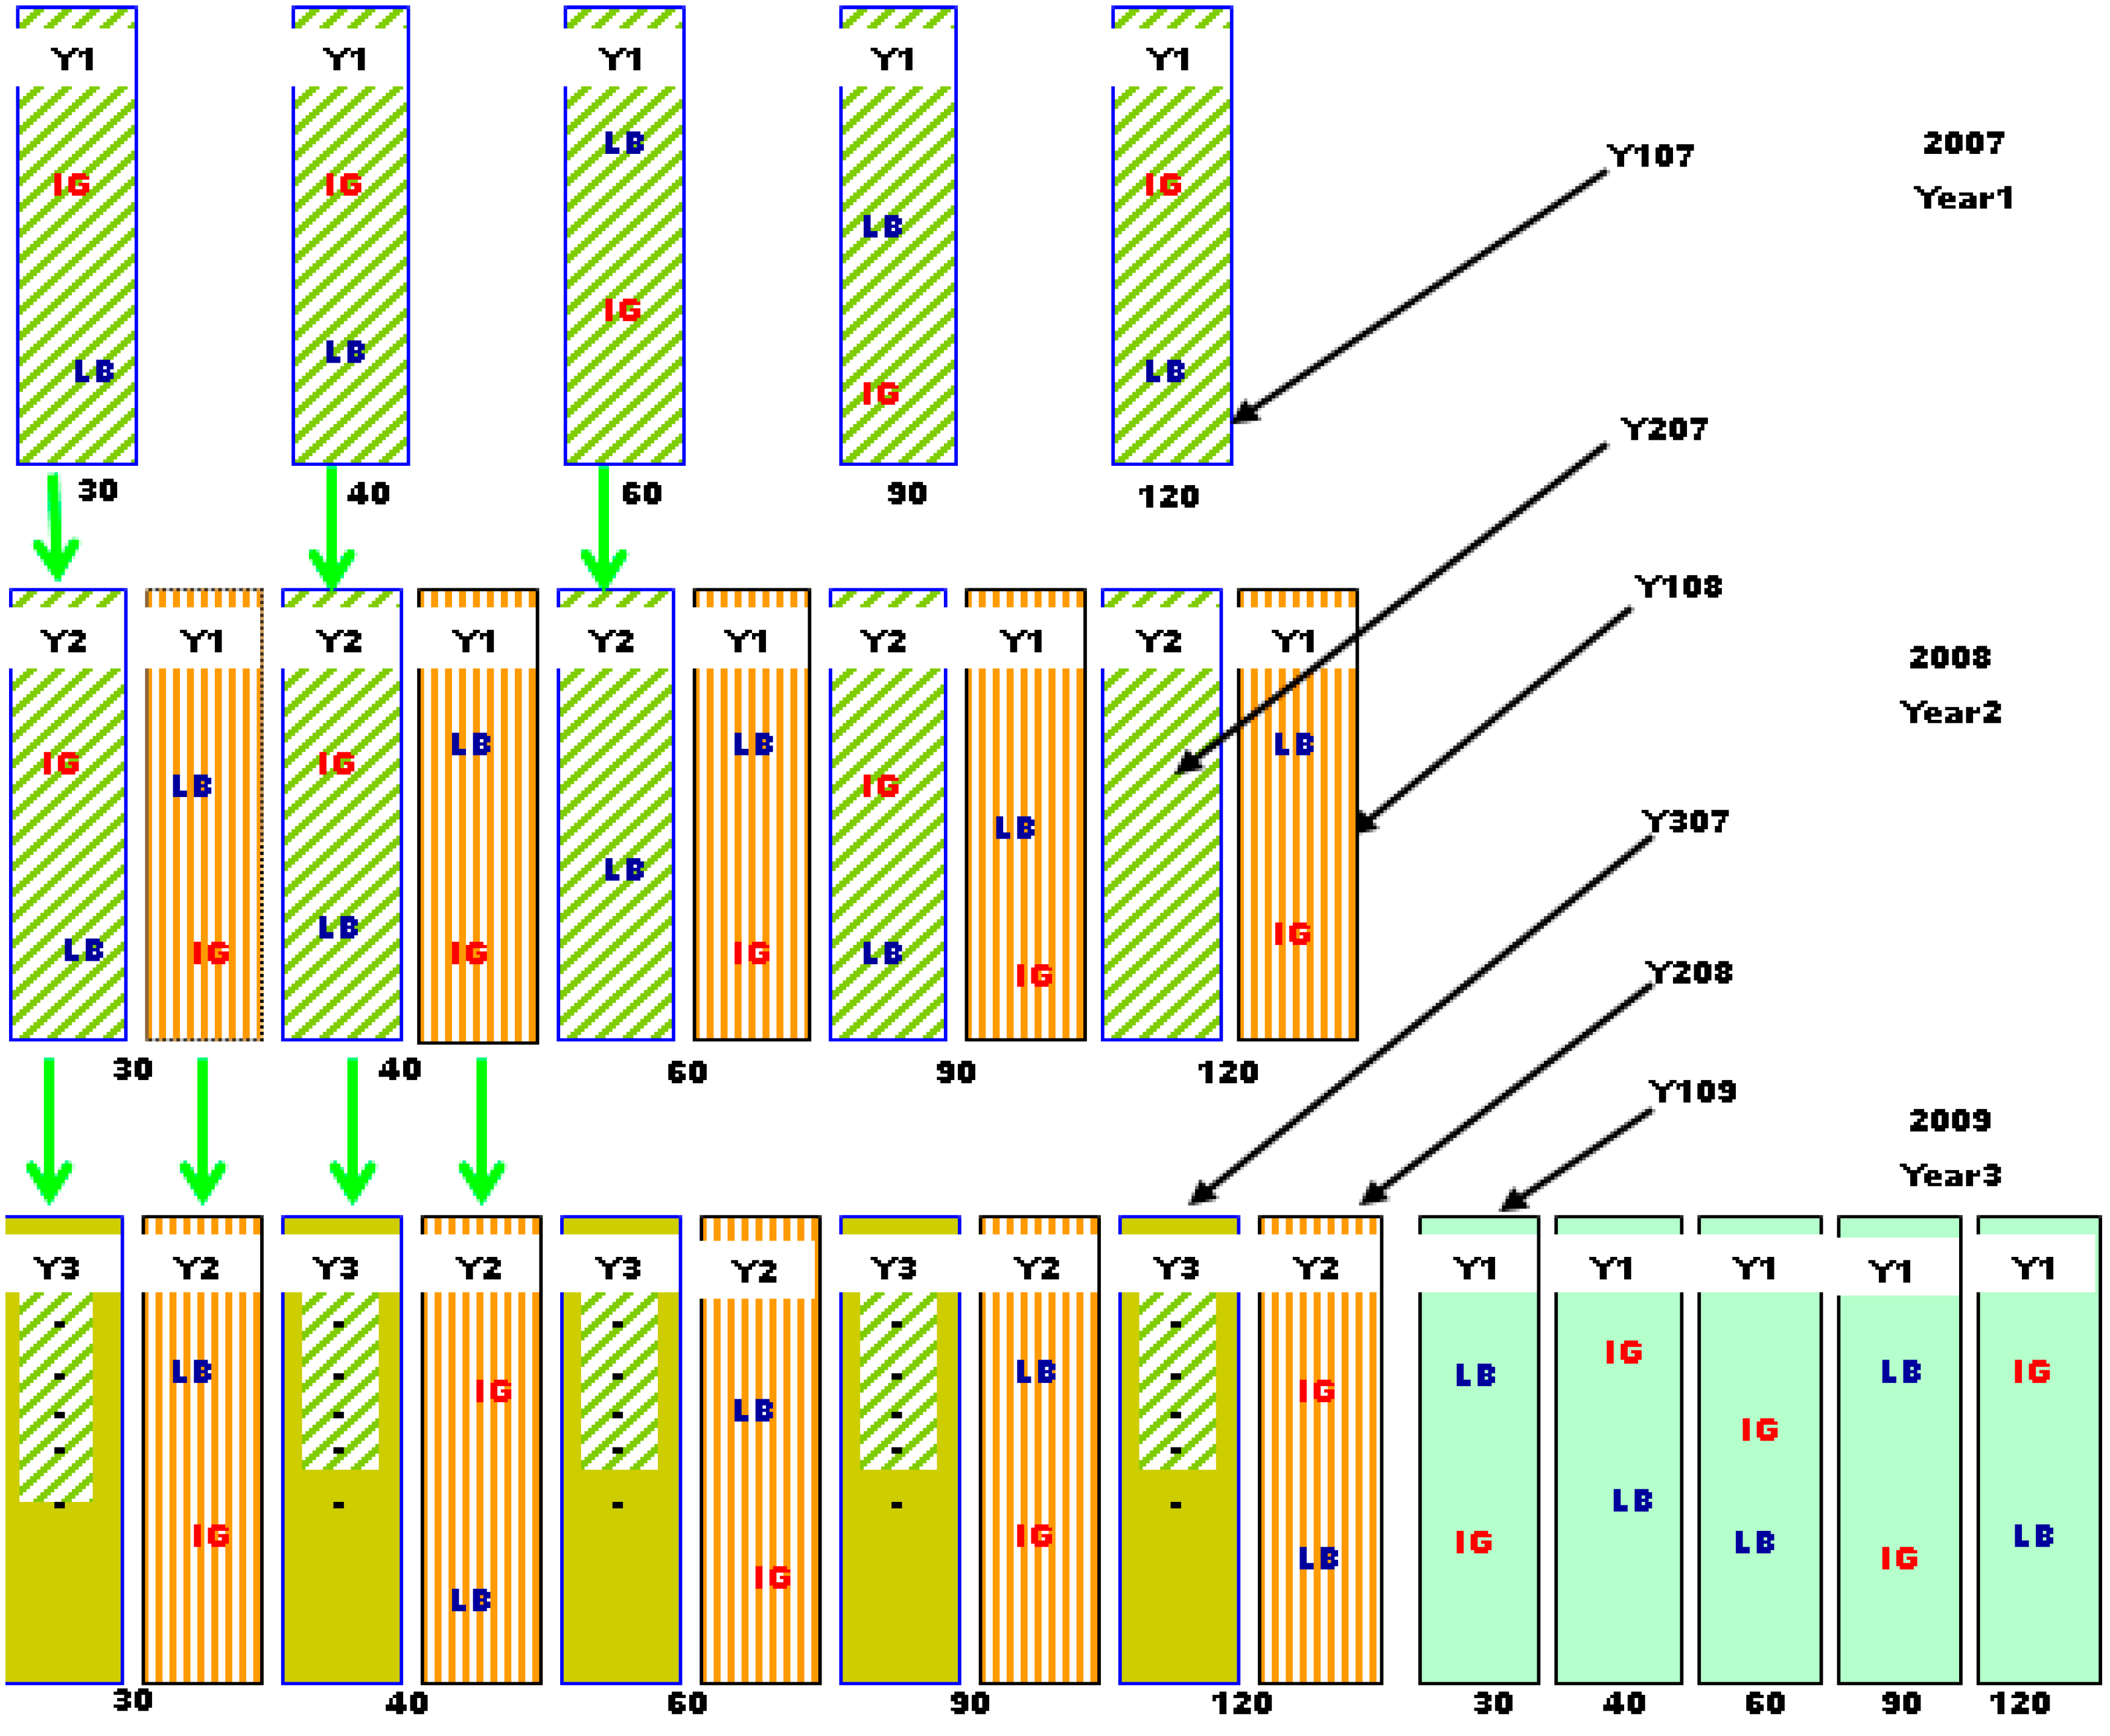
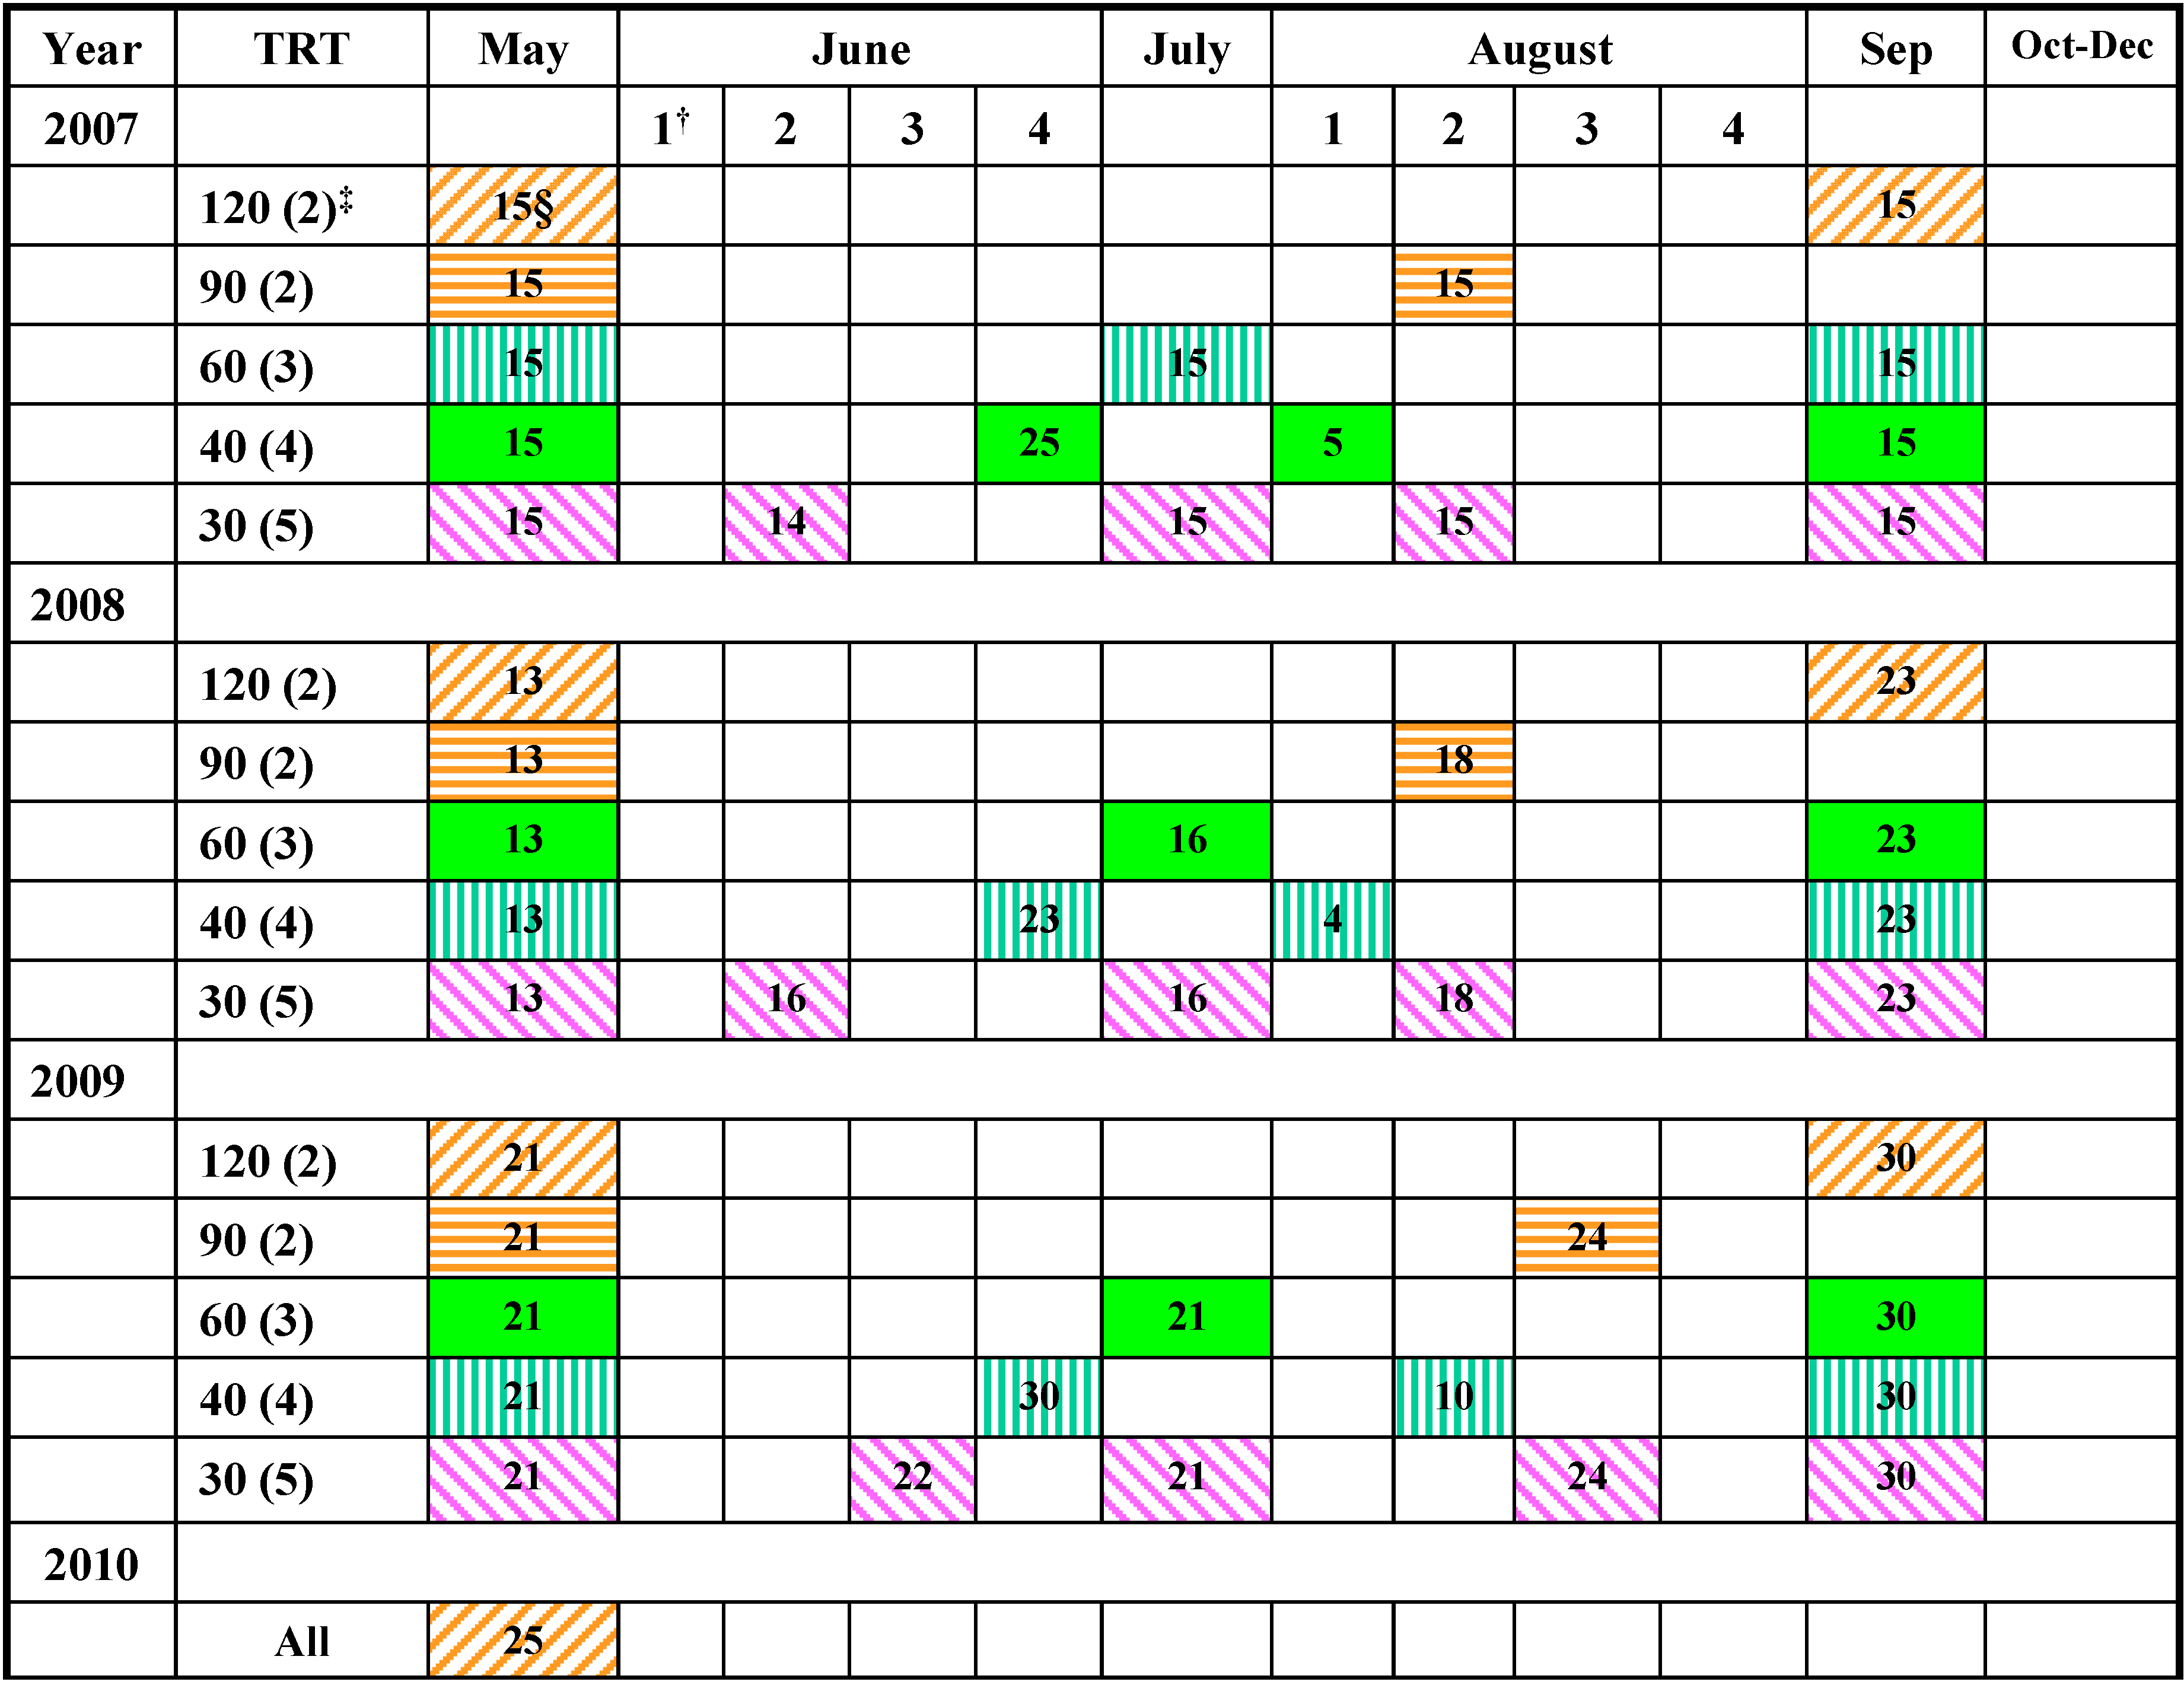
2.1. Location and Field Layout

This study was conducted at Bryan Farms, Clay County (33°39'N; 88°34'W), Mississippi, USA, in unfertilized conservation field buffers planted with mixed NWSGs, at their early-successional stages. Dominant soils in the study area are Griffith silty clay, classified as Fine, smectitic, thermic Aquic Hapludert with pH ranging from 5.0 to 5.6 and Okolona silty clay, classified as Fine, smectitic, thermic Oxyaquic Hapludert with pH range of 6.0 to 7.8.
A seed mixture of 1.12 kg of BB, 2.24 kg of LB, and 1.12 kg of IG ha−1 of prepared seedbed was sown in 2005 and was allowed to grow undisturbed for two years. An extended post-emergence herbicide (imazapic at 0.28 kg a.i ha−h) {(±)-2-[4,5-dihydro-4-methyl-4-(1-methylethyl)-5-oxo-1H-imidazol-2-yl]-5-methyl-3-pyridinecarboxylic acid} was applied to control competitive weeds. In late spring of 2007, five 7.5 × 1-m parallel strips, at least 3 m apart were randomly assigned to five, four, and three harvests at 30-, 40-, and 60-d intervals, respectively, or only two harvests at a 90- or 120-d interval (Figure 1), providing five harvest intervals block−1. Harvesting was done with a 1-m wide Carter Flail Forage Harvester (Carter Manufacturing Company Inc., Boston, IN, USA). The 90-d interval mimicked a standard practice of harvesting a hay crop early in the growing season, and then stockpiling the re-growth for late-season grazing or conservation uses. In a randomized complete block design, these five harvest intervals were replicated in five blocks, three in two buffers of one crop field and two in another field, about 5 km away, on similar soils.
During the spring of 2008, different 7.5 × 1-m plots were marked next to each previous-year plot with 90-cm alleys between the first- and second-year plots for each harvest interval. Plots harvested first in 2007 were designated Y207, indicating they were in their second harvest year (Y2), but had started in 2007 (07). Plots harvested first in 2008 adjacent to Y207 plots were designated Y108, indicating they were in their first harvest year (Y1), but started in 2008 (08). In 2009, a third set of five 7.5 × 1-m plots separated by 90-cm alleys was marked on one end of each block. A total of three plots per harvest interval per block were defined. Adding the third set of plots to the respective block ends was necessary to avoid possible negative effects of the two-year feet and machine traffic on plant growth. For each block, however, an area with relatively uniform species composition, terrain, and plant vigor, large enough to accommodate all three sets of plots, was clearly defined in the first harvest-year. With this arrangement, there were no notable differences in plant performance between third year plots and the rest within a harvest interval. Plots started in 2009 were designated Y109 while the Y108 plots re-designated Y208 and the Y207 became Y307 (Figure 1). In spring of 2009, the Y307 plots were harvested only once in May to assess post-season recovery and then removed from the harvest regime. To avoid shedding, plants in the separating alleys next to harvested plots were also trimmed to the same height, using a hand-held weed eater after each harvest operation.
Figure 1. Plot arrangement in one replication, showing the sequence of yearly phased harvesting initiation. Five first-year plots (Y1) harvested first in mid-May from 2007 to 2009, each 7.5 m long and 1 m wide, assigned to 30-, 40-, 60-, 90-, and 120-d harvest intervals. In each year, plots are labeled Y1, Y2, or Y3 indicating plots beginning their first, second, and third harvest year, respectively.
Environments 01 00075 g001
In mid-May of each year, the plots received a common/equalizing harvest, after which re-growth was harvested on assigned dates throughout the summer (Figure 2). Occasionally, harvesting was hastened by one to two or delayed for up to six days to avoid major rainfall events, thus allowing optimum machine operation. Whole-plot forage was harvested by a meter wide Carter Flail Forage Harvester (Carter Manufacturing Company, Inc., Brookston, IN, USA).
Before each mid-May harvest, three visual estimates of ground cover as vertical projection of vegetation parts above the ground [18] were recorded for each plot. A modified 1-m2 Daubenmire’s frame [18] metal quadrat with one open side was used for cover estimation. Quadrat sides were color-coated in alternating 10-cm bands to facilitate cover estimation, such that a 100 cm2 (10 × 10 cm) equaled one 1% cover. On each sampling station, proportions of total quadrat area covered by grasses and forbs were recorded as percentage grass and forb, respectively. Proportions of quadrat area covered by fallen dead plant parts and those not covered by vegetation or litter were recorded as percentage litter and percentage bare ground, respectively.
Figure 2. Actual harvest dates by harvest interval over the experimental period. Weeks in a month; Days between successive harvests with total harvests year−1, including the equalizing May-harvest, in brackets; § Actual harvest date for the indicated treatment (TRT) in the respective year.
Environments 01 00075 g002
Sward heights were recorded ≤2 days before scheduled whole plot harvests (Figure 2). A meter stick was held horizontally above the sward with one end against a Robel pole and lowered to touch the greatest number of grass leaves at which the sward height (cm) was recorded at 1m intervals. Mean plot sward height was obtained as a five-point average of such measurements. Within 24–48 h prior to harvest, canopy closure was established by measuring the light interception (µmol s−1) through the stand using the LI-191 Line Quantum Sensor (LI-COR 2000, LICOR, Lincoln, NE, USA) between 12:00 and 14:00 h. The percentage light interception was based on the amount of instantaneous photosynthetically active solar radiation (PAR) above the sward (PARa) and that reaching the ground through the canopy (PARb) at five points, 1-m apart [19]. From these five-point readings, the average percent light interception was calculated using equations [1]
[Interception = ∑ [(PARa − PARb)/PARa] × 100/5]

2.2. Data Analyses

Data were analyzed for effects of harvest interval, harvest year, and number of years in production, on sward habitat quality features. The latter compared swards in their first and second harvest-year plots assigned to a harvest interval within a harvest year. Data were subjected to analysis of variance (ANOVA) as a randomized complete block design with harvest intervals, year, and harvest duration (number of years in production) as fixed effects in five replications using the general linear model of SAS Institute, Inc. (Cary, NC, USA) (2007) [20]. Means were separated by Fisher’s protected least significant difference (LSD) at p = 0.05. For mean comparison, all data recorded as percentage were first arcsine transformed, but the results were presented as means of the original data.

3. Results and Discussion

Due to species differences in tolerance and response to tissue damage, defoliation in mixed stands often affects plant species differently. These species differences in kind and magnitude of response to defoliation may cause changes in relative plant performance during recovery. Such changes may result in differences in species contribution to total ground cover and proportions of bare ground patches in the stand as discussed below.

3.1. Harvesting Effects on Ground Cover

Treatment effects on post-season ground cover have implications on habitat quality for most ground-nesting birds. In Mississippi where bobwhites nest early in May with a peak in June, fast recovery of stands from the previous fall-harvest is desirable. In this study, effects of the previous-year harvest regimes (Figure 2) on current-year nesting-cover attributes for bobwhite were assessed. Visual estimates of percentage of ground covered by grasses, forbs, and litter in late-spring growth (mid-May) were compared within and between harvest durations.

3.1.1. Cover by Vegetation

There were significant harvest interval × year interactions on the measured cover attributes, so for each year, results on mean comparisons are discussed separately (Table 1). Within year, there was no significant harvest interval × harvest duration interaction detected. Mean ground cover attributes for the first-year (Y109) and second-year (Y208) plots had similar treatment trends with no harvest duration effect within treatment. Within a harvest-year, therefore, means were pooled across harvest durations for treatment comparison and across harvest intervals for harvest duration comparison.
Just before the 2009 mid-May harvest, percentage ground cover by vegetation showed no treatment effect (Table 1) and averaged about 40 (grass) and 21 (forbs). Although mean post-season grass cover was 10 units below the desirable 50% for bobwhite brooding [21], absence of harvesting effects indicated that NWSG stands could be managed for both forage and wildlife habitat. This difference probably resulted from increased tiller density of perennial grasses or growth of opportunistic annuals. The harvested plots tended to have greater tiller density values in spring and hence greater cover by grass. For perennial grasses, defoliation usually removes the hormonal suppressive effects of lead tillers on the axillary buds [22]. Where defoliation resulted in reduced tiller/plant survival for the perennials, total grass cover appeared to be compensated for by opportunistic annuals.
Table 1. Effects of harvest intervals and duration on post-season ground cover by live vegetation and litter (visual estimates) in mixed native grass stands recorded before mid-May harvest in 2009 and 2010.
TreatmentCover Attributes
GrassForbLitterBare Ground
Environments 01 00075 i001
Harvest interval
Year 2009
Control382636a 1c
120(2) §372114b29a
90(2)392117b23ab
60(3)441916b21b
40(4)441714b25ab
30(5)411913b26ab
Pr > α #0.290.33<0.01<0.01
Year 2010
Control57c25a7a10ab
120(2) §71b15b3c11a
90(2)76ab15b3bc6b
60(3)75ab13b4b8ab
40(4)77a12b4bc7b
30(5)78a12b3bc7b
Pr > α<0.01<0.01<0.010.02
Harvest duration
Year 2009
Control (Y109 ††)38b2636a1b
Y20836b2017b27a
Y30746a1913b22a
Pr > α<0.010.12<0.01<0.01
Year 2010
Control57c25a7a10
Y20972b15b4b9
Y30879a12b3b6
Y40775ab12b4b9
Pr > α<0.01<0.01<0.010.07
Estimates recorded in May 2009 and 2010 from plots entering the first and second harvest-year in 2008 and 2009, respectively; Stands of indiangrass (Sorghastrum nutans) big bluestem (Andropogon gerardii) and little bluestem (Schizachyrium scoparium); § Number of cuts per season with days between successive cuts in brackets; Means within a column followed by different letters differ significantly, α=0.05; # The probability of difference between means within a column, α = 0.05; †† Y109, Y208 and Y307 are first, second, and third harvest year plots established in 2009, 2008 and 2007, respectively.
Similarly, harvest intervals did not affect cover by forbs, which averaged about 21% (Table 1). In mixed stands, management effects on growth of perennial grasses usually reflect on changes in the cover of forbs [23]. However, though defoliation may cause severe damages to tall-growing forbs, which may constitute undesirable decreases in seed producers and may also encourage branching of low-growing herbaceous species. This would cause no significant change on total cover of forbs, as in the present study. The observed sustained forbs cover, therefore, implied a potential for structural heterogeneity in recovering stands; a desirable habitat quality feature for most grassland fauna.
In May of 2010, ground cover was also scored to assess year effect on stand recovery. Unlike in 2009, grass cover in 2010 (Table 1) increased (inclusively) to between 71 (120-d) and 77% (30- and 40-d) exceeding the control (57%) by about 14 to 20, respectively. However, that of forbs in harvested plots was about 12 units less (p < 0.01) than the control (25). The increase in grass cover likely resulted from the unusually high September rainfall (>200 mm) experienced in 2009 compared to a mean of 120 mm in 2007 and 2008 (Figure 3). This likely enabled harvested plants to recover and initiate more axillary buds and reserve carbohydrates for early spring-growth in 2010. It is also likely that an accidental spring fire in 2010 that cleared dead materials and released plant nutrients warmed up the soil sooner and thus favored faster tiller emergence. This greater grass cover following the spring fire was also consistent with increases in net primary production and root length in southern mixed-grass prairies [24]. Spring-burning in mixed tallgrass prairies may also result in warmer soil temperatures and similar improvements in the growth of grasses [25].
Figure 3. Temporal trends in monthly (a) mean temperature (°C) and (b) rainfall total (mm) during the study period, 2007 to 2009, Aberdeen, Mississippi, USA.
Environments 01 00075 g003

3.1.2. Ground Cover by Litter

Another ground cover attribute assessed was litter, because its build up in grass stands may affect movement of chicks through the field and access to food on the ground [10]. In 2009, the proportion of ground covered by litter on the mowed plots averaged 15%, being <50% that on the control (Table 1). Similarly, harvesting in 2010 resulted in an approximately 50% decrease (p < 0.01) in percentage ground covered by litter compared to the control (7%). However, among harvested plots, differences were only significant between the 120-d (3%) and 60-d (4%) treatments. Having less litter cover in harvested plots mainly reflected significant removal of most fallen plant material by the flail forage harvester, which was not the case for the control plots. The removal of the cut material achieved by the harvester might have improved exposure to solar radiation at plant bases, thus warming up the ground sooner in spring. Such changes may have increased seed germination and greening up of dormant tiller buds. The reverse may be the case when mowing for wildlife habitat management practice, which does not involve herbage removal. Thus strategic timing and frequency of mowing could be tailored to improve both forage production and wildlife habitat quality in similar native grass stands.
In 2010, the accidental spring fire also dramatically reduced the litter buildup, resulting in negligible values compared to those in 2009. Still, litter cover in 2010 was nearly twice as high in the control (7%) as in the previously harvested plots. Similarly, harvest duration had no effect on percentage bare ground in 2010.

3.1.3. Bare-Ground Space

While the proportions of ground covered by litter in the harvested plots were about half of the 36% in the control (Table 1), their percentage bare ground was 20–30 times greater than the control (0.9%). Just before the May 2009 harvest, the percentage bare ground among previously harvested plots was only different between the 120-d with 28 (greatest) and the 60-d with 21 (least). Although these values were generally on the lower end of the reported 25%–50% preference range for bobwhite brooding [26], they could still provide birds with access to escape-cover while foraging in adjacent crop fields. Because harvesting reduced litter buildup uniformly across treatments, lack of differences in percentage bare ground was consistent with similarity in grass cover values implying that harvest intervals had no effect on post-season stand recovery. This was actually consistent with the observed lack of effect of previous-year harvest intervals on the first mid-May forage yield [27].
In May of 2010, when an unplanned spring fire engulfed most experimental plots, the percentage bare ground in harvested stands was two to three times less than their corresponding 2009 values. Bare ground for the 120-d harvest interval (11%) was not different from the control (10%), but greater (p < 0.03) than all other treatments, excluding the 60-d (8%). Given that cover of litter at any harvest interval was <5% and about a third of that of the corresponding 2009 values, the decrease in bare ground mostly reflected an increase in grass cover. Additionally, numerical similarities in the forbs cover in 2009 and 2010 also suggested that increases in grass cover were more of vigorous growth rather than tiller density. The fact that all harvested plots still retained substantial voids between vegetation suggested that none of the harvest regimes might compromise habitat quality for ground-nesting birds.

3.2. Harvest Duration Effects on Ground Cover

To assess effects of the harvest intervals on the sustainability of the habitat quality features assessed, post-season canopy closure (May) in plots ending their second harvest year in 2008 (Y307) and those starting a second year in 2009 (Y208) were compared with the control (never harvested before). Because there was no treatment × harvest duration interactions, data were pooled across harvest intervals for the analysis.

3.2.1. Harvest Duration Effects in 2009

In 2009, percentage grass cover among the harvested plots was greater for the retired Y307 plots that had completed two harvest years than (p < 0.01) the control and the Y208 entering the second harvest year (Table 1). The observed greater grass cover for the previously harvested plots may have resulted from the increased tiller density of the perennial grasses consistent with earlier reports [28,29] on grass response to defoliation. Additionally, access to sunlight would be greater in harvested plots and favor emergence of annual grasses.
While percentage grass cover was greater (p < 0.01) in the harvested than the control plots, the reverse was true for forbs, but with no difference due to harvest duration. This lack of harvest duration effect on the cover of forbs probably resulted from their majority being early season annuals, which could not re-grow. It is also possible that seed germination and seedling emergence following defoliation were relatively faster for annual grasses which thus outcompeted forbs for space, light, and soil-based resources. Similarly, there was no difference in 2009 due to harvest duration in the percentage bare ground or litter cover. However, all harvested plots had less (p < 0.01) litter and more bare ground than the control (Table 1). This lack of harvest duration effect on percentage bare ground was, in fact, consistent with the noted greater grass cover for longer harvest durations ascertaining that harvesting resulted with greater post-season tiller density.

3.2.2. Harvest Duration Effects in 2010

To determine year effect on stand recovery, post-season cover was again assessed on the 2010 May data (Table 1), for which a comparison was possible between plots harvested throughout the 2009 season and the Y307 (Y407) retired after the May of 2009 harvest. Percentage grass cover was greater (p < 0.01) in Y308 than the Y209 plots, but the two did not differ from the retired Y407 ones. Different from 2009, percentage grass cover was greater (p < 0.01) in all harvested plots than the control. The values even exceeded the 50% desirable for bobwhite brooding habitat [21], suggesting a better post-season escape cover for the birds. As mentioned earlier, the greater rainfall in September of 2009 and the accidental spring fire in the experimental plots might have improved early re-growth of grass in spring enough to cause year-to-year differences in percentage ground cover. The increase in grass cover was at the expense of forbs for the cover of which decreased (p < 0.01) among the harvested plots. The fact that values for the control plots in 2010 were numerically similar to 2009 suggests that fire likely occurred before forbs germinated and was not strong enough to significantly damage the seeds.

3.3. Sward Heights

In mixed stands, treatment effects on plant performance can also be assessed based on their influence on vegetative growth as reflected in sward heights [30,31]. In the current study, two post-season treatment comparisons of sward heights were possible (Table 2) between May 2009 and 2010. In 2009, May sward heights in Y208 and Y307 plots, previously harvested at the same interval, showed no effect of harvest duration. Sward heights in these previously harvested plots were shorter than their corresponding Y109 plots (control), except for the Y208 at 60-d interval. Shorter sward heights for previously harvested stands were expected due to preferential resource allocation to shoot growth at the expense of roots, as grasses respond to defoliation [32]. Root growth cessation is a plant’s response to defoliation that enhances the reestablishment of photosynthetic canopy and root to shoot balance, so bunch grasses can tolerate herbivory [33].
Table 2. Effect of harvest interval and duration on sward heights and canopy closure of mixed native grass stands measured before planned mid-May harvesting events in 2009 and 2010.
Harvest IntervalMay 2009May 2010
Y109 §Y208Y307Y209Y308Y407
Sward Heights
Environments 01 00075 i002
Control5858a 58a45a45a45
120(2) #5641b41b29b28b30
90(2)53 A38b B35b B28b29b31
60(3)52 A39b AB34b B28b28b34
40(4)54 A35b B32b B27b25b32
30(5)56 A32b B32b B28b25b32
Pr > α ††0.910.02<0.01<0.01<0.010.06
Light interception
Environments 01 00075 i003
Control6161a61a626262
120(2)58 A33b B40b B464248
90(2)63 A34b B36b B554545
60(3)63 A36b B40b B534445
40(4)56 A32b B31b B564442
30(5)54 A32b B37b B534244
Pr > α0.64<0.01<0.010.900.520.72
Means of five point sward height measurements and differences in light intensity above and below canopy, in percentages, at 1 m intervals along the plot; Stands of indiangrass (Sorghastrum nutans) big bluestem (Andropogon gerardii) and little bluestem (Schizachyrium scoparium); § Y109, Y208, Y307, andY407 are first, second, third, and fourth year plots established in 2009, 2008 and 2007, respectively; Means followed by different lower case letters, within a column, or upper case letters, within a row, differ significantly, α = 0.05; # Number of harvests per season with days between successive harvests in brackets; †† The probability of difference between means within a column, α = 0.05.
Within harvest durations, effects of previous defoliation intensity on post-season spring-growth were also observed. Mean sward heights in the Y208 and Y307 stands averaged 36 cm and were therefore shorter (p < 0.03) than the control (58 cm). These sward heights were well above the desirable 30-cm minimum for early season bobwhite nesting cover [10], which indicated that mixed native grass stands, harvested for one or two consecutive years, could still provide early-season cover to similar ground-nesting birds. The lack of difference in sward heights between harvested plots was consistent with measured ground cover values, asserting that the recovery growth period was long enough even for more severely defoliated plants to catch up. These results have implications for reliability of post-season recovery growth to restore a nesting habitat for similar grassland birds after a full year of forage harvesting. Under comparable growing conditions, appropriate in-season management could boost growth performance of similar previously-harvested stands. Such interventions may include fertilizer application and/or spring burning.
To account for annual variations in growing conditions, mainly rainfall and temperature, on early-spring growth of previously harvested stands, sward-heights in mid-May 2010 were also compared. There was no effect of harvest duration on mean sward heights (Table 2). As in May of 2009, mean sward heights were not different between harvest intervals. However, in harvested plots (Y209 and Y308), swards were ≥17 cm shorter than in controls (45 cm). Mean sward heights in the Y408 plots (harvested last in May of 2009) averaged 32 cm, but were not significantly different from the control at the p = 0.05. The lack of difference in previous defoliation intensity suggests that recovery growth in spring was more influenced by growing conditions than management history, which may also explain the 7-cm year difference between control plots.

3.4. Sward Canopy Closure

Response to defoliation intensity was also assessed based on canopy closure, which is usually influenced by stand density, leafiness, and canopy spread [34]. For this assessment, light interception records were taken concurrently with the sward heights. In 2009, light interception before the May harvest was greater in the Y109 than in the corresponding Y208 and Y307 plots (Table 2). This was expected since the Y109 plots had not been harvested yet. The fact that these results are in reverse order to those of ground cover, but consistent with the corresponding sward heights, suggests that differences in light interception are more likely due to canopy spread than tiller density. Taller swards were more likely to lean over than their shorter previously harvested counterparts, which may also explain the lack of differences due to harvest duration. Greater light interception in the control plots may also have been attributable to the presence of dead standing mass (field observations). The observed lower light interception in the harvested plots has habitat quality implications for ground nesting birds and the related wild fauna, as it affects visibility of food material on the ground and also the likelihood of being discovered by predators. Although values were far below the suggested minimum of 60% [35] for brooders to be sufficiently concealed from predators, most native grasses in the study area were still in their active vegetative stage suggesting significant canopy before the first nestlings were hatched sometime in June. The lack of harvest duration effect on canopy closure also suggests that, with similar stands and growing conditions, harvesting for two consecutive years might not compromise early season nesting cover for bobwhites.
In the second assessment of treatment effects on post-season sward structure, May light interception during 2010 was compared between and within treatments. Neither harvest duration nor harvest interval affected light interception by May (Table 2). Furthermore, differences in light interception between harvested plots and the control were not observed. This lack of differences due to treatment or harvest duration may have also been, in part, a result of the accidental spring fire that cleared most of the standing dead mass. This made canopy closure a product of spring growth alone. Still, differences in harvest intervals in the previous year were masked by recovery growth in spring.

4. Conclusions

The fact that differences in post-season cover by vegetation or plant litter, among harvested plots, were not observed in one year and were only between the 30- and 120-d in the other year indicated that careful haying in one year may not compromise early summer wildlife habitat quality features associated with sward structure in the following year. The data also suggested that managers could vary harvesting intervals to influence in-season forage yield and quality without compromising early-season stand recovery in the following year. Ground cover data indicated that harvesting might significantly improve post-season wildlife habitat quality attributes associated with increases in open ground space, following a normal rainfall year, but not one with high September rainfall.
While harvesting for two consecutive years will likely increase post-season cover by grasses, such increases may not be sustained in stands retired from harvesting and allowed to recover. Eventually, cover of grass in retired stands adapt towards that in unharvested neighbors. In summary, similar mixed stands could be intensively harvested for hay in the growing season of one year without compromising the nesting habitat quality for bobwhites in the following year, provided that such stands had not been harvested before the bobwhite breeding cycle was completed. However, there is a need to assess how these noted responses to harvesting might reflect in species composition, which has implications on forage quality and season-long availability of wildlife feeds. Effects of other management practices, such as burning and cultivation on various nesting habitat quality features of the mixed stands in this region are also worth investigating.

Acknowledgments

The authors are grateful to the USDA NRCS Agriculture Wildlife Conservation Center for funding the research as well as to the B. Bryan Farms’ permission to conduct the research on their property. Equally appreciated is the logistic and technical support provided by the Department of Plant and Soil Sciences at Mississippi State University and the Virginia State University, Agricultural Research Station, during the research and manuscript preparation. This article is a contribution of the Department of Plant and Soil Sciences, Mississippi State University, Mississippi Agricultural and Forestry Experiment Station, paper No. J-12553.

Author Contributions

Vitalis W. Temu executed the study, analyzed data, and drafted the manuscript which was revised by all co-authors. Brian S. Baldwin, Samuel Riffell and Loren W. Burger listed co-authors produced the original idea for the study.

Conflicts of Interest

The authors declare no conflict of interest.

References

  1. Wilson, J.D.; Whittingham, M.J.; Bradbury, R.B. The management of crop structure: A general approach to reversing the impacts of agricultural intensification on birds. IBIS 2005, 47, 453–463. [Google Scholar]
  2. Knapp, A.K.; Seastedt, T.R. Detritus accumulation limits productivity of tallgrass prairie. BioScience 1986, 36, 662–668. [Google Scholar] [CrossRef]
  3. Shea, A.B. The Return of Native Grasses to Tennessee. 1999. Available online: http://www.tn.gov/environment/conservationist/archive/grass.htm (accessed on 12 August 2009). [Google Scholar]
  4. Atkinson, P.W.; Buckingham, D.; Morris, A.J. What factors determine where invertebrate-feeding birds forage in dry agricultural grasslands? IBIS 2004, 146, 99–107. [Google Scholar] [CrossRef]
  5. Brenna, L.A. How can we reverse the northern bobwhite population declines? Wildl. Soc. Bull. 1991, 19, 544–555. [Google Scholar]
  6. Riffell, S.; Scognamillo, D.; Burger, L.W. Effects of the Conservation Reserve Program on northern bobwhite and grassland birds. Environ. Monit. Assess. 2008, 146, 309–323. [Google Scholar] [CrossRef]
  7. Harper, C.A.; Moorman, C.E. Qualifying native warm-season grasses and early succession habitat. In Proceedings of the 11th Triennial National Wildlife and Fisheries Extension Specialists Conference, Big Sky, MT, USA, 14–18 October 2006; Timm, R.M., Harper, C.A., Higginbotham, B.J., Parkhurst, J.A., Eds.; p. 10.
  8. White, B.; Graham, P.; Pierce, R.A., II. Missouri Bobwhite Quail. Habitat Appraisal Guide: Assessing Your Farm’s Potential for Bobwhites. 2005. Available online: http://extension.missouri.edu/explorepdf/miscpubs/mp0902.pdf (accessed on 25 October 2008).
  9. Lusk, J.J.; Smith, S.G.; Fuhlendorf, S.D.; Guthery, F.S. Factors influencing northern bobwhite nest-site selection and fate. J. Wildlife. Manag. 2006, 70, 564–571. [Google Scholar] [CrossRef]
  10. Jones, J.; Coggin, D.S.; Cummins, J.L.; Hill, J. Restoring and Managing Native Prairies. A Handbook for Mississippi Landowners; Wildlife Mississippi: Starkville, MS, USA, 2007. [Google Scholar]
  11. McCoy, T.D.; Kurzejeski, E.W.; Burger, L.W., Jr.; Ryan, M.R. Effects of conservation practice, mowing, and temporal changes on vegetation structure on CRP fields in northern Missouri. Wildl. Soc. Bull. 2001, 29, 979–987. [Google Scholar]
  12. Greenfield, K.C.; Burger, L.W., Jr.; Chamberlain, M.J.; Kurzejeski, E.W. Vegetation management practices on conservation reserve program fields to improve northern bobwhite habitat quality. Wildl. Soc. Bull. 2002, 30, 527–538. [Google Scholar]
  13. Greenfield, K.C.; Chamberlain, M.J.; Burger, L.W., Jr.; Kurzejeski, E.W. Effects of burning and discing Conservation Reserve Program fields to improve habitat quality for northern bobwhite (Colinus virginianus). Am. Midl. Nat. 2003, 149, 344–353. [Google Scholar] [CrossRef]
  14. Helzer, C. Using Defoliation of Dominant Grasses to Increase Prairie Plant Diversity. 2011. Available online: http://prairieecologist.com/2011/03/15/using-defoliation-of-dominant-grasses-to-increase-prairie-plant-diversity (accessed on 25 March 2011).
  15. Ferraro, D.O.; Oesterheld, M. Effect of defoliation on grass growth. A quantitative review. Oikos 2002, 98, 125–133. [Google Scholar] [CrossRef]
  16. Alexander, K.I.; Thompson, K. The effect of clipping frequency on the competitive interaction between two perennial grass species. Oecologia (Berlin) 1982, 53, 251–254. [Google Scholar]
  17. Woodis, J.E.; Jackson, R.D. The effects of clipping height and frequency on net primary production of Andropogon gerardii (C4 grass) and Bromus inermis (C3 grass) in greenhouse experiments. Grass Forage Sci. 2008, 63, 458–466. [Google Scholar] [CrossRef]
  18. Bonham, C.D.; Mergen, D.E.; Montoya, S. Plant cover estimation: A contiguous daubenmire frame. Rangelands 2004, 26, 17–22. [Google Scholar] [CrossRef]
  19. Pedreira, C.G.S.; Sollenberger, L.E.; Mislevy, P. Botanical composition, light interception, and carbohydrate reserve status of grazed ‘Florakirk’ Bermudagras. Agron. J. 2000, 92, 194–199. [Google Scholar] [CrossRef]
  20. SAS Institute. SAS Version 9.2, SAS Institute: Cary, NC, USA, 2007.
  21. Burger, L.W., Jr.; Ryan, M.R.; Kurzejeski, E.W.; Dailey, T.V. Factors affecting the habitat value of conservation reserve program lands for northern bobwhite in northern Missouri. In Proceedings of the NCT-163 Post Conservation Reserve Land Use Conference, Denver, CO, USA, 10–11 January 1994; Dicks, M., Monsoon, M., Eds.; pp. 142–156.
  22. Manske, L.L. Biologically Effective Grazing Management. 2003. Available online: http://www.ag.ndsu.edu/archive/dickinso/research/2003/range03a.htm (accessed on 10 July 2008).
  23. Damhoureyeh, S.A.; Hartnett, D.C. Effects of bison and cattle on growth, reproduction, and abundances of five tallgrass prairie forbs. Am. J. Bot. 1997, 84, 1719. [Google Scholar] [CrossRef]
  24. Hubbard, J.A. Fire-Grazing Interactions in a Mixed Grass Prairie. Ph.D. Dissertation, Texas A&M University, College Station, TX, USA, 2003. [Google Scholar]
  25. Bremer, D.J.; Ham, J.M. Effect of spring burning on the surface energy balance in a tallgrass prairie. Agric. For. Meteorol. 1999, 97, 43–54. [Google Scholar] [CrossRef]
  26. Carver, A.V.; Burger, L.W., Jr.; Palmer, W.P.; Brennan, L.A. Vegetation characteristics in seasonal-disked fields and at bobwhite brood locations. In Proceedings of the Annual Conference Southeastern Association Fish and Wild Agencies, Louisville, KY, USA, 28 October–1 November 2001; Eversole, A.G., Ed.; pp. 436–444.
  27. Temu, V.W.; Rude, B.J.; Baldwin, B.S. Yield response of native warm-season forage grasses to harvest intervals and durations in mixed stands. Agronomy 2014, 4, 90–107. [Google Scholar] [CrossRef]
  28. Briske, D.D. Plant response to defoliation: Morphological Considerations and Allocation Priorities. In Rangelands: A Resource Under Siege; Joss, P.J., Lynch, P.W., Williams, O.B., Eds.; Cambridge University Press: Cambridge, UK, 1986; pp. 425–427. [Google Scholar]
  29. Briske, D.D.; Richards, J.H. Plant Responses to Defoliation: A Physiological, Morphological and Demographic Evaluation. In Wildland Plants: Physiological Ecology and Developmental Morphology; Bedunah, D.J., Sosebee, R.E., Eds.; Society for Range Management: Denver, CO, USA, 1995; pp. 635–710. [Google Scholar]
  30. Michalk, D.L.; Herbert, P.K. Assessment of four techniques for estimating yield on dryland pastures. Agron. J. 1977, 69, 864–868. [Google Scholar] [CrossRef]
  31. Harmoney, K.R.; Moore, K.J.; George, J.R.; Brummer, E.C.; Russell, J.R. Determination of pasture biomass using four indirect methods. Agron. J. 1997, 89, 665–672. [Google Scholar] [CrossRef]
  32. Jatimliansky, J.R.; Gimenez, D.O.; Bujan, A. Herbage yield, tiller number and root system activity after defoliation of prairie grass (Bromus catharticus Vahl). Grass Forage Sci. 1997, 52, 52–62. [Google Scholar]
  33. Richards, J.H. Root growth response to defoliation in two Agropyron bunchgrasses: Field observations with an improved root periscope. Oecologia (Berlin) 1984, 64, 21–25. [Google Scholar] [CrossRef]
  34. McNaughton, S.J. Laboratory-simulated grazing: Interactive effects of defoliation and canopy closure on Serengeti grasses. Ecology 1992, 73, 170–182. [Google Scholar] [CrossRef]
  35. Palmer, W.E. Effects of Modern Pesticides and Farming Systems on Northern Bobwhite Quail Brood Ecology. Ph.D. Dissertation, North Carolina State University, Raleigh, NC, USA, 1995. [Google Scholar]

