Article

Green Economy Modelling of Ecosystem Services along the “Road to Dawei”

by
Andrea M. Bassi
1,*,
Louise A. Gallagher
2 and
Hanna Helsingen
3
1
KnowlEdge Srl, Olgiate Olona 21057, Italy
2
Luc Hoffmann Institute, Gland 1196, Switzerland
3
WWF-Myanmar, Yangon 11191, Myanmar
*
Author to whom correspondence should be addressed.
Environments 2016, 3(3), 19; https://doi.org/10.3390/environments3030019
Submission received: 9 February 2016 / Revised: 8 July 2016 / Accepted: 14 July 2016 / Published: 20 July 2016
(This article belongs to the Special Issue Land Use Change in the Changing Environment)

Abstract

:
This review of the study “Road to Dawei”, conducted by WWF Greater Mekong, seeks to assess economic, social and environmental impacts of road construction between Kanchanaburi, Thailand and Dawei, Myanmar. It also aims to identify relevant Green Economy policy interventions that would enhance the sustainable use and conservation of natural capital, which is considered to be a foundation for sustainable and inclusive economic development. In particular, the study concentrates on the identification of feedback loops, delays and nonlinearity in order to properly map the socio-economic and environmental system analysed and inform decision making. Results are presented for three different scenarios both for Myanmar and for Thailand. Simulation results show that a conventional approach to road construction is likely to have positive economic impacts in the region, especially in the short term, but also negative consequences for the integrity of the ecosystem, which in turn might also negatively impact on the investment itself and its economic outcomes in the medium and longer term. Further, results indicate that green economy interventions would mitigate environmental risks by creating synergies across sectors, systemically.

Graphical Abstract

1. Introduction

Large-scale and interconnected infrastructure projects between urban nodes, power facilities, irrigation schemes and other places or elements of economic and social activities are instruments for harnessing economic potential in fast-developing regions of the world from a strategic planning perspective. While infrastructure projects positively affect trade patterns and development outcomes, they also profoundly influence the integrity of natural systems [1,2]. Yet, the risks to complex natural systems that the world relies on for ecosystem goods and services are rarely considered in this process, even though this risk presents potential economic costs that could outweigh the benefits of the project proposed [3]. Natural systems are in fact often representing “ecological infrastructure” underpinning built infrastructure projects. In short, there are unintended and unforeseen consequences of physical construction of infrastructure projects that jeopardise economic development goals that are longer term or difficult to measure financially [4].
One of the challenges in maintaining natural capital is the lack of economic evidence for the role that sustainable ecosystems and natural resource management play in economic and social development [5]. Bluntly stated, the value of maintaining natural capital is not always obvious to decision-makers and stakeholders choosing pathways to economic development [6]. Development planning that aims to leverage (built) infrastructure development for greater progress for all requires that financial analyses for infrastructure projects incorporates economic assessments of social and environmental impacts; and, equally, social and environmental assessments for infrastructure projects to quantify socioeconomic outcomes. One critical need in conservation science and policymaking is to overcome the silo mentality separating social, environmental and economic assessment to generate information that can support infrastructure project decision-makers effectively.
An example of integrated development planning for large-scale infrastructure projects is the study “Road to Dawei” conducted by WWF Greater Mekong. The study seeks to assess economic, social and environmental impacts of road construction between Kanchanaburi, Thailand, and Dawei, Myanmar, and identify relevant green economy policy interventions that would enhance the sustainable use and conservation of natural capital as a foundation for sustainable and inclusive economic development. In particular, the study focuses on the road construction project both in the Thai and Myanmar area affected by the construction of the road, and concentrates on the identification of feedback loops, delays and nonlinearity in order to properly map the socio-economic and environmental system analysed and inform decision making.

The “Road to Dawei” Case Study

The study “Road to Dawei” was conceived as a pilot project, aiming at designing an integrated framework to inform and support land use planning support in this context. Three different scenarios were simulated to anticipate possible impacts on economic, social and environmental indicators and impacts for the construction of roads connecting Bangkok to Dawei via Kanchanaburi, in the framework of the Dawei Project.
Southeast Asian cities are growing, infrastructure projects are making local markets more accessible for investments; and environmental quality issues faced by developed countries are becoming visible in the region too. In 2008, the Dawei deep sea port project was approved as a joint effort of the governments of Thailand and Myanmar, with a recent addition of Japan. In June 2013, Thailand and Myanmar agreed to set up the Dawei Special Economic Zone (DSEZ) project. The initial phase includes a port, industrial estate, power plant, a water reservoir, telecommunications landline, gas power plant and a two-lane road. The DSEZ and its planned road link will cut directly across the Tenasserim Hills connecting Dawei with Bangkok, via Kanchanaburi. The Dawei Project is currently in Phase 1, which involves the construction of a section of the road between Dawei and the Thai border and further on to Kanchanaburi.
The construction of the road link from Dawei to the Thai border crossing at Pun Nam Ron/Htee Kee is likely to have considerable impacts on land use in the Dawna Tenasserim Landscape, one of the last large intact forest landscapes in the region, harbouring a rich array of endangered wildlife found in few other places. This transboundary landscape straddles Thailand and Myanmar. The forest blocks running north–south in Tanintharyi region link two forest blocks in Thailand, the Western Forest Complex and Kaeng Krachan Forest Complex.
WWF-Myanmar and WWF-Thailand, in collaboration with WWF Greater Mekong and other national and international stakeholders, conducted mapping and valuing of natural capital and ecosystem services in the concerned area. The objective is to understand how to establish an ecological corridor would support wildlife and ecosystem services, critical to the well-being of people in the area. The geographical focus of the study is both the Thai and Myanmar side of the road construction area. The System Dynamics modelling methodology is adopted to identify, map and quantify the key drivers of the system and make projections of expected economic, social and environmental impacts of the construction work and utilization of the road, along with resulting changes in land-use.

2. Green Economy and Development Planning

2.1. Beyond the Silo Mentality

Decision-making at national and local level is often carried out through a “silo mentality” aimed at helping reduce complexity and speed up policy making, but which in turn fragments management and hides cross-sector impacts that have a large effect in the system. A poor understanding of the causal link between policy and actions mean we can trigger events with extreme impact that, in retrospect, were predictable. Sustainability is an overarching framework that informs policy planning and activity, attempting to break down “silos” and integrate social and environmental concerns into development planning processes. It asks that the economic growth or development planning process is a coordinated, participatory and continuously improving set of processes with the goal of integrating the economic, social and environmental objectives of society or seeking trade-offs where this is not possible [7].
This is challenging because modern society, in an effort to deal with the complexity of managing social-ecological systems, favours the establishment of sector based management “silos” for efficiency. Silos in policy and planning are needed to focus expertise, knowledge and capacity. Yet the operational convenience of a silo approach may result in resource allocation choices being made to meet the interests and needs of one sector or group at the exclusion or cost of others. Along the same line, optimizing sectoral performance, rather than aiming to coherently improve the whole system, is likely to lead to an increase in vulnerability. Society, the economy and the environment are interconnected and while models are simplifications of reality, we need tools that can properly represent the complexity of the world we are living in.
Economic and development planning is the critical process for identifying overarching development goals and measures of development success, as well as specific policy and investment interventions at regional, national and localized scales for the desired goals to be achieved [8]. A wide variety of public and private decision-making processes exists, ranging from national land-use plans to annual budgetary processes, and including infrastructure projects, as well as sectoral policies. Various institutional arrangements have been created in different countries for development planning but the process generally consists of five steps [9], irrespective of the context: (1) issue identification and agenda setting, where the priorities for action are defined; (2) identification and assessment of intervention options; (3) decision-making, including the enactment of plans and/or policies into law; (4) implementation, including investment and enforcement; and (5) monitoring and evaluation of plan and/or policy impacts.
As Varone [10] frames it, the “wicked problem” is that we have multiple goals for different sectors and groups within regions and countries. This is then likely to generate important side effects, and greatly increase the effort required to reach stated development goals. We need to start from a point of understanding of what we want to achieve as a society—recognizing that this is not a single scale and group—then look to see what way is best to do this for all, given the resources available to us.
In the policy arena, a growing number of initiatives aim to estimate the value of “side effects” realised through unsustainable degradation of natural capital and reductions in ecosystem service flows. The Economics of Ecosystems and Biodiversity process launched by UNEP and partners in 2008 [11] has contributed significantly to synthesising the body of knowledge on methods and influences of information on valuing nature. The current process on the Sustainable Development Goals [12] and developing indicators for these aim to recognise the significant interconnections between ecosystem management and development goals. Economic and Environmental Accounting is being championed by UN Statistics Division (SEEA-EEA) [13] and implemented by initiatives such as the World Bank’s Wealth Accounting and Valuation of Ecosystem Services (WAVES) program [14]. The International Panel on Biodiversity and Ecosystem Services [15] is a mechanism established in 2012 and recognized by both the scientific and policy communities to synthesize, review, assess and critically evaluate relevant information and knowledge generated worldwide by an array of actors. In the area of biodiversity financing, valuing nature is realised through payments for ecosystem services, and through the use of REDD+ as a means to mitigate greenhouse gas emissions by preserving forests for their carbon sequestration capabilities as well as other benefits to local communities.
By embracing the full spectrum of values that people derive from nature, we can plan better to maintain them. The willingness of initiatives to incorporate multiple objectives into management, their emphasis on capacity building and stakeholder coordination, and their efforts to integrate multiple sectors and stakeholders point to important changes from previous approaches to conservation and development.

2.2. Rationale for Green Economy Interventions
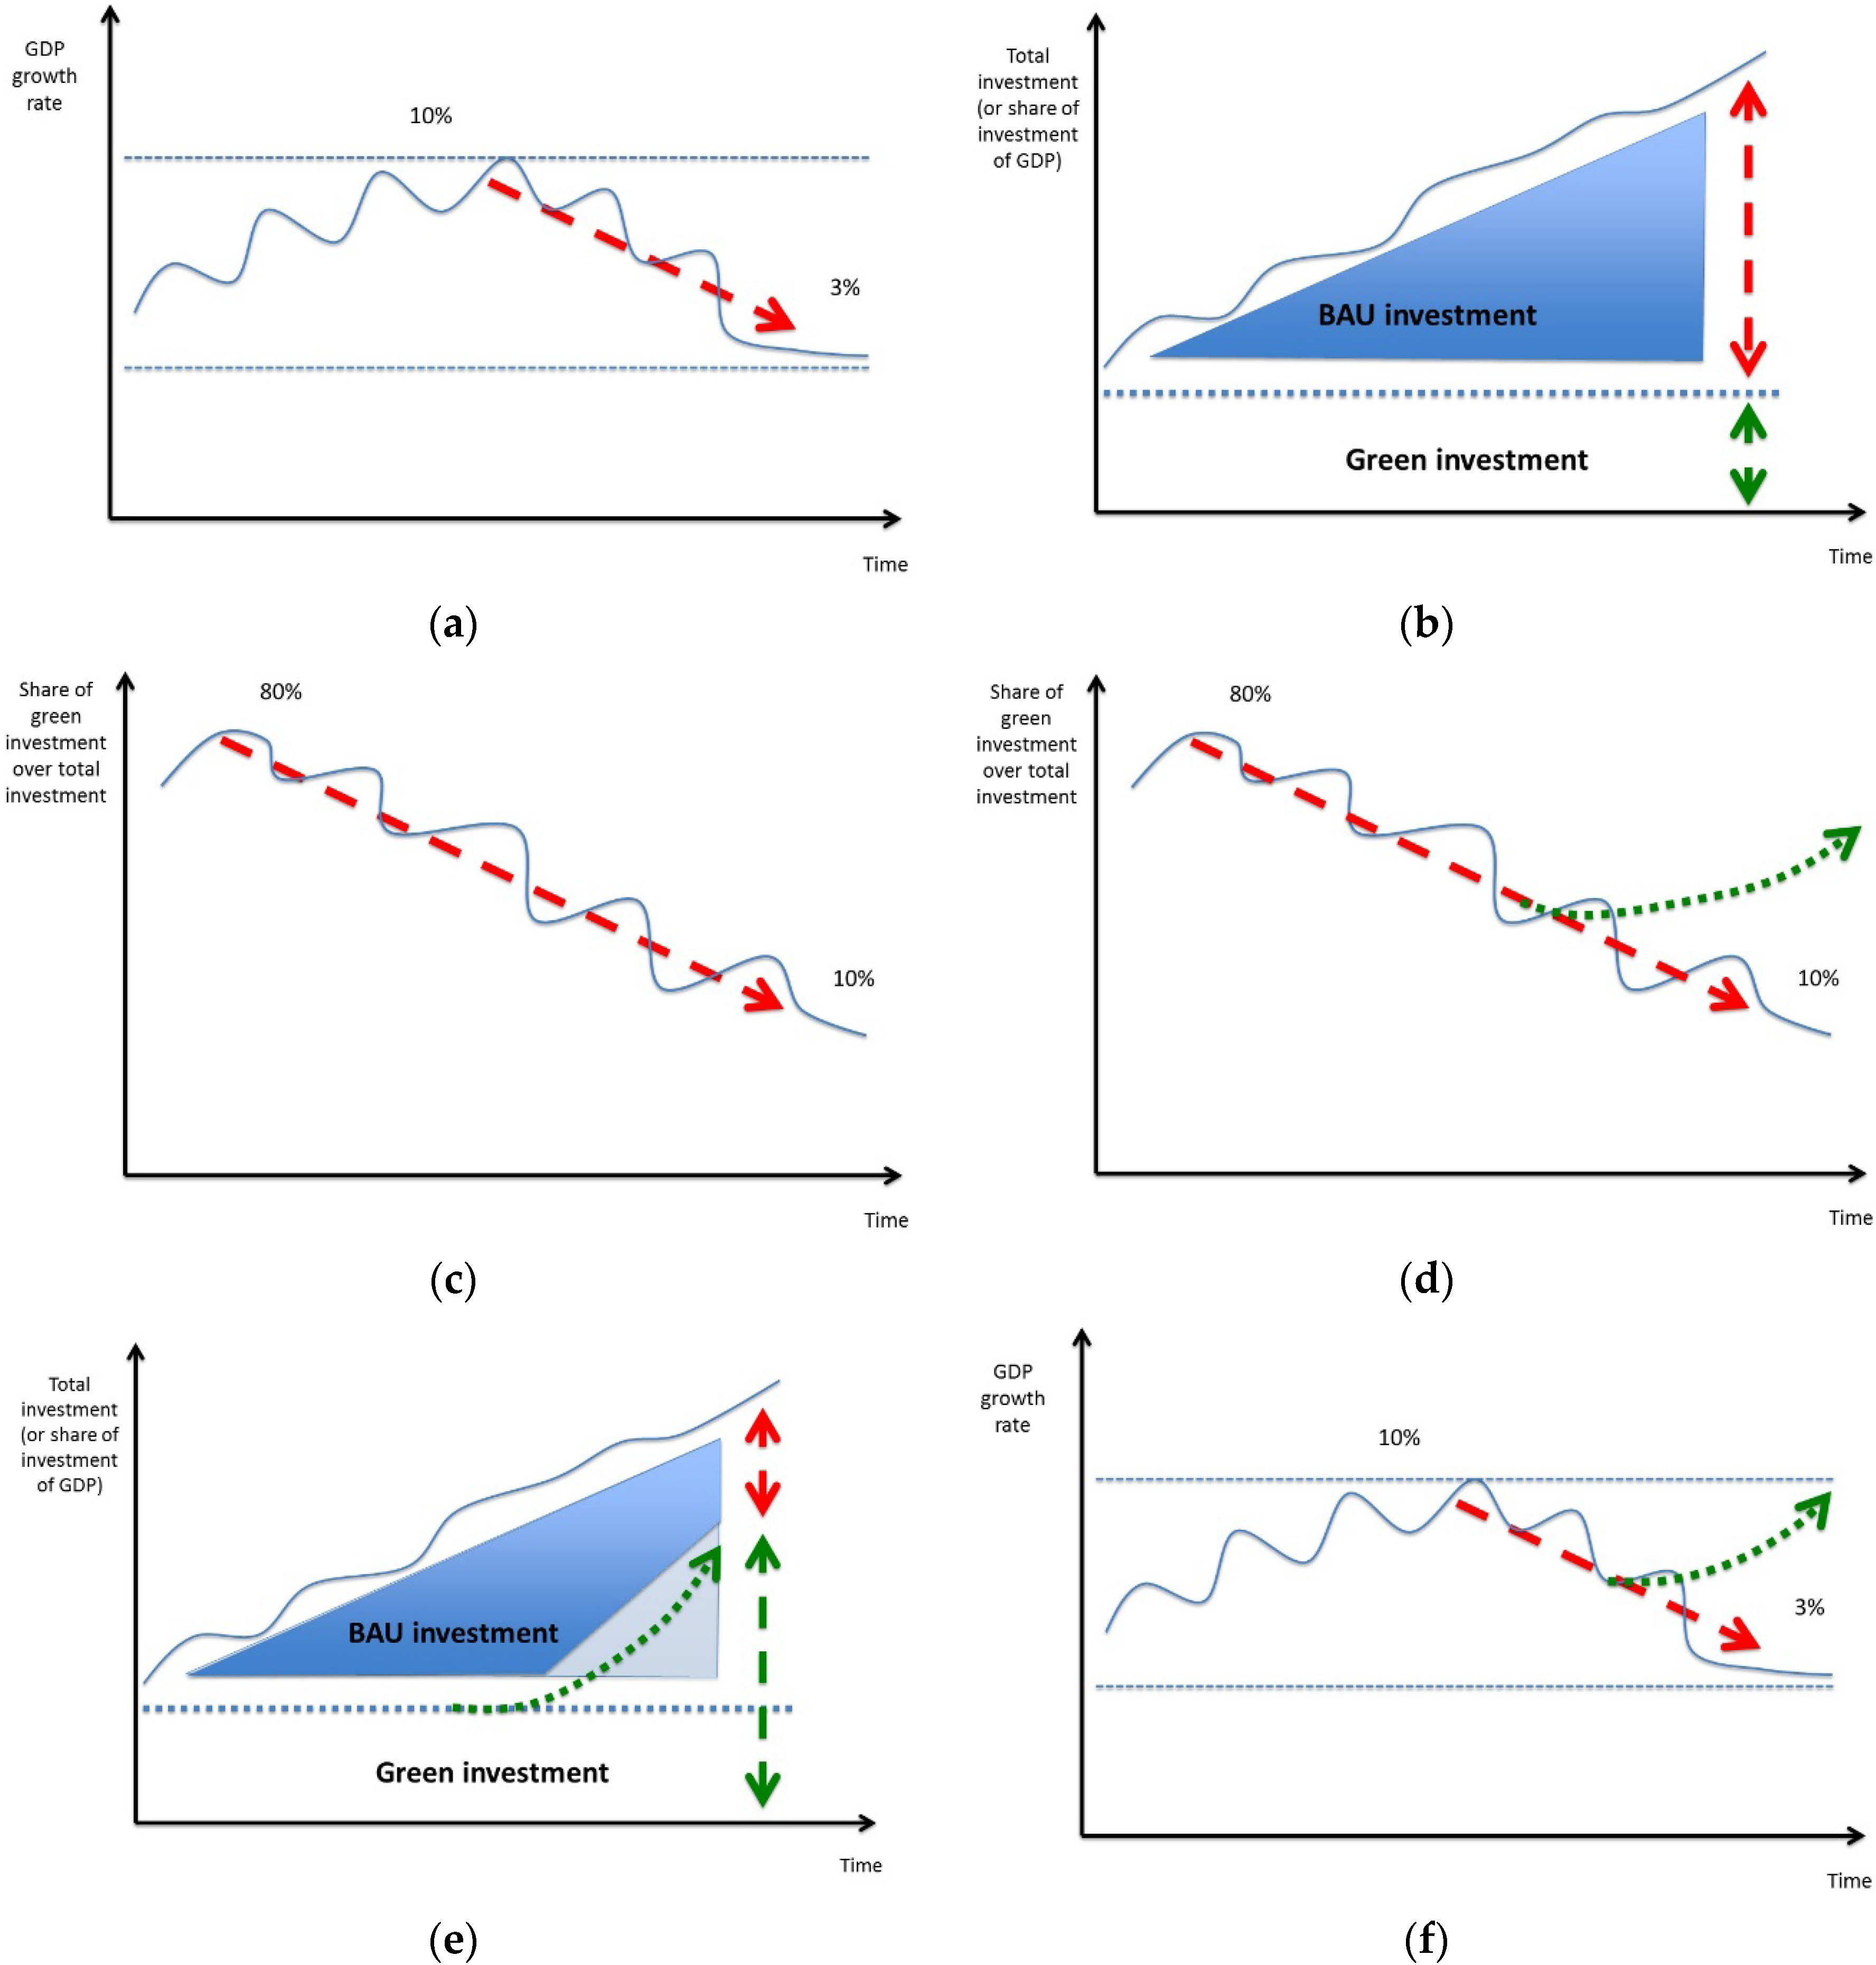
The current understanding of economic growth is largely based on the neoclassical growth model developed by Robert Solow [16]. The patterns of development observed in the past indicate that economic growth has been driven by the exploitation of natural capital and the production possibilities of built and human capital, including technical progress [17]. Resource rich developing countries primarily rely on natural assets, such as land and other natural resources (e.g., timber, minerals and fossil fuels) to fuel economic growth; and natural resource utilisation has been shown to be influential as a continued driver of growth in later development phases too [18].
Worth noting, however, is the empirical evidence that suggests the growth rate of GDP during these phases tends to decline as economies become bigger [19]. This is observed in the case of Malaysia, Thailand and Vietnam, although not simultaneously. The economic performance of Southeast Asia often saw double-digit growth in the 1990s (see Figure 1). This period is characterized by rapid industrialization (e.g., for Thailand), favoured by strong demand for exports (feuled by low production costs), and by the subsequent improvement in the provision of social services and infrastructure (e.g., for Malaysia). The development path of countries in Southeast Asia during the last decades shows a decline in GDP growth, despite the continuous increase of investments (not only from abroad, but also domestic) and the strong commitment to further improve infrastructure. This trend is not surprising. China is showing similar figures, and most developed countries are only able to growth by 2% or 3% per year, often driven by innovation (e.g., technology) and knowledge (e.g., education), as in the case of Europe and the United States [19].
Moreover, if we look more closely at the performance of the most successful economies in the world, we notice that while their standard of living has improved over the years, they have almost entirely depleted their natural capital, are currently importing most basic resources, and are increasingly paying for the replacement of lost ecosystem services (e.g., water availability and purification) in addition to increased vulnerability to climatic changes [20]. This indicates that growth at the expense of natural resource depletion (and its associated costs) is not necessarily the best route to economic development.
Southeast Asia is moving in this direction, and the Greater Mekong region is not an exception. Cities are growing, infrastructure projects are making local markets more accessible for investments, and several issues faced by developed countries are becoming visible in the region too. Among others, the urban population is rapidly growing, traffic congestion is starting to heavily affect productivity, and air quality is deteriorating. Investments are needed to match the increasing request for social services, to allow businesses to flourish, and to further stimulate economic growth, as done by all other developed economies [21]. While Stiglitz [22] shows that sustained economic growth is possible so long as the reproducible factor of production (physical capital) can be substituted for exhaustible natural resources along the economy’s balanced growth path, later research into the relationship between economic growth and environmental quality suggests that a simultaneous steady-state growth and a non-deteriorating environment are not only possible [18] but likely the only pathway to truly sustainable development [20].
As shown in Figure 1 and Figure 2a, with Business As Usual (BAU) investments (i.e., investments being allocated to projects that focus on built infrastructure and do not aim at preserving or improving the health of ecosystems) being the dominating cause for the economic growth observed in the past, an inflection point can be hypothesised. This inflection point can have several causes, one of which is the creation of externalities. In other words, while these investments have positive impacts, they also have some negative ones. Traffic congestion and air and water pollution among others, are examples of “hidden costs” to society that are not accounted for in official statistics (at least not economically), but that do have negative economic impacts (e.g., sick leave and health care costs) [21].
An alternative pathway to economic growth and development is Green Economy or Green Growth. A green economy is “an economy that results in improved human well-being and social equity, while significantly reducing environmental risks and ecological scarcities” [20]. At the operational level, the green economy is seen as one whose growth in income and employment is driven by investments that: (i) reduce carbon emissions and pollution; (ii) enhance energy and resource efficiency; and (iii) prevent the loss of biodiversity and ecosystem services. These include investments in human and social capital, and recognize the central position of human well-being and social equity (also related to environmental preservation) as core goals promoted by growth in income and employment. In addition, in a green economy approach natural capital is maintained and restored and nature’s resources and benefits are shared more fairly.
Figure 2 shows graphically how green economy investments and interventions that support the conservation of natural capital while promoting an inclusive and resilient economy would reduce the cost of externalities and effectively contribute to sustainable development [20,22,23]. By “greening” a higher share of total investment and supporting the creation of a more resilient economic system (where natural capital is seen as an enabler rather than as a resource to exploit), we observe a modification of the historical trend. More specifically, looking at the various images included in Figure 2:
(a)
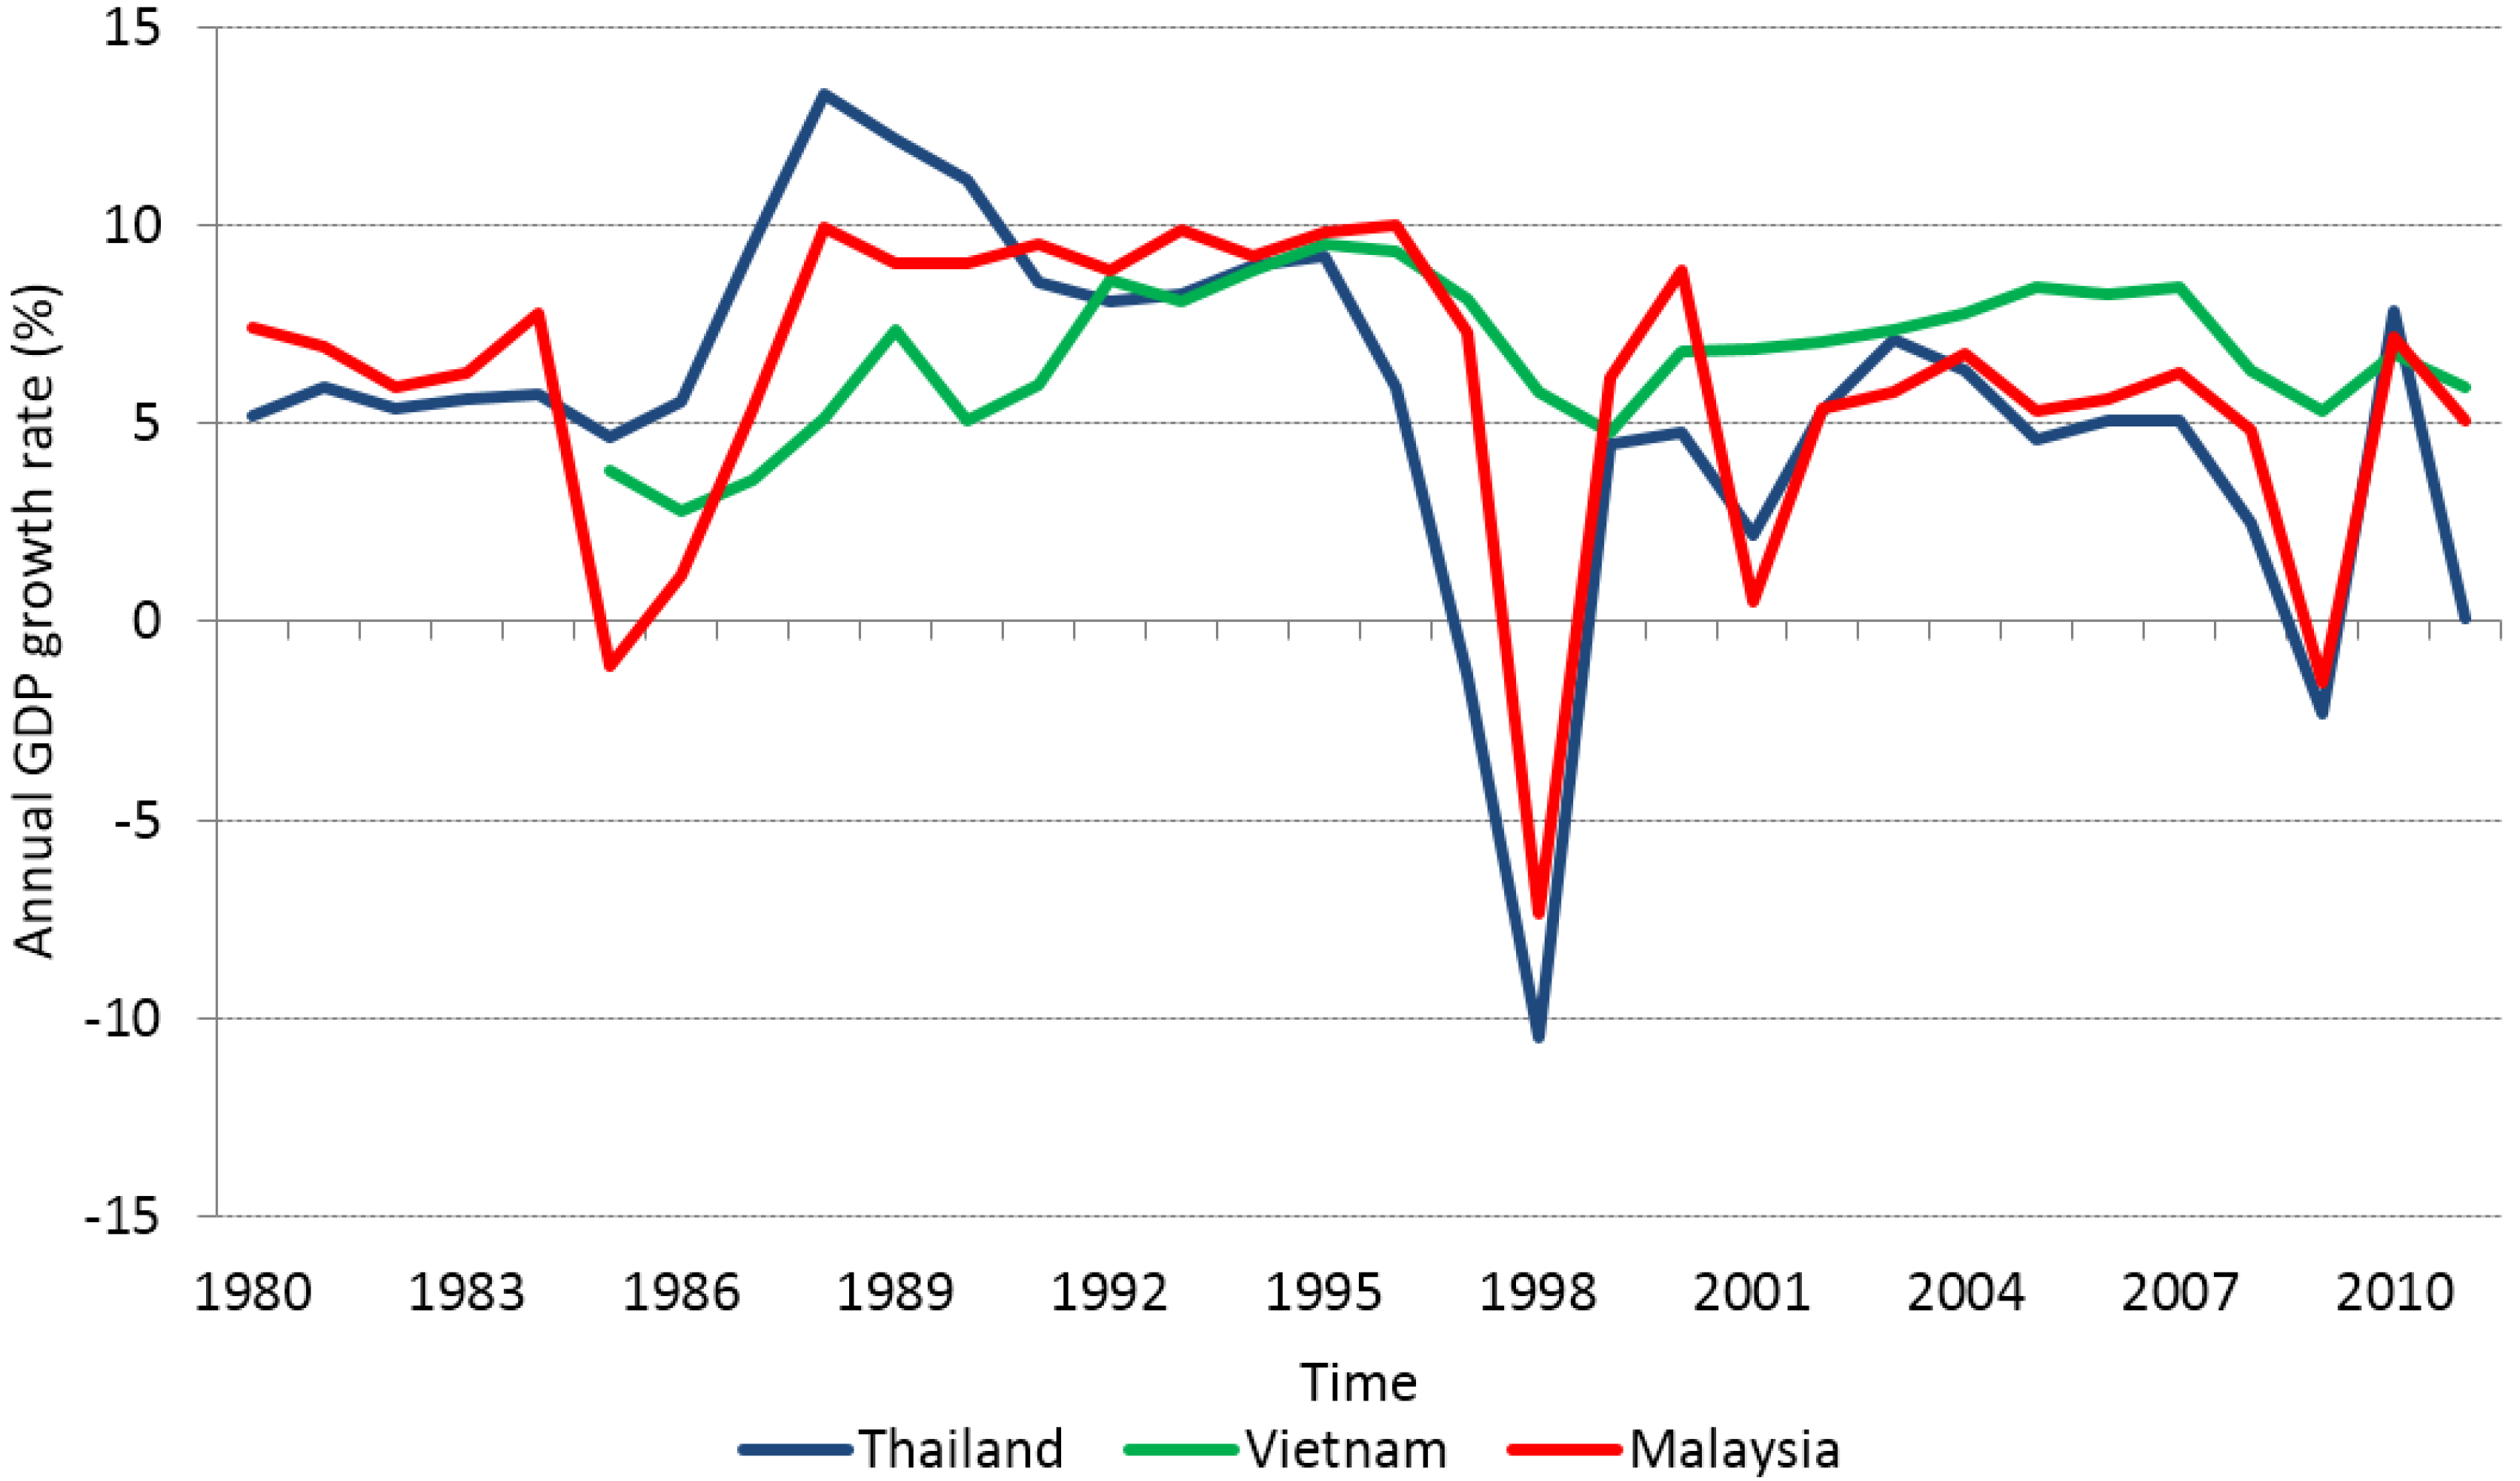
GDP growth declines, in part due to the increasing cost of environmental externalities and degradation in natural capital.
(b)
To offset the decline in GDP growth total investment needs to increase over time in a BAU scenario, but typically the portion of green investment remains near constant or even declines.
(c)
As natural capital degradation continues, the BAU investments increase and so do externalities and costs. At the same time, the share of green over total investments declines, reflecting an underinvestment in natural capital maintenance.
(d,e)
Green economy and green growth advocate for boosting the share of green investment as a share of total investment to compensate for historical underinvestment in natural capital, or as a means to “green” growth trajectories of emerging economies.
(f)
The expected outcome of such green investment is an additional boost to GDP—or “green growth” driven by additional benefits and especially by avoided costs—whereas, under BAU scenarios, real growth rates are declining.
While this concept may not apply to all contexts in the world or every individual country in the Southeast Asian region, it does represent the GDP growth trends of the region, as well as the nature of investments (for the most part BAU investments, including for instance road construction and urbanization).

2.3. Green Economy Planning

Environmental performance has a direct, and indirect, impact on the economy [24] but often the need for conservation and environmental management is not well understood. A common assumption has been that loss of nature is inevitable and justifiable given misperceptions that we have a never-ending “supply” of nature and we need other things more. The paradigm has been that trade-offs must be made between environmental quality and financial or manufactured capital because economic growth delivers on human advancement and well-being and environmental quality is a luxury good to be considered only as basic needs are met. Such threats materialize wherever the use of natural resources exceeds the capacity and resilience of the system to regenerate while maintaining its system identity, and thus its potential for future ecosystem service provision. The main reason for the overexploitation of ecosystem services is the mono-functional use and corresponding management of landscapes—still most frequently favoured over multifunctional use [6]—which maximizes one service at the expense of others.
Since the 1960s, environmental and ecological economists have been developing and improving methods for recognizing and capturing the contribution of natural capital and ecosystem services to economic production and human well-being. These techniques assess the connections between natural capital and economic systems in qualitative and quantitative terms (Figure 3). Where feasible and appropriate, we can attribute monetary values to the public or non-market properties of nature and aggregated these with existing market prices for natural resources to give a fuller picture of the economic benefits derived from natural capital. In addition to the intrinsic value that many conservationists believe biodiversity has, the majority of “valuing nature” efforts are focused on use and non-use values that “natural capital” and “ecosystem services” support.
When taking into account these concepts, it emerges that the potential impacts on natural capital and ecosystem services deriving from the construction of the roads between Kanchanaburi and Dawei could be minimized and mitigated, through the implementation of targeted green economy interventions in conjunction with the realization of the Dawei project. If the value of maintaining natural capital is highlighted and used to inform decision making, this would allow retention of the benefits created by the road (e.g., better access to markets) while mitigating any potentially negative impacts from degradation of natural capital.
In the area studied, a variety of green economy interventions could be implemented to encourage the sustainable management of natural resources and promote an ecosystem-based approach to development. The green economy intervention options that are currently being discussed by local decision makers include:
  • The establishment of sustainable forest management (SFM) criteria and indicators in conjunction with investments in the reforestation of degraded and abandoned land.
  • The development of organic agriculture, with the aim to increase food production, employment and income, while lowering land requirements and preserving natural resources and biodiversity through the use of ecological farming practices.
Given the potential to create synergies and avoid bottlenecks in the project implementation phase, and also during the useful lifetime of the road, the integration of green economy considerations at project inception is a logical starting point to pursue sustainable outcomes.

3. Materials and Methods

3.1. The Integrated Planning for Sustainability (IPS) Model

The analysis presented in the study “Road to Dawei” entails the creation of a customized simulation model that integrates several methodologies and makes use of existing local, regional and international statistics. Data collection was carried out to gather the most suitable and valid data across sectors for inclusion in the model. The model was created to match available information and generate projections that could be directly compared with existing databases and employs the following methodologies, using them in a complementary manner:
  • Spatial planning tools (e.g., Marxan): Used to plot out optimal physical placement of economic activities, human settlements etc., but often without reference to what this means for socioeconomic effects or monetary valuation of loss/gain in natural capital assets. They are often static assessments that do not “speak to” decision-makers outside of land use/conservation planners.
  • Non-market environmental valuation methods (e.g., InVEST): are used to value the external costs/benefits of losing/maintaining ecosystems and their services. Depending on the specific method applied, natural capital valuation illustrates a certain dimension of economic impacts from changes in natural capital. However, producing a dollar figure to represent nature’s value that stand alone and are not related to priorities for policymakers means valuation results often remain on the fringe of economic decision-making.
  • System Dynamics macroeconomic models (e.g., Green Economy Model): are used to project growth in GDP, trade trends and inform public policy. The understanding of economic growth informing those models is largely based on the neoclassical growth model and analysis of historic development paths; neither of which account for environmental costs and the impacts of lost stocks of natural assets in the conventional models used.
Combining these type of tools could allow for a holistic consideration of development impacts and land-use change—planned or other—and the socioeconomic implications of such change and translates these into spatial outputs. This is what WWF has done with the creation of the Integrated Planning for Sustainability (IPS) model, applied to road infrastructure (IPS-Road) in the case of the Dawei Road.

3.2. Analyzing Cross-Sectoral Dynamics with the Green Economy Model (GEM), in the IPS Framework

System Dynamics macroeconomic models [25] utilize feedback loops, delays and non-linearity (through the explicit representation of stocks and flows) to integrate social, economic and environmental drivers of change in a single framework of analysis. These models are used to project the likely outcome of policy implementation, in “what if” simulations. In so doing System Dynamics models can be used to learn about the relationship between structure and behaviour of a system, identifying potential synergies across policies, sectors and actors, as well as anticipating the emergence of potential side effects. This allows for a holistic consideration of development impacts and land-use change—planned or other—and the socioeconomic implications of such change and translates these into spatial outputs. Green economy modelling is a particular application of System Dynamics modelling that takes into account the full benefits that can be accrued by conserving natural capital (as stocks, flows and provision of ecosystem goods and services) on social, economic and environmental indicators.
Five main steps are considered for the development of GEM [22]: (1) issue identification and agenda setting; (2) policy formulation and assessment; (3) decision making; (4) implementation; and (5) monitoring and evaluation. The use of System Dynamics allows for the socioeconomic implications of different actions to be assessed across sectors (social, economic and environmental) and actors (e.g., households, private sector and the government), within and across countries. In this respect, the use of GEM and the creation of causal maps have several purposes. First, it brings the ideas, knowledge and opinions of the participants together. Second, it highlights the boundaries of the analysis. Third, it allows all stakeholders to reach a basic-to-advanced knowledge of the systemic properties of the issues analysed. Having a shared understanding is crucial for solving problems that touch upon several sectors, or areas of influence, which are normally found in complex systems. With broad stakeholder participation, and to effectively implement successful private-public partnerships among others, all the parties involved need to share the understanding of what factors generate the problem and what other can lead to a solution. As such, the solution should not be pre-imposed to the system, but rather it should instead emerge from it. In other words, interventions should be designed to make so that the system starts working in our favour, to solve the problem, rather generating side effects and new problems.

3.3. Model Structure, Customization of IPS to the “Road to Dawei”

The aim was to create a pilot model in the project “Road to Dawei” that—once fully deployed in a multi-stakeholder processes—could be used to analyse future trends emerging from scenarios of action and inaction regarding sustainable transport design and land use planning in the context of DSEZ. The model links spatial change to potential socioeconomic implications of different actions to manage that change. The categories of these sectors and variables include (see Figure 4):
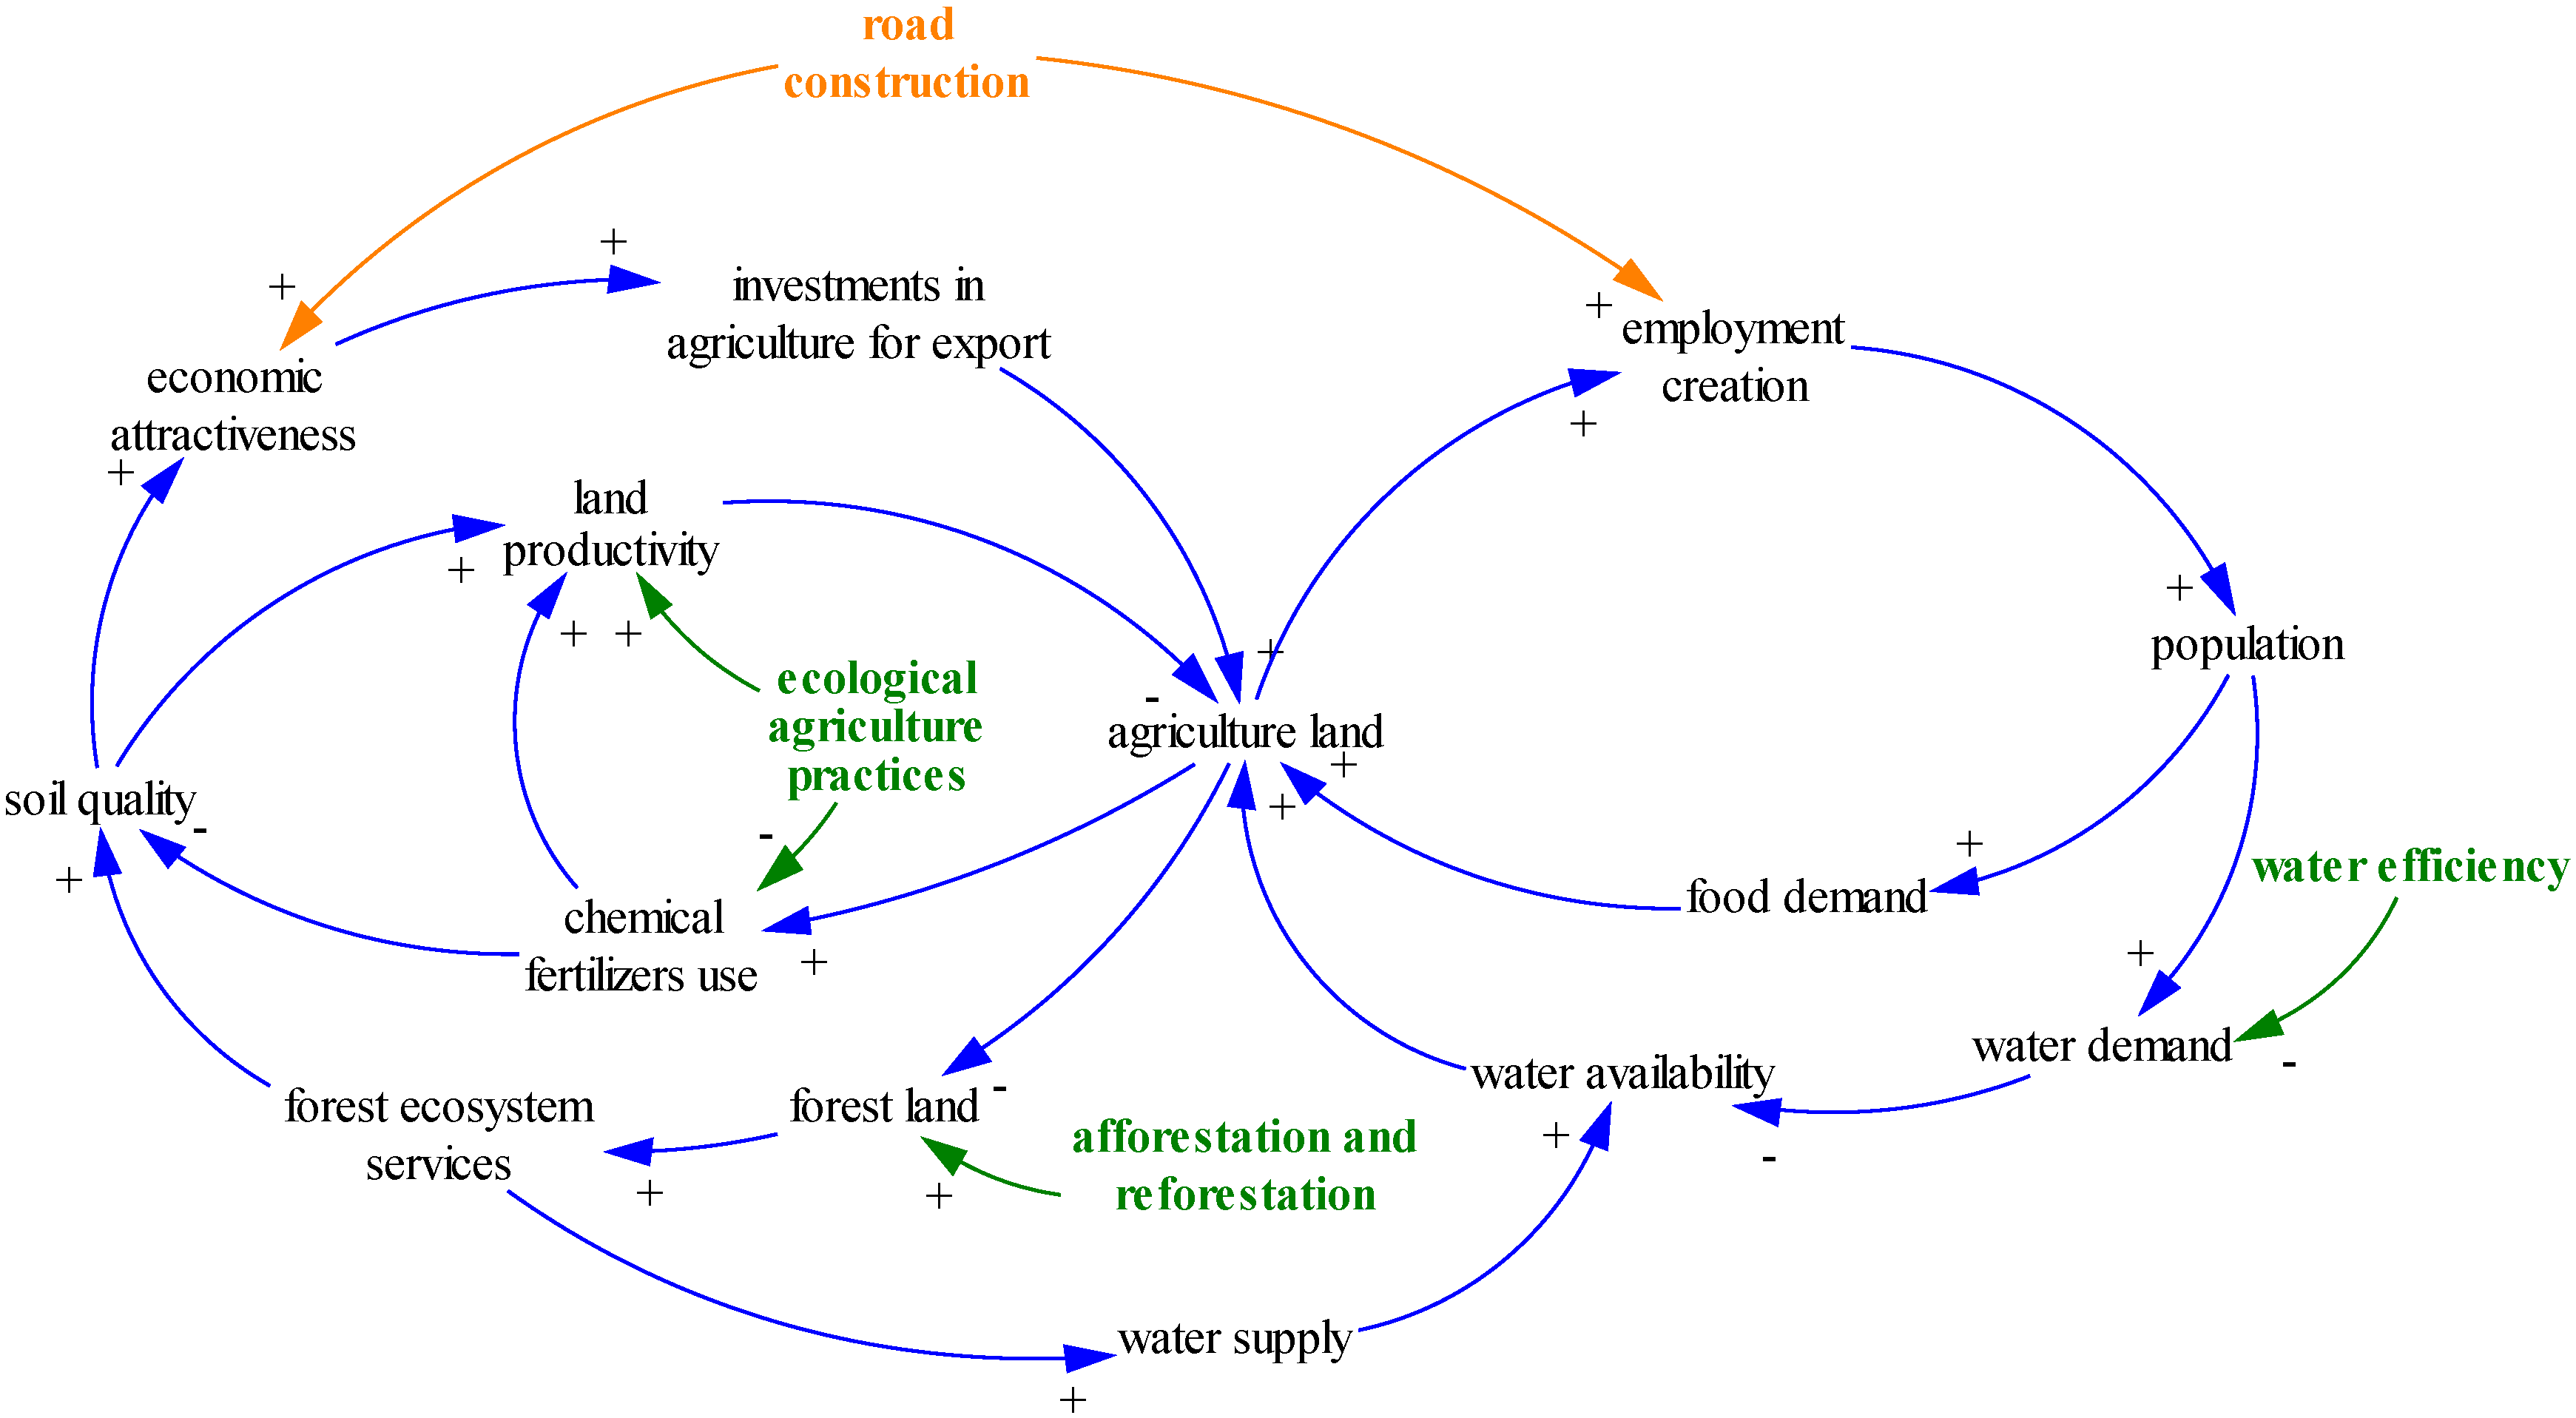
  • Social dynamics: Structural changes in local populations are also influenced by the construction of the road, since the need for additional manpower for agriculture and construction works is likely to trigger a reduction in outmigration and growing immigration. On the other hand, immigration and population growth lead to an increase in the demand for urban areas and agricultural land for domestic food production.
  • Agricultural practices: A key environmental aspect considered in the model is the impact of unsustainable agricultural practices, such as the intensive use of chemical fertilizers, on soil quality. A green economy investment in organic fertilizers and the development of ecological agriculture can be activated in the model to project impacts on soil quality, agricultural production, and employment.
  • Natural capital stocks: The land needed for the construction of the road is assumed to be primarily obtained through deforestation, thereby reducing forestland. Moreover, enhanced transport infrastructure has a positive effect on the economic attractiveness of the area, particularly for the cultivation and export of agricultural products. This produces a further increase in deforestation for the purposes of agricultural production.
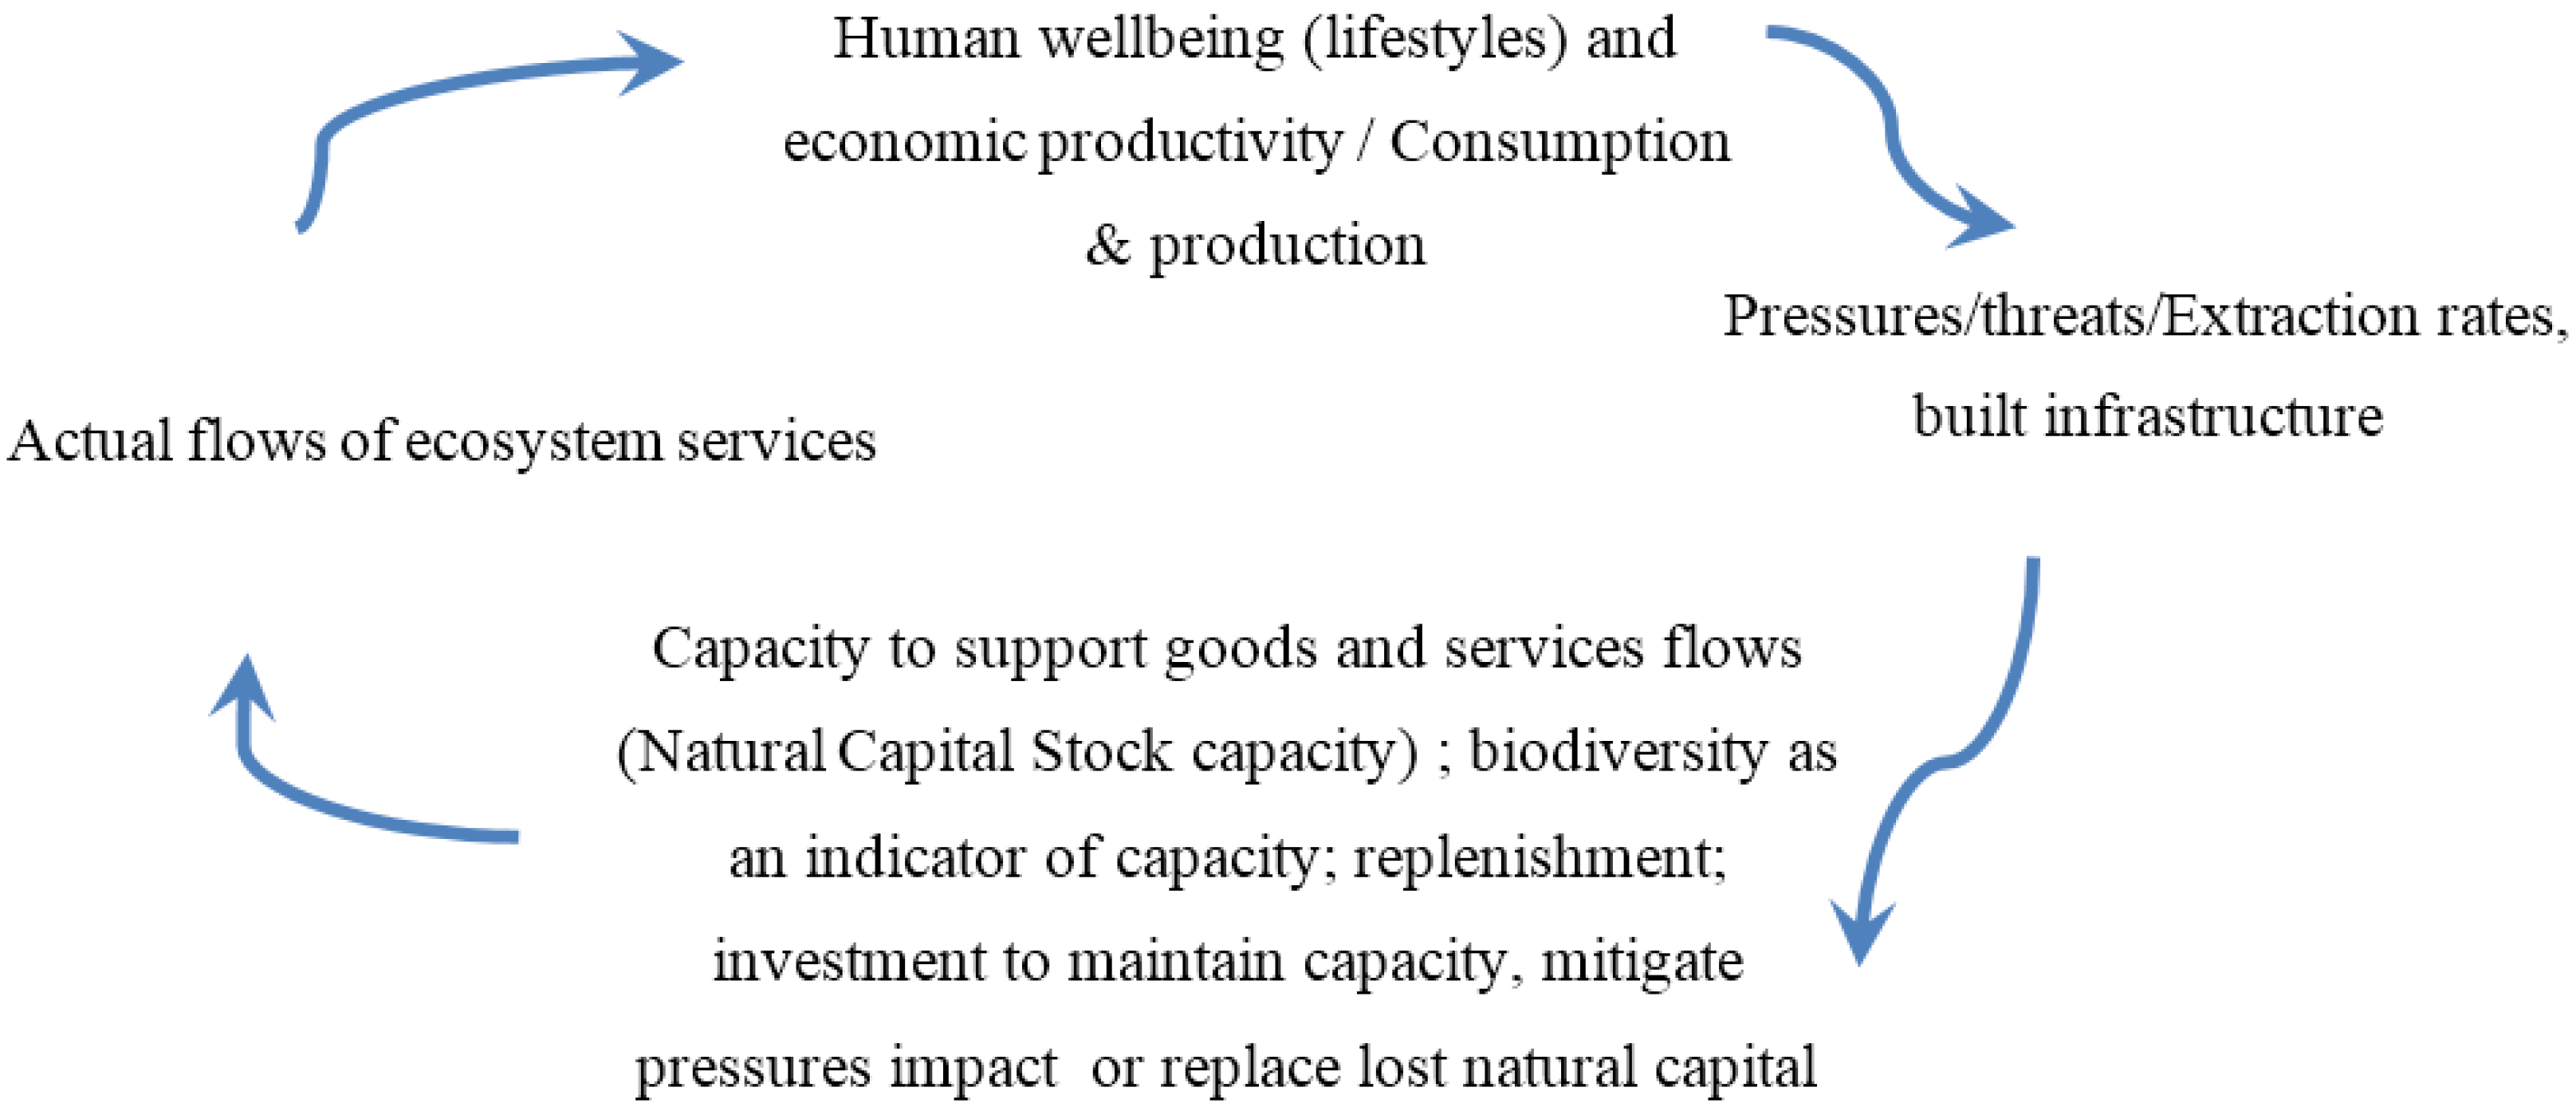
  • Ecosystem services: The change in land uses will have an influence on the integrity of natural systems in the locality. In particular, the model represents land use and water demand and supply dynamics in the area, among others. The model focuses on a number of key ecosystem services, which were selected based on an initial prioritization provided by local stakeholders and finally included in the model based on data availability:
    • Water provisioning. The demand for water is strongly influenced by population and agricultural production.
    • Water flow regulation. The availability of water is linked to the frequency and amount of precipitation and the quality of ecosystem services, including the role of forest in water flow regulation and flood prevention.
    • Soil erosion (nutrient retention). The primary causes of loss of nutrient retention are deforestation and the use of chemical fertilizers and pesticides.
    • Carbon sequestration. The role of forests for carbon capture and storage is represented in the model, as well as their impact on biodiversity. In particular, the forest area is positively influencing the carbon stock stored in biomass.
Figure 5 shows the main methodologies and models utilized in the study:
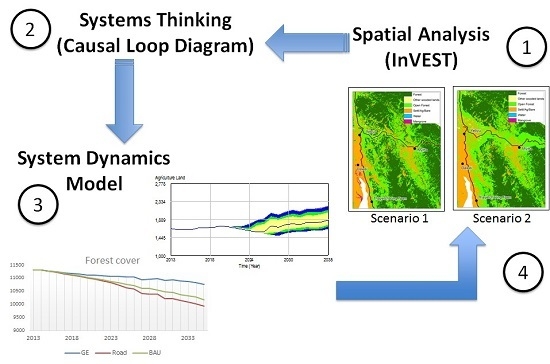
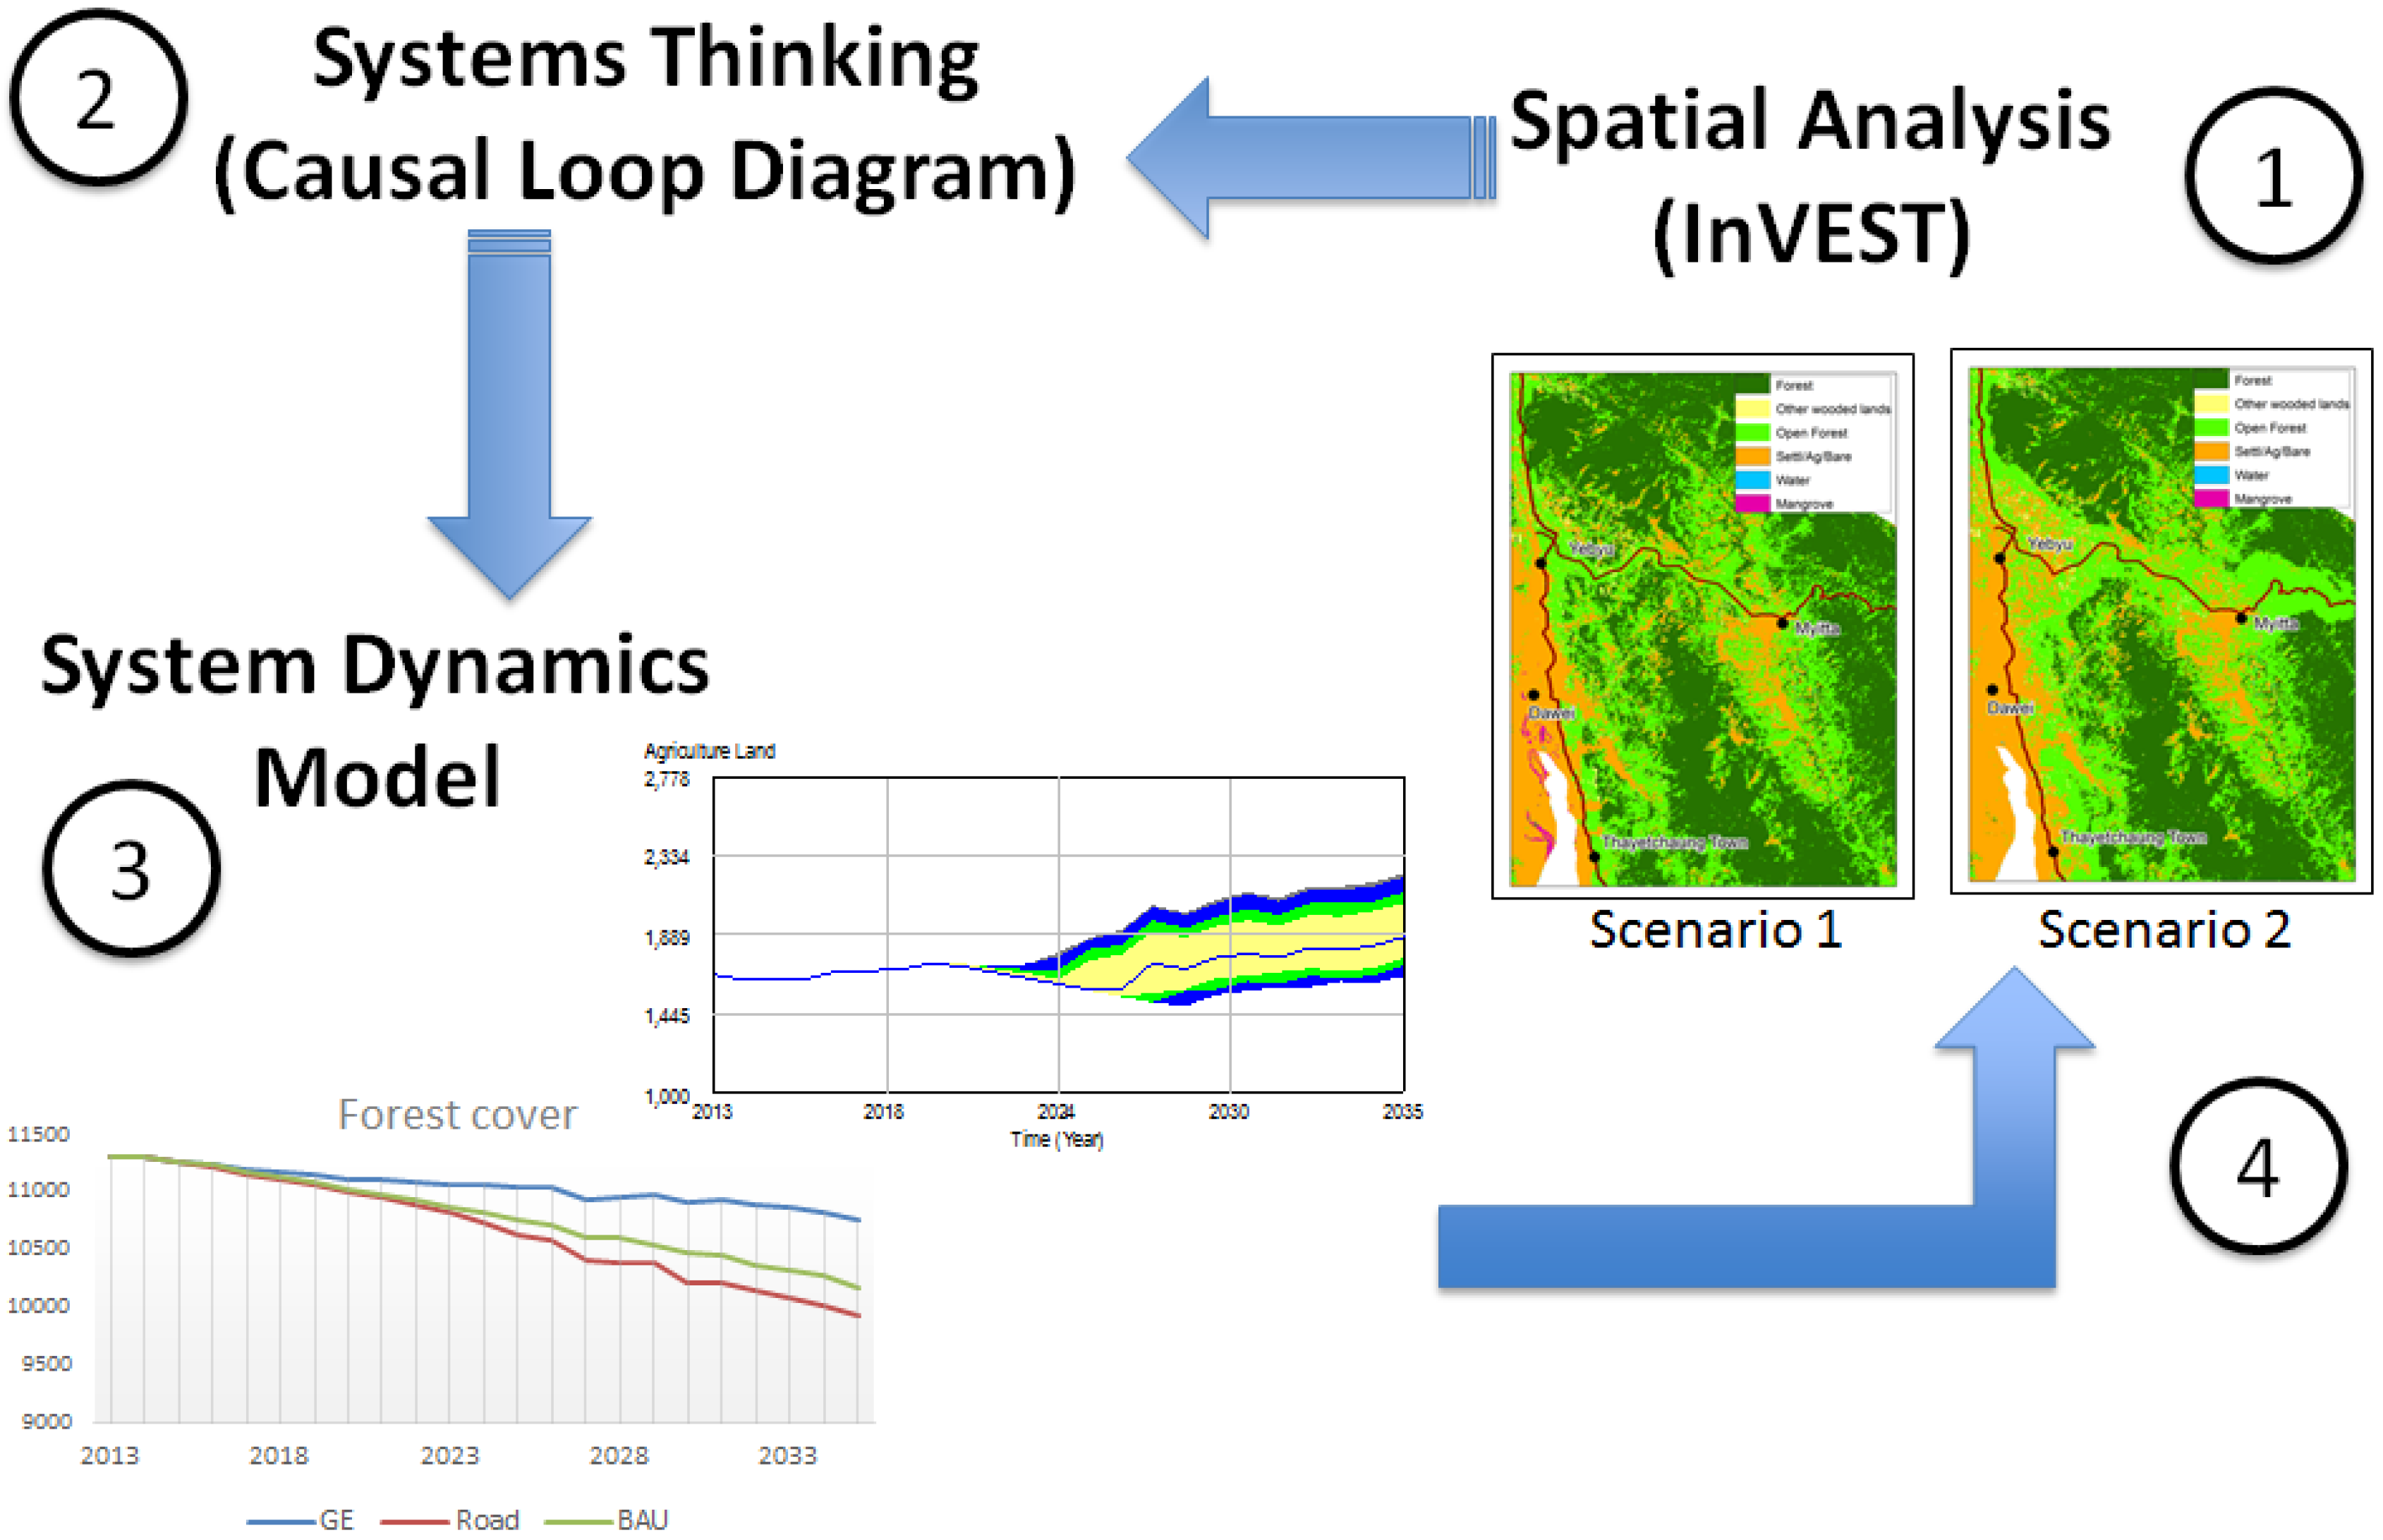
  • InVEST, which generates spatial information and estimates natural capital and ecosystem services is used as input for estimated changes in natural capital stocks, i.e., forest land cover change, and resultant estimates of changing values in key ecosystem services. This information coupled with socio-economic analysis is used to create the map of the system (or Causal Loop Diagram) to identify the main drivers and impacts of land use change in the region analysed.
  • System Dynamics methods require an integrated mathematical model that incorporates the key drivers of change and impacts. This mathematical model is calibrated using the InVEST outputs, among others through validating the direction and magnitude of relationships between biophysical variables and ecosystem service variables, i.e., changes in surface water flow corresponding to hectares of forest lost as a result of road construction.
Finally, the result of the simulations generated with the System Dynamics model can be fed back into InVEST (or any land use change modelling software, i.e., Marxan) to visualize spatially the indirect and induced social, economic and environmental impacts of road construction. Weighing up the various impacts, the System Dynamics model could identify specific interventions on improved sustainable agricultural practices, which could be tested for likely effectiveness in maintaining key ecosystem services in the InVEST models.
In other words, the results of the System Dynamics model could be used as scenario drivers for the other analysis approaches for land use change or valuing changes in ecosystem services as a result of changing land cover. This is an important value-added of the System Dynamics approach since InVEST only estimates the direct impacts of land use change on ecosystem services (and does not address impacts on other variables like population growth).

3.4. Assumptions and Scenarios

Various parameters and assumptions from available studies were used for the simulation of the baseline and alternative scenarios in the report “Road to Dawei” and are presented in Table 1.
Three main scenarios were simulated and analysed in the study, as presented below:
  • A No-road scenario, under which the construction of the road is halted. Simulations under this scenario are used as a reference to evaluate projected positive and negative impacts of road construction on the economy, society and environment. The No-road scenario assumes the continuation of historical and present trends.
  • A Road scenario case that assumes business as usual construction of the road between Kanchanaburi and the Thailand–Myanmar border (Thai side) and between the border and Dawei (Myanmar side), but no additional policies implemented to mitigate possible negative impacts on natural capital and ecosystems. Under this scenario, the full impact of road construction is projected on the economy, society and environment, considering the complex relations between land use changes, ecosystem services and socio-economic indicators.
  • A Road scenario with Green Economy interventions that simulates additional interventions for the protection of natural capital, including investments in ecological agriculture practices to increase yield and reduce soil erosion; water efficiency in agriculture; and reforestation activities. Specifically, starting from 2019 in Thailand and from 2021 in Myanmar, immediately after the completion of the road, investments are introduced to expand organic agriculture land up to 40% of total agriculture land by 2030. Moreover, reforestation activities are initiated in 2015, making use of degraded agricultural land.

4. Results

In the following sections results are presented for the No Road, Road and Green Economy scenarios, for both the analysis of road construction in Thailand and Myanmar. Specific considerations are made for the economic valuation of ecosystem services, employment creation and income generation.

4.1. Simulation Results: Thailand

4.1.1. “No Road” Scenario

The first scenario assumes that the construction of the road is halted, and the simulation projects the continuation of current land-use, environmental and socio-economic trends. In particular, limited employment opportunities would lead to a continuation of current emigration trends, causing a decline in residential population every year. As a result, increasing portions of urban and agricultural land would be abandoned, with negative impacts on production and economic growth. Apart from agriculture land, all other land uses remain largely unchanged under the No-Road scenario.

4.1.2. “Road” Scenario

The “Road” scenario assumes that 80 km of road is constructed between Kanchanaburi and the Thailand–Myanmar border, without any additional interventions to mitigate possible negative impacts on natural capital. This scenario assumes that the route decided for construction cuts across forestland, thereby requiring the clearing of about 10.6 km2 of forests (average estimated across all the possible road construction options included in the InVEST study). Projections show a variety of effects of road construction on the whole socio-economic and environmental system of the concerned area. Building the road is expected to:
  • Increase the economic attractiveness of the area. For example, national and foreign investments could be mobilized for the development of agricultural production for export. In fact, the InVEST analysis and a survey carried out with local farmers shows a likely transition to more intensive agriculture from perennial crop cultivation.
  • Reverse the current demographic trends. Under the Road scenario, new employment opportunities are created in the Kanchanaburi area, especially related to road construction and maintenance work, as well as additional workforce needed to sustain the expansion of agricultural production and trade. The residential population would thus be encouraged to remain in the region and exploit new economic opportunities.
  • Increase agricultural land and encourage deforestation. Under this scenario, total agriculture land in 2035 is expected to be 64% larger than under the No Road scenario. The expansion of agricultural land is assumed to be done entirely at the expenses of forestland.
  • Increase pressure on natural resources and ecosystem services. In particular, the reduction of forest cover is expected to have a destabilizing impact on the regulation of the hydrological cycle, thereby increasing the occurrence of floods associated with heavy rainfall, eventually removing top soil (i.e., increasing soil erosion), increasing river siltation and sedimentation levels, and reducing surface water inflow. On the other hand, water consumption is expected to increase significantly, due to a growing demand for agriculture and residential purposes. As a result, the water balance, calculated as the difference between total water supply and total water demand, is expected to evolve from equilibrium in 2013 to a significant deficit in 2035.
  • Trigger a number of simultaneous effects on agricultural productivity through land-use modifications. While the increase in farmers’ density is expected to have positive feedback on productivity, the environmental impacts produced by deforestation and unsustainable agricultural practices would threaten the sustainability of the sector in the medium to longer-term.

4.1.3. “Road” Scenario with Green Economy Interventions

Starting from the aforementioned changes in the socio-economic and environmental dynamics of the area, several green economy interventions can be identified and implemented in order to mitigate negative impacts of land-use changes, while still accruing the benefits of the road construction project.
  • Population growth under both green economy scenarios is nearly equal to the one expected under the Road scenario. As result, the GE scenario retains the economic benefits of the road scenario.
  • Degraded agriculture land is converted for both reforestation and urbanization purposes under the green economy scenario, while it is entirely used for satisfying urban land needs under the road scenario.
  • Improved efficiency in the agriculture sector would reduce the expansion of agriculture land (Figure 6). As a result, total forestland would grow, reaching 11,693 km2 under the GE scenario in 2035, being 30.6% larger than in the Road scenario.
  • Despite similar demographic growth projections in the GE and Road scenarios, the use of agriculture land is considerably reduced in the former after the introduction of ecological agriculture practices, due to positive impacts on crop yields and soil quality. More specifically, total agriculture land would reach 2863 km2 under the GE scenario in 2035, compared to 3934 under the Road scenario, corresponding to a 27.1% decrease.
  • Another impact of green agriculture is the reduction of water use in organic farming. Projections show that total agriculture water demand in 2035 would be 38.2% in the GE scenario relative to the Road case. In addition to the reduction in agriculture water demand, the incidence of floods on river siltation would be reduced under green economy scenario, due to the preservation of forestland and its water cycle regulation service. As a result, the water balance would be radically different between green economy and Road scenarios, with a surplus in the GE case compared to a deficit in the Road simulation.
  • Ecological agriculture practices generally require more labour force than conventional agriculture. Despite this positive impact on employment in the GE case, the total amount of people employed in the sector is projected to be larger under the Road scenario, due to the higher expansion of agricultural land relative to the GE scenario. On the other hand, this means that income per farmer would be higher in the GE case.
  • Reforestation activities under green economy scenarios would increase the total amount of CO2 absorbed by forests, compared to both the Road and No Road scenarios. More specifically, the stock of carbon capture and sequestration would amount to 105.5 million tonnes of CO2 in the GE scenario in 2035, compared to 83.33 and 96.63 million tonnes of CO2 under the Road and No Road scenarios, respectively. Considering an approximate value of 123 Baht per ton of CO2, the carbon stored in forests could be worth 2.73 billion Baht in the GE scenarios relative to the Road case.
As a key conclusion, the green economy scenario shows what might be possible under one set of interventions—note that the model could be used again and again to run other types of interventions. For example, the dispersed coverage of evergreen forest observed in the GE scenario may not yield the biggest conservation gain. A different intervention could be modelled to achieve concentration of that replanting, or dispersing it linearly along the road. As such, the analysis above should be treated as validation of the prototype model developed rather than a recommendation for green economy policy interventions in extending the Southern Economic Corridor through Bangkok to Dawei.

4.2. Simulation Results: Myanmar

4.2.1. “No Road” Scenario

In the “No Road” scenario, current trends are projected to continue, with population growth, the expansion of urban and agriculture land, and a resulting reduction in forestland. Agriculture productivity is projected to slightly increase primarily due to the improvement of labour productivity and the use of fertilizers and pesticides, which offset the negative impact of increased vulnerability to floods and growing soil erosion.

4.2.2. “Road” Scenario

The “Road” scenario assumes that 138 km of road are constructed between the Myanmar-Thai border and Dawei, without any additional interventions to mitigate possible negative impacts on natural capital. The construction of the road is assumed to require the clearing of about 18.2 km2 of forests, which is three times the area that will be paved. Projections show a variety of effects of road construction on the whole socio-economic and environmental system of the concerned area. Building the road is expected to:
  • Increase the economic attractiveness of the area. The increase of employment and population, on the account of road construction in the short term and of agriculture production in the medium and longer term, results in a net increase in agriculture and settlement land, and a net decrease in forestland.
  • The urban area is expected to increase following the population trend, reaching close to 1000 km2 in 3025 from approximately 780 km2 in 2013. The land used for settlements is assumed to be converted entirely from degraded land, with no impact on forest cover.
  • Forestland would be reduced under the road construction scenario with respect to the No road scenario, due to the impact of agricultural land expansion and land clearance for construction works. In 2035, the forest cover is expected to be 2.5% smaller compared to the No Road scenario, and 13% smaller relative to 2013, going from 11,306 km2 in 2013 to 9913 km2 in 2035.
  • The modification of the natural landscape resulting from the construction of the road is projected to increase pressure on natural resources and ecosystem services. On the other hand, projections for the Road scenario show that agriculture productivity would still increase over time, and perform better than in the No Road scenario. This is due to again to a boost in labour productivity, with more farmers and a better organized (and possibly more mechanized) production process. On the other hand, the resilience to floods is projected to gradually decrease due to the reduced forest cover and soil erosion is expected to increase over time, due to both deforestation and the increased use of chemical fertilizers and pesticides.

4.2.3. “Road” Scenario with Green Economy Interventions

The Road scenario has already shown that there are gains to be accrued, but also upcoming challenges resulting from the construction of the road. In order to retain the benefits and minimize the side effects, additional complementary interventions can be identified and implemented. The interventions simulated are complementary and create synergies pertaining forestland, which is one of the main drivers of ecological integrity in the study area.
  • Interventions in the agriculture sector increase productivity, by replacing chemical fertilizers with more sustainable inputs, lower soil erosion and the vulnerability to floods. Further, reforestation on degraded land helps maintain the stock of forest close to its initial value of 2013, reversing the trend observed both in the No Road and in the Road scenarios (Figure 7). Specifically, while forestland by 2035 is projected to decline by 2.4% relative to the No Road scenario, the GE case shows an increase of 6% and 8.6% relative to the No Road and Road simulations. This is also due to the contribution of reforestation, amounting to the conversion of approximately 25 km2 of land, from degraded to reforest. Overall, forestland is projected to reach 10,762 km2 in the GE case by 2035, against 9913 km2 and 10,152 km2 in the Road and No Road scenarios, respectively. This is a 4.8% reduction for the GE scenario relative to 2013, which is much smaller than the projected 12.3% and 10.2% reduction for the Road and No Road cases.
  • Avoided deforestation and reforestation activities under green economy scenarios would increase the total amount of CO2 absorbed by forests, compared to both the Road and No Road scenarios. More specifically, the stock of carbon would amount to 129.9 million tonnes of CO2 in the GE scenario in 2035, compared to 121.9 and 124.6 million tonnes of CO2 under the Road and No Road scenarios, respectively. Considering an approximate value of US$ per ton of CO2, the carbon stored in forests could be worth US$128 million more in the GE case relative to the Road scenario.
  • Improved efficiency in the agriculture sector would reduce the expansion of agriculture land to 1919 km2 under the GE scenario in 2035 relative to 2211 km2 and 2027 km2 in the Road and No Road scenarios. Still, the level of production remains the same, with a smaller but more productive cultivated area.
  • Concerning socio-economic indicators, on top of increased profitability for farmers, population growth under the green economy scenarios remains lower than in the Road scenario, but higher than the No Road simulation. This is due to the reduced land use and higher labour intensity in the agriculture sector. As result, also in the case of Myanmar the GE scenario retains the economic benefits of the road scenario while reducing the impacts on the environment. In fact, the reduction in population also leads to lower urban land relative to the Road scenario. In addition, when adding that degraded agriculture land is converted for both reforestation and urbanization purposes under the green economy scenario (while it is entirely used for satisfying urban land needs under the road scenario) the expansion of urban land will not be a cause of deforestation in the GE case.
  • As indicated earlier, ecological agriculture practices generally require more labour force than conventional agriculture (up to 30% higher [20]). Projections for the GE scenario indicate that employment in the agriculture sector will be higher than in the No Road case, but will remain slightly lower than in the Road case (due to the higher efficiency of the production process). Specifically, projections show that approximately 1360 additional jobs could be created every year between 2015 and 2035 under the Road scenario, compared to 1300 under the GE scenario in the same period. As indicated earlier, if we were to keep the same amount of agriculture land as in the Road scenario, employment would be approximately 30% higher in the GE case relative to the Road case, and even higher when compared to the No Road scenario.
  • Concerning flood control, the GE scenario is projected to perform 7.4% and 6.5% higher than the Road and No Road simulations, indicating that costs can be avoided (social and economic) and resilience increased when green economy interventions are implemented.
As in the case of the Thai analysis, it is worth mentioning that the green economy scenario shows what might be possible under one set of interventions. Additional “what if” scenarios could be tested to assess the outcomes of using different assumptions and policies.

5. Discussion

Building infrastructure is a necessary step towards the achievement of economic development objectives. Nevertheless, a number of considerations should be taken into account when assessing the impacts of infrastructure construction to ensure the positive contributions are not overstated through neglecting hidden costs.
The construction and upgrading of the road network from Kanchanaburi to Dawei is likely to produce economic benefits from the commercialization of locally produced commodities, and value-add products and services, possibly attracting investments in trade within the region and import-export activities for both Thailand and Myanmar. However, negative impacts from the current access road are already being observed including increased deforestation, soil erosion and landslides. The short-term positive impacts from economic growth look likely to be curbed by medium and long-term indirect negative trends including negative consequences of environmental degradation induced by maladapted road design and siting.
If development goals are to be achieved in line with the principles of the Green Economy and Sustainable Development, potential side effects ensuing from the construction of infrastructure must be pre-empted through policies and investment to avoid or mitigate these. The local population could benefit from economic growth if planning is carried out systemically, to ensure that the benefits are equally distributed among the population. In particular, if opportunities exist for employment creation, and if the environment is not compromised, potential improvements in household income and livelihoods can also be expected.
This can be done using a systemic approach exploring the interactions between society, the economy and the environment through the identification of feedback loops and delays, which potentially lead to the emergence of side effects in the medium and longer term. In this regard, three key aspects must be considered.
  • First, short-, medium- and longer-term impacts have to be clearly identified. As it was shown, short-term positive impacts (e.g., on economic attractiveness) might be curbed by medium and long-term indirect and induces trends, including negative consequences of environmental degradation. The introduction of targeted green economy interventions for the protection of natural capital and ecosystem services is expected to alleviate environmental pressures, creating the enabling conditions for sustainable and inclusive development. A more detailed study could show the cost of replacing ecosystem services, to objectively compare advantages and disadvantages of various scenarios. In fact, a sudden economic expansion, when coupled with unregulated land exploitation, might lead to speculations that would be made at the expenses of the environment and the well being of the local population, for the exclusive benefit of a limited number of actors. Green economy interventions, such as the establishment of protected forest areas, the adoption of sustainable forest management principles and practices, need to support a fair and inclusive development. While the growth of population and the expansion of agriculture are likely to increase pressure on natural resources (e.g., forest), the adoption of ecological agriculture practices can curb the needs for agriculture land.
  • Second, the distribution of costs and benefits across different actors should be clearly assessed. This is particularly important in the context of the valuation of natural capital, because the lowest income classes are generally the most reliant on locally available natural resources and ecosystem services. The lack of knowledge and evidence on the economic value of the environment has, for a long time, prevented the incorporation of natural capital in national development planning. Assessments of potential impacts from regional transport infrastructure projects tend to focus on the development benefits measured in terms of reduced logistics costs, jobs, revenue and increases in standards of living as measured by household income. Yet, transport and other infrastructure profoundly influence the integrity of natural systems on which they impact, as well as patterns of trade and development. As such, the economic opportunity from infrastructure must be balanced against long-term need for natural systems vital to economic and physical resilience. Without this, the economies these corridors drive cannot be sustainable in the long-term because of the high likelihood of loss of critical benefits that nature provides. Given that environmental and social externalities are typically communicated in “soft” numbers—carbon emissions for example—decision-makers are missing information on the direct and indirect contribution of biodiversity and ecosystem services in the economy and to human wellbeing. The study “Green Economy Modelling of Ecosystem Services along the “Road to Dawei” was conceived as a pilot project, aiming at designing an integrated framework to inform and support land use planning support in this context. Three different scenarios were simulated to anticipate possible impacts on economic, social and environmental indicators and impacts for the construction of roads connecting Bangkok to Dawei via Kanchanaburi, in the framework of the Dawei Project. Simulation results show that a conventional approach to road construction is likely to have positive economic impacts in the region, especially in the short term, but also negative consequences for the integrity of the ecosystem, which in turn might also negatively impact on the investment itself (e.g., in relation to the risk of floods and landslides) and its economic outcomes (e.g., concerning land erosion in the case of agriculture and NTFP production) in the medium and longer term. Further, results indicate that green economy interventions would mitigate environmental risks by creating synergies across sectors, systemically.
  • Thirdly, an integrated, cross-sectoral approach should be used for the evaluation of costs and benefits, as well as broader advantages and disadvantages, of project implementation. Synergies can be created across sectors. As an example, while the growth of population and the expansion of agriculture are likely to increase pressure on natural resources (e.g., forest), the adoption of ecological agriculture practices can curb the needs for agriculture land. This study employed a model with environmental, social and economic indicators allowing for a more realistic baseline from which to plan for both economic development and conservation and other environmental policy interventions. This type of model may indicate where efficiencies for economic development can be gained from managing natural capital proactively in land use change, through for example, managing water risks for human settlements, or agricultural and industrial activities. From a conservation practitioner point of view, the model can be used to identify successful conservation outcomes (i.e., a pure focus on ecosystem integrity), which then can be “translated” into economic and social benefits from those interventions. Furthermore, recognising that viable conservation will in some cases impose a net cost on public finance (perhaps with conservation benefits too far off in the future or distributed too thinly across human populations to count), a model such as this can help identify policy interventions that minimize these costs. The same approach and information could be easily further customized to analyse a variety of different infrastructure projects, making use of the value created by the innovation that this pilot study presents: the simultaneous use of InVEST, System Thinking and System Dynamics.

6. Conclusions

The study identified an opportunity for integrated modelling that has been little explored to date. Greater policy coherency is thought to reap efficiency gains but economic development and land use planning, as well as conservation and environmental policy development tend to be analysed and implemented separately. Part of the reason may be that, while many different tools exist as supports to decision-making in these domains (e.g., Geographic Information Systems (GIS), Marxan, etc.), they are rarely combined. Planning in silos has proven, over and over again, that side effects are likely to emerge. Along the same line, optimizing sectoral performance, rather than aiming to coherently improve the whole system, is likely to lead to an increase in vulnerability. Society, the economy and the environment are interconnected and while models are simplifications of reality, we need tools that can properly represent the complexity of the world we are living in. A more detailed assessment would be required to properly estimate the value of natural capital, but this initial study already indicates that the potential contribution of using an integrated approach to improve sustainability.

Acknowledgments

The authors wish to thank WWF Thailand and WWF Myanmar and at the GMPO office, as well as InVEST practitioners at WWF and at Naresuan University for the support provided in data collection and model development.

Author Contributions

Andrea M. Bassi and Louise A. Gallagher conceived and designed the analysis; Andrea M. Bassi created the models and carried out the analysis; Louise A. Gallagher and Hanna Helsingen analyzed the data and validated results with colleagues at WWF in Thailand and Myanmar; and Andrea M. Bassi wrote the paper.

Conflicts of Interest

The authors declare no conflict of interest.

Abbreviations

The following abbreviations are used in this manuscript:
BAUBusiness As Usual
DTLDawna Tenasserim Landscape
DSEZDawei Special Economic Zone
EEAExperimental Ecosystem Accounting
GEGreen Economy
GEMGreen Economy Model
IPSIntegrated Planning for Sustainability
REDD+Reducing emissions from deforestation and forest degradation
SEEASystem of Environmental-Economic Accounting
SFMSustainable Forest Management
UNEPUnited Nations Environment Programme
WAVESWealth Accounting and Valuation of Ecosystem Services
WWFWorld Wide Fund for Nature

References

  1. Goodenough, R.; Page, S. Evaluating the environmental impact of a major transport infrastructure project: The Channel Tunnel high-speed rail link. Appl. Geogr. 1994, 14, 26–50. [Google Scholar] [CrossRef]
  2. Makki, T.; Fakheran, S.; Moradi, H.; Iravani, M.; Senn, J. Landscape-scale impacts of transportation infrastructure on spatial dynamics of two vulnerable ungulate species in Ghamishloo Wildlife Refuge, Iran. Ecol. Indic. 2013, 31, 6–14. [Google Scholar] [CrossRef]
  3. Arce, R.; Gullòn, N. The application of Strategic Environmental Assessment to sustainability assessment of infrastructure development. Environ. Impact Assess. Rev. 2000, 20, 393–402. [Google Scholar] [CrossRef]
  4. Noldan, B.; Janoušková, S.; Hák, T. How to understand and measure environmental sustainability: Indicators and targets. Ecol. Indic. 2012, 17, 4–13. [Google Scholar]
  5. Jones, M. Accounting for the environment: Towards a theoretical perspective for environmental accounting and reporting. Account. Forum 2010, 34, 123–138. [Google Scholar] [CrossRef]
  6. De Groot, R.; Alkemade, R.; Braat, L.; Hein, L.; Willemen, L. Challenges in integrating the concept of ecosystem services and values in landscape planning, management and decision making. Ecol. Complex. 2010, 7, 260–272. [Google Scholar] [CrossRef]
  7. Organisation for Economic Co-operation and Development (OECD). The DAC Guidelines. Strategies for Sustainable Development; OECD: Paris, France, 2001. [Google Scholar]
  8. United Nations Development Programme (UNDP). Handbook on Planning, Monitoring and Evaluating for Development Results; UNDP: New York, NY, USA, 2009. [Google Scholar]
  9. United Nations Environment Programme. Integrated Policymaking for Sustainable Development. A Reference Manual; UNEP: Geneva, Switzerland, 2009. [Google Scholar]
  10. Varone, F.; Nahrath, S.; Aubin, D.; Gerber, J.-D. Functional regulatory spaces. Policy Sci. 2013, 46, 311–333. [Google Scholar] [CrossRef]
  11. The Economics of Ecosystems and Biodiversity. The Economics of Ecosystems and Biodiversity Ecological and Economic Foundations; Kumar, P., Ed.; Earthscan: London, UK, 2010. [Google Scholar]
  12. United Nations (UN). Transforming Our World: The 2030 Agenda for Sustainable Development; UN: New York, NY, USA, 2015. [Google Scholar]
  13. United Nations Statistics Division (UNSD). Revision of the System of Environmental-Economic Accounting (SEEA). SEEA Central Framework; UNSD: New York, NY, USA, 2012. [Google Scholar]
  14. Wealth Accounting and the Valuation of Ecosystem Services. Users and Uses of Environmental Accounts; The World Bank Group: Washington, DC, USA, 2014. [Google Scholar]
  15. Intergovernmental Science-Policy Platform on Biodiversity and Ecosystem Services. Available online: http://www.ipbes.net (accessed on 25 May 2016).
  16. Solow, R. A contribution to the theory of economic growth. Q. J. Econ. 1956, 70, 65–94. [Google Scholar] [CrossRef]
  17. Solow, R.M. Reflection on growth and development. Ann. Econ. Financ. 2003, 4, 219–229. [Google Scholar]
  18. Chambers, D.; Guo, J. Natural Resources and Economic Growth: Some Theory and Evidence. Ann. Econ. Financ. 2009, 10, 367–389. [Google Scholar]
  19. World Bank. World Development Indicators (WDI); World Bank: Washington, DC, USA, 2013. [Google Scholar]
  20. United Nations Environment Programme (UNEP). Towards a Green Economy: Pathways to Sustainable Development and Poverty Eradication; UNEP: Geneva, Switzerland, 2011. [Google Scholar]
  21. Asian Development Bank (ADB). Green Growth, Resources and Resilience: Environmental Sustainability in Asia and the Pacific; Asian Development Bank: Manila, Philippines, 2012. [Google Scholar]
  22. Bassi, A.M. Moving towards integrated policy formulation and evaluation: The Green Economy Model (GEM). Environ. Clim. Technol. 2015, 16, 5–19. [Google Scholar] [CrossRef]
  23. United Nations Environment Programme (UNEP). Building Inclusive Green Economies in Africa—Experience and Lessons Learned 2010–2015; UNEP: Geneva, Switzerland, 2015. [Google Scholar]
  24. Baumol, W.J.; Oates, W.E. The Theory of Environmental Policy, 2nd ed.; Cambridge University Press: Cambridge, UK, 1988. [Google Scholar]
  25. Sterman, J.D. Business Dynamics: Systems Thinking and Modeling for a Complex World; Irwin/McGraw-Hill: Boston, MA, USA, 2000. [Google Scholar]
  26. Pimentel, D.; Hepperly, P.; Hanson, J.; Douds, D.; Seidel, R. Environmental, energetic, and economic comparisons of organic and conventional farming systems. BioScience 2005, 55, 573–582. [Google Scholar] [CrossRef]
  27. Herren, H.R.; Bassi, A.M.; Tan, Z.; Binns, W.P. Green Jobs for a Revitalized Food and Agriculture Sector; Food and Agriculture Oorganization off the United Nations: Rome, Italy, 2012. [Google Scholar]
  28. Donnges, C.; Edmonds, G.A.; Johannessen, B. Rural road Maintenance: Sustaining the Benefits of Improved Access; No. 19; International Labour Organisation: Geneva, Switzerland, 2007. [Google Scholar]
  29. Emerton, L.; Aung, Y.M. The Economic Value of Forest Ecosystem Services in Myanmar and Options for Sustainable Financing; IMG, Yangon and Ministry of Environmental Conservation and Forests: Naypyidaw, Myanmar, 2013. [Google Scholar]
Figure 1. GDP growth rate and its polynomial trend for Thailand, Vietnam and Malaysia (1980–2010). (Source: World Bank World Development Indicators (WDI).)
Environments 03 00019 g001
Figure 2. Observed patterns of economic development. (a) GDP growth; (b)historically has been primarily driven by BAU investments; leading to natural capital depletion and externalities; (c) In the BAU scenario, Green Investments become proportionally smaller every year; (d,e) When the share of Green Investments increases; (f) externalities are avoided and GDP growth increases.
Environments 03 00019 g002
Figure 3. Feedback loop between society, the economy, and the environment.
Environments 03 00019 g003
Figure 4. Causal loop diagram (CLD) representing the cause-effect relations among key indicators analyzed, and the effect of green economy policy options. Note: Orange (initial intervention), green (policy interventions for mitigation), black (system variables); a causal link from variable A to variable B is positive if a change in A produces a change in B in the same direction; a causal link from variable A to variable B is negative if a change in A produces a change in B in the opposite direction.
Environments 03 00019 g004
Figure 5. The main methodologies and models utilized in the study: InVEST, with spatial information (the Myanmar case is presented) (1); System Thinking, to identify key social, economic and environmental drivers of change (2); System Dynamics, to quantify scenarios with a systemic and integrated approach (3); and all used iteratively (4).
Environments 03 00019 g005
Figure 6. Land use under the Road Scenario (a); and the Road Scenario with Green Economy Interventions (b).
Environments 03 00019 g006
Figure 7. Land use under the Road Scenario (a); and the Road Scenario with Green Economy Interventions (b).
Environments 03 00019 g007
Table 1. Parameters and assumptions used for model development in the study “Road to Dawei”.
Land Use
Total area cleared for road constructionCalculated as 3 times larger than actual road area (2.64 km2 and 10.56 km2 for the Dawna Tenasserim Landscape (DTL), 4.5 km2 and 18.2 km2) due to additional land clearing for construction purposes.
Forest landForestland is used for the construction of the road and for the expansion of agricultural land.
Urban landUrban areas are built primarily on degraded land. In case degraded land is not available, part of the area cleared for road construction is used for human settlement, up to 30% of its total. Any remaining need for urban land is fulfilled through deforestation.
Population
Growth rateThe net population growth rate (birth minus death rate, excluding migration) is assumed to be 3%, based on demographic trends in the Kanchanaburi area and 2% for Myanmar.
Out migrationAn out migration rate of 5% and 1% is assumed for the BAU scenario for the DTL and Myanmar, respectively. However, the construction of the road is assumed to drive a progressive decline of out migration in Thailand, due to increased employment opportunities deriving from the improvement of transport infrastructure (the out migration flow would stop by the year 2025). In Myanmar, also due to the large industrial development planned in the Dawei area, outmigration to urban areas is assumed not to change.
Water
Average annual precipitation1500 mm/year for the DTL [19] and 5500 mm/year for Myanmar.
Average water use in agriculture660 mm/ha/year.
Residential water demand/capitaThe average amount of m3 per person per year is 39.54 m3 (6500 cubic meters for 60,000 villagers in Thailand, on average, per day).
Agriculture
Effect of road construction on agriculture attractivenessAttractiveness would gradually increase since the starting of road construction works, reaching a four-fold increase after road completion.
Impact of investments in agriculture on deforestationWhen attractiveness is at the maximum level, a 10% increase in desired land is assumed (desired, not necessarily taking place).
Initial average fertilizer use/km213.79 tonnes per km2 for Thailand [19] and 2.5 tonnes per km2 for Myanmar.
Organic fertilizer useIn the range of 30% to 40% of total fertilizer consumption by 2035 under the GE scenario.
Investment in organic fertilizerApproximately $100/ha/year.
Ecological agriculture water use30% reduction compared to conventional agriculture [26].
Average agriculture land per capita for food production0.004 km2 per person = 1 acre per person in Thailand and 0.003 km2 per person in Myanmar. The area needed for food production is assumed to decrease with the increase in agricultural productivity.
Agricultural productivityIt is assumed that changes in fertilizer use, soil quality, and labour productivity would have a positive—but not immediate—impact on agricultural productivity.
Employment
Potentially active people (labour force)60% of total population, calculated on the basis of population cohort between 15 and 59.
Residential people employed in agriculture45.94% of the population, derived from the fraction of agricultural employment in the Kanchanaburi region and 35% in Myanmar (assumed).
Initial average income of farmer’s household15,326 Baht for Thailand [19], not estimated for Myanmar.
Average farmers needed/km269.86 farmers/km2 in the No-road and BAU scenarios, derived from initial values of people employed in agriculture and initial area of agricultural land in the Kanchanaburi region. Same assumption used for Myanmar. In the green economy scenarios, the adoption of ecological agriculture practices is expected to produce a 30% increase in employed farmers [27]
Average household income: road construction/maintenanceAssumed to be 50% higher than initial average income of farmer’s households.
Workers needed for road construction11.3 per km of road.
Road maintenance labour1 worker for 3 km of road [28].
Natural Capital and Ecosystem Services
Average CO2 absorbed by forests8600 tonnes of CO2 per km2 of forest in the DTL; 11,954 tonnes of CO2 per km2 of forest, 300 for crops and 38 tonnes of CO2 per km2 for other wooded land in the case of Myanmar (InVEST).
Price per ton of CO2123 Baht, or $4 in Thailand, and a range between $16/ha and $38/ha in Myanmar [29], which results in a value close to $1/ton in the high case.
Flood control$419.12 per ha in Myanmar [29].
NTFP$177 per household Myanmar [29]. People per household: 4.8 (Department of Population, Ministry of Population and Immigration).

