Article

Determination of Water Quality Degradation Due to Industrial and Household Wastewater in the Galing River in Kuantan, Malaysia Using Ion Chromatograph and Water Quality Data

by
Daisuke Kozaki
1,2,3,*,†,
Norhasmira Idayu Binti Harun
1,†,
Mohd Hasbi Bin Ab. Rahim
1,
Masanobu Mori
3,4,
Nobutake Nakatani
5 and
Kazuhiko Tanaka
6
1
Faculty of Industrial Sciences and Technology, University Malaysia Pahang, Lebuhraya Tun Razak, 26300 Gambang Kuantan, Malaysia
2
Department of Food & Nutritional Sciences, College of Bioscience and Biotechnology, Chubu University, 1200 Matsumoto-cho, Kasugai, Aichi 487-8501, Japan
3
Department of Chemistry and Biotechnology, Faculty of Science and Technology, Kochi University, 2-5-1 Akebono-cho, Kochi City, Kochi 780-8520, Japan
4
Graduate school of Science and Technology, Gunma University, 1-5-1 Tenjin, Kiryu, Gunma 376-8515, Japan
5
Department of Environmental and Symbiotic Sciences, College of Agriculture, Food and Environmental Science, Rakuno Gakuen University, 582 Bunkyodai-Midorimachi, Ebetsu, Hokkaido 069-8501, Japan
6
College of Engineering, Chubu University, Chubu University, 1200 Matsumoto-cho, Kasugai, Aichi 487-8501, Japan
*
Author to whom correspondence should be addressed.
These authors contributed equally to this work.
Environments 2017, 4(2), 35; https://doi.org/10.3390/environments4020035
Submission received: 20 January 2017 / Revised: 29 March 2017 / Accepted: 18 April 2017 / Published: 23 April 2017
(This article belongs to the Special Issue Soil and Water Contamination, Remediation and Conservation)

Abstract

:
Water quality of the Galing River in Kuantan, Malaysia was examined to understand the anthropogenic environmental load in each administrative section, using water quality monitoring data and land use pattern. The National Physical Plan 2005 identified Kuantan as one of the country’s future growth centers, which has resulted in rapid development and environmental degradation in the past decade. Multiple water quality indexes used by the Department of Environment, Malaysia and concentrations of several ionic species were examined to assess the river’s water quality. The following inferences were drawn in this study: (1) Cl and Na+ concentrations indicated that the basin area near the eastern urbanized area was subject to lesser human influence and lower environmental burden; (2) the Western side of the Galing River was subject to higher anthropogenic influence and indicated lower class levels of ammoniacal nitrogen, chemical oxygen demand, and dissolved oxygen, compared to the eastern side; (3) Class V or near class V pH values were obtained upstream at the western side of the Galing River in the industrial area; (4) Two types of environmental burden were identified in the western side of the Galing River, namely, inflow of industrial wastewater upstream on the western side and the effect of household wastewater or untreated raw sewage wastewater.

1. Introduction

Water pollution and eutrophication of lakes, rivers, and oceans has been caused by the increased influx of wastewater due to rapid economic, industrial, and agricultural development without construction of appropriate water infrastructure and treatment facilities [1,2]. Water pollution is a particularly severe problem in developing countries and adequate water quality monitoring is required to understand and manage the water quality. In Malaysia, 42 highly polluted tributaries were identified in the 1980s [3]. In the 1990s and 2000s, almost 60% of the major rivers were regulated for domestic, agricultural, and industrial purposes, due to water quality degradation by the wastewater from housing, industrial, and business areas [4,5].
The Galing River is the main drainage system of the Kuantan area and it flows through the most urbanized area of Kuantan city, located on the east coast of peninsular Malaysia. Kuantan is the state capital of Pahang and the 17th largest city in Malaysia [6]. The National Physical Plan 2005 identified Kuantan as one of the country’s future growth centers and a hub for trade, commerce, transportation, and tourism, owing to its strategic location on the east coast. Following the implementation of the “Kuantan District Locality Plan 2004–2015” over the past decade, the area has developed rapidly, resulting in environmental degradation [7,8,9,10]. As shown in Figure 1, the east coast area of Kuantan city has been notably urbanized and agricultural and forest regions have been converted to housing and business/servicing purposes during this period.
Our research group focused on several rivers in Kuantan in a previous study [11]. The study revealed that pollution levels in the three rivers (Kuantan River: Class I–III, Belat River: Class I–III, and Galing River: Class I–V) were related to the urbanization of the river basin area. The average percentage increases of housing and business/service areas were as follows: Kuantan River (7.78% and 0.829%, respectively) < Belat River (21.1% and 1.69%, respectively) < Galing River (30.5% and 5.38%, respectively). Further pollution of the Galing River was predicted owing to poor water treatment of household/sewage wastewater discharged from the river basin area. The Galing River is one of the most polluted rivers in peninsular Malaysia because of industrialization and high human activity in the basin area. In addition, as background research, our research group monitored trends in the test parameters in the Galing River during different periods of one year (May, August, and November 2015) and for three years (May 2014, May 2015, and March 2016) based on the weather data (Figure S1), as shown in Figures S2 and S3, respectively. Each data were summarized in Tables S1, S2, S3 and S4. Background research revealed that the water quality was constantly in the “low classification” categories of the Natural Water Quality Standards (NWQS) for Malaysia. Thus, detailed monitoring of the river is required in each area of Kuantan city to optimize the location of sewage treatment systems and improve water quality.
Our research group focused on detailed evaluation of the environmental burden of each lot of Kuantan city on the Galing River’s water quality. In this research, several ionic species (anions: SO42−, Cl, and NO3, cations: Na+, K+, NH4+, Mg2+, and Ca2+) were monitored using ion-exclusion/cation-exchange chromatographic (IEC/CEC) systems. These ionic species are common components in the river water and are important parameters that help explain changes in the aquatic environment. Furthermore, several key water quality parameters such as dissolved oxygen (DO), chemical oxygen demand (COD), total phosphorus (TP), and pH, which are used in the water quality index (WQI) classification of the Department of Environment, Malaysia, were monitored [1,12].

2. Materials and Methods

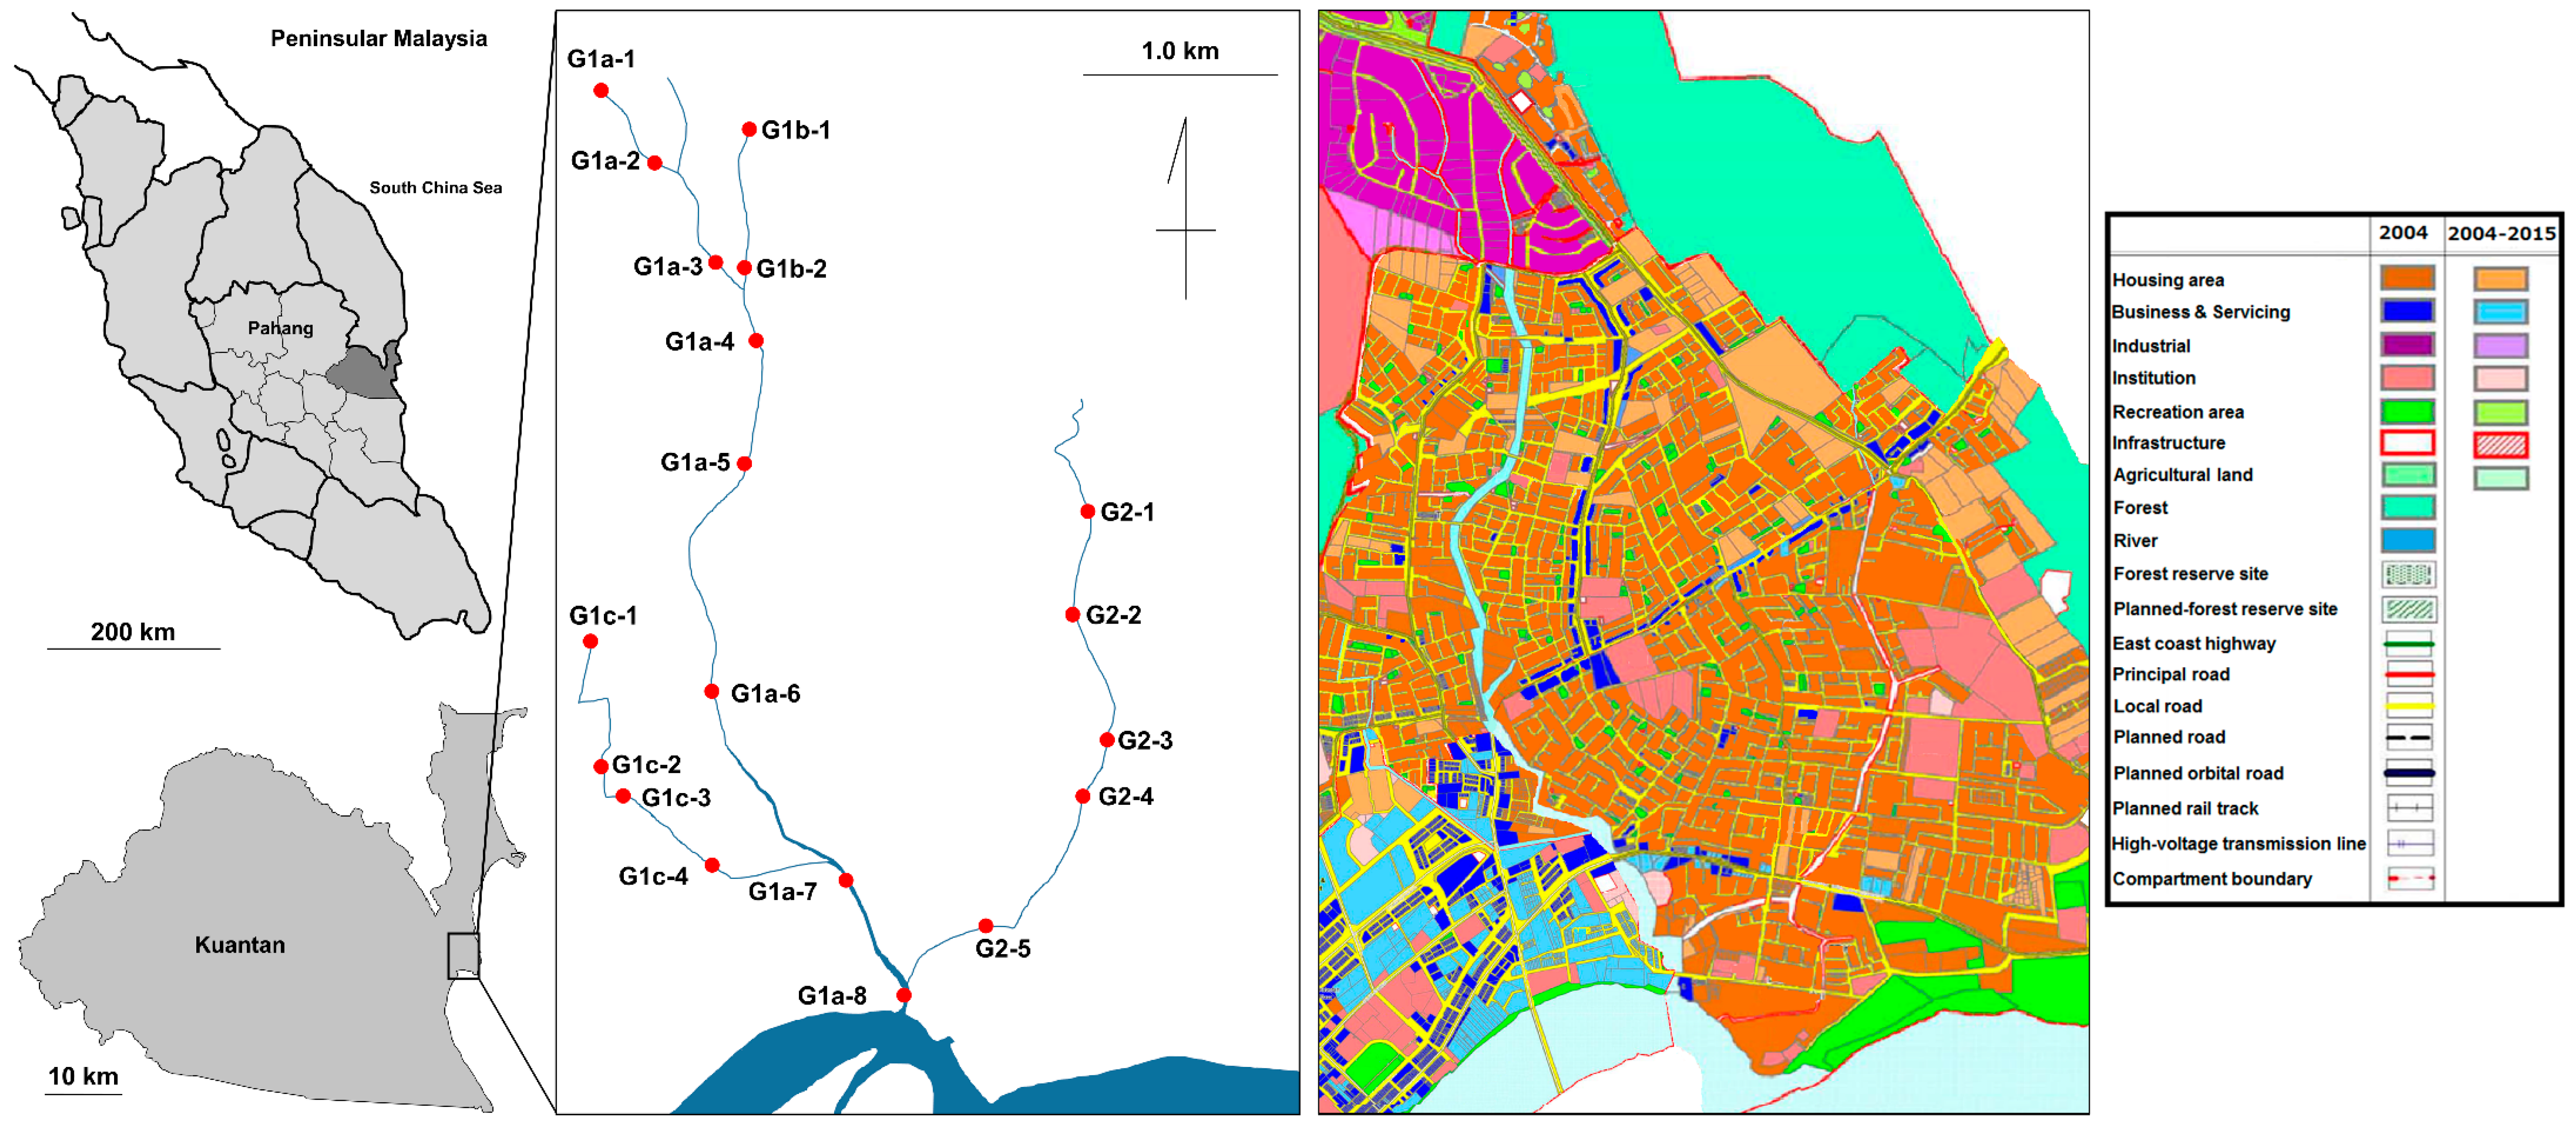
2.1. River Water Sampling

Water samples were collected from 19 different sites, as shown in Figure 1, during the daytime on 5 March 2016, which recorded low precipitation from 2000 to 2012 (Figure S1) [13]. The Galing River has two main tributary streams that merge into a single artery just before joining the Kuantan River. The sampling sites at the western side of the river are denoted by G1a-1 to G1a-8. The western side has two additional smaller tributaries, indicated as G1b-1 to G1b-2 and G1c-1 to G1c-4. The small tributary G1b joins G1a between G1a-3 and G1a-4, whereas the small tributary G1c joins the G1a between G1a-6 and G1a-7. G1a-1 to G1a-3 and G1b-1 to G1b-2 flow through the western and eastern side of the industrial area respectively, while the G1a-4 to G1a-8 and G1c-1 to G1c-4 flow through the urbanized area of the city. The eastern tributary of the river flows through the urbanized area and is denoted by G2-1 to G2-5.
All river water samples were collected at the center of the river from the surface water layer (0–15 cm from the surface). Water samples for IEC/CEC were filtered using a membrane filter (φ 0.45 μm; Acrodisc®–25 mm syringe filters; Pall Co., Port Washington, NY, USA) immediately following collection and injected to the IEC/CEC system. These samples were temporarily refrigerated at 6 °C [14]. Water samples for COD and TP monitoring were temporarily refrigerated without filtration at 6 °C under dark storage and immediately monitored using a UV-visible detector with reagents [14].

2.2. Reagents

All reagents were obtained from Sigma-Aldrich Co. (Greater St. Louis, MO, USA). Pure water (18 MΩ·cm at 25 °C) obtained from an ELGA-DV25 system (Elga LabWater, High Wycombe, UK) was used for dissolving and diluting the reagents. Standard solutions used in IEC/CEC were diluted from stock solutions to the appropriate concentrations using pure water.

2.3. IEC/CEC System for Anionic and Cationic Species

The IEC/CEC system consisted of an eluent delivering pump (Tosoh: DP-8020), an oven for separation column (Shimadzu: CTO-10AVP), and a conductivity detector (Shimadzu: CDD-6A). To obtain adequate separation resolutions for the IEC/CEC peaks, two TSKgel Super IC-A/C separation columns packed with a polymethacrylate-supported weakly acidic cation-exchange resin (WCX) in H+–form (150 mm × 6.0 mm ID; 4 μm particle size, and 0.1 meq/mL capacity) were connected in tandem. The column temperature, eluent flow rate, and injection volume were 40 °C, 0.5 mL/min, and 30 μL, respectively [11].
IEC/CEC was able to separate anions based on ion-exclusion/penetration effects in the WCX phase, and cations based on the cation-exchange effect with functional carboxylate groups in the column. The eluent contained a mixture of 6.0 mM tartaric acid and 2.0 mM 18-crown-6. Under optimal conditions, the calibration curves of the analyte were linear in the 0.050–1.0 mM range, and the correlation coefficients were 0.9958–0.9999. The detection limits (S/N = 3) were 0.632–2.22 μM. The relative standard deviation (RSD) of the peak areas of the analyte ions were 0.40%–1.5%.

2.4. Sensors and Optical Instruments for other WQIs

DO was determined locally using a portable DO meter (DO-31P; DKK-TOA Corp., Tokyo, Japan) immediately following sample collection. The pH values were measured using a desktop pH meter (CyberScan pH 510; Thermo Scientific, Waltham, MA, USA) in the laboratory immediately following collection. COD was determined using a UV-visible detector (DR900; HACH Company, Loveland, CO, USA) with a COD test reagent (COD-LR; HACH Company, Loveland, CO, USA) based on the dichromate method using potassium dichromate [15]. TP was determined by a UV-visible detector with a TP test reagent (TP-LR; HACH Company, Loveland, CO, USA) based on persulfate digestion with ascorbic acid method. Ammonium molybdate and antimony potassium tartrate reacted with dilute solutions of phosphorus in a potassium pyrosulfate medium to form yellow antimony-phospho-molybdate [16].

3. Result and Discussion

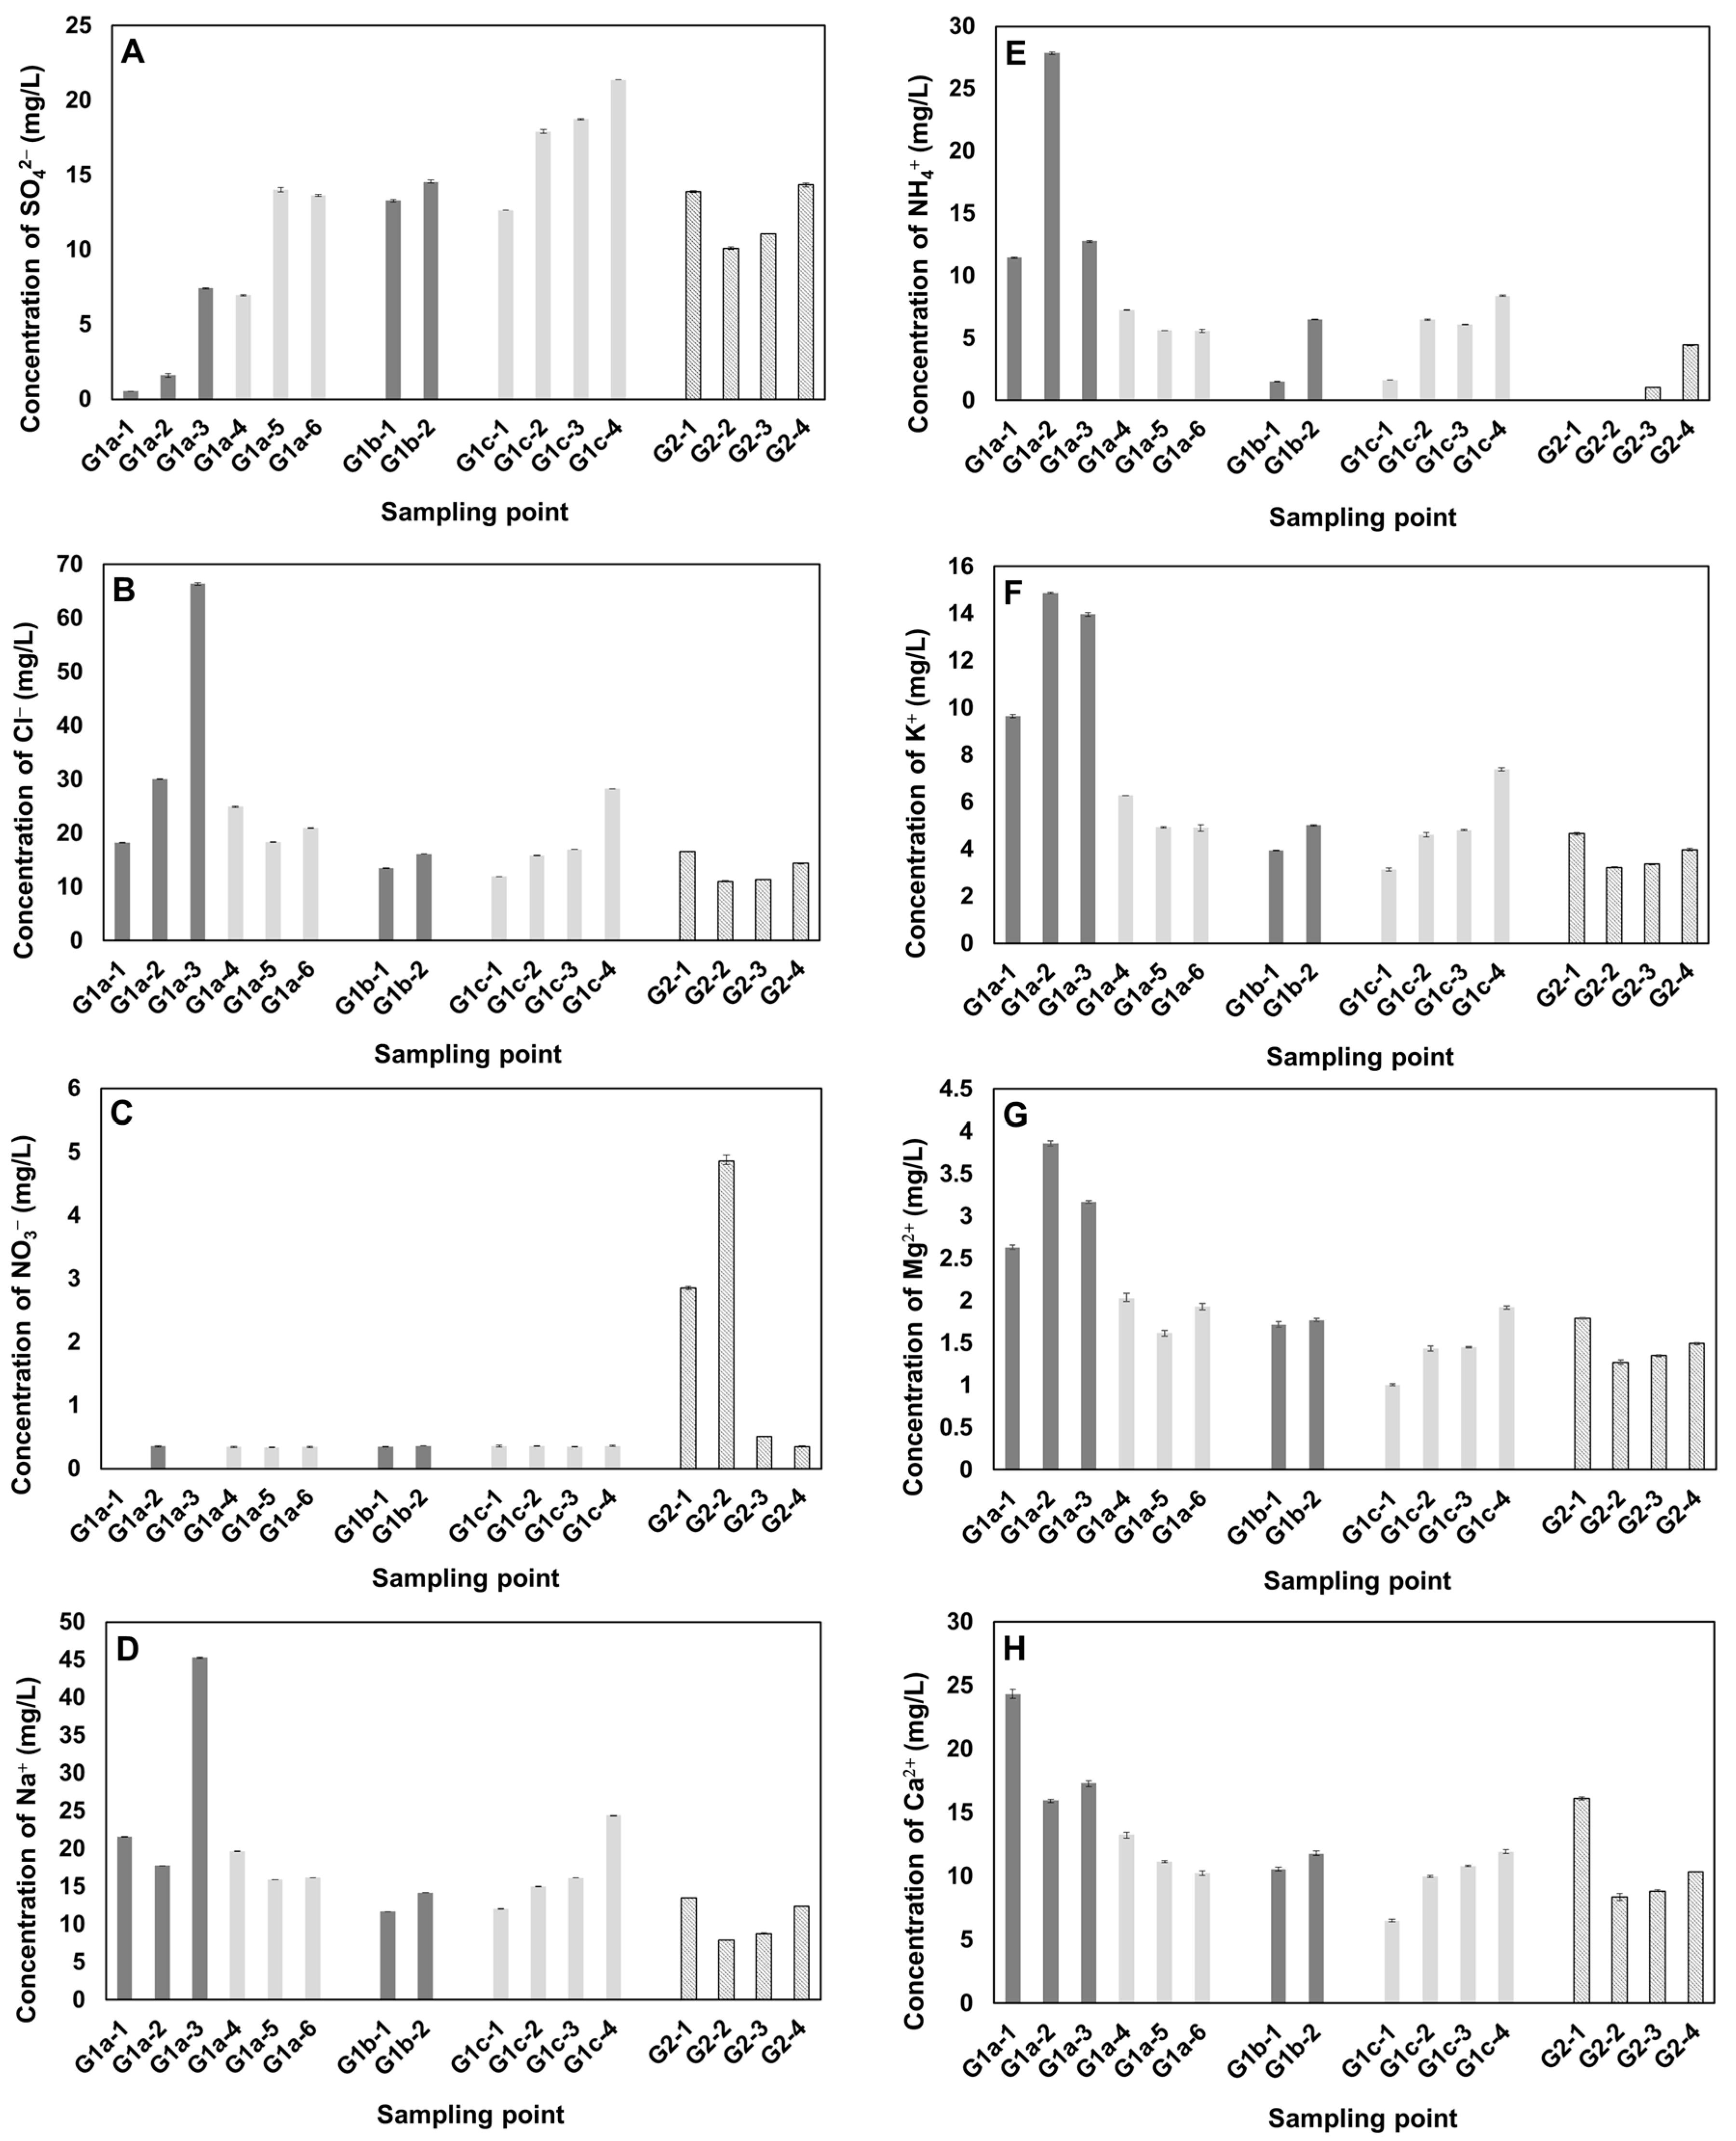
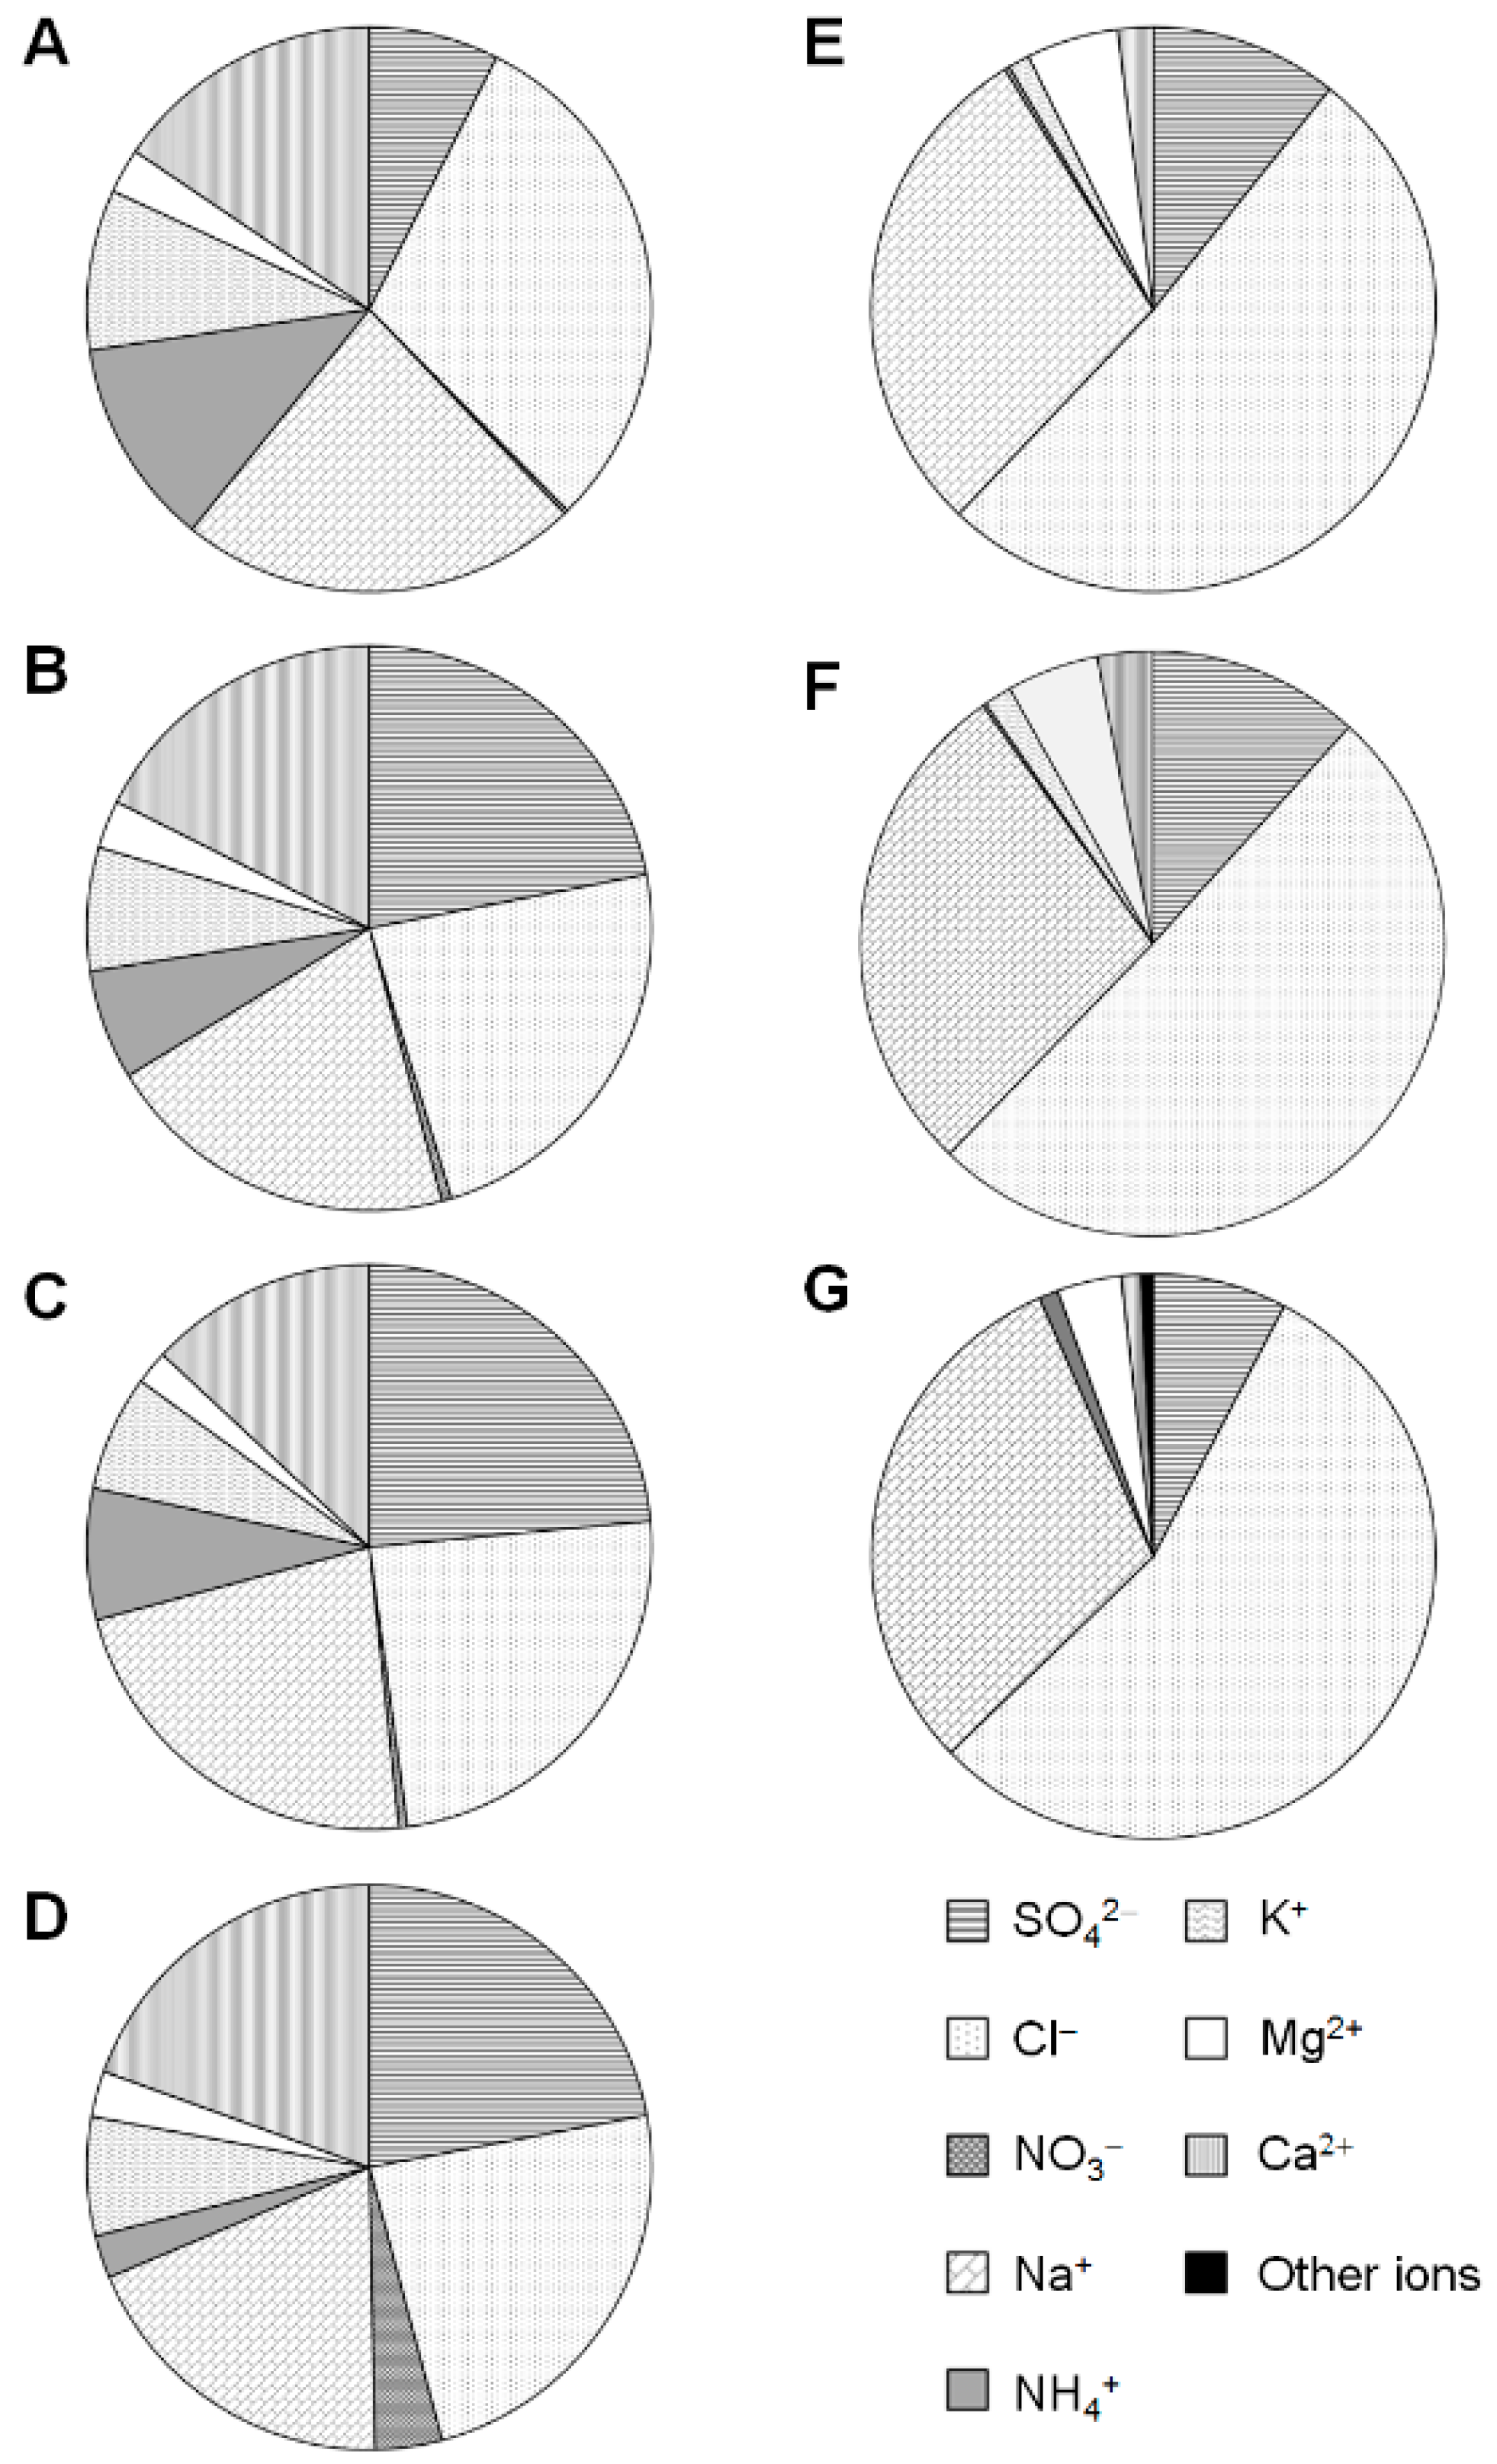
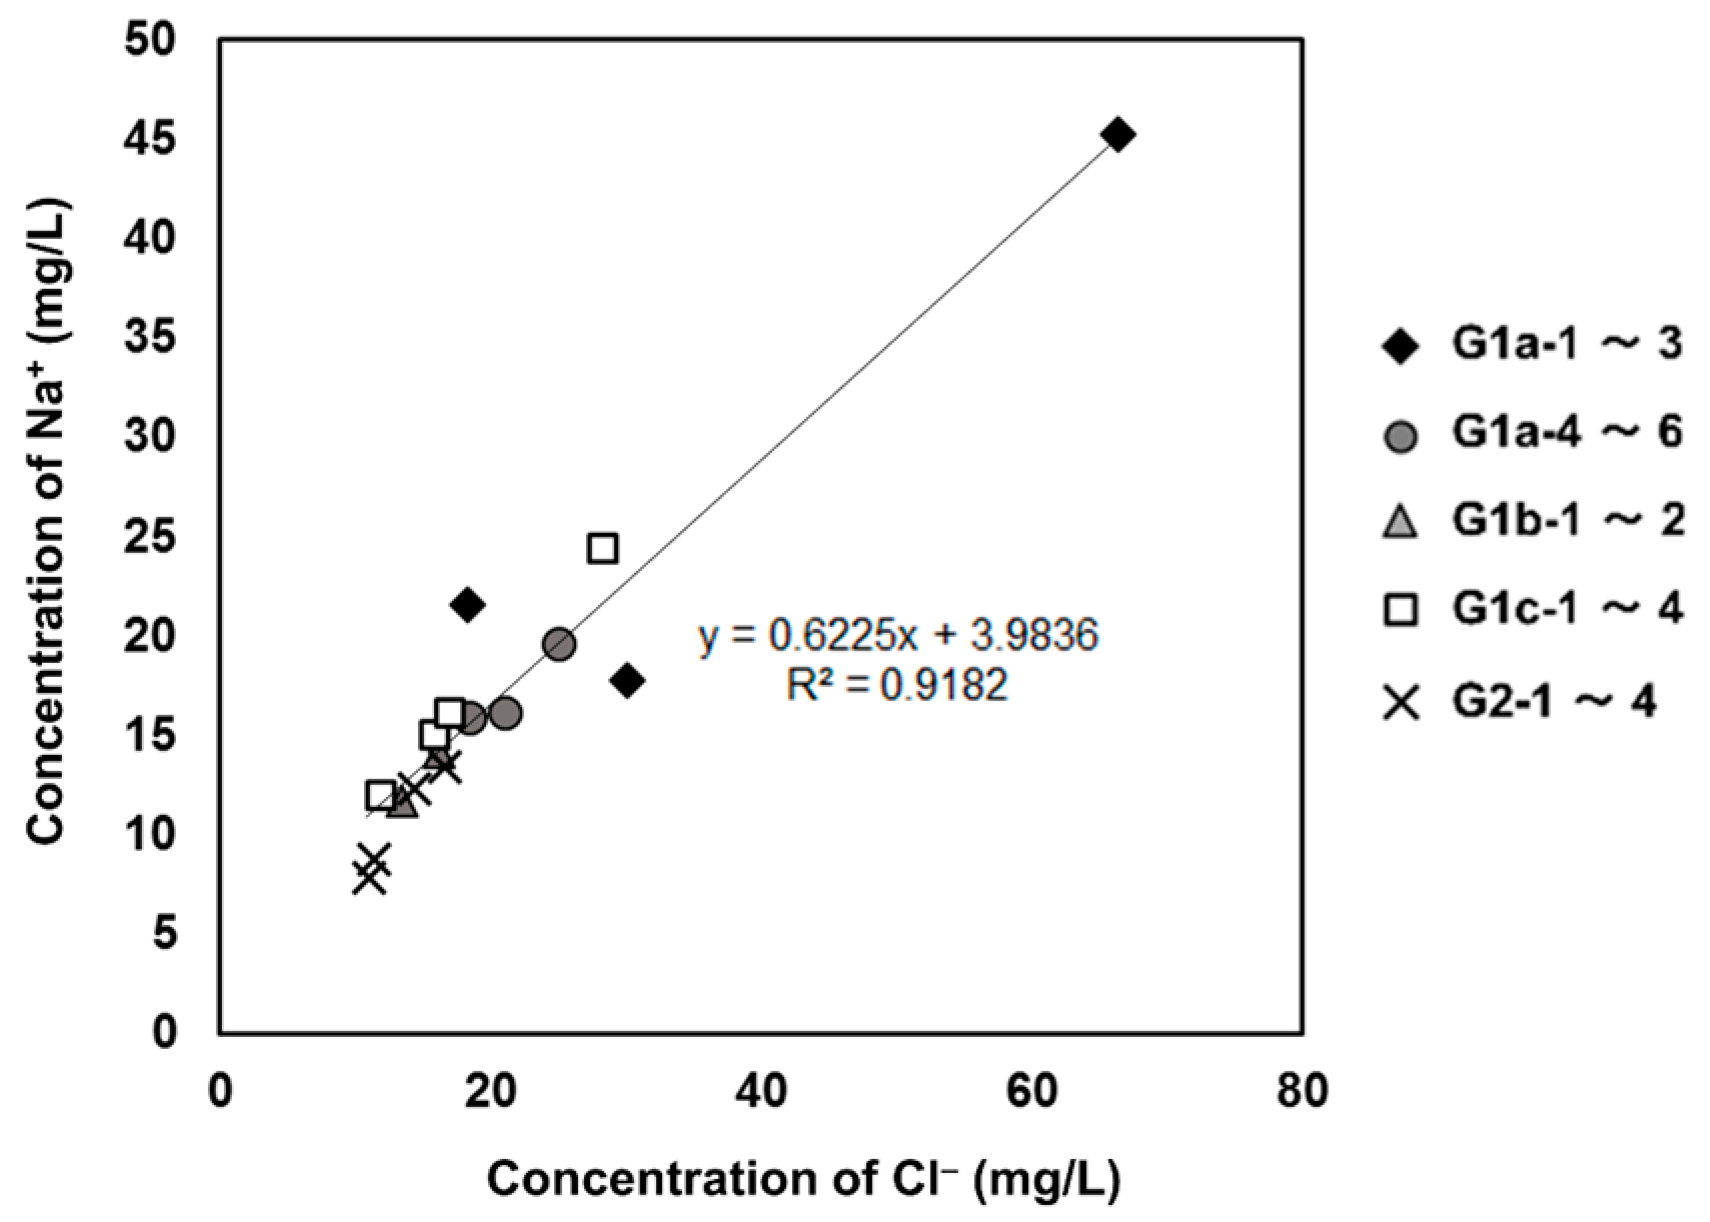
3.1. Distribution of Ionic Species in the Galing River

The concentration of ionic species, with the exception of NO3 and NH4,+, downstream of the Galing River, increased drastically between G1a-6 to G1a-7 (SO42−: 13.6–208 mg/L, Cl: 21.0–966 mg/L, Na+: 16.1–158 mg/L, K+: 4.90–24.6 mg/L, Mg2+: 1.93–107 mg/L, and Ca2+: 10.2–37.0 mg/L) and G2-4 to G2-5 (SO42−: 14.4–68.3 mg/L, Cl: 14.4–274 mg/L, Na+: 12.4–158 mg/L, K+: 3.98–9.84 mg/L, Mg2+: 1.49–29.6 mg/L, and Ca2+: 10.3–18.4 mg/L). In addition, the composition of the downstream samples also changed significantly between G1a-6 (SO42−: 18.5%, Cl: 28.4%, NO3: 0.470%, Na+: 21.9%, NH4+: 7.57%, K+: 6.65%, Mg2+: 2.62%, Ca2+: 13.9%) to G1a-7 (SO42−: 10.9%, Cl: 50.7%, NO3 :0.00%, Na+: 29.1%, NH4+: 0.450%, K+: 1.29%, Mg2+: 5.62% Ca2+: 1.94%) and G2-4 (SO42−: 23.3%, Cl: 23.3%, NO3 : 0.560%, Na+: 20.0%, NH4+: 7.20%, K+: 6.44%, Mg2+: 2.42% Ca2+: 16.8%) to G2-5 (SO42−: 12.2%, Cl: 49.0%, NO3 : 0.00%, Na+: 28.2%, NH4+: 0.280%, K+: 1.76%, Mg2+: 5.29% Ca2+: 3.29%). As shown in Figure 2, the average concentration ratios of the ions in the downstream regions resembled ion concentration ratios in seawater [17], suggesting that the main reason for the increase in ion concentrations in the downstream regions was the mixing of the river water with seawater. According to our previous study, high salinity values of 1.83 and 1.15 ppt (g/L) at G1a-7 and G1a-8, respectively, were detected [11]. From the above results, we inferred that water samples obtained within 1.8 km from the merging point with the Kuantan River were affected by seawater. Therefore, it was difficult to evaluate the anthropogenic environmental burden at sampling points G1a-7, G1a-8, and G2-5 using the IEC/CEC system. Consequently, these sampling points were deselected for the discussion and evaluation of the water quality in the Galing River.
The behavior of ionic concentrations are indicated in Figure 3 and the average concentration in each area (G1a-1 to 3 (industrial area), G1a-4 to 6 (housing area), G1b (industrial area), G1c (housing area), and G2 (housing area)) are summarized in Table 1. From Figure 3 and Table 1, the lowest and highest average concentration of SO42− were detected in G1a-1 to 3 (3.18 mg/L) and G1c (17.7 mg/L), respectively. The lowest and highest average concentration of NO3 were detected in G1a-1 to 3 (0.117 mg/L) and G2 (2.14 mg/L), respectively. The highest average concentration of NH4+ (17.4 mg/L) was detected in G1a-1 to 3 and the lowest concentration was detected in G2 (1.37 mg/L). Levels of these ionic species were dependent on aerobic and anaerobic biological reactions, rendering evaluation of anthropogenic environmental load difficult individually. In the case of Mg2+ and Ca2+, the highest average concentration was detected in G1a-1 to 3 (Mg2+: 3.22 mg/L and Ca2+: 19.2 mg/L) and the lowest concentration was detected in G1c (Mg2+: 1.45 mg/L and Ca2+: 9.80 mg/L). In the case of K+, the highest and lowest average concentration was detected in G1a-1 to 3 (12.8 mg/L) and G2 (3.81 mg/L), respectively. These ionic species are strongly related to geological conditions and evaluation of their individual environmental load is difficult [18,19,20].
However, concentration of Cl and Na+ are strongly affected by human activity along with geological conditions, especially in regions without brackish-water [16,17]. Additionally, types of ionic pairs that originate from human activity are mostly in the form of NaCl [16,17,18]. Good correlation was obtained between Na+ and Cl, as shown in Figure 4. Thus, these ionic species can be used as one of the parameters to reflect human activity [16,17,18]. The lowest and the highest average concentration of Cl and Na+ were detected in G2 (Cl: 13.3 mg/L and Na+: 10.6 mg/L) and G1a-1 to 3 (Cl: 38.2 mg/L and Na+: 28.2 mg/L), respectively. Relatively low environmental burden and low anthropogenic effect were detected in G2 in terms of Cl and Na+ concentration compared to other sampling points.

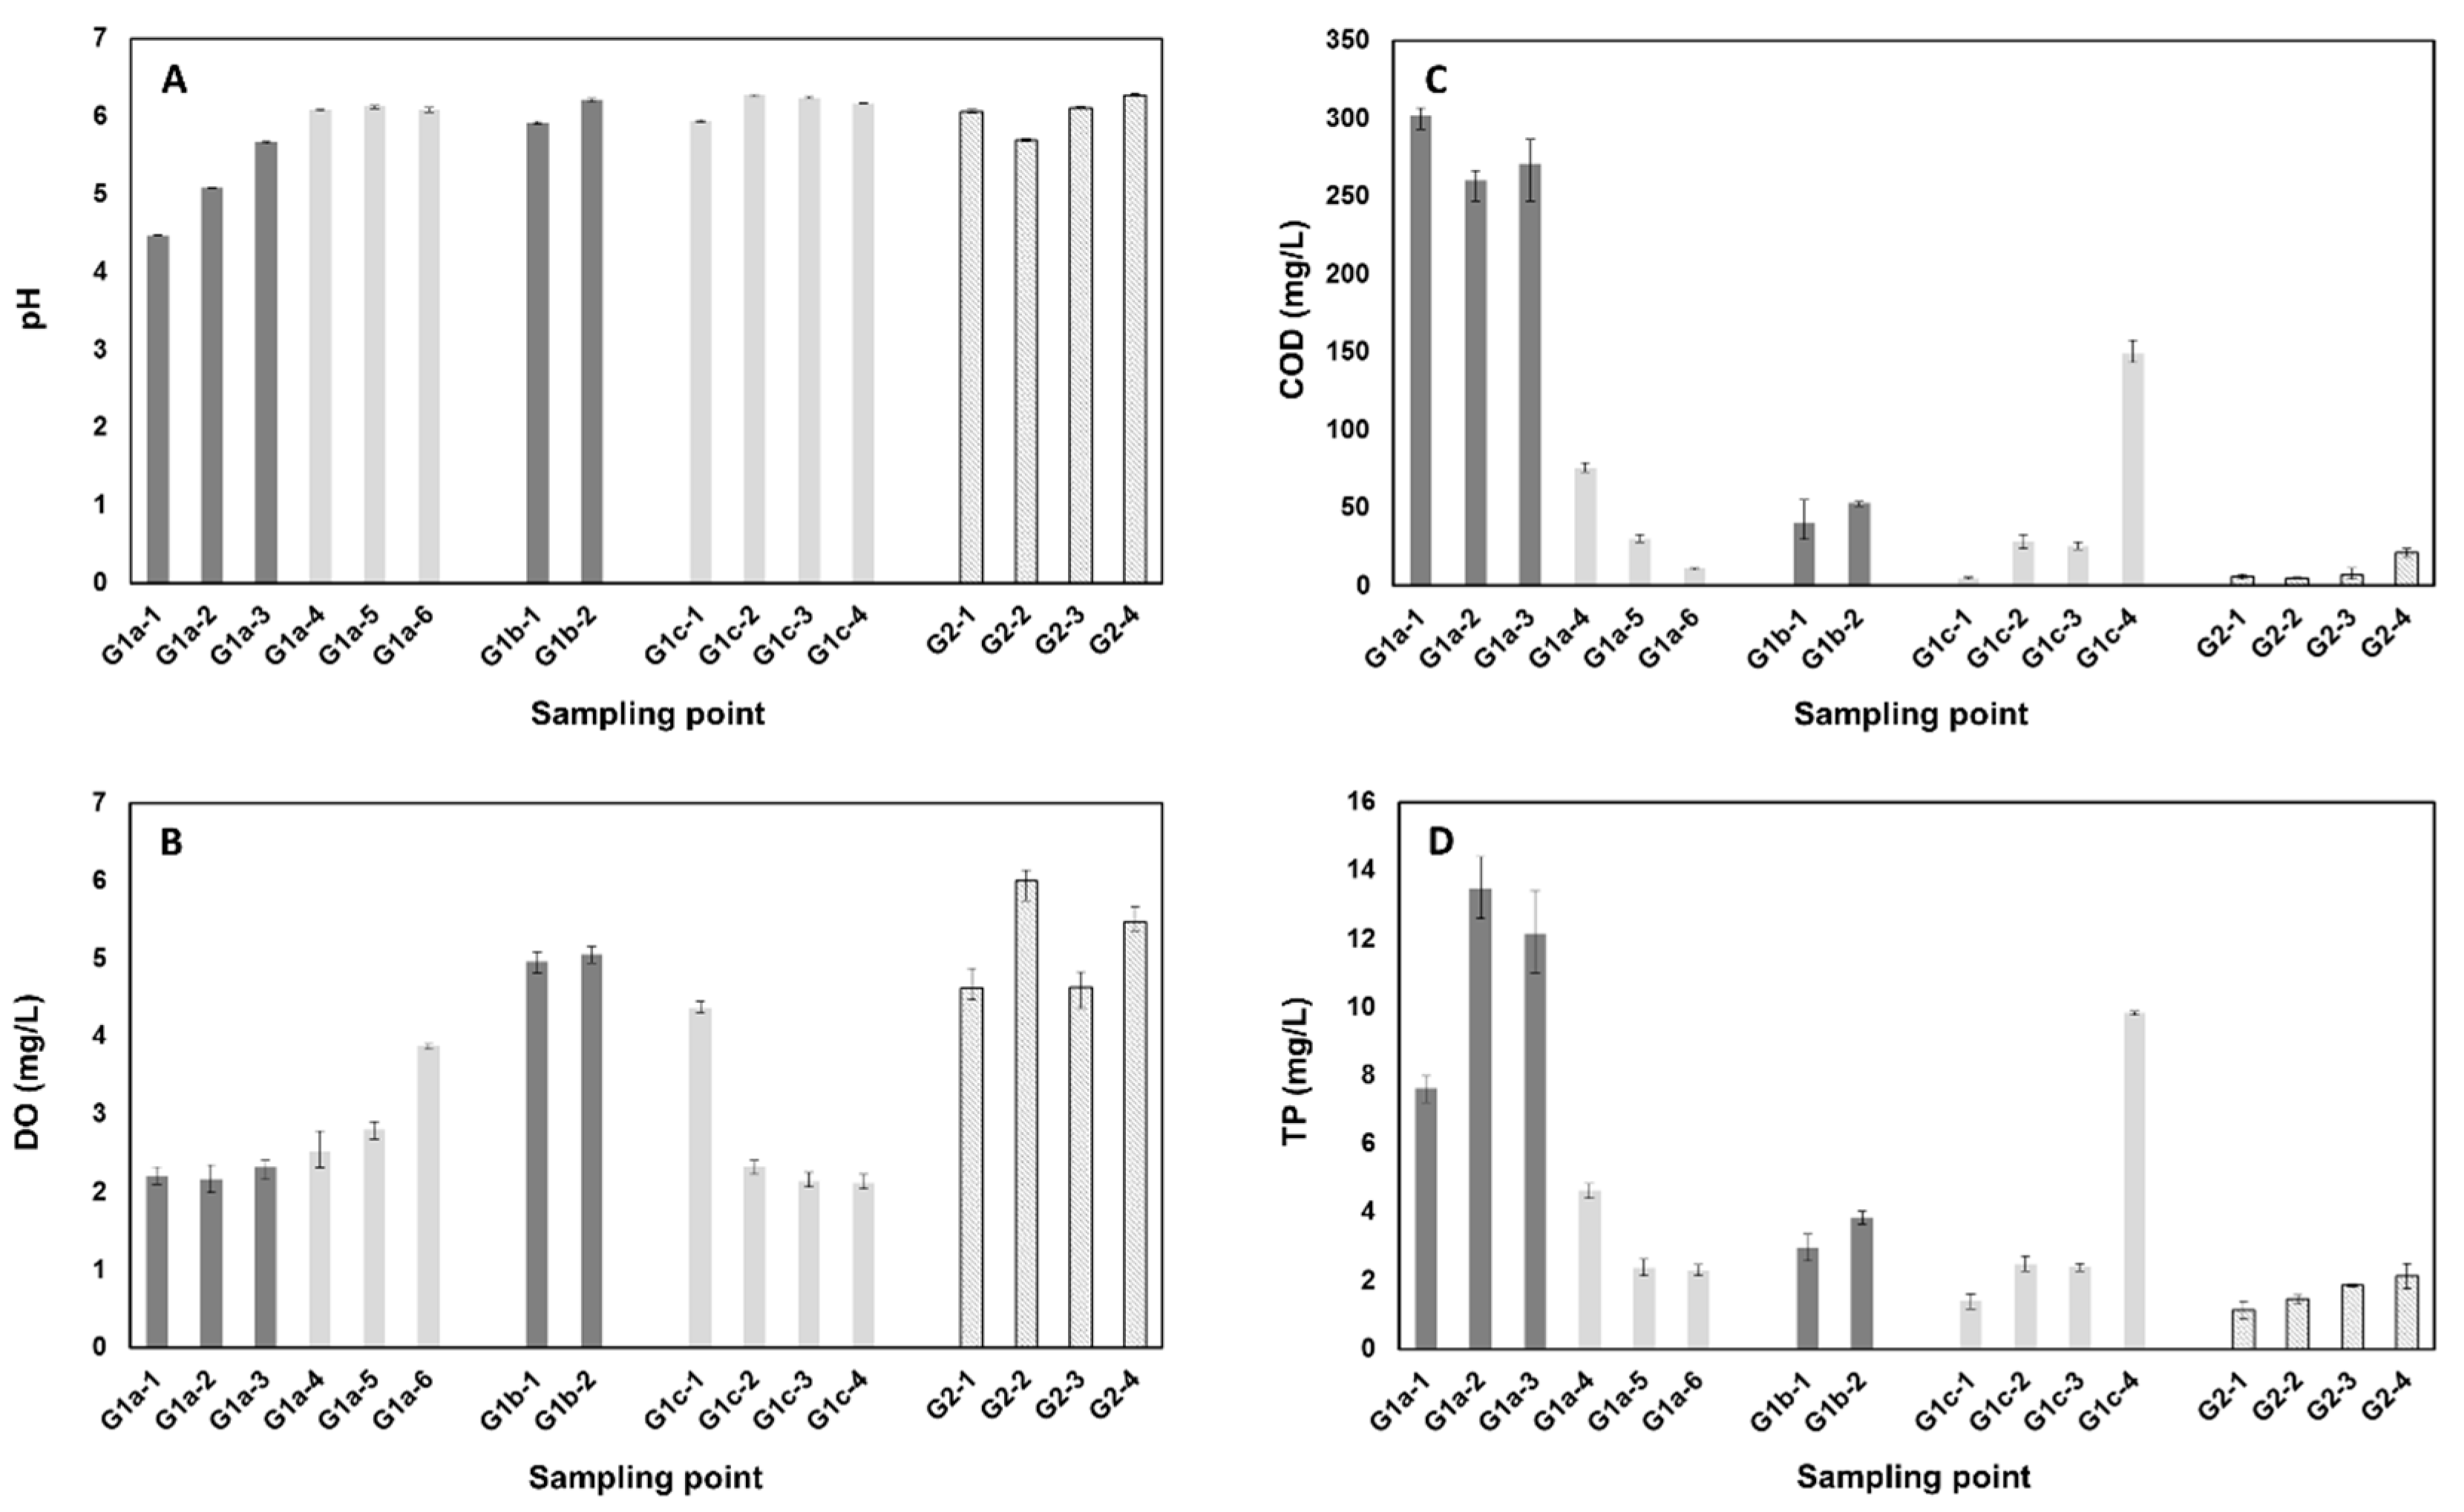
3.2. Distribution of Water Quality Parameters in the Galing River
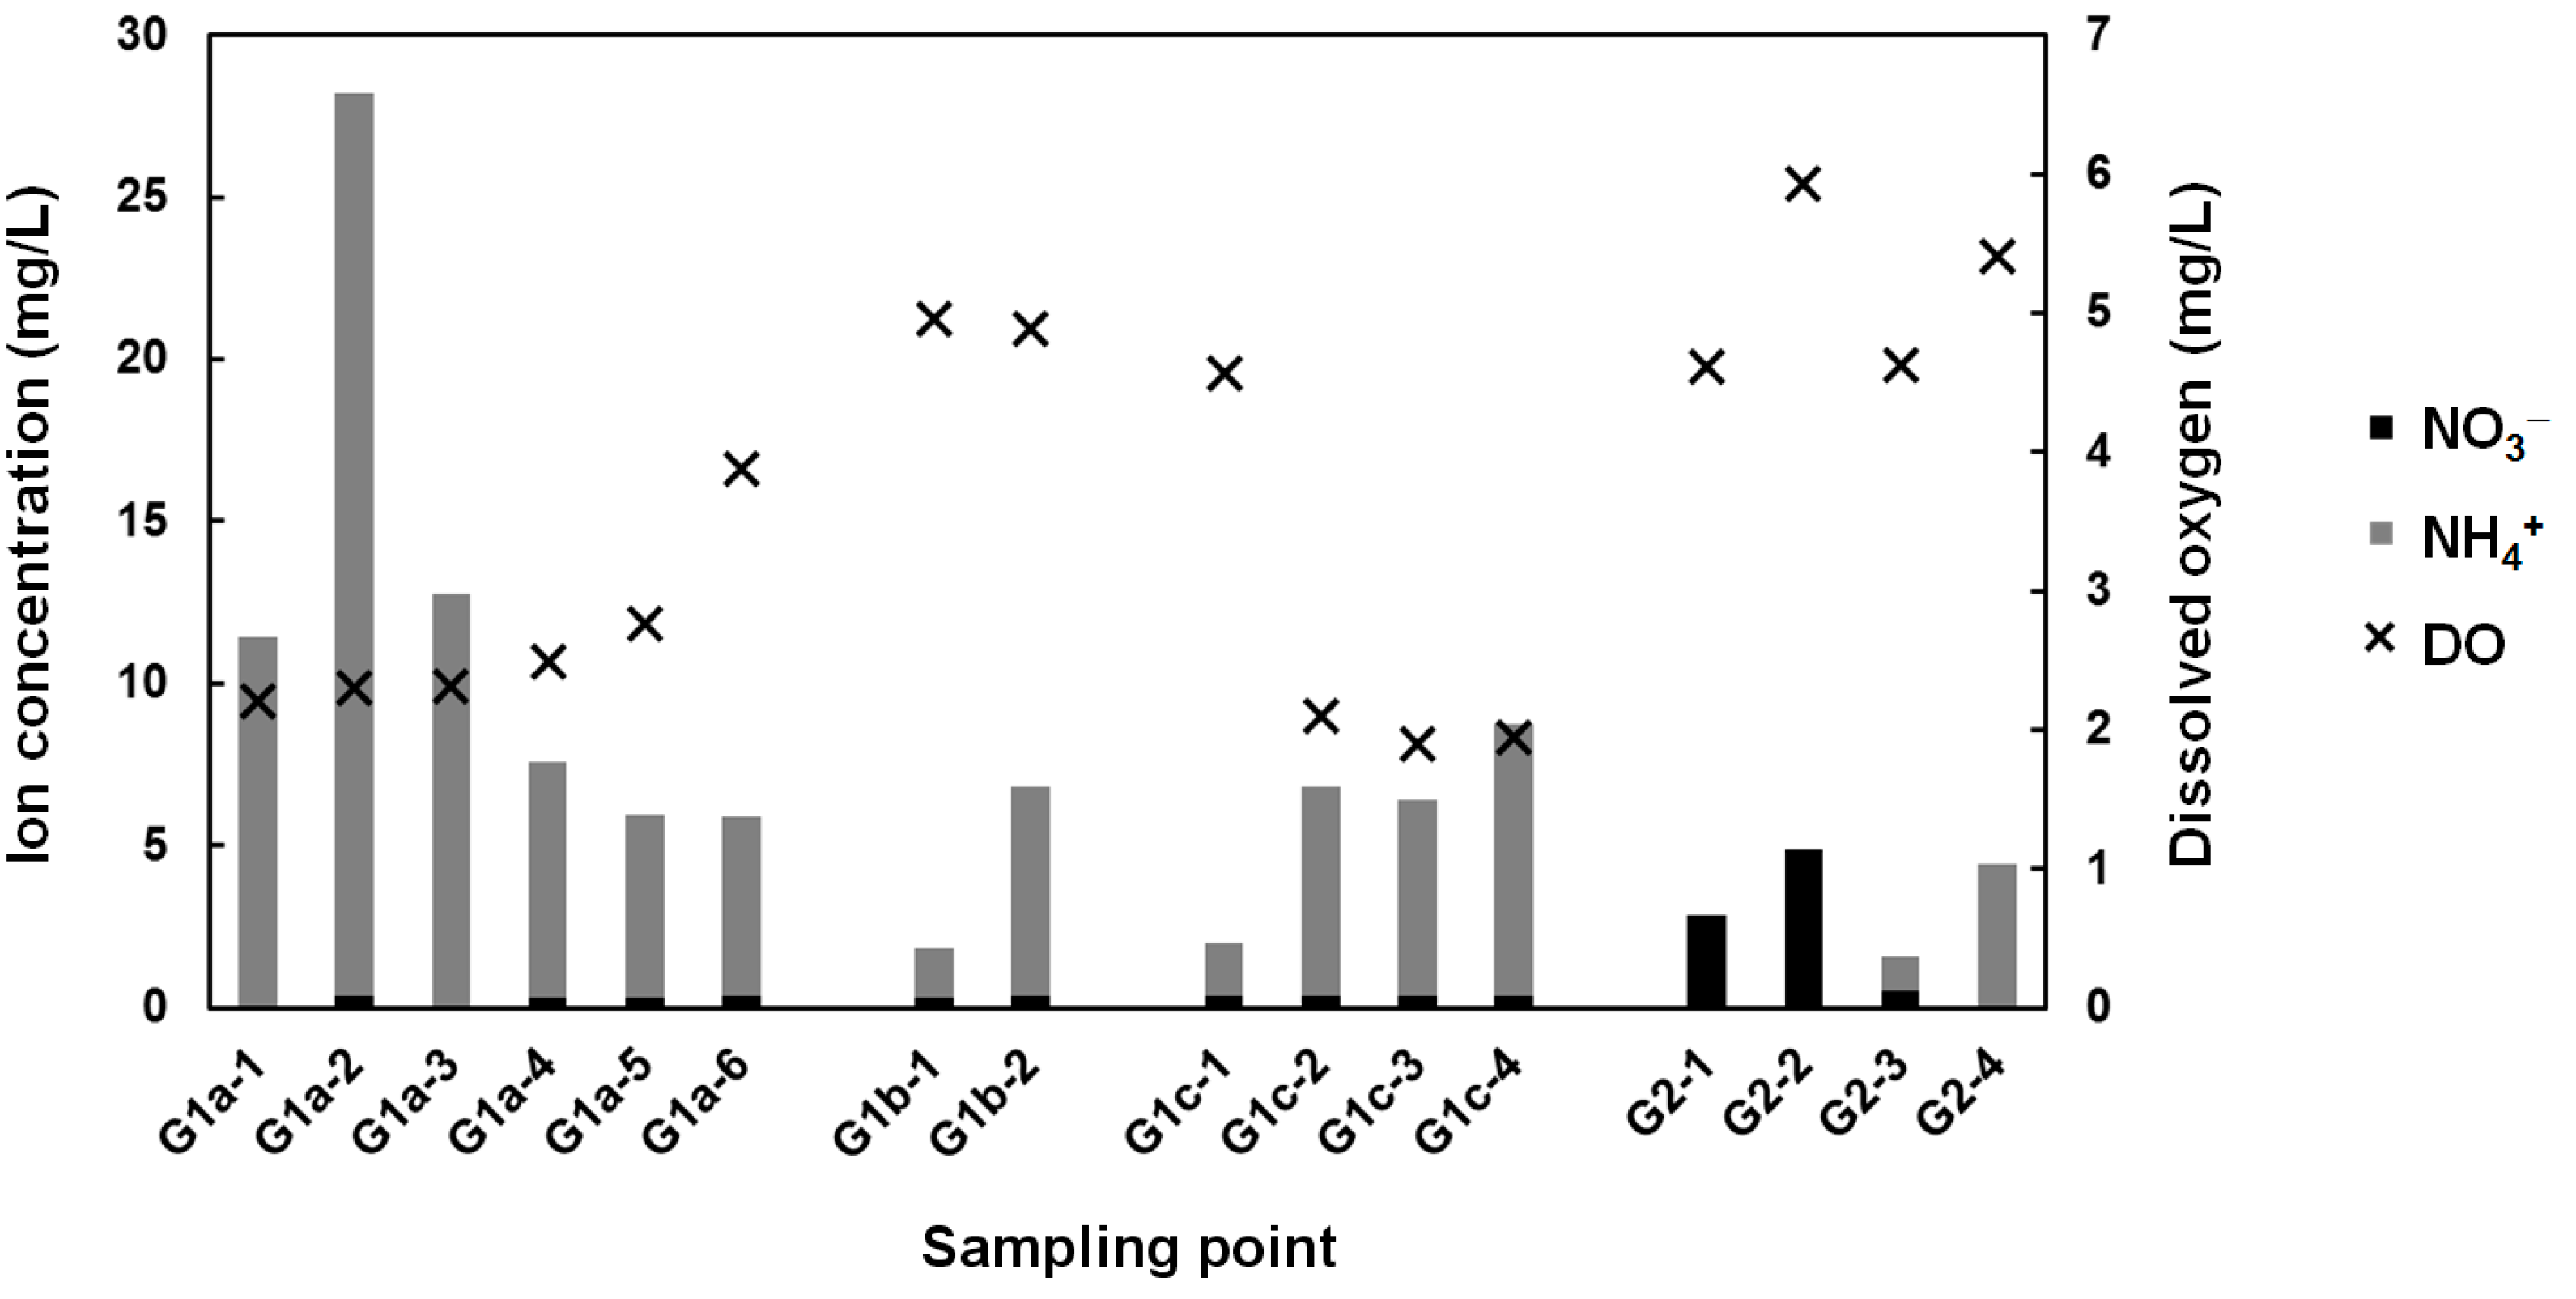
The values of WQI are summarized in Figure 5. As seen in Figure 5A and Table 1, the pH values were similar, ranging between 5.70 and 6.27, except for G1a-1 to 3 (industrial area), where the pH values moderately increased from G1a-1 (4.47) to G1a-3 (5.67). The DO value increased from upstream to downstream (2.20 to 3.87 mg/L) in G1a, while it decreased in G1c from upstream to downstream (4.36 to 2.12 mg/L). In addition, no particular trend was observed in G1b and G2. COD and TP exhibited a similar trend; slightly higher values were observed in G1a-1 to G1a-3 (COD: 302 to 271 mg/L, TP: 7.63 to 12.2 mg/L) compared to other sampling points, as shown in Figure 5C,D.
The average concentration of WQI in each area (G1a-1 to 3 (industrial area), G1a-4 to 6 (housing area), G1b (industrial area), G1c (housing area), and G2 (housing area)) are summarized in Table 1. As seen in Table 1, the lowest and the highest average concentration of pH was detected in G1a-1 to 3 (5.07) and G1c (6.15), respectively. The lowest and the highest average concentration of DO was detected in G1a-1 to 3 (2.23 mg/L) and G2 (5.18 mg/L), respectively. The lowest and highest average concentration of COD and TP was detected in G2 (COD: 9.81 mg/L, TP: 1.64 mg/L) and G1a-1 to 3 (COD: 278 mg/L, TP: 11.1 mg/L), respectively. As a result, slightly high environmental burden compared to other areas was detected in G1a (G1a-1 to 3) in the industrial area, while ionic concentrations as well as WQI indicate relatively low anthropogenic influence in G2.

3.3. Relationship between NH4+, NO3, and DO due to Biological Reactions

Our research group focused on the differences in the behavior of NO3 and NH4+ compared to other ions. The concentration of NO3 is closely related to NH4+ in conjunction with DO concentration due to multiple biological reactions.
In this section, we discuss the influences of NO3 and NH4+ on DO because these parameters are closely related to the environment load. The relationship between NO3, NH4+, and DO is indicated in Figure 6. As shown in Figure 6, G1b-1 to 2, G1c-1, and G2-1 to 4 were under oxygenated conditions (>4 and ≤6 mg/L) while other sampling points were under low oxygen conditions (>2 and ≤4 mg/L) [21].
Under oxygenated conditions, aerobic oxidation of organic nitrogen and phosphorus compounds due to microorganisms (Equation (1)) and nitrification caused by nitrifying bacteria (Equation (2)) are facilitated [22,23,24]. Thus, organic nitrogen and phosphorus compounds were decomposed to NH3, which dissolved to form NH4+ in the water phase. DO was converted to bicarbonate ions. Furthermore, nitrification resulted in the oxidation of NH4+ to NO3, and conversion of HCO3 to H2CO3 (H2O + CO2).
In the case of the Galing River, aerobic biological reactions (Equations (1) and (2)) were suggested in G2-1 and G2-2, where higher NO3 concentration (2.86 to 4.86 mg/L) were detected compared to NH4+ (0.00 mg/L) under oxygenated conditions (6.11 and 4.67 mg/L).
(CH2O)106(NH3)16H3PO4 + 14H2O → 39CO2 + 14HCO3 + 53CH4 + 16NH4+ + HPO42−
NH4+ + 1.83O2 + 1.98HCO3 → 0.0210C5H7NO2 + 0.979NO3 + 1.04H2O + 1.88H2CO3
However, decomposition of organic nitrogen compounds due to microorganisms (Equation (3)) and denitrification by denitrifying bacteria (Equation (4)) were expected under low oxygen conditions [25,26,27]. The organic compounds in the river water were decomposed to NH4+ and NO3 was reduced through denitrification. Therefore, simultaneous NH4+ formation and NO3 reduction occurred under low oxygen conditions.
These anaerobic biological reactions (Equations (3) and (4)) probably occurred in G1a-1 to 6 and G1c-2 to 4 where higher concentration of NH4+ (5.58 to 27.9 mg/L) were detected compared to NO3 (0.00 to 0.352 mg/L) under low oxygen conditions.
(CH2O)106(NH3)16H3PO4 +14H2O → 39CO2 + 14HCO3 + 53CH4 + 16NH4 + + HPO42−
NO3 + 1.08CH3OH + 0.24H2CO3 → 0.056C5H7O2N + 0.47N2↑+ 1.68H2O + HCO3
However, concentration of NH4+ (1.06 to 6.48 mg/L) was higher than NO3 (0.340 to 0.504 mg/L) in G1b-1, G1b-2, G1c-1, G2-3, and G2-4, despite oxygenated conditions. This result is poorly understood, although the influence of wastewater containing high NH4+ levels, such as incomplete or untreated raw sewage water has been suggested.
As a consequence, all sampling points in the western side of the Galing River (G1) except G1b-1, 2, and G1c-1 were under anaerobic conditions (DO: 1.90 to 3.87 mg/L) and higher NH4+ concentration was detected compared to NO3. However, the eastern side of the river (G2) was under aerobic conditions and aerobic biological reactions were dominant at least in sampling points G2-1 and G2-2. From the above results, we inferred that the western side of the Galing River (G1) was more affected by human activity, such as household or industrial wastewater influx, compared to the eastern side.

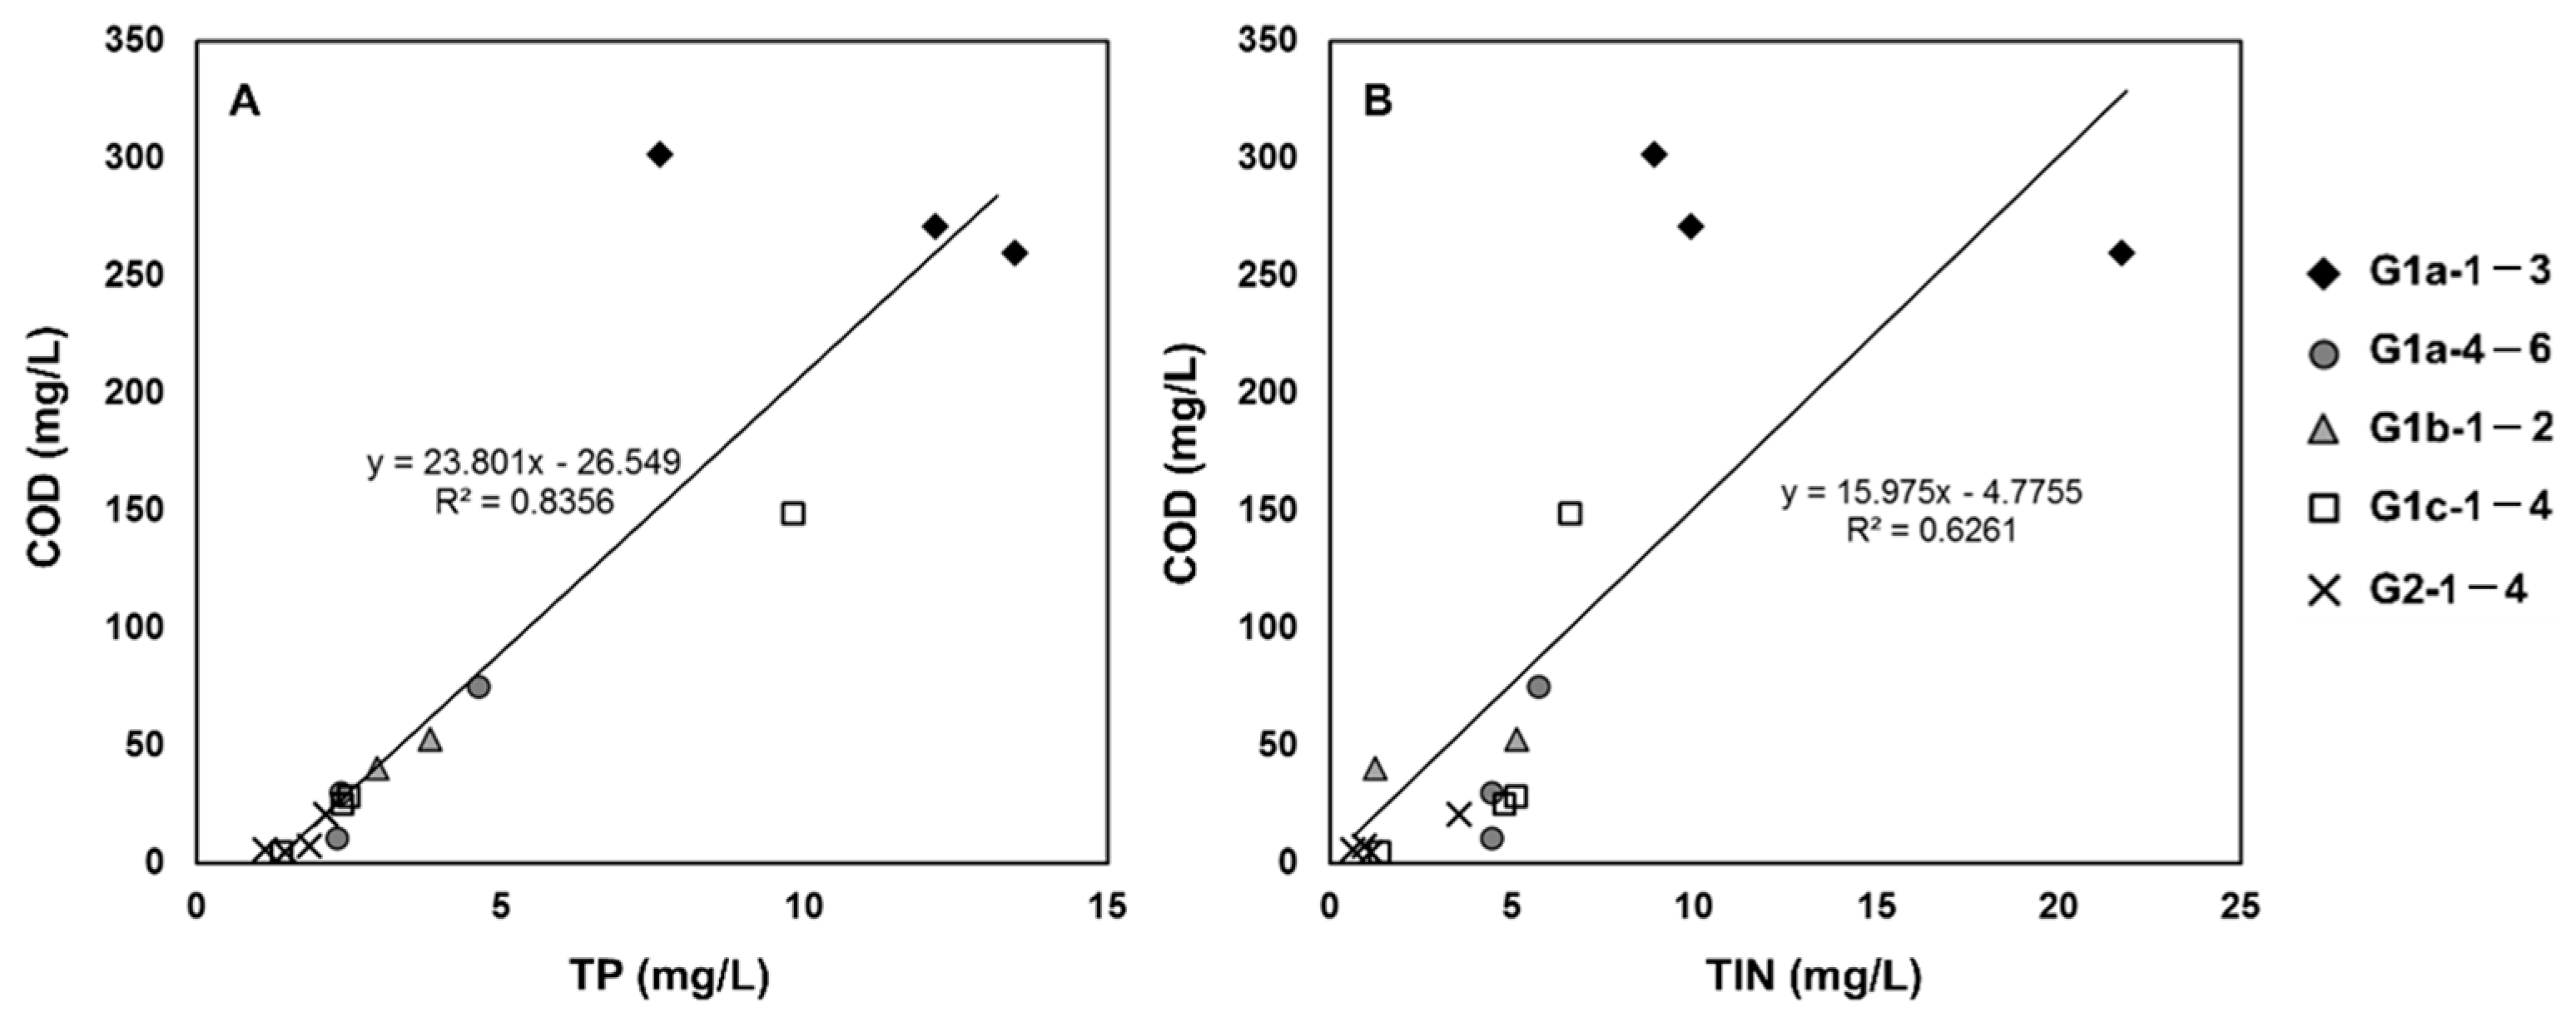
3.4. Comparison of the Correlation between COD and TP or Total inorganic nitrogen in the Galing River

Our research group focused on the differences in the correlation between COD and TP or TIN (Total inorganic nitrogen: NH4+–N and NO3–N). In this section, we discuss the relationship between change in COD with variation in TP and TIN, because these parameters are inextricably associated with different types of anthropogenic environment loads.
From the obtained data, a positive correlation between COD and TP or TIN was observed. A higher correlation was obtained between COD and TP (COD/TP: R2 = 0.8356) compared to TIN (COD/TIN: R2 = 0.6261), as shown in Figure 7, and can be attributed to two reasons. In Kuantan, there are 228 sewerage treatment plants, many of which were built in the early 1970s, of which individual septic tanks (ISTs) treat 51%, centralized sewer systems treat 47%, and individual primitive systems treat the remaining 2% of sewage/household wastewater [28]. However, ISTs are not highly efficient in removing nutrients and organic compounds with removal capacities of 5%–18% [29] and 50%–78%, [30] respectively. Therefore, higher COD/TP correlation could be due to wastewater containing incomplete or untreated raw sewage water. Secondly, NO3–N in TIN was reduced to N2 gas through denitrification by denitrifying bacteria. In contrast, organic and inorganic phosphorus were not reduced to gas by biological reactions [22,23,24,25,26,27].
Thus, we inferred that TP was strongly related to COD, and TP was likely to have been of organic compound origin. While the correlation between COD and TIN was lower than COD and TP, the behavior of TIN was affected by several biological reactions and an influx of incomplete or untreated raw sewage water or other wastewater including ionic inorganic nitrogen.

3.5. Water Quality Classification Using Natural Water Quality Standards for Malaysia

We compared and evaluated several areas of Kuantan based on the water quality data and water quality class as described in the NWQS for Malaysia (Table 2) to assess the load on each area and suggest suitable water treatment methods [12]. The NWQS for Malaysia is applied to surface waters and establishes standard values for 72 parameters in six water use classes. In the case of Class I, the natural environment is conserved, no treatments are required for water supply, and the water is available for very sensitive aquatic species. In the case of Class II, conventional treatment is required for water supply and the water is available for sensitive aquatic species, recreational use, and body contact. In the case of Class III, extensive treatment is required for water supply and the water is available for common use, tolerant species, species of economic value, and livestock drinking. Class IV water is used for irrigation and Class V has the lowest water quality compared to the above classes. Water quality classifications for the sampling points are indicated in Table 3.
Firstly, all area classifications of NH4+–N in the western side of the river (G1) were class IV or V while the eastern side were class I to III, except for G2-4, which recorded class V. These results indicate that the eastern side of the Galing River maintained relatively high water quality compared to the western side and downstream area of the river. Similarly, all classifications for COD and DO in the western side of the river (G1) were class III to V, except for G1a-6 (class II) and G1c-1 (class I), and class III to IV except for G1b-2 (class II), respectively. However, classifications for COD and DO in the eastern side of the river were I to II or II to III, respectively. The above three parameters are strongly related, as described by Equations (3) and (4). Therefore, DO classification was derived from COD classification due to higher consumption of the DO during the degradation of organic compounds, when NH4+ was generated. From the above results, we infer that the environmental load on the western side of the Galing River was heavier compared to the eastern side due to the higher organic content in the household and/or industrial wastewater and the direct inflow of untreated raw sewage wastewater containing ammoniacal nitrogen.
Secondly, all area classifications of pH in the western and eastern sides of the river, except for G1a-1, were class II to III/IV. However, pH in the sampling point G1a-1 was class V (pH = 4.47) and was near-class V level in G1a-2 (pH = 5.08). These areas (G1a-1 and G1a-2) are on the western side of the industrial area and some effect of industrial wastewater in decreasing the pH is suggested.
Thus, based on the available data, we inferred that the western side of the Galing River was more affected by human activity and belonged to a lower class in terms of ammoniacal nitrogen, COD, and DO, compared to the eastern side. Furthermore, class V or near class V pH values were obtained upstream on the western side of the river (G1a-1 and G1a-2) in the industrial area. As a result, two types of environmental burden were expected in the western side of the Galing River, namely, inflow of industrial wastewater upstream and effect of household wastewater or untreated raw sewage wastewater.

4. Conclusions

In this study, our research group monitored water quality in all parts of the Galing River using IEC/CEC for ionic concentrations and several sensor methods for water quality indexes. As a result, we have demonstrated the following:
(1)
From the obtained concentration of Cl and Na+, relatively low environmental burden and anthropogenic influence was detected in G2 compared to the rest of the Galing River basin area.
(2)
In terms of ammoniacal nitrogen, COD, and DO, the western side of the Galing River was affected by higher human activity such as an influx of industrial, household, and untreated raw sewage wastewater, and registered lower class levels compared to the eastern side.
(3)
Class V or near class V pH values were obtained upstream on the western side of the Galing River (G1a-1 and G1a-2) in the industrial area.
(4)
From the results of (2) and (3), two types of environmental burden were expected in the western side of the Galing River due to the effect of industrial wastewater upstream, and household wastewater or untreated raw sewage in the wastewater.
Future research should monitor normal parameters as well as heavy metal species in industrial, raw sewage, and household wastewaters discharged from all parts of the Galing River basin area to understand the role of the source on water quality. Evaluation of the water quality data with a detailed data set pertaining to Kuantan city (industry type, population of each lot, etc.) should be investigated. In addition, construction of a new water treatment facility, sewage system, and a detailed inspection of industrial wastewater in the western side of the Galing River basin area are absolutely imperative. Renovation of the water quality conservation system and improvement of water quality from Class IV/V (e.g., irrigation or only drainage) to Class II (e.g., recreation usage) is also suggested.

Supplementary Materials

The following are available online at www.mdpi.com/2076-3298/4/2/35/s1, Figure S1: Average monthly precipitation from 2000 to 2012 in Kuantan, Malaysia, Figure S2: Behaviors of ionic species, DO, and pH in 2015, Figure S3: Comparison of the values of ionic concentrations, DO, and pH over three years in May 2014, May 2015, and March 2016, Table S1: Average values of ionic species, DO, and pH in different tributary streams of the Galing River in 2015, Table S2: Water quality classification of different tributary streams of the Galing River in 2015, Table S3: Average values of ionic species, DO, and pH in different tributary streams of the Galing River in May 2014, May 2015, and March 2016, Table S4: Water quality classification of different tributary streams of the Galing River in May 2014, May 2015, and March 2016.

Acknowledgments

This study was supported by the internal fund of the Universiti Malaysia Pahang (RDU 1303126 and RDU 150326). In addition, we appreciate the assistance of Kumutharani A/P Annamalai, Sarmila Nagappan, Nurul Syazwani binti Alias, Aini Syazana binti Derahman, and Kee Seng Pu at the Faculty of Industrial Sciences & Technology, Universiti Malaysia Pahang, for their help with field research.

Author Contributions

Daisuke Kozaki, Norhasmira Idayu binti Harun, and Mohd Hasbi bin Ab. Rahim performed sample analysis, data evaluation, and manuscript drafting, with contributions from Mashitah binti Mohd Yusoff, Masanobu Mori, Nobutake Nakatani, and Kazuhiko Tanaka. Water sample collection was conducted by Daisuke Kozaki and Norhasmira Idayu binti Harun supported by Mohd Hasbi bin Ab. Rahim. Daisuke Kozaki was the head of the water quality monitoring section of this project. All authors have read and approved the final manuscript.

Conflicts of Interest

The authors declare no conflict of interest.

Abbreviations

The following abbreviations were used in this manuscript:
IEC/CECIon-exclusion/ion-exchange chromatography
DODissolved Oxygen
CODChemical Oxygen Demand
TPTotal Phosphorus
WQIWater Quality Index
TINTotal Inorganic Nitrogen
ORPOxidation-Reduction Potential

References

  1. Baird, C.; Cann, M. Environmental Chemistry, 3rd ed.; W.H. Freeman Publishers: New York, NY, USA, 2012; pp. 407–454. [Google Scholar]
  2. Brebbia, C.A.; Anagnostopoulos, P. Water Pollution: Modelling, Measuring and Prediction; WIT Press: Southampton, UK, 1991; pp. 155–221. [Google Scholar]
  3. Aiken, S.R.; Leinbach, T.R.; Moss, M.R. Development and Environment in Peninsular Malaysia; McGraw-Hill International Book Company: New York, NY, USA, 1982. [Google Scholar]
  4. Hashim, N.M.; Rainis, R. Urban Ecosystem Studies in Malaysia; Universal-Publishers: Boca Raton, FL, USA, 2003; pp. 77–104. [Google Scholar]
  5. Rosnani, I. River water quality status in Malaysia. In Proceedings of the National Conference on Sustainable River Basin Management in Malaysia, Putrajaya, Malaysia, 13–14 November 2001. [Google Scholar]
  6. Institut Latihan Statistik Malaysia (ILSM). Ringkasan Perangkaan Penting Bagi Kawasan Pihak Berkuasa Tempatan, Malaysia. 2010; Institut Latihan Statistik Malaysia: Sungkai, Malaysia, 2010. [Google Scholar]
  7. JPBD (Jabatan Perancangan Bandar Dan Desa) Pahang Town and Country Planning Department. Kuantan 2015; Pahang Town and Country Planning Department: Kuantan, Malaysia, 2015.
  8. Nasir, M.F.M.; Zali, M.A.; Juahir, H. Application of receptor models on water quality data in source apportionment in Kuantan river basin. Iran. J. Environ. Health Sci. Eng. 2012, 9, 18–29. [Google Scholar] [CrossRef] [PubMed]
  9. Sobahan, M.A.; Mil, S.I.; Karim, M.A. Status and contamination level of the wastewater of Gebeng industrial estate, Pahang, Malaysia. Bangladesh J. Bot. 2015, 44, 103–110. [Google Scholar] [CrossRef]
  10. Hossain, M.A.; Ali, N.M.; Islam, M.S. Spatial distribution and source apportionment of heavy metals in soils of Gebeng industrial city, Malaysia. Environ. Earth Sci. 2015, 73, 115–126. [Google Scholar] [CrossRef]
  11. Kozaki, D.; Ab. Rahim, M.H.B.; Wan Ishak, W.M.F.B.; Yusoff, M.M.; Mori, M.; Nakatani, N.; Tanaka, K. Assessment of the River Water Pollution Levels in Kuantan, Malaysia, Using Ion-Exclusion Chromatographic Data, Water Quality Indices, and Land Usage Patterns. Air Soil Water Res. 2016, 9, 1–11. [Google Scholar] [CrossRef]
  12. Department of Environment, Ministry of Natural Resources and Environment Malaysia. Malaysian Environmental Quality Report 2006 Water Quality Index Classification; Department of Environment Malaysia: Putrajaya, Malaysia, 2006.
  13. Japan Meteorological Agency. Locational Data Graphs (The World Weather Data Tool). Available online: http://www.data.jma.go.jp/gmd/cpd/monitor/climatview/graph_mkhtml.php?&n=48657&p=999&s=1&r=1&y=2016&m=12&e=0&k=0 (accessed on 30 March 2017).
  14. Japanese Standards Association. JIS K0094 Sampling Methods for Industrial Water and Industrial Wastewater; Japanese Standards Association: Tokyo, Japan, 1994. [Google Scholar]
  15. United States Environmental Protection Agency. Federal Register: Ranges 3 to 150 mg/L COD and 20 to 1500 mg/L COD for Wastewater Analyses (Standard Method 5220 D); United States Environmental Protection Agency: Washington, DC, USA, 1980.
  16. Standard Methods for the Examination of Water and Wastewater (Standard Methods). 4500-P Phosphorus: C. Vanadomolybdophosphoric Acid Colorimetric Method. American Public Health Association; American Water Works Association and Water Environment Federation: Washington, DC, USA, 1999.
  17. Mason, B.; Moore, C.B. Principles of Geochemistry; John Wiley: New York, NY, USA, 1982. [Google Scholar]
  18. Ministry of Land, Infrastructure, Transport and Tourism. “Calcium: Ca” and “Magnecium: Mg. Available online: http://www1.river.go.jp/100308.html (accessed on 5 January 2017). (In Japanese)
  19. Nikanorov, A.M.; Brazhnikova, L.V. Chapter 3: Water chemical composition of rivers, lakes and wetlands. In Types and Properties of Waters—Encyclopedia of Life Support Systems; Khublaryan, M.G., Ed.; Eolss Publishers: Oxford, UK, 2009; Volume 2, pp. 42–79. [Google Scholar]
  20. Ibanes, J.G. Chapter 6: The chemistry of processes in the hydrosphere. In Environmental Chemistry: Fundamentals; Ibanes, J.G., Ed.; Springer: New York, NY, USA, 2007; Volume 2, pp. 96–117. [Google Scholar]
  21. Government of Western Australia. Water Quality and Ecological Health—Low Oxygen Conditions. Available online: https://www.dpaw.wa.gov.au/management/swan-canning-riverpark/ecosystem-health-and-management/372-water-quality-and-ecological-health?showall=&start=3 (accessed on 5 January 2017).
  22. Pena, M.A.; Katsev, S.; Oguz, T.; Gilbert, D. Modeling dissolved oxygen dynamics and hypoxia. Biogeosciences 2010, 7, 933–957. [Google Scholar] [CrossRef]
  23. Hall, E.R.; Murphy, K.L. Estimation of nitrifying biomass and kinetics in wastewater. Water Res. 1980, 14, 297–304. [Google Scholar] [CrossRef]
  24. Tanaka, K. Determination of bicarbonate ion in biological nitrification process water by ion-exclusion chromatography with coulometric detection. Bunseki Kagaku 1981, 30, 358–362. (In Japanese) [Google Scholar] [CrossRef]
  25. Martin, R.E.; Taphonomy, A. Process Approach; Cambridge University Press: Cambridge, MA, USA, 1999. [Google Scholar]
  26. Knowles, R. Denitrification. Microbiol. Rev. 1982, 46, 43–70. [Google Scholar] [PubMed]
  27. Hamlin, H.J.; Michaels, J.T.; Beaulaton, C.M.; Graham, W.F.; Dutt, W.; Steinbach, P.; Losordo, T.M.; Schrader, K.K.; Main, K.L. Comparing denitrification rates and carbon sources in commercial scale upflow denitrification biological filters in aquaculture. Aquac. Eng. 2008, 38, 79–92. [Google Scholar] [CrossRef]
  28. Asian Urban Information Center of Kobe. City Report and Action Plan of Kuantan. Asian Urban Information Center of Kobe. Available online: http://www.kicc.jp/auick/database/apc/apc049/apc04902_05.html (accessed on 5 January 2017).
  29. Reay, W.G. Septic tank impacts on ground water quality and nearshore sediment nutrient flux. Ground Water 2004, 42, 1079–1089. [Google Scholar] [CrossRef]
  30. Canter, L.W.; Knox, R.C. Septic Tank System Effects on Ground Water Quality; CRC Press: Boca Raton, FL, USA, 1985. [Google Scholar]
Figure 1. Map of sampling locations and land use pattern in Kuantan city. Note: This figure was constructed based on the data obtained from the Pahang Town and Country Planning Department (JPBD: Jabatan Perancangan Bandar Dan Desa) Pahang Town and Country Planning Department [7].
Environments 04 00035 g001
Figure 2. Comparison of ion concentration ratios of Galing River water samples collected upstream ((A) Average ionic concentration ratio of G1a-1 to 6, (B) G1b-1 to 2, (C) G1c-1 to 4 (D) G2-1 to 4) and downstream ((E) Average ionic concentration ratio of G1a-7 to 8, (F) G2-5) and sea water ((G) sea water [19]).
Environments 04 00035 g002
Figure 3. Changes in ionic concentrations: (A) SO42; (B) Cl; (C) NO3; (D) Na+; (E) NH4+; (F) K+; (G) Mg2+; and (H) Ca2+ in the Galing River.
Environments 04 00035 g003
Figure 4. Relationship between concentrations of Cl and Na+ at sampling points along the Galing River.
Environments 04 00035 g004
Figure 5. Changes in water quality indexes: (A) pH; (B) DO: Dissolved oxygen; (C) COD: Chemical oxygen demand; and (D) TP: Total phosphorus in the Galing River.
Environments 04 00035 g005
Figure 6. Relationship between NO3, NH4+, and DO (dissolved oxygen) concentration in the Galing River.
Environments 04 00035 g006
Figure 7. Relationship between COD (chemical oxygen demand), TP (total phosphorus), and TIN (Total inorganic nitrogen) concentrations in the Galing River.
Environments 04 00035 g007
Table 1. Average value of ionic species and water quality indexes (WQIs) in different areas of Kuantan.
CaptionIonic Species (mg/L)DO (mg/L)COD (mg/L)TP (mg/L)pH
SO42ClNO3NaNH4+K+Mg2+Ca2+
G1a-1–3 (Industrial area)3.1838.20.1228.217.412.83.2219.22.2327811.15.07
G1a-4–6 (Housing area)11.521.40.3417.26.145.371.8611.63.0739.03.106.10
G1b (Industrial area)13.914.80.3512.94.004.481.7511.25.0146.73.406.07
G1c (Housing area)17.718.20.3516.95.644.981.459.802.7451.94.026.15
G2 (Housing area)12.313.32.1410.61.373.811.4810.95.189.811.646.04
DO: Dissolved oxygen; COD: Chemical oxygen demand; TP: Total phosphorus.
Table 2. Natural water quality standards in Malaysia [12].
ParameterClass *
IIIIIIIVV
NH4+–N (mg/L)<0.10.1–0.30.3–0.90.9–2.7>2.7
COD (mg/L)<1010–2525–5050–100>100
DO (mg/L)>75–73–5<3<1
pH6.5–8.56–95–95–9
* Class I: Conservation of natural environment. Water Supply I—practically no treatment necessary. Fishery I—very sensitive aquatic species. Class II: Water Supply II—Conventional treatment. Fishery II—Sensitive aquatic species. Recreational use—body contact. Class III: Water Supply III—Extensive treatment required. Fishery III—Common of economic value and tolerant species, livestock drinking. Class IV: Irrigation. Class V: None of the above.
Table 3. Water quality classification of sampling points in the Galing River.
Sampling PointParameter
NH4+–N (mg/L)COD (mg/L)DO (mg/L)pH
G1a-1VVIVV
G1a-2VVIVIII–IV
G1a-3VVIVIII–IV
G1a-4VIVIVII
G1a-5VIIIIVII
G1a-6VIIIIIII
G1b-1IVIIIIIIIII–IV
G1b-2VIVIIII
G1c-1IVIIIIIII–IV
G1c-2VIIIIVII
G1c-3VIIIIVII
G1c-4VVIVII
G2-1IIIIIII
G2-2IIIIIII–IV
G2-3IIIIIIIII
G2-4VIIIIII
* Class I: Conservation of natural environment. Water Supply I—practically no treatment necessary. Fishery I—very sensitive aquatic species. Class II: Water Supply II—Conventional treatment. Fishery II—Sensitive aquatic species. Recreational use—body contact. Class III: Water Supply III—Extensive treatment required. Fishery III—Common of economic value and tolerant species, livestock drinking. Class IV: Irrigation. Class V: None of the above.

