A Methodology of Health Effects Estimation from Air Pollution in Large Asian Cities

1
Global Networking and Public Relations, Japan Automobile Research Institute, 1-1-30, Shibadaimon, Minato-ku, Tokyo 105-0012, Japan
2
Central Research Institute of Electric Power Industry, 1646 Abiko, Abiko-shi, Chiba-ken 270-1194, Japan
3
Bureau of Construction, Tokyo Metropolitan Government, 2-8-1 Nishi Shinjuku, Shinjuku-ku, Tokyo 163-8001, Japan
4
The Institute of of Science and Engineering, Chuo University, 1-13-27 Kasuga, Bunkyo-ku, Tokyo 112-8551, Japan
*
Author to whom correspondence should be addressed.
Environments 2017, 4(3), 60; https://doi.org/10.3390/environments4030060
Submission received: 29 June 2017
/
Revised: 15 August 2017
/
Accepted: 18 August 2017
/
Published: 7 September 2017
(This article belongs to the Special Issue Human Exposure to Environmental Contaminants)
Abstract
:The increase of health effects caused by air pollution seems to be a growing concern in Asian cities with increasing motorization. This paper discusses methods of estimating the health effects of air pollution in large Asian cities. Due to the absence of statistical data in Asia, this paper carefully chooses the methodology using data of the Japanese compensation system. A basic idea of health effects will be captured from simple indicators, such as population and air quality, in a correlation model. This correlation model enables more estimation results of respiratory mortality caused by air pollution to be yielded than by using the relative model. The correlation model could be an alternative method to estimate mortality besides the relative risk model since the results of the correlation model are comparable with those of the relative model by city and by time series. The classification of respiratory diseases is not known from the statistical yearbooks in many countries. Estimation results could support policy decision-making with respect to public health in a cost-effective way.
1. Research Purpose
Mortality is probably the earliest health outcome to be investigated. In one of the first long-term exposure studies on air pollution—an analysis of large towns in England—researchers observed a strong correlation between smoke emissions and death caused by bronchitis [1,2]. This research is an attempt to use a very unique track record from the Pollution-related Health Damage Compensation and Prevention System (herein referred to as the compensation system) in Japan.
The issue of relative risk estimation is its procedure and the coefficients, due to a limited quantity of statistical data on deaths by cause at the city level in Asian countries. The research below shows how to estimate death caused by air pollution. The earliest cohort study focusing on air pollution, an epidemiology study covering 14–16 years, compared the risk of death in a previous cohort study of over 8000 adults in six cities in the US by using “relative risk models”. Here is an example of relative risk. If people who smoke for a certain time are, on average, 15 times more likely to develop lung cancer than those who do not smoke. In this case, their relative risk is 15. After adjustment for smoking and other risk factors, the mortality rate in the most polluted city was higher than in the least polluted city [3]. The American Cancer Association (ACS) study in the US is the largest cohort study of long-term mortality caused by air pollution. The ACS study links data for approximately 500,000 adults with air pollution data. The results reveal that mortality of cardiopulmonary at 6% increases with each 10 µg/m3 elevation in fine particulate matter PM2.5 [4]. Particulate matter (PM) represents a mixture of organic and inorganic substances. It covers a wide range of diameters. PM2.5 is particulate matter with an aerodynamic diameter of <2.5 µm [5]. The Health Effect Institute (HEI) conducted a literature survey meta-analysis of short-term exposure. Epidemiologic research has provided estimates of the health effects from short-term exposure to air pollution in many Asian cities [6]. The World Health Organization (WHO) published estimated numbers of deaths caused by air pollution worldwide [7,8,9] based on the significant contributions from ACS study and Harvard six cities. Cohen et al. raised questions on the shape of the model and the applicability of the coefficients for other area [10]. Ostro describes a methodology how to apply for developing countries [9]. Vimercati et al. explained correlation between exposure of metals and biological monitoring data by controlling factors such as residential location, diet, lifestyle habits, etc., based on a questionnaire [11,12]. Nasari et al. examined shapes of estimation models between air pollution and mortality. They suggested a combined non-linear model by examining the results from US and Canada [13]. Anenberg et al. estimated PM2.5 related health impact using a relative risk model. They concluded that adaptation of the stringent vehicle emission standard Euro 6 would eliminate real-world diesel related NOx emissions, avoiding PM2.5 and ozone related premature deaths in 2040 [14].
This paper considers the methodology applied to health effect estimation caused by air pollution in large Asian cities using evidence of respiratory patients caused by air pollution from Japan. The estimated coefficient will be compared to the coefficient of the relative risk model in order to discuss the possibility of the application of the methodology in large Asian cities.
2. Relative Risk Model vs. Correlation Model
There are various causes of mortality due to respiratory disease. This section considers two models to determine the mortality rates of respiratory diseases caused by air pollution. Due to uncertainty in developing countries, alternative methods should be considered to yield mortality caused by air pollution in large cities.
Quantifying the magnitude of health effects from the compensation system in Japan, the mortality rate due to respiratory disease caused by air pollution is applied for two models: the relative risk model and the correlation model.
2.1. Relative Risk Model
According to the WHO, the relative risk is an indicator to show the strength of an association rather than risk difference because it indicates the relation to a magnitude of the baseline rates. The relative risk shows an assessment of the causal relationship. The concept of the relative risk represents a relative change in health effects between an affected group and a non-affected group. Equation (1) is a typical equation of the relative risk model [7,8,9]. Equation (1) means that relative risk can be specified as an exponential function by change of PM2.5 X from PM2.5 baseline X0 with a coefficient. Equation (2) is unfolded a log-linear function from Equation (1). A coefficient α of Equation (2) was obtained from Osaka data from 1974–1988 [15,16].
Equations (3) and (4), are processes to get the number of deaths caused by air pollution in large Asian cities. Equation (3) estimates an attributable fraction which qualifies the impact of exposure above a theoretical minimum level [10]. Equation (4) yields the number of deaths by respiratory disease caused by air pollution from the attributable fraction multiplied by the total number of mortality of respiratory disease.
- RR: Relative risk
- α: Coefficient of respiratory disease mortality of Osaka, 1974–1988;
- X: Current annual mean of PM2.5 (µg/m3) (converted from PM10);
- X0: Baseline of PM2.5 = 10 (Converted from the PM10 standard);
- M: A change of air quality from the baseline M = X – X0;
- TR: Total respiratory disease mortality numbers in a city (per 1000 population);
- E: Respiratory disease mortality numbers caused by air pollution in a city (per 1000 population);
- AF: Attributable fraction (the ratio of respiratory disease mortality caused by air pollution).
2.2. Correlation Model
This research proposes a simple linear regression model to estimate death caused by air pollution for the following three reasons. First, a reliable track record of the compensation system yields statistically significant results with a linear model in the case of Japan. Second, the procedure of estimation by the correlation model is simpler than that of the relative risk model. The relative model requires estimating the respiratory/cardiovascular disease group including causes of air pollution and others (tobaccos etc.) from the population. The number of deaths caused by air pollution is estimated directly from population and air quality in the correlation model. Third, the correlation model can estimate more results than the relative risk model. Air pollution data is more available than that of the number of deaths caused by disease, in general [17,18,19].
The other method for determining mortality rates is to perform an estimation from a linear model of derived respiratory mortality. Applying many trial estimations, we thought that a linear model fits with a single factor better than a non-linear model with multiple explanatory factors. The pre-results indicate the possibility of an integrated model of “one fit for all”. The number of deceased patients is divided by the number of the population. The correlation between the change in PM2.5 from the baseline and the mortality per 1000 people is estimated. Equation (5) shows the direct correlation between the PM2.5 baseline X0 and the mortality of the same baseline, as in Equation (1) [17,18,19].
The coefficient of Equation (5) can be compared with that of Equation (2) from in Section 4 “Results”. Applying for dataset of Table 1 and the coefficients of Table 2, the number of deaths from the correlation model was compared to the number of deaths from the relative risk model in Figure 1, Figure 2 and Figure 3.
- Y: The number of deaths in the compensation system per 1000 population;
- β: The coefficient of respiratory disease mortality.
3. Methodology of Data Verification
3.1. Health Effect Data—TR, E
This section describes data treatment on respiratory disease mortality. Respiratory disease mortality numbers caused by air pollution in a city (E, in Equation (4)) data was extracted from the compensation system. The data of the health effects caused by air pollution was available from the Pollution-related Health Damage Compensation Law (herein referred to as the compensation law). The compensation law was enacted in 1973 to provide prompt and fair compensation for victims. The law determined designated areas where health damage has occurred by air pollution. It certifies patients who were affected by the four pollution-related respiratory and circulatory diseases (pulmonary emphysema, asthmatic bronchitis, bronchial asthma, and chronic bronchitis). If patients with these four diseases in the certified areas satisfied certain other conditions (such as extended residence in the certified area, non-smoker status, or illness established by a medical doctor), they were considered as certified patients. Welfare services were provided to facilitate the recovery by the compensation system from June 1974 in accordance with the compensation law. Local governments of the designated area published the total number of certified patients, mortality, recovered and newly-registered in an environmental white paper every year. We confirmed that the data of the compensation system is consistent by simple calculations.
Quantifying the magnitude of the impact of air pollution, Osaka data was selected for comparison because the whole of Osaka city was covered as a designated area while other certified areas did not cover the whole administrative district. The coefficients of Osaka city were applied for estimation of deaths caused by air pollution in large Asian cities. Since the amendment of the compensation system came into effect in 1988, the portion for the time span from 1974 to 1988 should be valid for the relative risk analysis because the system did not accept new registrations after 1988.
Mortality rates due to respiratory diseases between vital statistics of Japan and the compensation system were compared in order to determine the portion of deaths caused by air pollution because WHO and the vital statistics data above include not only disease caused by air pollution but also disease from other causes, such as tobacco. Below are common methods of how to treat data appropriately in the models.
Respiratory disease mortality numbers (TR in Equation (4)) data was extracted from the vital statistics of Japan at the city level. The total number of respiratory diseases included bronchitis, chronic obstructive pulmonary disease (COPD), pulmonary emphysema, and asthma, except for acute bronchitis in the vital statistics. They were comparable to the number of mortality cases in the compensation system. The total number of deaths due to respiratory disease in the vital statistics was lower than the number of deaths recorded in the compensation system. Some of the certified patients may pass away due to causes other than the certified respiratory diseases (bronchitis, COPD, pulmonary emphysema, and asthma).
First, we verified if categories are identical throughout the WHO [20] and vital statistics in Japan [21,22]. The data on Japan’s vital statistics is categorized and reported to the WHO statistics according to ICD-10. The WHO follows the definition of the International Statistical Classification of Diseases (ICD). In 1995, ICD was updated from ICD-9 to ICD-10 in Japan. Along with the change, the rule concerning the death certificate for deceased persons was revised. Before 1995, “heart failure” was one of the main causes of death. Since 1995, a description of the direct cause of heart failure is required on the death certificate. COPD mortality rises from 1665 in ICD-9 to 1669 in ICD-10. The change of ICD affects the increase of COPD by 1.9% with respect to 2006 data. Regarding data of respiratory diseases in Asia, most of the countries follow ICD-10 at present. The implementation year of ICD-10 varies from 1995 to 2012. ICD categories of respiratory disease are J00–J99.
3.2. Air Pollutant X and X0
Historically speaking, the relationship between NO2 and health effects has been a representative indicator for the evaluation of health effects in Japan. However, Particulate matter (PM) values were applied for Equations (2) and (5) because many of the most recent studies on health effects caused by air pollution are with regard to PM. For air quality data, the annual averages were collected from white papers of Osaka city to estimate the coefficients from Equations (2) and (5). However, Suspended Particulate Matter (SPM) is widely monitored in Japan. The definition of SPM is considered particulates with aerodynamic ranging from below 0.01 µm to 100 µm in Europe and US. On the other hand, the definition of SPM is approximately PM7 in Japan. According to reports of Ministry of Environment of Japan, SPM was converted into PM10 (particulate matter with an aerodynamic diameter of <10 µm) by multiplying 1.07 from a Japanese monitoring result in 1999. According to National Institute of Environmental Studies, the conversion factor was updated as 1.16 in 2012. We employed the conversion equation PM10 = SPM × 1.07 for the monitoring data of 1974–1988 [23].
According to a survey by Ostro [9], RR is estimated from PM2.5 rather than PM10. The value of PM10 can be converted to PM2.5 from available information. For many urban areas in developed countries, the PM2.5 level is 0.50–0.65 of the PM10 level. Evidence from China shows that levels of 0.51–0.72 [24] and 0.5 [9] can be assumed. For the estimation of Equation (2), this analysis assumes that PM2.5 is 0.5 of PM10.
The existing level of PM2.5 without man-made PM10 is assumed as 5–10 µg/m3 according to Ostro [9]. Theoretically, the baseline level means the minimum level of exposure. Some studies treat the baseline level as the threshold. A maximum value 10 µg/m3 for our estimation of mortality rates caused by air pollution in Bangkok was applied in our model.
The WHO refers to a target of avoidable death proposed by the European Unit Target Limit Value for 2010 of 20 µg/m3 PM10 (0.5 × 20 µg/m3 PM10 = 10 µg/m3). The baseline level X0 is assumed to be 10 µg/m3 for the estimation of Equations (2) and (5).
3.3. The Number of Results Expected from the Two Models
A total of 31 cities were selected as the analysis area (Table 1). These comprise mostly capital cities or cities where the dataset was available. The necessary data items for calculation are as follows: population, air quality PM2.5 (X; data converted from PM10/SPM) and cause of death for respiratory disease (TR; data from death statistics) [25,26,27,28,29,30,31,32,33,34,35,36,37,38,39,40,41,42,43,44,45,46,47,48,49,50,51,52,53,54,55,56,57,58,59,60,61,62,63,64,65,66,67,68,69,70,71]. The dataset was rated by three categories: three data items available (population/air quality/cause of death, at least 10 years), two data items available, and only one item of data availability. Bangkok, Beijing, Colombo, Hong Kong, Shanghai, and Singapore enabled a comparison of the results of the two models because of the availability of the three data items in the time series more than 10 years. A column "km2/ monitoring site" means areas covered by one monitoring site of air quality in order to assess representativeness of air quality data. Areas covered per monitoring site of air quality in Bangkok, Beijing, Hong Kong, Shanghai and Singapore are 143, 73, 100, 81 and 140 km2. Information of monitoring site in Colombo could not be found from related documents
4. Results
4.1. Overall Comparison
Table 2 represents the estimation results of the coefficient for Equation (2) of the relative model and (5) of the correlation model. The models yielded statistically significant results. In Table 1, coefficient of α is estimated from the data for Osaka from 1974 to 1988 in Equation (2). The coefficient α is estimated as 0.0291 for four pollution-related respiratory and circulatory diseases from long-term exposure of PM2.5. T value is 16.30. For reference, this is 3.25 times larger than the result of Pope et al. (0.0089) for cardiopulmonary mortality from long-term PM2.5 exposure [9]. The difference of estimation results may indicate different definitions of respiratory disease (WHO: J30–J99 [20], Japan: only four diseases, J40–J47) and other factors. β is estimated from the data for Osaka from 1974 to 1988 in Equation (5). The coefficient of correlation model is 0.0062. T value is 4.31. These coefficients are applied for the estimation of mortality caused by air pollution in large Asian cities.
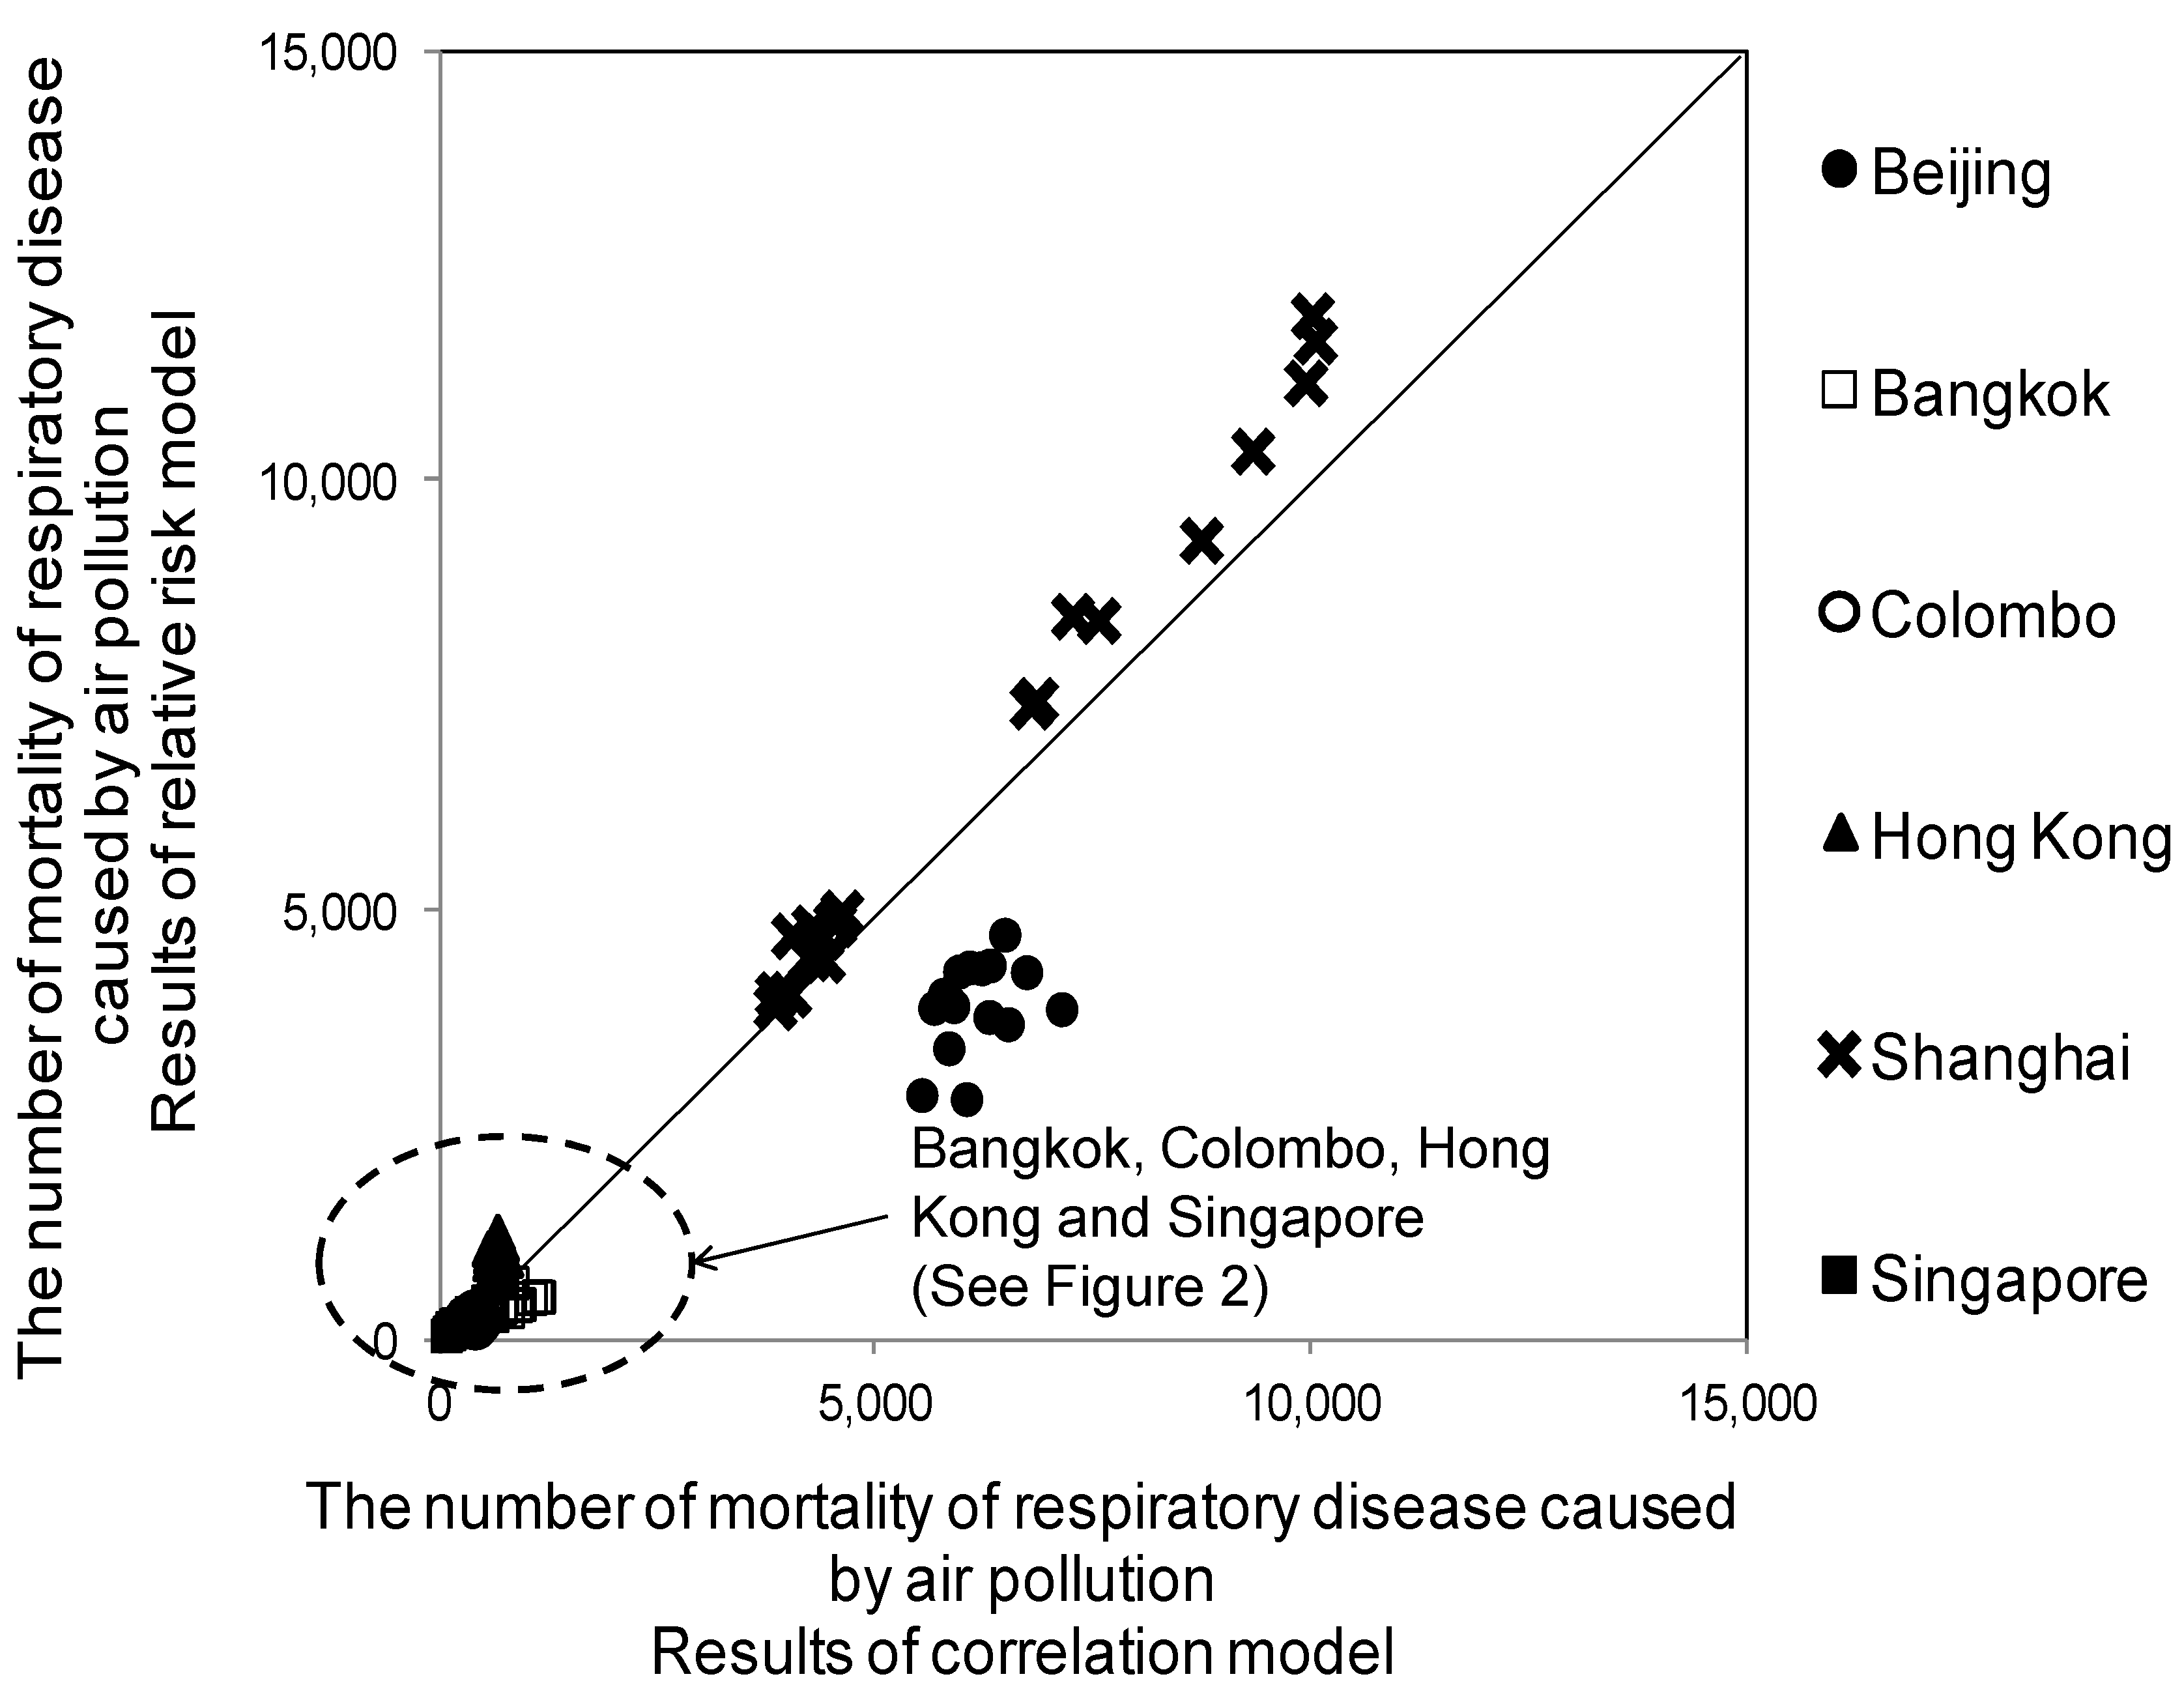
Figure 1 shows the result comparison from the relative risk model and the correlation model. A clustering around a line drawn line at a 45 degree angle indicates that the results of the correlation model are close to the results of the relative risk model. The results of Beijing, Bangkok, Colombo, Hong Kong, Shanghai, and Singapore from the two models were available. The values of Beijing seemed to be outliers. The values of Shanghai were relatively higher than the others in Figure 1. Figure 2 shows the results of Colombo, Hong Kong, Singapore, and Bangkok.
4.2. Comparison by City and by Time Series
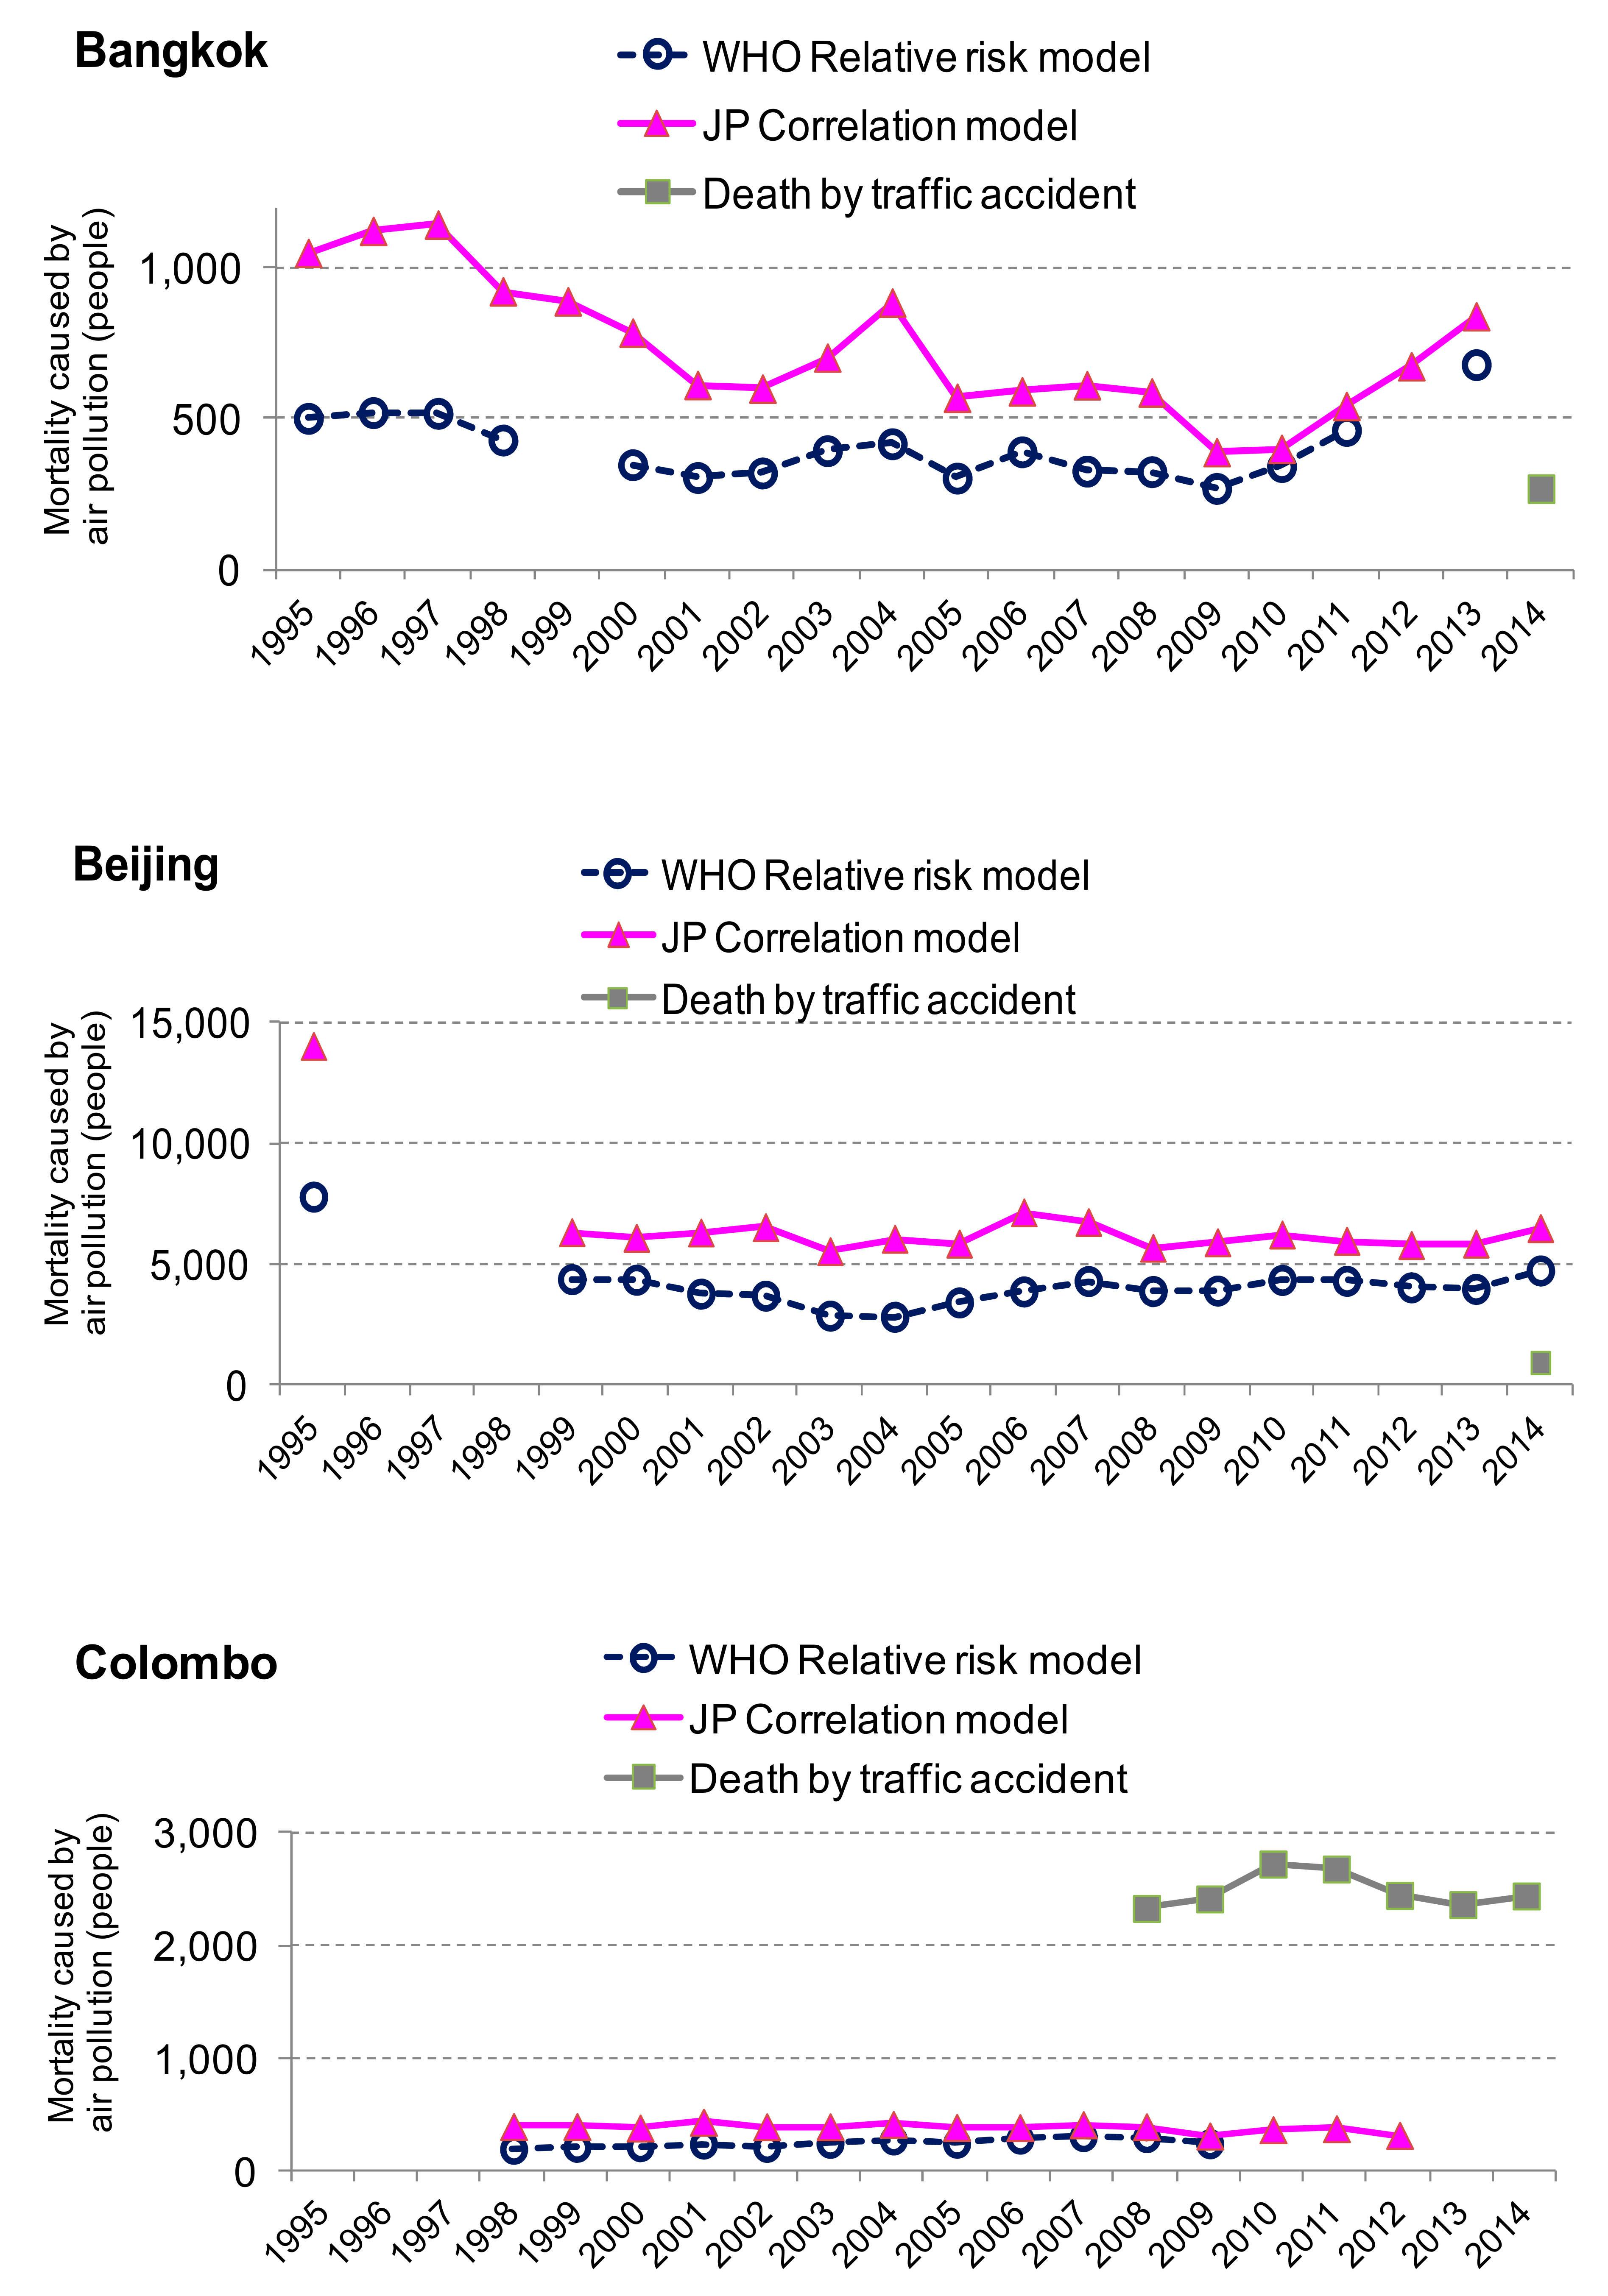
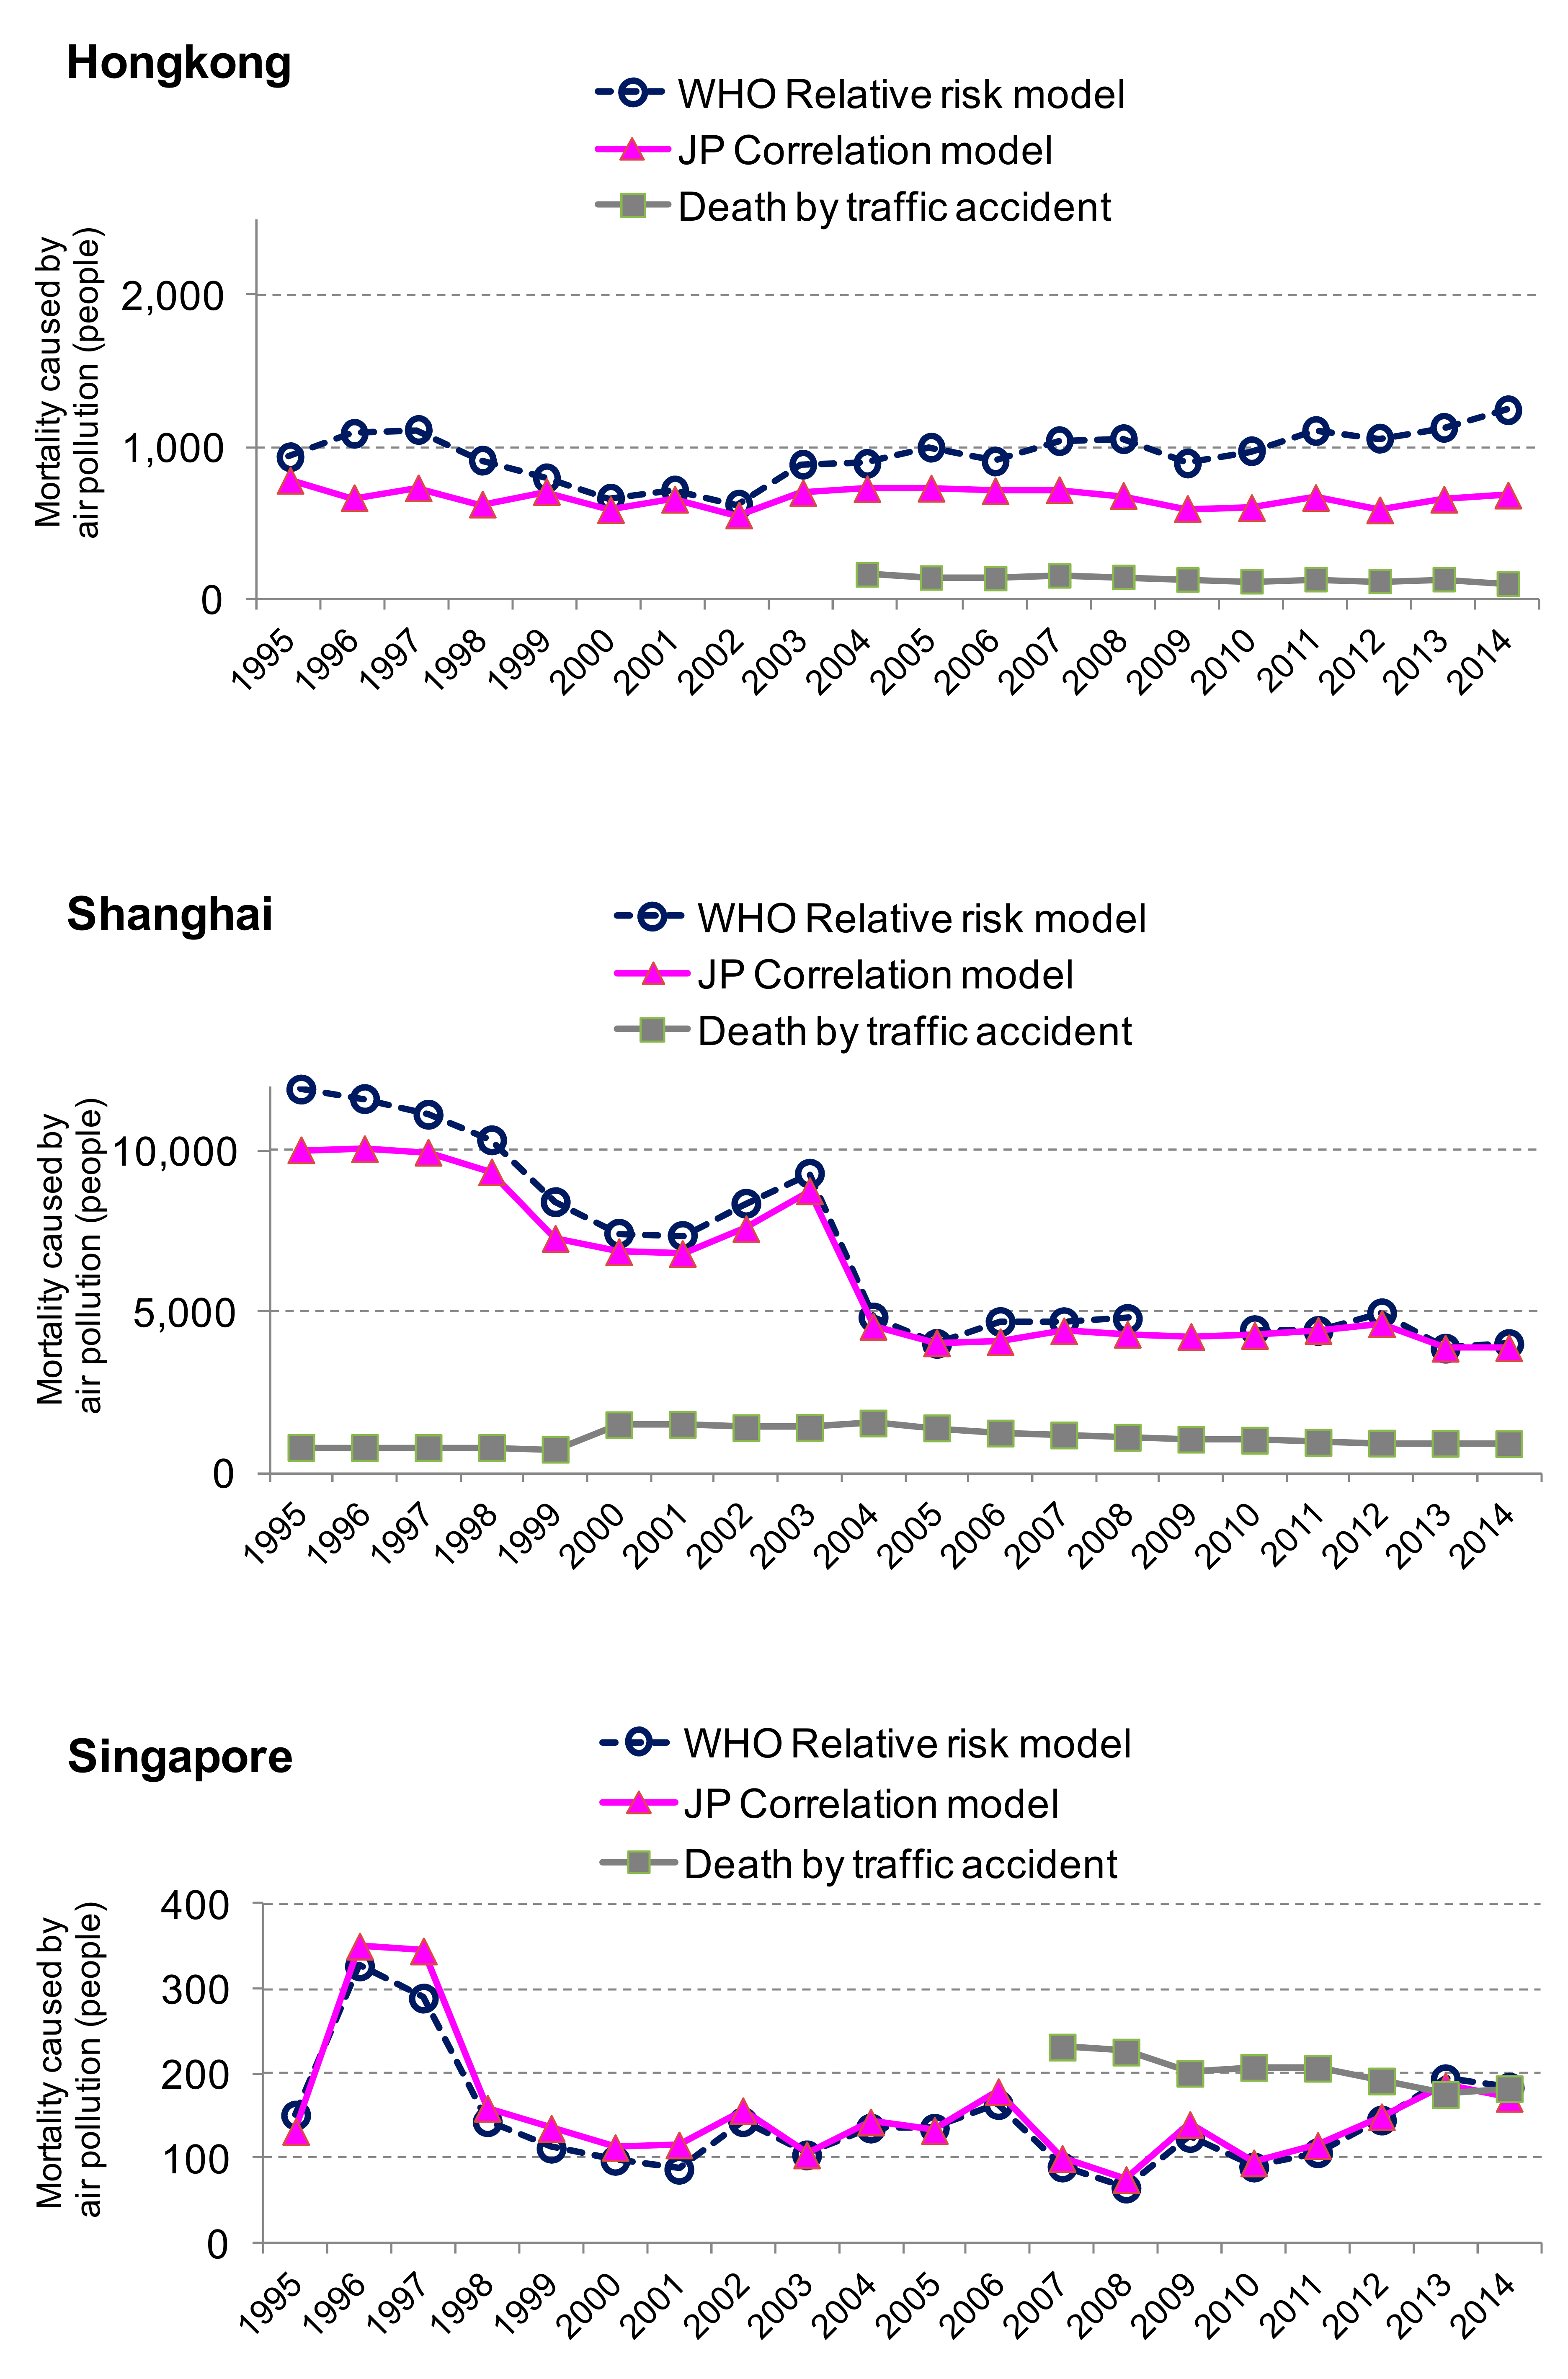
Figure 3 shows the results by city and by time series. The correlation model estimated 323 values while the relative model yielded 154 values. The number of outcomes from the correlation model is double from that of the relative risk model. One hundred fifty four values out of 323 were compared in Figure 3. The total number of deaths estimated from the correlation model for 10 cities was 22,713; this amounts to 18 deaths per 100,000 people in 2012.
The correlation model results of Bangkok, Beijing, and Colombo were overestimated by the relative risk model. The results of the correlation model in Hong Kong were underestimated by the relative risk. The results of the correlation model in Shanghai and Singapore are estimated as those of the relative model. The differences of the results between these two models might be affected from uncertain factors such as socio-economic factors. Accessibility of hospitals, availability to medicine, health insurance systems, etc., may affect the behavior of how to recover from the diseases. In the long-term, the number of potential patients may influence the data of vital statistics. The number of deaths from traffic accidents can be compared with the deaths caused by air pollution for reference.
The number of deaths caused by air pollution seems to exceed that of traffic accident in Bangkok, Beijing, Hong Kong and Shanghai. The number of deaths caused by air pollution seems to as same as that of traffic accident in Singapore. The number of deaths by traffic accidents seems to exceed that of air pollution in Colombo.
5. Conclusions and Further Improvements
A basic idea of health effects was captured from simple indicators, such as population and air quality in the correlation model based on the track record of the Japanese compensation system. Based on empirical findings from data in Osaka, mortality due to respiratory diseases are calculated for large Asian cities. It discusses the validity of the correlation model measurements by comparing with the relative risk model.
The correlation model doubled estimated results of respiratory mortality caused by air pollution more than by using the relative model because of data availability. There are some improvements for data reliability (air quality, population, definition of mortality caused by respiratory disease etc.), but the correlation model could be one of the alternative methods to estimate mortality besides the relative risk model.
The results are comparable to those of the relative risk model as long as the data quality is reliable. Political implications could prepare public health policy in advance, which will be cost effective. Governments could implement preventive measures against air pollution in developing countries, referring the level of deaths caused by traffic accidents.
Several improvement points are observed for the next step of the correlation model.
- ▪
- This “one fit for all” model should be adjusted by local conditions. Mortality rates will be influenced by the availability of medical treatments/medical care systems in Asia. The correlation model should include indicators of these medical facilities.
- ▪
- The application of the Japanese coefficients for Asia could be improved. The coefficient β should be estimated from all of Japan to increase accuracy. The definition of respiratory disease mortality in statistical yearbooks from each country should be verified.
- ▪
- Due to uncertainty, factors which affect the results should be identified as a next step.
Acknowledgments
We are grateful to Keiko Masamoto, a librarian Tokyo Metropolitan Institute for Environmental Protection for advice of data collection. We appreciate Toshi Arimura (Waseda University.), and Takeshi Fujii (General Manger of Global Networking and Public Relations, JARI). We are solely responsible for all the errors in this paper.
Author Contributions
Satoshi Shibuya and Keiko Hirota collected and analyzed the data based on original idea of Shigeru Kashima. Shogo Sakamoto advised and revised the methodology. Keiko Hirota finalized data quality, wrote this article and responded to feedback from reviewers. All the members joined discussion for result interpretation and improvement.
Conflicts of Interest
We the authors declare no conflict of interest.
Abbreviations
The following abbreviations are used in this manuscript:
| Compensation system | Pollution-related Health Damage Compensation and Prevention System |
| COPD | Chronic obstructive pulmonary disease |
| GBD | Global Burden of Disease |
| ICD | International statistical Classification of Disease |
| NO2 | Nitrogen Dioxide |
| PM | Particulate Matter According to the US EPA, particulate matter includes PM10 and PM2.5. |
| SO2 | Sulphur dioxide |
| SPM | Suspended Particulate Matter |
| TSP | Total Suspended Matter |
| USEPA | Environmental Protection Agency in the USA |
| WHO | World Health Organization |
References
- Anderson, H.R. Air pollution and mortality: A history. Atmos. Environ. 2009, 43, 142–152. [Google Scholar] [CrossRef]
- Daly, C. Air pollution and causes of death. Br. J. Pre. Soc. Med. 1959, 13, 14–27. [Google Scholar] [CrossRef]
- Dockery, D.W.; Pope, C.A., III; Xu, X.; Spengler, J.D.; Ware, J.H.; Fay, M.E.; Ferris, B.G., Jr.; Speizer, F.E. An association between air pollution and mortality in six U.S. cities. N. Engl. J. Med. 1993, 329, 1753–1759. [Google Scholar] [CrossRef] [PubMed]
- Pope, C.A., III; Brunett, R.T.; Thun, M.J. Lung cancer, cardiopulmonary mortality, and long term exposure to fine particulate air pollution. J. Am. Med. Assoc. 2002, 287, 1132–1141. [Google Scholar] [CrossRef]
- Bonita, R.; Beaglehole, R.; Kjellström, T. Basic Epidemiology, 2nd ed.; WHO: Geneve, Switzerland, 2006. [Google Scholar]
- Health Effect Institute. Health Effects of Outdoor Air Pollution in Developing Countries: A Literature Review. Available online: https://www.healtheffects.org/publication/health-effects-outdoor-air-pollution-developing-countries-asia-literature-review (accessed on 2 December 2006).
- WHO. World Health Report 2002. Available online: //www.who.int/whr/2002/en/whr02_annex_en.pdf (accessed on 9 January 2011).
- WHO. The Global Burden of Disease (GBD): 2004 Update. Available online: http://www.who.int/healthinfo/global_burden_disease/2004_report_update/en/index.html (accessed on 9 January 2011).
- Ostro, B. Outdoor air pollution. In Environmental Burden of Disease Series No.5; WHO: Geneve, Switzerland, 2004. [Google Scholar]
- Cohen, A.J.; Anderson, H.R.; Ostro, B.; Pandey, K.D.; Krzyzanowski, M.; Kunzli, N.; Gutschmidt, K.; Pope, C.A., III; Romieu, I.; Samet, J.M.; et al. Urban air pollution. In Comparative Quantification of Health Risks; Ezzati, M.E., Lopez, A.D., Murray, C.J.L., Eds.; WHO: Geneve, Switzerland, 2004. [Google Scholar]
- Vimercati, L.; Gatti, M.F.; Gagliardi, T.; Cuccaro, F.; Maria, D.L.; Caputi, A.; Quarato, M.; Baldassarre, A. Environmental exposure to arsenic and chromium in an industrial area. Environ. Sci. Pollut. Res. Int. 2017, 24, 11528–11535. [Google Scholar] [CrossRef] [PubMed]
- Vimercati, L.; Baldassarre, A.; Gatti, M.F.; Gagliardi, T.; Serinelli, M.; Maria, D.L.; Caputi, A.; Dirodi, A.A.; Galise, I.; Cuccaro, F.; et al. Non-occupational exposure to heavy metals of the residents of an industrial area and biomonitoring. Environ. Monit. Assess. 2016, 188, 673. [Google Scholar] [CrossRef] [PubMed]
- Nasari, M.M.; Szyszkowicz, M.; Chen, H.; Crouse, D.; Turner, M.C.; Jerrett, M.; Pope, C.A., III; Hubbell, B.; Fann, N.; Cohen, A.; et al. A class of non-linear exposure-response models suitable for health impact assessment applicable to large cohort studies of ambient air pollution. Air Qual. Atmos. Health 2016, 9, 961–972. [Google Scholar] [CrossRef] [PubMed]
- Anenberg, S.C.; Miller, J.; Minjares, R.; Du, L.; Henze, D.K.; Lacey, F.; Malley, C.S.; Emberson, L.; Franco, V.; Klimont, Z.; et al. Impacts and Mitigation of Excess Diesel-related NOx Emissions in 11 Major Vehicle Markets. Nature. 2017, 545, 467. [Google Scholar] [CrossRef] [PubMed]
- Osaka City Government. Osaka City White Paper; Osaka City Government: Osaka, Japan, 1984 and 1990. (In Japanese)
- Osaka Prefecture Government. Osaka Prefecture White Paper; Osaka Prefecture Government: Osaka, Japan, 1980 and 1990. (In Japanese)
- Sakamoto, S.; Shibuya, S.; Hirota, K.; Kashima, S. Estimation of exposure-response function considered cumulative and composite air pollution concentration. In Proceedings of the 26th Conference on Environmental Information Science, Tokyo, Japan, November 2012. [Google Scholar]
- Hirota, K.; Shibuya, S.; Sakamoto, S.; Kashima, S. A methodology of estimation on air pollution and its health effects in large Japanese cities. In Air Quality; Sunil, K., Ed.; InTech Open Access: Rijeka, Croatia, 2012; pp. 145–166. ISBN 979-953-307-220-2. [Google Scholar]
- Hirota, K.; Kashima, S. Emission volume, air quality and health effect in Japan: The cases of Tokyo, Kawasaki, Amagasaki and Kita Kyusyu. In Proceedings of the Seventh International Conference on Traffic & Transportation Studies (ICTTS 2010), Kunming, China, 3–5 August 2010. [Google Scholar]
- WHO. Reference Table 1. GBD 2000. Cause Groups and ICD Codes. Available online: http://www.who.int/healthinfo/bodreferencecausecategories.pdf (accessed on 5 February 2011).
- Ministry of Health, Labor and Welfare Government of Japan (MHLW). Available online: http://www.mhlw.go.jp/toukei/sippei/icd.html (accessed on 4 February 2011).
- Trends in Vital Statistics by prefecture in Japan (1974–1988). Available online: http://www.mhlw.go.jp/english/database/db-hw/vs_8/index.html (accessed on 29 June 2017).
- Kishimoto, A. Quantification and economic valuation of the health of particulate matter. Resour. Environ. 2000, 9, 42. (In Japanese) [Google Scholar]
- Quian, Z.; Zhang, J.; Wei, F.; Wilson, W.E.; Chapman, R.S. Long-term ambient air pollution levels in four Chinese cities: Inter-city and intra-city concentration gradients for epidemiological studies. J. Expo. Anal. Environ. Epidemiol. 2001, 11, 341–351. [Google Scholar] [CrossRef] [PubMed]
- Alpha Research Co.; Tera International Co. Thailand in Figures; Tera International Co.: Bangkok, Thailand, 2002–2006, 2015–2016. [Google Scholar]
- Alfa Research. Thailand Health Data; Alfa Research Co., Ltd: Bangkok, Thailand, 2015–2016. [Google Scholar]
- Asian Development Bank (ADB) and Clean Air Initiative for Asian Cities (CAI-Asia) Center. Country Synthesis Report on Urban Air Quality Management. Bangladesh, Cambodia, Hong Kong, India, Indonesia, Lao PDR, Malaysia, Mongolia, Nepal, Pakistan, Philippines, PRC, Singapore, Sri Lanka, Thailand, Viet Nam; ADB: Manila, The Philippines, 2006. [Google Scholar]
- Clean Air Initiative for Asian Cities (CAI-Asia). Clean Air Management Profile: India, Indonesia, Philippines, Thailand and Viet Nam: Air Quality Profile 2010 Edition; CAI-Asia Center: Pasig City, The Philippines, 2010. [Google Scholar]
- Badan Pusat Statistik (BPS). Statistics of Indonesia; BPS: Jakarta, Indonesia, 2008, 2015.
- Badan Pusat Statistik (BPS), Environmental Statistics of Indonesia; BPS: Jakarta, Indonesia, 2001, 2004, 2006, 2008.
- Bangladesh Bureau of Statistics. Statistical Yearbook of Bangladesh; Bangladesh Bureau of Statistics: Dhaka, Bangladesh, 2005, 2008.
- Beijing Municipal Bureau of Statistics. Beijing Statistical Yearbook; China Statistics Press: Beijing, China, 2003–2015.
- Census and Statistics Department. Hong Kong Annual Digest of Statistics; The Government of Hong Kong Special Administration Region: Hong Kong, 2000, 2007, 2008, 2015.
- Central Statistical Organization. Myanmar Statistical Yearbook; Ministry of Planning and Finance: Nay Pyi Taw, Myanmar, 2005, 2011, 2015.
- Chongqing Municipal Bureau of Statistics. Chongqing Statistical Yearbook; China Statistics Press: Beijing, China, 2004–2007, 2011, 2013 and 2015.
- Dalian Municipal Bureau of Statistics. Dalian Statistical Yearbook; China Statistics Press: Dalian, China, 2012–2015.
- Department of Census and Statistics Sri Lanka. Statistical Abstract; Department of Census and Statistics: Battaramulla, Sri Lanka, 1999, 2005–2007, 2009 and 2015.
- Department of Census and Statistics Sri Lanka. Statistical Pocket Book of Republic of Sri Lanka; Department of Census and Statistics: Battaramulla, Sri Lanka, 2004.
- Department of Environment Malaysia. Malaysia Environmental Quality Report; Department of Environment Malaysia: Putrajaya, Malaysia, 2004, 2007.
- Department of Statistics Malaysia. State/district Databank; Department of Statistics: Putrajaya, Malaysia, 2012.
- Department of Statistics Malaysia. Social Statistics Bulletin; Department of Statistics: Putrajaya, Malaysia, 2006, 2012, 2014, 2015.
- The Energy and Resources Institute (TERI). TERI Energy and Environment Data Diary and Yearbook (TEDDY); TERI: New Delhi, India, 2013/2014, 2015/2016. [Google Scholar]
- Department of Environment and Natural Resources. National Air Quality Report; Department of Environment and Natural Resources: Quezon City, The Philippines, 2002–2004.
- Government of Karnakata and WilburSmith Associates. Bangalore Mobility Indicators 2008; Directorate of urban land transport, Government of Karnakata and WilburSmith Associates: Bangalore, India, 2009.
- Government of Karnakata. Annual Report 2008–2009; Government of Karnakata: Bangalore, India, 2010.
- The Government of National Capital Territory of Delhi. Delhi Statistical Handbook; The Government of National Capital Territory of Delhi: Delhi, India, 2008.
- Guangzhou Municipal Bureau of Statistics. Guangzhou Statistical Yearbook; China Statistics Press: Beijing, China, 2000–2004, 2007, 2008, 2015.
- Hanoi Statistical Office. Statistical Yearbook of Hanoi; General Statistical Office of Viet Nam: Hanoi, Viet Nam, 2002, 2004–2006, 2015.
- Ho Chi Minh City Statistical Office. Statistics Yearbook of Ho Chi Minh City; General Statistics Office of Viet Nam: Ho Chi Minh City, Viet Nam, 2006, 2008, 2013.
- Lao Statistics Bureau. Lao PDR Statistical Yearbook; Lao Statistics Bureau: Vientiane, Laos, 2015.
- The Ministry of Environment. Korea Environmental Statistics; The Ministry of Environment: Seoul, Korea, 2006.
- Ministry of Statistics & Programme Implementation. Statistical Abstract of India; New Delhi Govt. of India: New Delhi, India, 2000–2004, 2007.
- National Bureau of Statistics of China. China National Statistical Yearbook; National Bureau of Statistics of China: Beijing, China, 1999–2005.
- National Institute of Statistics. Ministry of Planning. Cambodia Statistical Yearbook; National Institute of Statistics, Ministry of Planning: Phnom Penh, Cambodia, 2006.
- National Institute of Statistics, Ministry of Planning. A Compendium on Environment Statistics; Ministry of Planning: Phnom Penh, Cambodia, 2003.
- National Statistical Office, Ministry of Information and Communication Technology. Thailand Environment Statistics; National Statistical Office Publication: Bangkok, Thailand, 2004.
- National Statistical Office of Mongolia. Mongolian Statistical Yearbook; National Statistical Office of Mongolia: Ulaanbaatar, Mongolia, 2006, 2013.
- Pakistan Bureau of Statistics. Pakistan Statistical Yearbook; Pakistan Bureau of Statistics: Islamabad, Pakistan, 2007, 2014.
- Pakistan Bureau of Statistics. Statistical Pocket Book of Pakistan; Pakistan Bureau of Statistics: Islamabad, Pakistan, 2007.
- Philippines Statistics Authority. Philippine Statistical Yearbook; The Philippines Statistics Authority: Quezon City, The Philippines, 2009.
- Philippines Statistics Authority. Compendium of Environmental Statistics; Philippines Statistics Authority: Quezon City, The Philippines, 2014.
- Qingdao Municipal Bureau of Statistics. Qingdao Statistical Yearbook; China Statistics Press: Beijing, China, 2006, 2008, 2015.
- Shanghai Municipal Bureau of Statistics. Shanghai Statistical Yearbook; China Statistics Press: Beijing, China, 1997, 1998, 2004, 2005, 2009, 2011, 2014, 2015.
- Shenzhen Municipal Bureau of Statistics. Shenzhen Statistical Yearbook; China Statistics Press: Beijing, China, 2008, 2015.
- Shenyang Municipal Bureau of Statistics. Shenyang Statistical Yearbook; China Statistics Press: Beijing, China, 2007, 2015.
- Singapore Department of Statistics. Yearbook of Statistics Singapore; Singapore Department of Statistics: High Street, Singapore, 2000, 2008, 2015.
- Statistical Forecasting Bureau. Statistical Yearbook Thailand; National Statistical Office: Bangkok, Thailand, 2007, 2014.
- The Yearbook of China’s Cities Press. The China's Cities Yearbook; The Yearbook of China’s Cities Press: Beijing, China, 2008. [Google Scholar]
- Transport Research Wing, Ministry of Shipping, Road Transport and Highway. Road Transport Yearbook; Ministry of Road Transport and Highway: Delhi, India, 2009, 2010.
- The World Bank Indonesia Office. Indonesia Environmental Monitor 2003; The World Bank Group: Jakarta, Indonesia, 2003. [Google Scholar]
- The World Bank Manila Office. Philippines Environmental Monitor 2002; The World Bank Group: Pasig City, The Philippines, 2002. [Google Scholar]
Figure 1.
Overall comparison of the results from the two models.

Figure 2.
Overall comparison of the results from the two models (Bangkok, Colombo, Hong Kong, and Singapore).
Figure 2.
Overall comparison of the results from the two models (Bangkok, Colombo, Hong Kong, and Singapore).
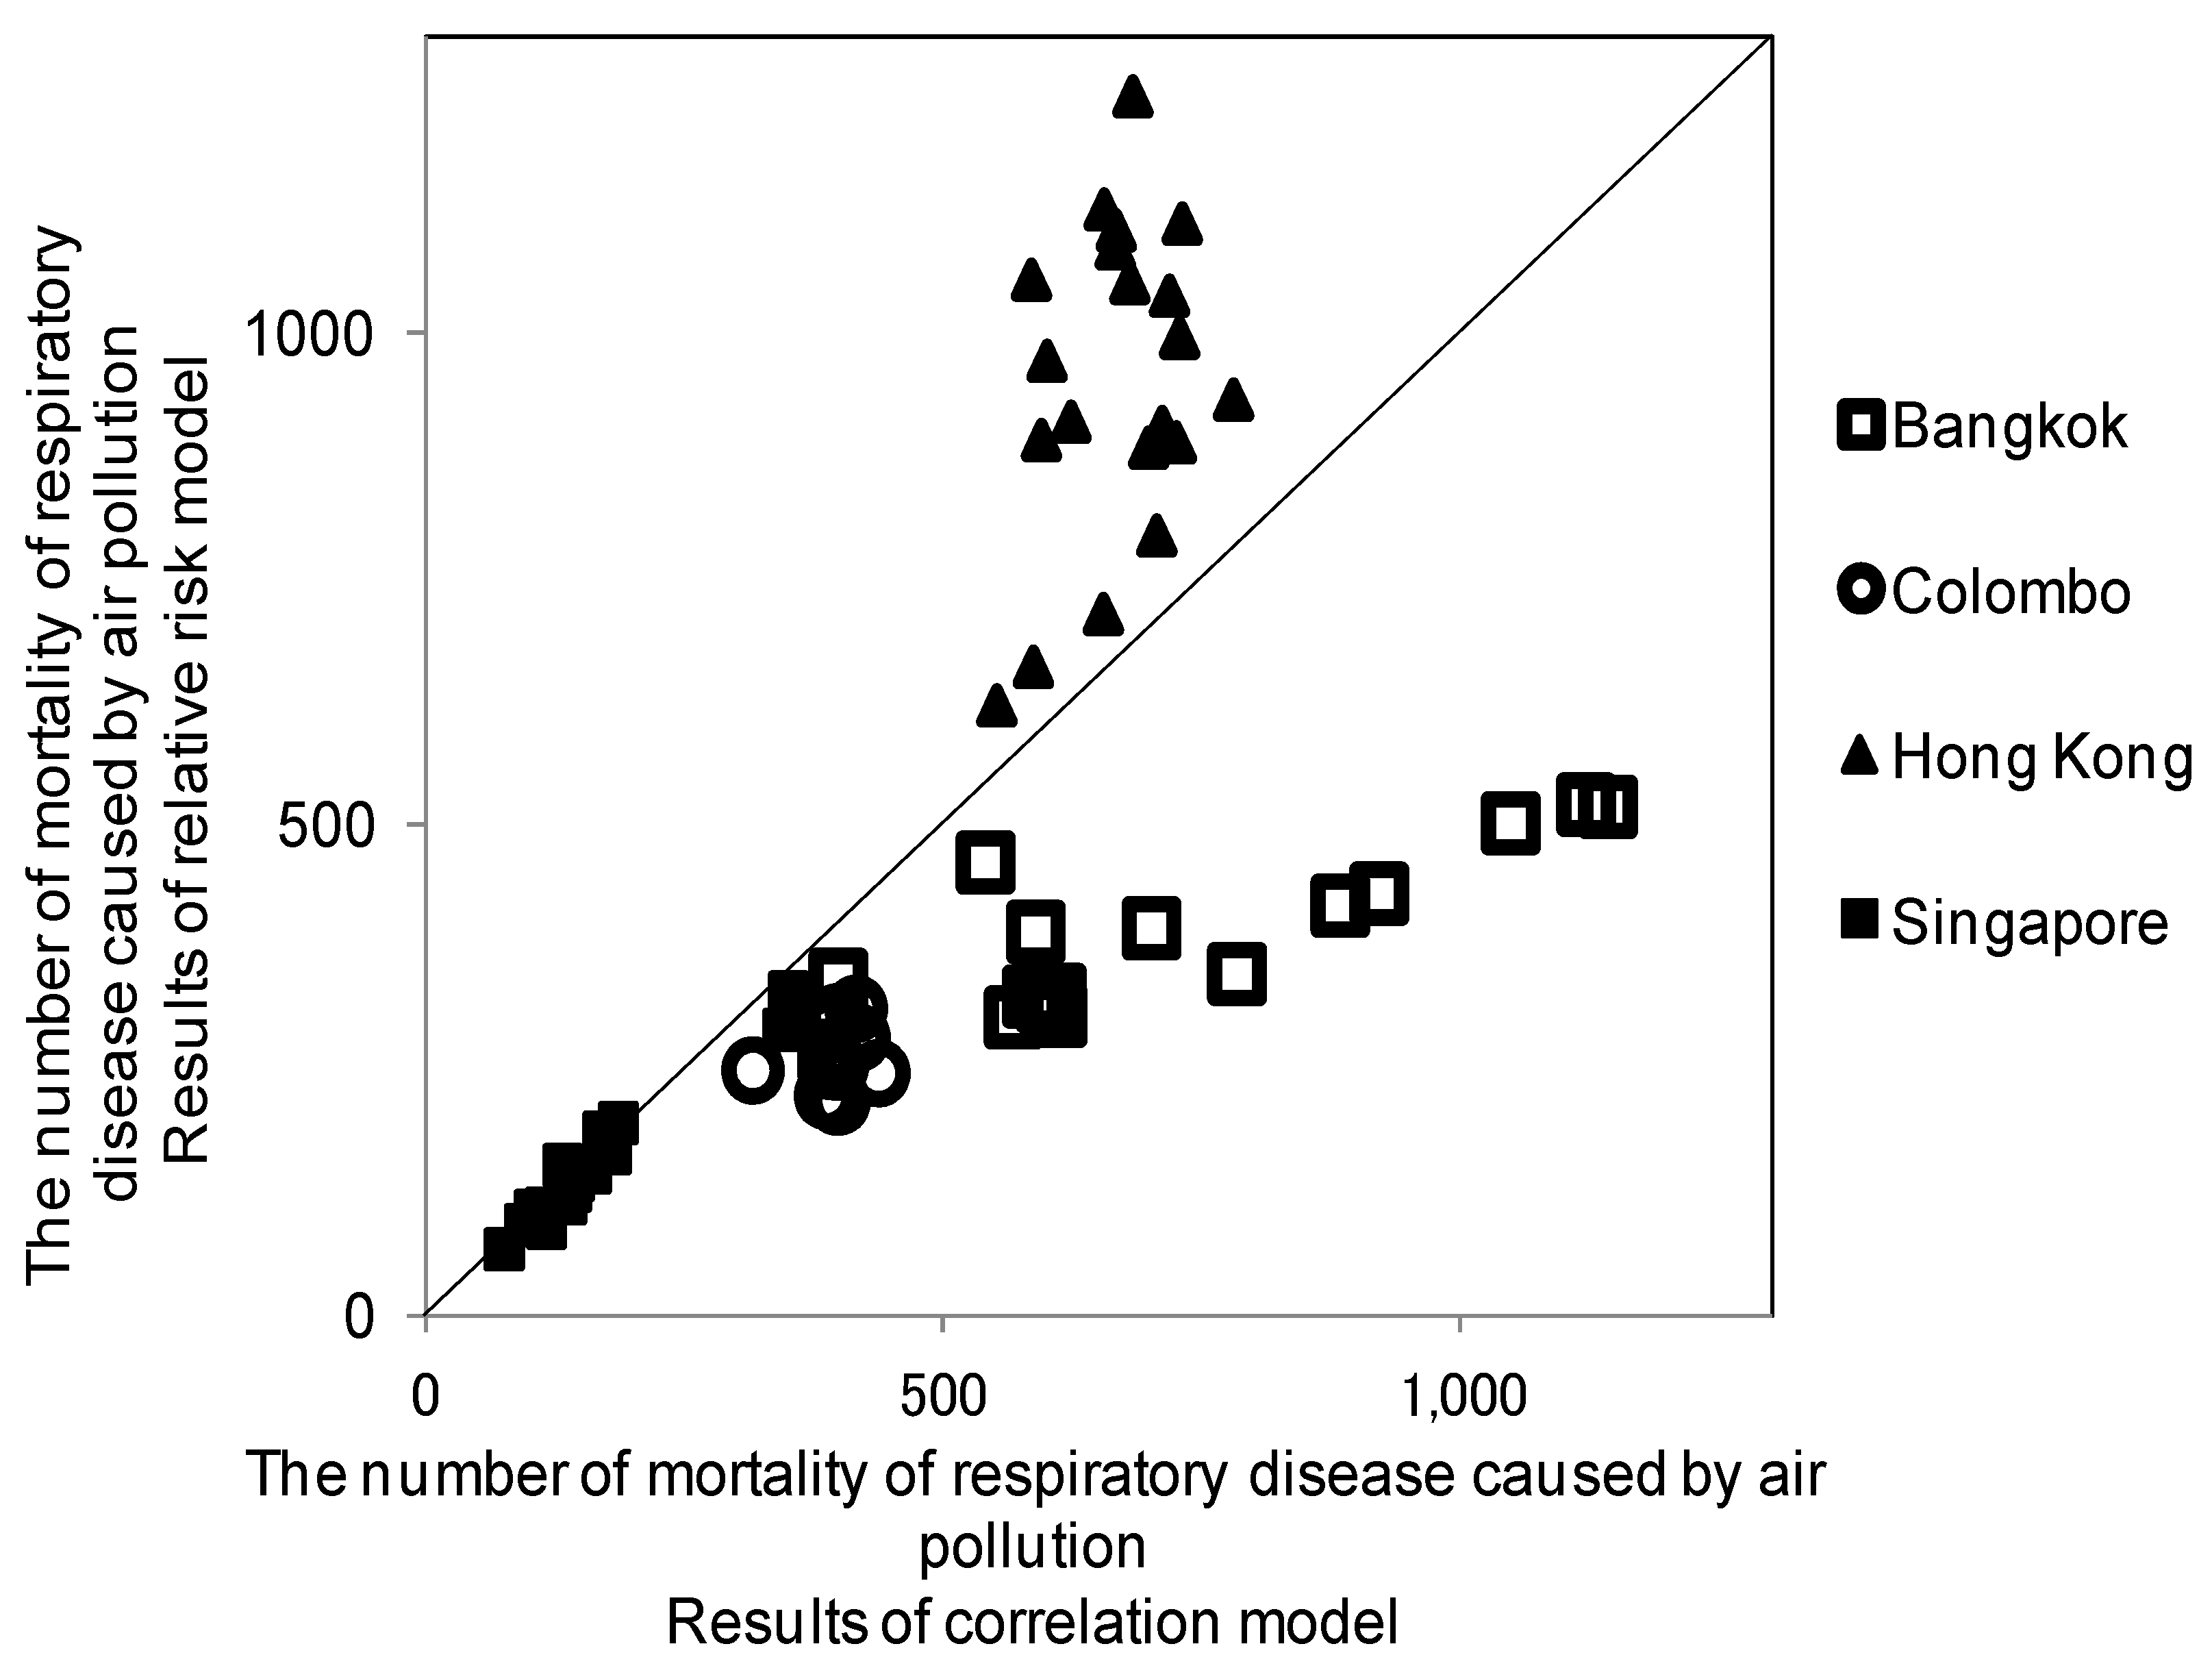
Figure 3.
Comparison by city and by time series.


Table 1.
City data availability and the surface area per monitoring site [25,26,27,28,29,30,31,32,33,34,35,36,37,38,39,40,41,42,43,44,45,46,47,48,49,50,51,52,53,54,55,56,57,58,59,60,61,62,63,64,65,66,67,68,69,70,71].
| No. | Rate | City | Urban Population | TSP/PM2.5/PM10 | Cause of Death for Respiratory Disease (J00–J99) | km2/ Monitoring Site |
|---|---|---|---|---|---|---|
| 1 | △ | Bangalore | 1990, 1995, 1996, 2000, 2001, 2005 | 1995, 1999–2007, 2012, 2013 | NA | 89 |
| 2 | ○ | Bangkok | 1990, 1995–2014 | 1990, 1995–2013 | 1995, 1996, 2000, 2011, 2013 | 143 |
| 3 | ○ | Beijing | 1990, 1995–2014 | 1990, 1995,1999–2014 | 1995–2014 | 73 |
| 4 | △ | Chongqing | 1995–2014 | 1997–2014 | NA | 37 |
| 5 | ○ | Colombo | 1995–2014 | 1998–2012 | 1995, 2003–2006, 2009 | NA |
| 6 | △ | Dalian | 1995, 1998, 2000–2014 | 2003–2008, 2012 | NA | 26 |
| 7 | △ | Delhi | 1990, 1995–2005 | 1990, 1995–2007 | NA | 66 |
| 8 | × | Dhaka | 1995, 1997–2005 | 1997–2007 | NA | 581 |
| 9 | △ | Guangzhou | 1995–2014 | 1995, 1998–2014 | NA | 81 |
| 10 | △ | Hanoi | 1995, 1999–2014 | 1996, 1998–2003 | NA | 117 |
| 11 | △ | Ho Chi Minh City | 1995, 1998–2008, 2010–2012 | 1995–2007 | NA | 210 |
| 12 | ○ | Hong Kong | 1995–2014 | 1995–2014 | 1995–2014 | 100 |
| 13 | △ | Jakarta | 1995, 1998–2006, 2010, 2013–2014 | 1990, 1995, 1999–2003, 2007, 2009 | NA | 111 |
| 14 | × | Karachi | 1990, 1998 | 1990, 2000, 2001, 2003 | NA | 14,091 |
| 15 | × | Kathmandu | 1995, 2000, 2001, 2005 | 2003–2007 | NA | 25 |
| 16 | △ | Kuala Lumpur | 1995, 1996, 1998–2012 | 1995–2007, 2010, 2012, 2013 | NA | 77 |
| 17 | △ | Manila | 2000, 2005–2007 | 1990, 1995–2007 | 1996–1999 | 53 |
| 18 | △ | Mumbai | 1990, 1995, 2000, 2001, 2005 | 1995–2007 | NA | NA |
| 19 | × | Okinawa Naha-City | NA | NA | NA | 40 |
| 20 | △ | Phnom Penh | 1995, 1998–2006, 2008, 2013 | 1995, 2001, 2002 | NA | 21 |
| 21 | △ | Qingdao | 1996–2012 | NA | NA | 45 |
| 22 | △ | Seoul | 1995, 2000, 2005, 2007 | 1990, 1995–2005, 2007 | NA | 30 |
| 23 | ○ | Shanghai | 1990, 1995–2014 | 1990, 1995–2014 | 1990, 1995–2008, 2010–2014 | 81 |
| 24 | △ | Shenyang | 1995, 1998, 2000–2007, 2010–2012 | 2003–2007 | 1998 | 22 |
| 25 | △ | Shenzen | 1995–2014 | 1996–2014 | 1996–1998 | NA |
| 26 | ○ | Singapore | 1990, 1995–2014 | 1990, 1995–2014 | 1995–2014 | 140 |
| 27 | × | Taipei | 1995, 2000, 2002–2005, 2007 | 1995–2008 | NA | NA |
| 28 | × | Ulaanbaater | 1995, 2000–2006 | 2008 | NA | 588 |
| 29 | × | Vientiane | 1995, 1998, 2000–2006, 2014, 2015 | 2002–2004, 2007, 2008 | NA | NA |
| 30 | △ | Yangon | 1995, 1998, 2000–2010, 2014 | 2007 | 1990, 1995, 1998–2007, 2010–2013 | 518 |
| 31 | × | Yokohama | 1995–1999 | NA | NA | 16 |
○: three items of data available (population/air quality/cause of death by respiratory diseases) at least 10 years; △: two data items available out of the three items; X: only one item of data available; NA: no answer.
Table 2.
Results of coefficient estimation.
| Items of Results | Equation (2) α | Equation (5) β |
|---|---|---|
| Coefficient | 0.0291 (16.30) | 0.0062 (4.31) |
| Adjusted R2 | 0.856 | 0.499 |
| The number of observations | 10 | 15 |
( ): t value.
© 2017 by the authors. Licensee MDPI, Basel, Switzerland. This article is an open access article distributed under the terms and conditions of the Creative Commons Attribution (CC BY) license (http://creativecommons.org/licenses/by/4.0/).
Share and Cite
MDPI and ACS Style
Hirota, K.; Sakamoto, S.; Shibuya, S.; Kashima, S. A Methodology of Health Effects Estimation from Air Pollution in Large Asian Cities. Environments 2017, 4, 60. https://doi.org/10.3390/environments4030060
AMA Style
Hirota K, Sakamoto S, Shibuya S, Kashima S. A Methodology of Health Effects Estimation from Air Pollution in Large Asian Cities. Environments. 2017; 4(3):60. https://doi.org/10.3390/environments4030060
Chicago/Turabian StyleHirota, Keiko, Shogo Sakamoto, Satoshi Shibuya, and Shigeru Kashima. 2017. "A Methodology of Health Effects Estimation from Air Pollution in Large Asian Cities" Environments 4, no. 3: 60. https://doi.org/10.3390/environments4030060
Note that from the first issue of 2016, this journal uses article numbers instead of page numbers. See further details here.