Relationship between Ambient Temperature and Mental Health in the USA †

1
School for Engineering of Matter, Transport & Energy, Arizona State University, 501 E Tyler Mall ECG303, Tempe, AZ 85287-6106, USA
2
Phelan International LLC, 8525 E San Jacinto Dr, Scottsdale, AZ 85258, USA
*
Author to whom correspondence should be addressed.
†
This paper was presented at the International Research Conference on Sustainable Energy, Engineering, Materials and Environment, Northumbria University, Newcastle Upon Tyne, UK, July 26–28, 2017.
Environments 2017, 4(4), 71; https://doi.org/10.3390/environments4040071
Submission received: 7 August 2017
/
Revised: 5 October 2017
/
Accepted: 6 October 2017
/
Published: 8 October 2017
(This article belongs to the Special Issue Environmental Risk and Climate Change)
Abstract
:Climatic variables such as temperature have been shown to correlate with demand for mental health services in other countries. An attempt by the present study to replicate this correlation using existing USA treatment data on mental health was not substantiated. Using annual state-level data from 2007 through 2015, the rate of mental health service utilization per 1000 population was correlated with average temperature and precipitation, while adjusting for Gross Domestic Product (GDP), unemployment, and urbanization. No statistically significant correlation was found.
1. Introduction
It is clear that the ambient temperature impacts public health (e.g., [1]), and global climate change and local effects such as urban heat island will therefore have subsequent health impacts. Rising temperatures, in particular, are a cause of concern and are likely to increase both morbidity [2] and mortality [3], especially in vulnerable populations. However, the impacts of temperature on behavioral health (substance abuse and mental health) have not received as much attention as those on physical health. A number of Australian and Canadian studies indicate that rising temperatures can also lead to exacerbation of behavioral health issues, causing increases in, for example, emergency room visits due to mental health [4,5]. Researchers have begun to develop a framework to understand the relationship between temperature and mental health [6]. An Australian study [7] quantified the temperature threshold for triggering mental-illness-related emergency visits during extreme heat events. Another study [8] focused on such impacts on women.
Interestingly, very little attention appears to have been paid to the issue of environmental impacts on substance use and mental health disorders in the USA. This is especially remarkable given the exposure of parts of the USA to extreme temperatures, such as the southwestern USA and most (if not all) of the major cities that are subject to urban heat island effects. This paper is an attempt to establish the relationship between differences in climate across states and over time within states and the utilization of mental health services. Unlike other studies, this paper uses available official treatment data on mental health collected across states over time. The choice to use these state-level data presents as a viable alternative to using primary data, which are usually collected to conduct this type of research. The state and federal governments have been supporting the collection of the mental health treatment data and thus it would be worthwhile to test their potential for use.
2. Methods
We begin an analysis of this relationship in the USA by examining and correlating climatic data for US states with the rate of mental health service utilization per 1000 population, which is commonly called the penetration rate. For the purposes of this study, we focus on mental health services and reserve substance abuse instances for a future study. For all 50 USA states as well as the District of Columbia, we attempt to correlate temperature and select economic indicators against a mental health indicator (i.e., penetration rate) using multiple linear regression analysis. We started by including all independent variables in the equation and systematically excluding variables suspected to be correlated with another variable (for example, using all temperature variables and excluding one variable at a time or using a combination of variables) and/or reducing the number of variables in the equation.
Data Sources: The data used for the analysis come from a variety of sources as described below.
2.1. Climate Data
Climatic data were obtained from the National Oceanic and Atmospheric Administration (NOAA)’s National Centers for Environmental Administration, which contains the Climate at a Glance resource [9]. As discussed in the next subsection, we were constrained since mental health data are available only at the state level, and only year-long averages are provided for the years 2007 through 2015. We therefore collected corresponding climate data for the same years, with annually averaged data for each state and the District of Columbia. Reference [9] provided state-wide minimum temperature, maximum temperature, average temperature, and precipitation.
2.2. Mental Health Data
The mental health data are collected annually from the State Mental Health Authorities (SMHAs) in all 50 states, the District of Columbia, and the eight U.S. territories through the Uniform Reporting System (URS) [10]. For this study, data from the territories are excluded. Data collection is supported and funded by the Substance Abuse and Mental Health Services Administration (SAMHSA) within the U.S. Department of Health and Human Services (DHHS).
Official mental health data in the URS are the only treatment data from publicly-funded mental health programs under the auspices of the SMHAs. Data are reported using standard protocol. Data reporting from the states started in 2003, but the first complete data set from all the states is available only beginning in 2007. For the purposes of this study, the penetration rate (or treated prevalence rate) is the dependent variable. It is the ratio of the number of individuals who received mental health treatment services to the total number of state population. The numerator is the unique count of individuals who received a mental health service from the SMHA during a 12-month reporting period, and the denominator is the state population, expressed per 1000 population. An individual who received a service during the reporting period is counted only once in the numerator, although the person may have received different types of services many times during the year. Some confounding factors may affect a state’s penetration rates over time or between states. These factors include but are not limited to the state’s reporting capacity, characteristics of the state’s mental health service delivery system, funding levels, state-identified priority populations receiving publicly-funded mental health services, etc.
2.3. GDP, % Urban, and Unemployment Data
Recognizing that climate variables are not the only factors that can affect the rate at which mental health services are received, we also consider both economic variables and living environment. The economic proxy variables are per capita real gross domestic product (GDP) and unemployment rate—averaged both statewide and annually—for the same years for which mental health data are available (2007–2015). The statewide per capita real GDP (in chained 2009 dollars) is from the USA Bureau of Economic Analysis [11], while the unemployment rate (in %) is from the USA Bureau of Labor Statistics [12]. Meanwhile, the living environment is characterized as the percentage of a statewide population that lives in an urban area, defined here as a community of at least 50,000 people by the USA Census Bureau [13]. Since the last national census was taken in 2010 (it is normally done every 10 years), we used the 2010 value and assumed that the percent of a state’s population that lives in such urban areas did not change over the period 2007–2015. For all other variables, however, we considered annual averages over the same time periods.
As stated above, we gathered data for all 50 states plus the District of Columbia, which contains the city of Washington, DC. Rather than showing tables for all 50 states and the District of Columbia, Table 1 presents the data for three representative states: Arizona, Ohio, and Minnesota. These three states are in dramatically different climate zones. According to the climate zones defined by the US Department of Energy Building America Program [14], Arizona is largely in the “Hot-Dry” zone, Ohio is largely in the “Cold” zone, and Minnesota is mostly in the “Cold/Very-Cold“ zone. The diversity of climate zones in the USA contributes to the difficulty in establishing quantitative relationships between health indicators (like the penetration rates used here) and climate variables, given that individual states can be very different in other ways besides climate.
3. Results
Table 2 presents all the collected data for the 50 states and the District of Columbia (DC), averaged over the years 2007–2015. This allows a side-by-side comparison of the displayed variables: average temperature, minimum temperature, maximum temperature, precipitation, real GDP per capita, % urban population, unemployment rate, and finally the penetration rate per 1000 people (our variable that indicates the rate at which behavioral health services are availed).
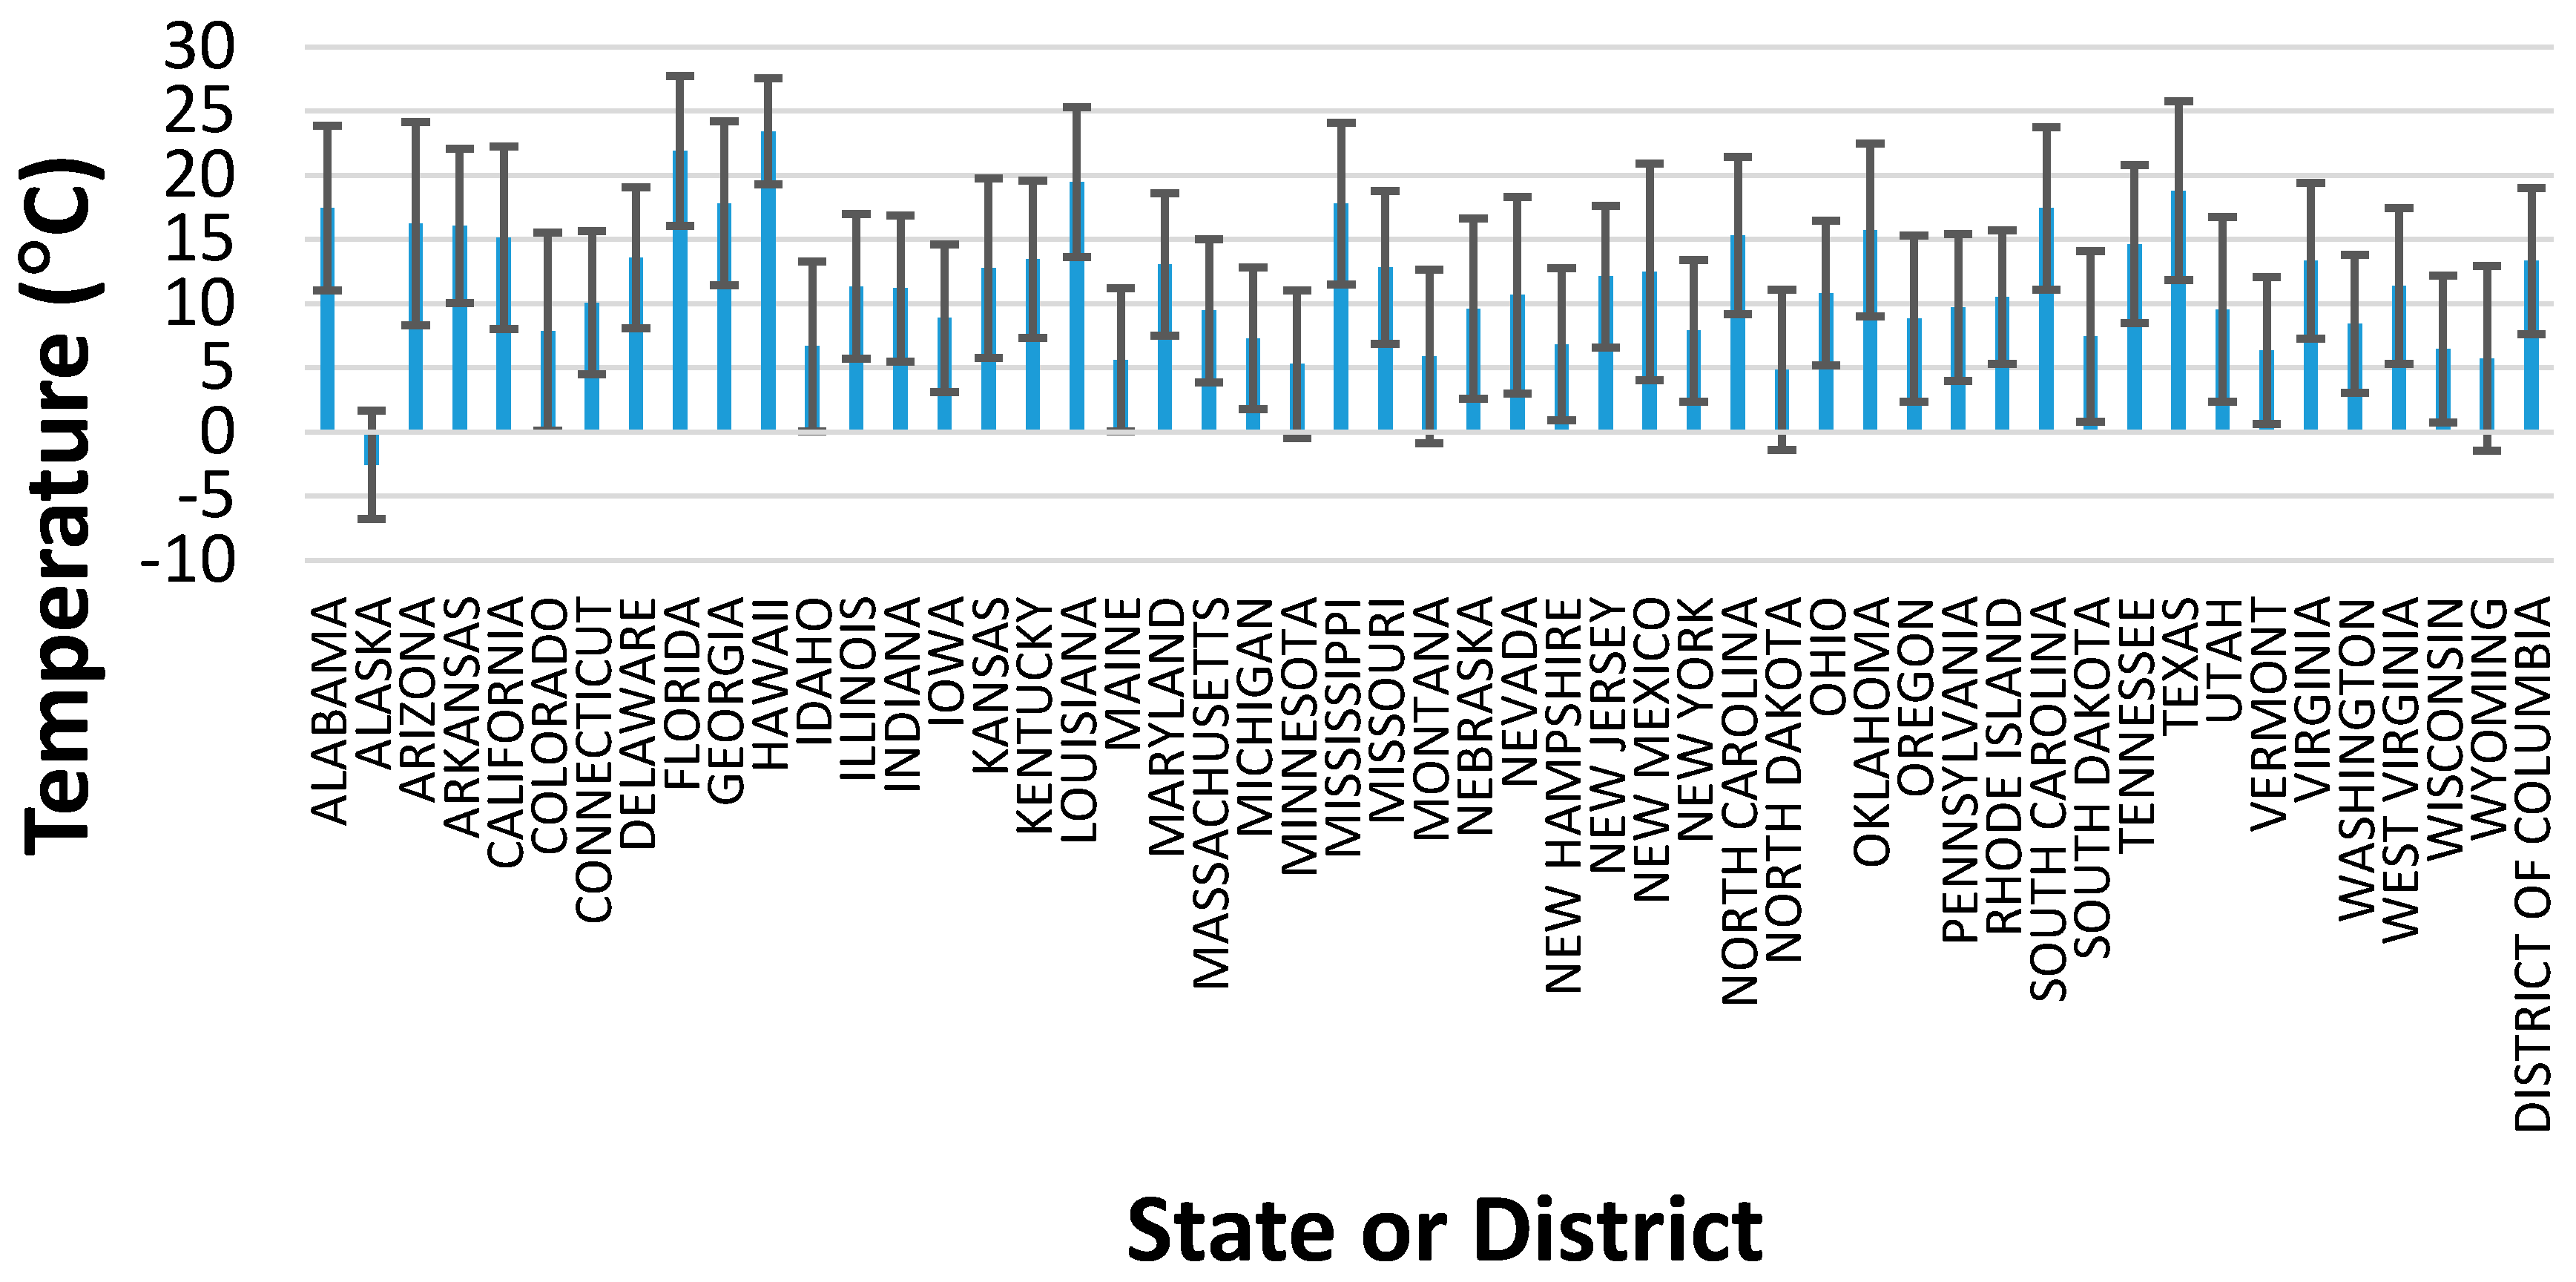
Since the focus of this article is on the impact of climate on mental health, a graphical representation of the average temperatures for each state and DC is provided in Figure 1. The error bars in this figure represent the range of maximum and minimum temperatures, averaged over the 2007 to 2015 time period.
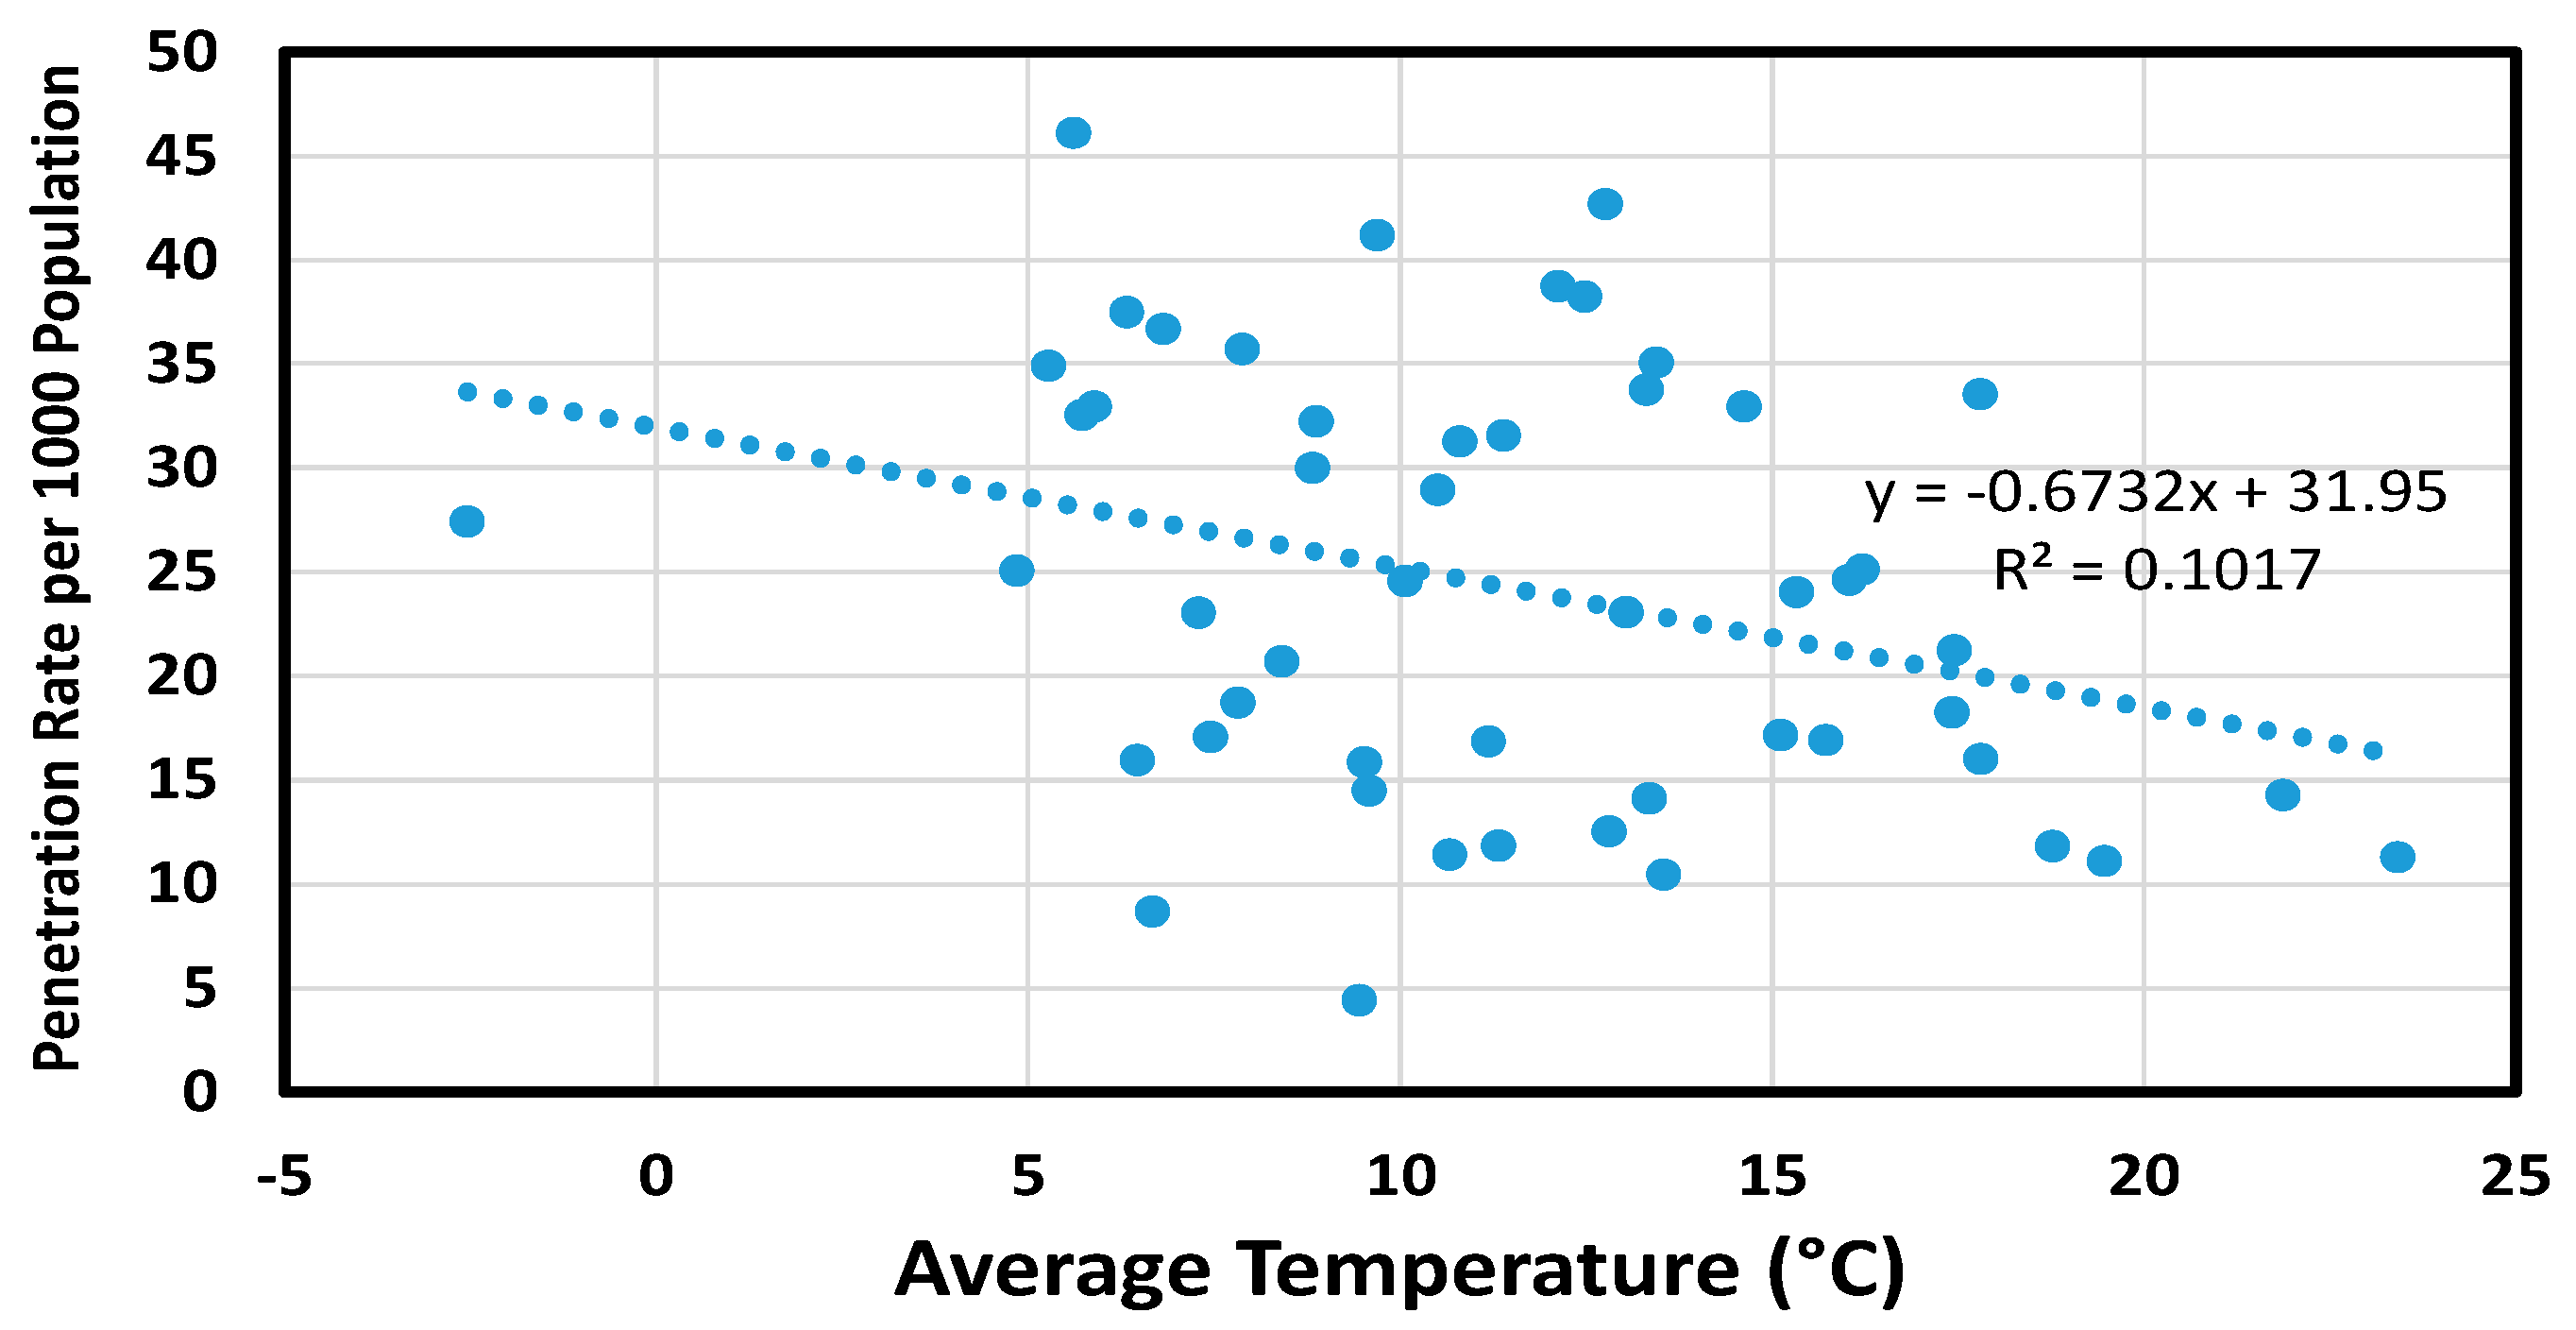
Our attempt at multivariate regression analysis will be discussed in the next section. Before that, we single out the effects of two independent variables that may have an impact on the utilization of mental health services: average temperature and the fraction of a state’s population that lives in urban areas. Beginning with average temperature, Figure 2 presents the penetration rate as a function of only the average temperature, for the time period 2007–2015.
The assumed linear correlation suggests that as temperature increases, the penetration rate decreases. However, there are other potentially confounding factors, including the other variables given in Table 2. We therefore divided the 50 states and the District of Columbia into six groups, ranging from the lowest average temperatures (−3 to 6 °C) to the highest average temperatures (17 to 23 °C). These grouped temperature results are presented in Figure 3 as a function of the year. Interestingly, the states with the lowest average temperatures show the highest penetration rates, while those with the highest temperature show the lowest. States with intermediate average temperatures fall between these two groups.
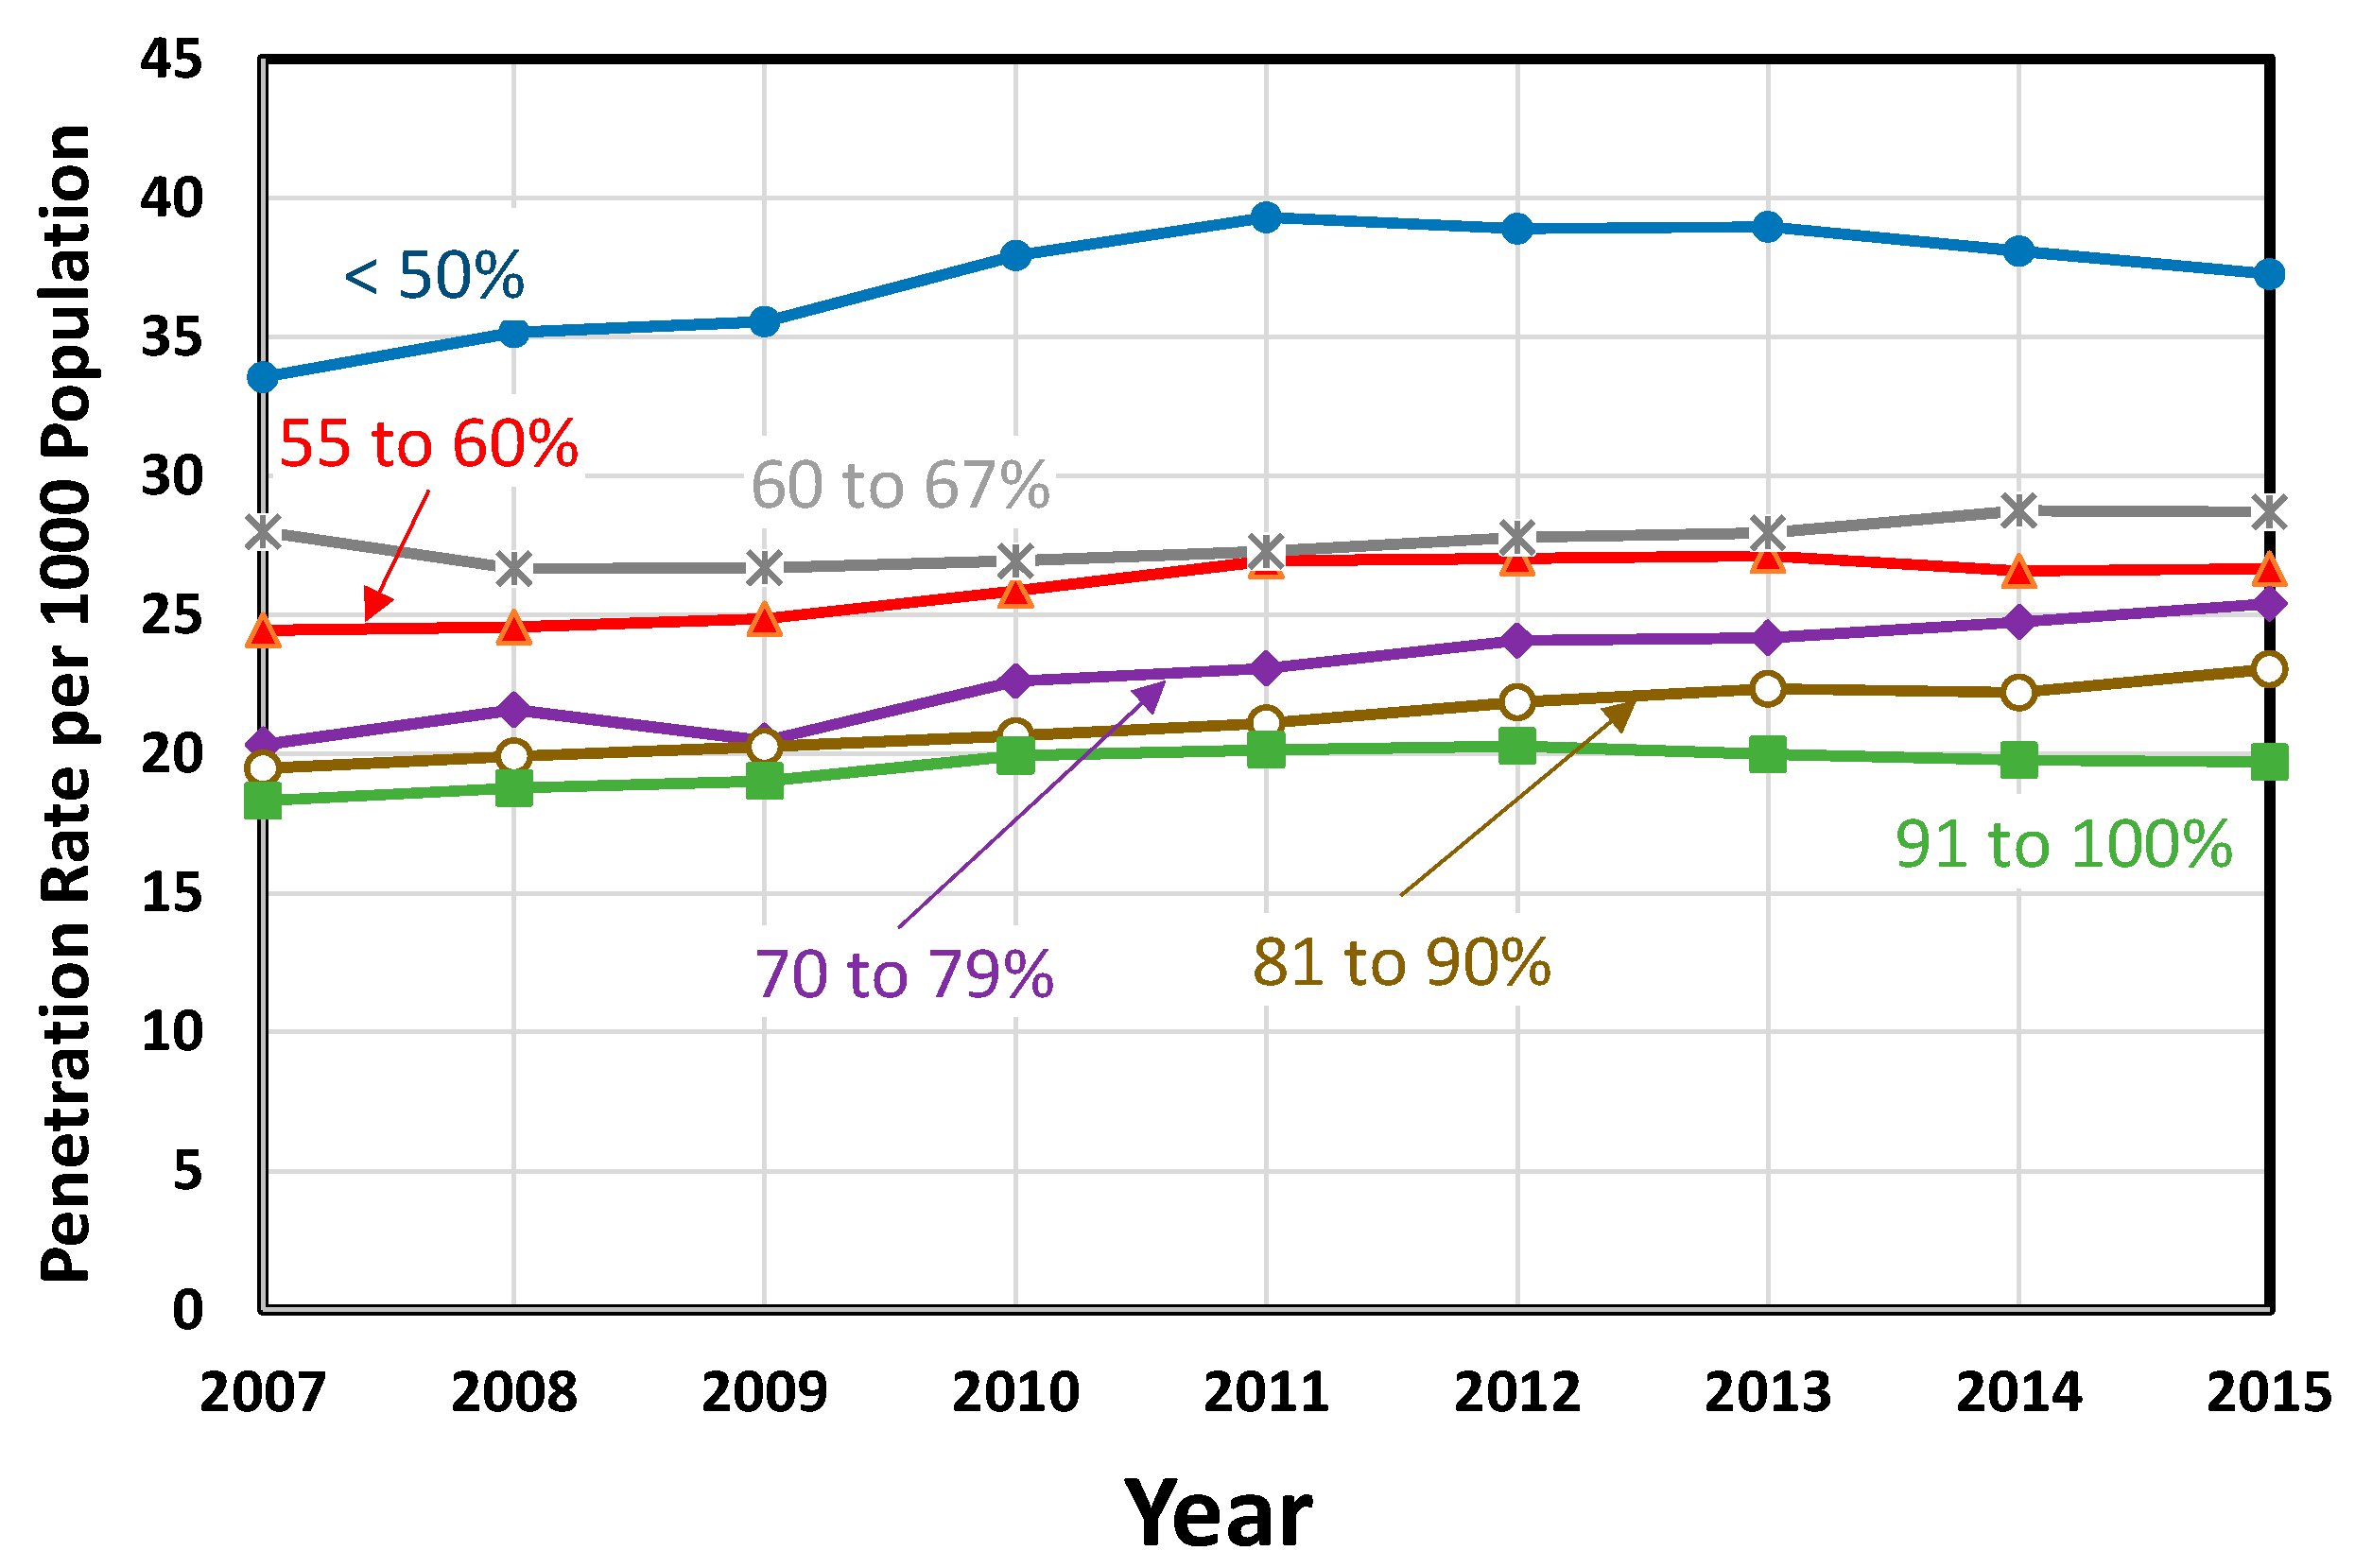
Another variable which appears to be important for mental health service utilization is the fraction, or percentage, of the population that lives in urban areas. Similar to the results in Figure 3, the 50 states plus the District of Columbia were divided into six groups, ranging from the least urbanized (less than 50%) to the most urbanized (91 to 100%). These results are plotted in Figure 4, again as a function of the year. Perhaps contrary to expectations, the more rural states exhibit the highest penetration rates, while the most urbanized exhibit the lowest.
A similar attempt was made to group the data by precipitation amount, but no clear dependence on precipitation was seen. This is in contrast to a previous study linking the amount of sunshine to suicide attempts [15], but it should be noted that the annualized data that we are considering makes it impossible to distinguish the amount of sunshine on any given day.
4. Multiple Linear Regression Attempt
Results of the multiple regression did not show any significant relationships between climate indicators and the rate of mental health service utilization (Table 3) as some of the studies earlier cited in this paper [3,4,5,6,7] suggested, but in agreement with [8]. The results derived from this study suggest that high temperatures do not necessarily correlate with an increased utilization of mental health services. The traditional factors that account for low mental health service utilization—such as one’s low perception of the need for services, lack of insurance, prohibitive cost of treatment, stigma, or even the perception that treatment would not help—may partially explain why a linear and strong correlation was not shown [16]. In addition, the regression analysis did not account for the lag time effect of high temperatures in service utilization rates, which was observed in [5]. This may have provided important insights on the gestation period when the interaction between high temperature and one’s emotional and behavioral well-being leads an individual to seek treatment. The analysis was also limited by the aggregate nature of the data, which did not allow for determining the duration of extreme temperatures (very low or very high).
An interesting observation from the regression is the suggested inverse relationship between average temperature and mental health penetration (utilization rate). As supported by the state data in Table 2, the states with lower average temperature have higher rates. That is, colder states report higher rates of mental health service utilization. Although this may not be totally surprising as explained by the condition of seasonal affective disorder, the limitation of the data as earlier cited was not able to confirm this explanation. Seasonal affective disorder (SAD) means that “some people experience a serious mood change during the winter months, when there is less natural sunlight. SAD is a type of depression. It usually lifts during spring and summer [17].”
5. Discussion
An analysis of USA state-wide annualized mental health data for the years 2007 through 2015 reveals that the states with the lowest average temperatures exhibit the highest utilization of mental health services, while the states with the highest average temperatures exhibit the lowest. Similarly, the most rural states have a higher utilization of mental health services than more urban states. An attempt at multivariate regression analysis did not yield statistically significant results, perhaps because the available mental health data are only available at the state-wide level and are given as annual averages, and therefore do not allow the effects of localized transient climatic conditions to be considered.
This study suggests that relationships are harder to determine when using aggregate data. This raises the concern on the usefulness of available secondary treatment data across all 50 US states when examining the impact of climate on mental health. Using primary data to examine the impact of climate on mental health is too costly, in effect becoming an obstacle for further inquiry on this subject matter. Lower units of analysis or disaggregated data such as person-level data on treatment, and episodes of treatment with time factor may all be helpful. Modification in data collection protocols may bring greater research capacity and more meaningful, conclusive findings.
6. Conclusions
An examination of statewide-aggregated mental health service utilization data in the USA revealed no statistically significant relationship between ambient temperature and penetration rate per 1000 population. Potentially confounding variables that were analyzed included precipitation, per capita gross domestic product, unemployment rate, and the percentage of the state’s population that lives in rural vs. urban areas. Although no statistically significant correlations were found with any of these variables, the results suggest that states with lower average temperatures and percent urbanization have populations with greater mental health service utilization. Analyzing disaggregated data, especially with finer time resolution, may allow quantitative relationships between mental health service utilization and these variables to be determined.
Author Contributions
Both authors contributed equally to the preparation of this report.
Conflicts of Interest
The authors declare no conflict of interest.
References
- Patz, J.; Frumkin, H.; Holloway, T.; Vimont, D.; Haines, A. Climate Change: Challenges and Opportunities for Global Health. JAMA 2014, 312, 1565–1580. [Google Scholar] [CrossRef] [PubMed]
- Golden, J.S.; Hartz, D.; Brazel, A.; Luber, G.; Phelan, P. A biometeorology study of climate and heat-related morbidity in phoenix from 2001 to 2006. Int. J. Biometeorol. 2008, 52, 471–480. [Google Scholar] [CrossRef] [PubMed]
- Huang, C.; Barnett, A.G.; Wang, X.; Vaneckova, P.; FitzGerald, G.; Tong, S. Projecting future heat-related mortality under climate change scenarios: A systematic review. Environ. Health Perspect. 2011, 119, 1681–1690. [Google Scholar] [CrossRef] [PubMed] [Green Version]
- Vida, S.; Durocher, M.; Ouarda, T.B.M.J.; Gosselin, P. Relationship between ambient temperature and humidity and visits to mental health emergency departments in Québec. Psychiatr. Serv. 2012, 63, 1150–1153. [Google Scholar] [CrossRef] [PubMed]
- Wang, X.; Lavigne, E.; Ouellette-kuntz, H.; Chen, B.E. Acute impacts of extreme temperature exposure on emergency room admissions related to mental and behavior disorders in Toronto, Canada. J. Affect. Disord. 2014, 155, 154–161. [Google Scholar] [CrossRef] [PubMed]
- Berry, H.L.; Bowen, K.; Kjellstrom, T. Climate change and mental health: A causal pathways framework. Int. J. Public Health 2010, 55, 123–132. [Google Scholar] [CrossRef] [PubMed]
- Williams, S.; Nitschke, M.; Sullivan, T.; Tucker, G.R.; Weinstein, P.; Pisaniello, D.L.; Parton, K.A.; Bi, P. Heat and health in Adelaide, South Australia: Assessment of heat thresholds and temperature relationships. Sci. Total Environ. 2012, 414, 126–133. [Google Scholar] [CrossRef] [PubMed]
- Fearnley, E.J.; Magalhães, R.J.S.; Speldewinde, P.; Weinstein, P.; Dobson, A. Environmental correlates of mental health measures for women in western Australia. EcoHealth 2014, 11, 502–511. [Google Scholar] [CrossRef] [PubMed]
- National Centers for Environmental Information. Climate at a Glance. Available online: https://www.ncdc.noaa.gov/cag/time-series/us/1/0/pcp/12/12/2007-2015?base_prd=true&firstbaseyear=2007&lastbaseyear=2015 (accessed on 7 January 2017).
- DASIS: Drug and Alcohol Services Information System, Substance Abuse and Mental Health Services Administration, U.S. Department of Health and Human Services. Available online: https://wwwdasis.samhsa.gov/dasis2/urs.htm (accessed on 7 January 2017).
- U.S. Bureau of Economic Analysis. Available online: https://www.bea.gov/ (accessed on 7 January 2017).
- U.S. Bureau of Labor Statistics. Available online: https://www.bls.gov/ (accessed on 7 January 2017).
- United States Census Bureau. Available online: https://www.census.gov/ (accessed on 7 January 2017).
- Baechler, M.C.; Gilbride, T.L.; Cole, P.C.; Hefty, M.G.; Ruiz, K. High-Performance Home Technologies: Guide to Determining Climate Regions by County; Technical Report PNNL-17211 Rev. 3; PNNL: Richland, WA, USA, 2015; Volume 7.3. [Google Scholar]
- Vyssoki, B.; Kapusta, N.D.; Praschak-Rieder, N.; Dorffner, G.; Willeit, M. Direct effect of sunshine on suicide. JAMA Psychiatr. 2014, 71, 1231–1237. [Google Scholar] [CrossRef] [PubMed]
- Anonymous. The NSDUH Report: Affordability Most Frequent Reason for not Receiving Mental Health Services; SAMHSA: Rockville, MA, USA, 2013. [Google Scholar]
- Seasonal Affective Disorder. Available online: https://www.mentalhealth.gov/what-to-look-for/mood-disorders/seasonal-affective-disorder/index.html (accessed on 7 January 2017).
Figure 1.
Average statewide temperatures, averaged over the years 2007 to 2015, with error bars showing the average maximum and minimum temperatures during the same period.
Figure 1.
Average statewide temperatures, averaged over the years 2007 to 2015, with error bars showing the average maximum and minimum temperatures during the same period.

Figure 2.
Penetration rate as a function of the statewide average temperature, averaged over the years 2007 to 2015.
Figure 2.
Penetration rate as a function of the statewide average temperature, averaged over the years 2007 to 2015.

Figure 3.
Penetration rate as a function of the average temperature, over the period 2007 to 2015.
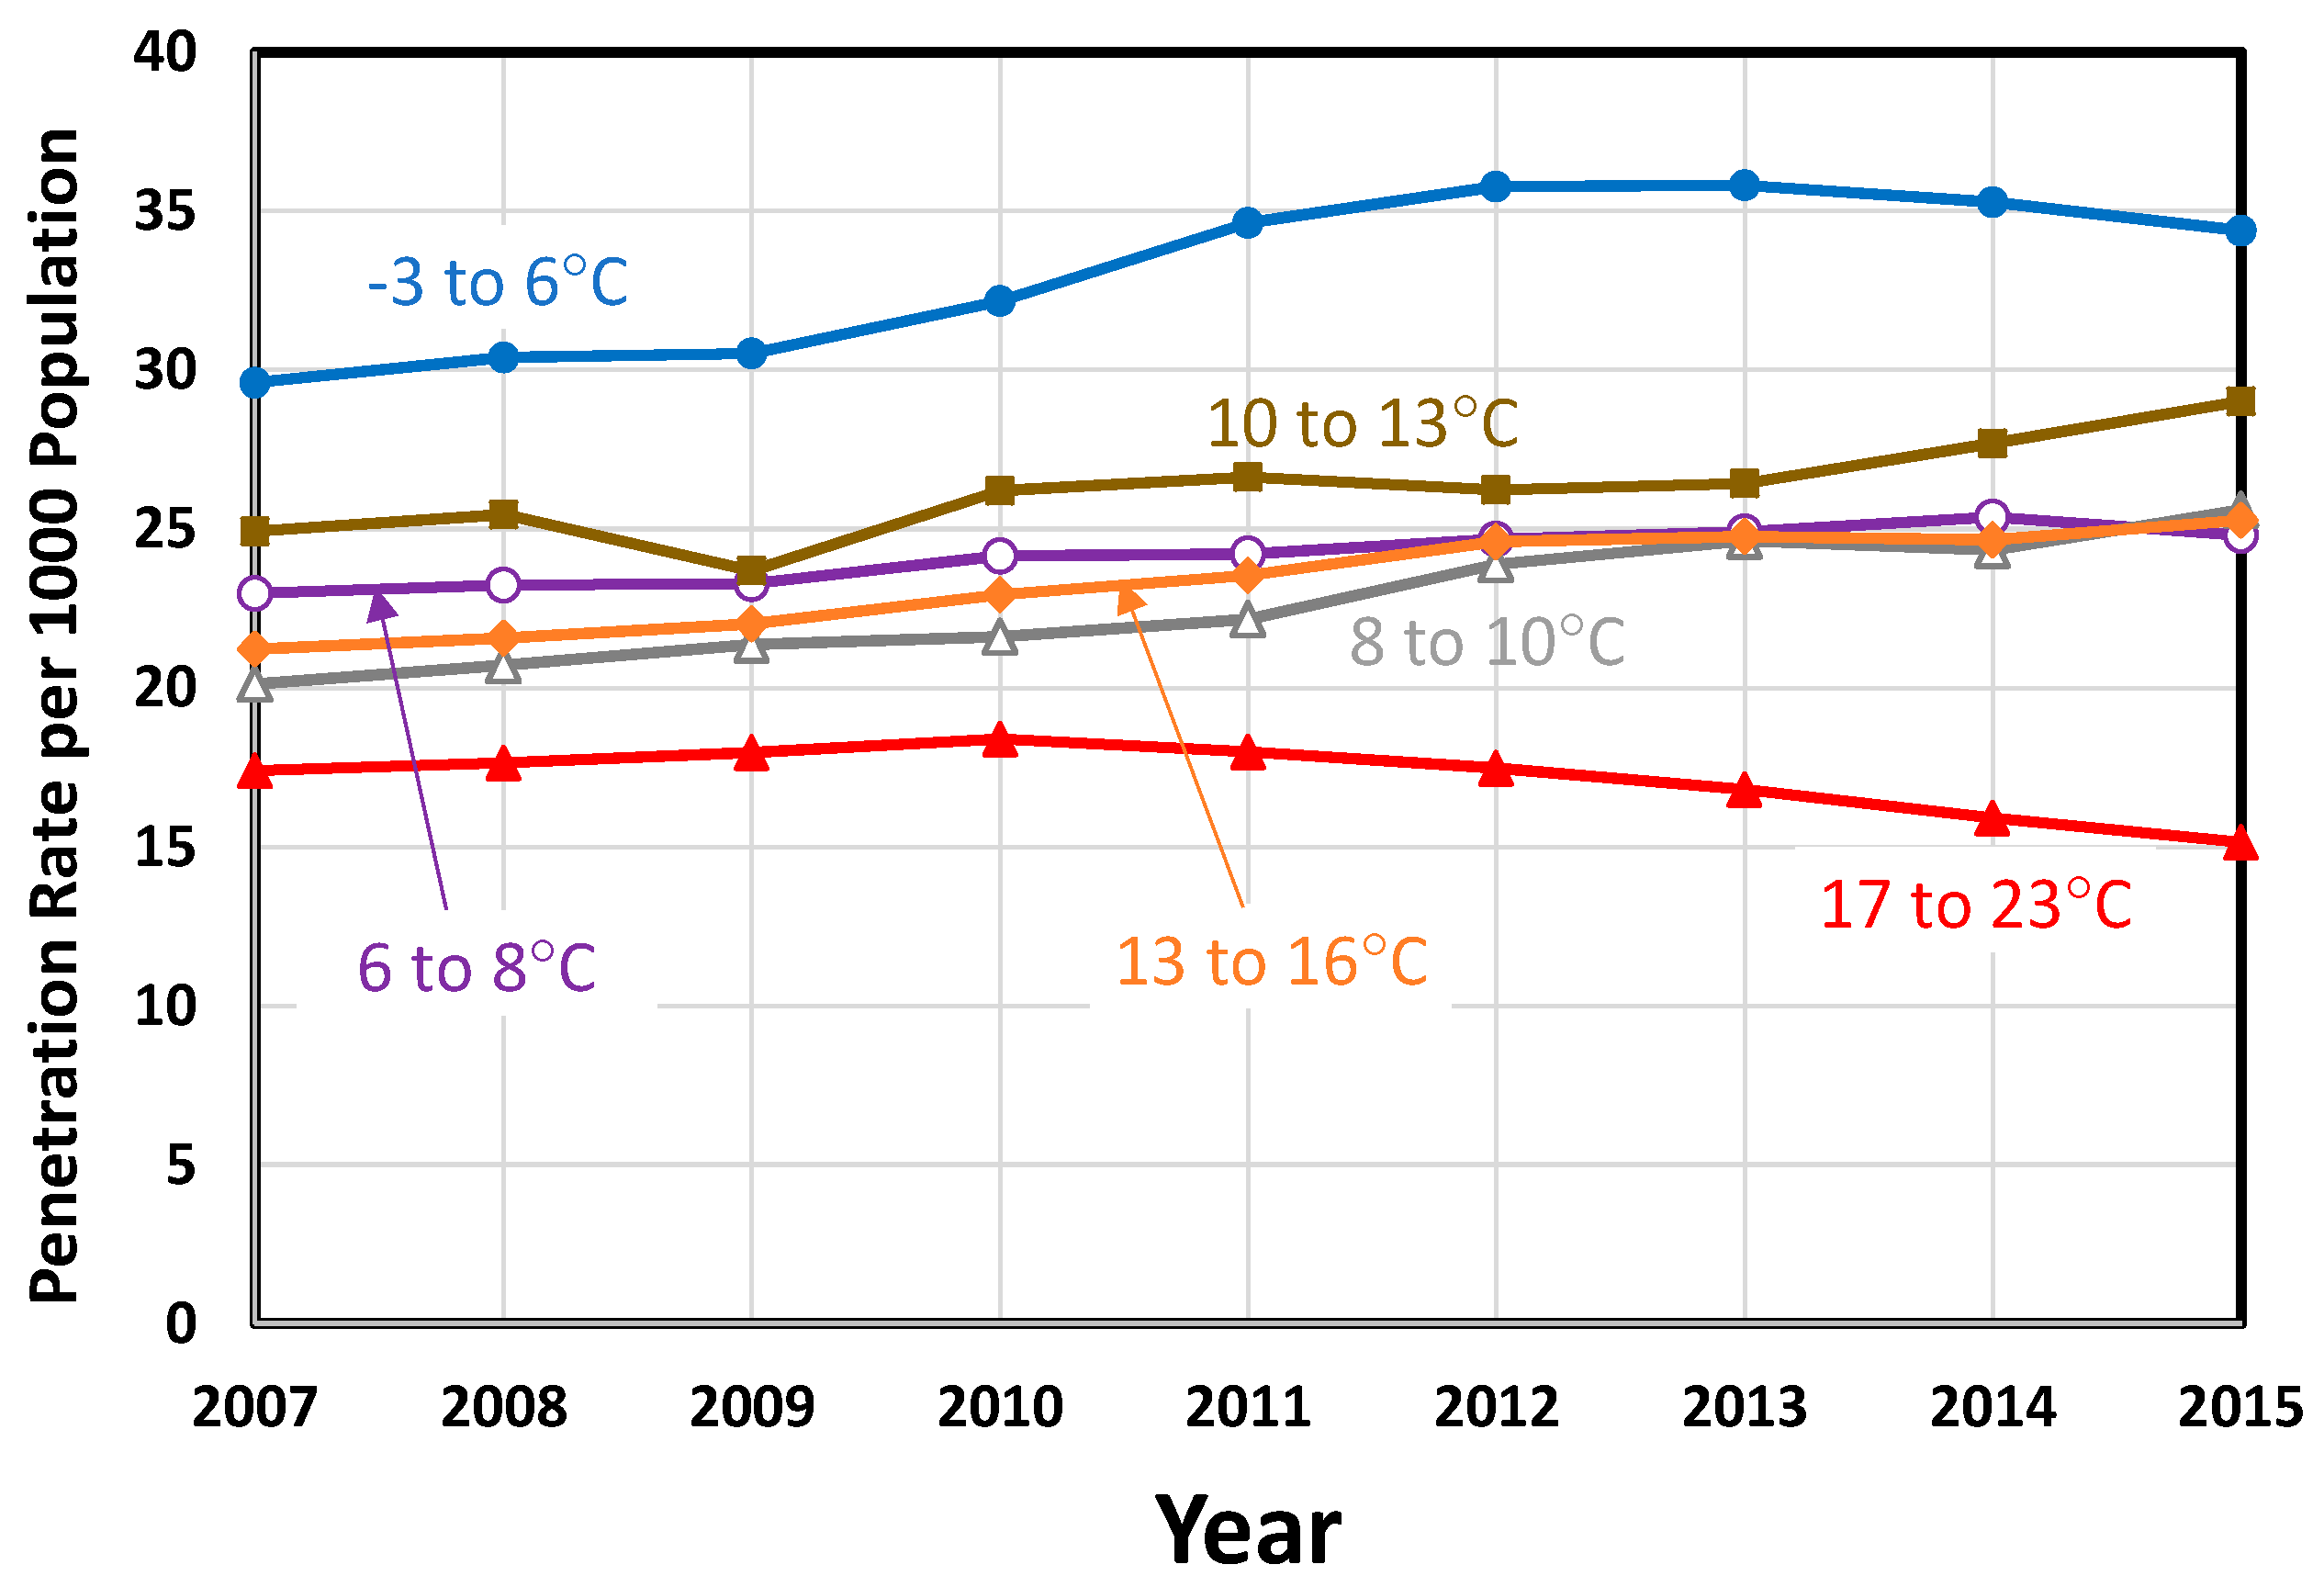
Figure 4.
Penetration rate as a function of the percentage of the population that lives in urban areas, over the period 2007 to 2015.
Figure 4.
Penetration rate as a function of the percentage of the population that lives in urban areas, over the period 2007 to 2015.

Table 1.
Annual data (2007–2015) for three representative USA states.
| ARIZONA | ||||||||
| Year | Ave. Temp.* (°C) | Min. Temp.* (°C) | Max. Temp.* (°C) | Precipitation (cm) | Per Capita Real GDP ($) | Percent Urban (%) | Unemploy-ment Rate (%) | Penetration Rate per 1000 Population |
| 2007 | 16.44 | 8.50 | 24.39 | 27.91 | $44,168 | 3.9 | 23.35 | |
| 2008 | 15.89 | 7.94 | 23.83 | 31.27 | $41,800 | 5.9 | 22.32 | |
| 2009 | 16.17 | 8.11 | 24.17 | 17.86 | $38,232 | 10.0 | 24.44 | |
| 2010 | 15.78 | 8.06 | 23.44 | 35.33 | $37,935 | 89.81 | 10.4 | 25.63 |
| 2011 | 15.72 | 7.72 | 23.78 | 24.46 | $38,257 | 9.5 | 25.34 | |
| 2012 | 16.72 | 8.56 | 24.89 | 24.28 | $38,559 | 8.2 | 28.86 | |
| 2013 | 15.83 | 7.94 | 23.67 | 30.81 | $38,303 | 8.0 | 29.27 | |
| 2014 | 16.83 | 8.89 | 24.72 | 28.12 | $38,427 | 7.0 | 23.85 | |
| 2015 | 16.56 | 8.89 | 24.17 | 36.55 | $38,414 | 6.0 | 23.03 | |
| AVERAGES | 16.22 | 8.29 | 24.12 | 28.51 | $39,344 | 89.81 | 7.7 | 25.12 |
| OHIO | ||||||||
| Year | Ave. Temp.* (°C) | Min. Temp.* (°C) | Max. Temp.* (°C) | Precipitation (cm) | Per Capita Real GDP ($) | Percent Urban (%) | Unemploy-ment Rate (%) | Penetration Rate per 1000 Population |
| 2007 | 11.28 | 5.50 | 17.00 | 104.55 | $44,399 | 5.6 | 26.97 | |
| 2008 | 10.33 | 4.61 | 16.11 | 112.01 | $43,548 | 6.5 | 28.01 | |
| 2009 | 10.28 | 4.72 | 15.89 | 92.71 | $41,593 | 10.3 | 29.49 | |
| 2010 | 10.94 | 5.28 | 16.61 | 93.37 | $42,667 | 77.92 | 10.1 | 30.77 |
| 2011 | 11.28 | 5.94 | 16.61 | 142.11 | $44,192 | 8.7 | 31.45 | |
| 2012 | 12.22 | 6.33 | 18.17 | 94.69 | $44,896 | 7.2 | 31.63 | |
| 2013 | 10.50 | 5.17 | 15.83 | 105.89 | $45,254 | 7.6 | 33.08 | |
| 2014 | 9.56 | 3.94 | 15.17 | 97.94 | $46,385 | 5.6 | 34.46 | |
| 2015 | 10.89 | 5.22 | 16.61 | 109.27 | $46,826 | 4.9 | 35.80 | |
| AVERAGES | 10.81 | 5.19 | 16.44 | 105.84 | $44,418 | 77.92 | 7.4 | 31.30 |
| MINNESOTA | ||||||||
| Year | Ave. Temp.* (°C) | Min. Temp.* (°C) | Max. Temp.* (°C) | Precipitation (cm) | Per Capita Real GDP ($) | Percent Urban (%) | Unemploy-ment Rate (%) | Penetration Rate per 1000 Population |
| 2007 | 5.78 | 0.06 | 11.56 | 74.19 | $51,351 | 4.6 | 16.61 | |
| 2008 | 4.11 | −1.78 | 10.06 | 69.44 | $51,234 | 5.5 | 31.37 | |
| 2009 | 4.50 | −1.17 | 10.17 | 67.01 | $48,884 | 7.8 | 34.13 | |
| 2010 | 6.06 | 0.28 | 11.78 | 84.94 | $50,148 | 73.27 | 7.3 | 36.87 |
| 2011 | 5.56 | −0.11 | 11.28 | 61.85 | $50,875 | 6.5 | 39.25 | |
| 2012 | 7.33 | 1.33 | 13.39 | 66.47 | $51,272 | 5.8 | 41.45 | |
| 2013 | 4.06 | −1.61 | 9.72 | 73.69 | $51,999 | 4.9 | 38.47 | |
| 2014 | 3.72 | −1.89 | 9.33 | 73.96 | $53,005 | 4.0 | 37.01 | |
| 2015 | 6.39 | 0.67 | 12.11 | 74.83 | $53,380 | 3.8 | 39.04 | |
| AVERAGES | 5.28 | −0.47 | 11.04 | 71.82 | $51,350 | 73.27 | 5.6 | 34.91 |
* “Ave. Temp.” = Average Temperature, “Min. Temp.” = Minimum Temperature, “Max. Temp.” = Maximum Temperature
Table 2.
Average statewide data for the years 2007–2015.
| State | Ave. Temp. (°C) | Min.Temp. (°C) | Max. Temp. (°C) | Precipitation (cm) | Per Capita Real GDP ($) | % Urban Population | Unemployment Rate (%) | Penetration Rate per 1000 Population |
|---|---|---|---|---|---|---|---|---|
| ALABAMA | 17.46 | 11.05 | 23.88 | 140.57 | $36,496 | 59.04 | 7.69 | 21.24 |
| ALASKA | −2.54 | −6.75 | 1.67 | 94.31 | $69,488 | 66.02 | 7.14 | 27.42 |
| ARIZONA | 16.22 | 8.29 | 24.12 | 28.51 | $39,344 | 89.81 | 7.66 | 25.12 |
| ARKANSAS | 16.04 | 10.02 | 22.06 | 136.38 | $35,232 | 56.16 | 6.93 | 24.62 |
| CALIFORNIA | 15.12 | 8.01 | 22.23 | 46.58 | $53,871 | 94.95 | 8.94 | 17.17 |
| COLORADO | 7.83 | 0.13 | 15.54 | 45.93 | $50,752 | 86.15 | 6.28 | 18.74 |
| CONNECTICUT | 10.07 | 4.50 | 15.64 | 122.11 | $65,003 | 87.99 | 7.19 | 24.57 |
| DELAWARE | 13.55 | 8.07 | 19.03 | 113.88 | $63,336 | 83.30 | 6.44 | 10.45 |
| FLORIDA | 21.87 | 16.02 | 27.72 | 132.49 | $39,238 | 91.16 | 7.66 | 14.29 |
| GEORGIA | 17.81 | 11.41 | 24.21 | 124.84 | $43,195 | 75.07 | 7.96 | 16.00 |
| HAWAII | 23.42 | 19.27 | 27.55 | 108.22 | $49,805 | 91.93 | 5.30 | 11.28 |
| IDAHO | 6.67 | 0.06 | 13.30 | 58.59 | $35,193 | 70.58 | 6.36 | 8.68 |
| ILLINOIS | 11.32 | 5.69 | 16.96 | 109.31 | $51,776 | 88.49 | 8.03 | 11.86 |
| INDIANA | 11.19 | 5.51 | 16.88 | 112.95 | $43,399 | 72.44 | 7.46 | 16.87 |
| IOWA | 8.87 | 3.11 | 14.62 | 96.42 | $47,425 | 64.02 | 4.88 | 32.26 |
| KANSAS | 12.76 | 5.78 | 19.75 | 72.51 | $45,414 | 74.20 | 5.51 | 42.70 |
| KENTUCKY | 13.44 | 7.34 | 19.56 | 128.41 | $37,883 | 58.38 | 7.79 | 35.09 |
| LOUISIANA | 19.47 | 13.62 | 25.29 | 142.49 | $45,830 | 73.19 | 6.52 | 11.10 |
| MAINE | 5.61 | 0.05 | 11.18 | 123.63 | $38,127 | 38.66 | 6.56 | 46.13 |
| MARYLAND | 13.04 | 7.48 | 18.60 | 113.52 | $53,622 | 87.20 | 6.03 | 23.09 |
| MASSACHUSETTS | 9.46 | 3.88 | 15.01 | 126.15 | $61,643 | 91.97 | 6.50 | 4.43 |
| MICHIGAN | 7.29 | 1.78 | 12.81 | 86.66 | $40,287 | 74.57 | 9.04 | 23.04 |
| MINNESOTA | 5.28 | −0.47 | 11.04 | 71.82 | $51,350 | 73.27 | 5.58 | 34.91 |
| MISSISSIPPI | 17.80 | 11.51 | 24.07 | 143.16 | $31,838 | 49.35 | 8.34 | 33.54 |
| MISSOURI | 12.81 | 6.84 | 18.77 | 115.50 | $42,366 | 70.44 | 7.03 | 12.53 |
| MONTANA | 5.90 | −0.88 | 12.67 | 49.40 | $38,284 | 55.89 | 5.69 | 32.96 |
| NEBRASKA | 9.59 | 2.57 | 16.62 | 63.55 | $50,261 | 73.13 | 3.86 | 14.50 |
| NEVADA | 10.67 | 3.01 | 18.33 | 23.64 | $45,451 | 94.20 | 9.43 | 11.41 |
| NEW HAMPSHIRE | 6.81 | 0.89 | 12.73 | 127.81 | $48,675 | 60.30 | 4.83 | 36.69 |
| NEW JERSEY | 12.12 | 6.60 | 17.64 | 123.36 | $55,895 | 94.68 | 7.51 | 38.74 |
| NEW MEXICO | 12.49 | 4.06 | 20.91 | 33.77 | $40,579 | 77.43 | 6.63 | 38.25 |
| NEW YORK | 7.88 | 2.38 | 13.39 | 113.34 | $61,476 | 87.87 | 7.00 | 35.72 |
| NORTH CAROLINA | 15.33 | 9.19 | 21.45 | 123.45 | $43,734 | 66.09 | 7.94 | 24.04 |
| NORTH DAKOTA | 4.85 | −1.40 | 11.10 | 50.05 | $58,332 | 59.90 | 3.29 | 25.06 |
| OHIO | 10.81 | 5.19 | 16.44 | 105.84 | $44,418 | 77.92 | 7.39 | 31.30 |
| OKLAHOMA | 15.72 | 9.02 | 22.44 | 91.21 | $41,410 | 66.24 | 5.24 | 16.91 |
| OREGON | 8.83 | 2.35 | 15.28 | 79.61 | $48,781 | 81.03 | 8.12 | 30.00 |
| PENNSYLVANIA | 9.70 | 4.00 | 15.39 | 114.82 | $47,462 | 78.66 | 6.68 | 41.20 |
| RHODE ISLAND | 10.51 | 5.30 | 15.70 | 123.79 | $46,315 | 90.73 | 8.86 | 28.97 |
| SOUTH CAROLINA | 17.42 | 11.07 | 23.77 | 118.10 | $36,043 | 66.33 | 8.32 | 18.27 |
| SOUTH DAKOTA | 7.46 | 0.80 | 14.10 | 56.02 | $46,320 | 56.65 | 4.01 | 17.08 |
| TENNESSEE | 14.63 | 8.51 | 20.78 | 136.27 | $40,887 | 66.39 | 7.63 | 32.97 |
| TEXAS | 18.77 | 11.81 | 25.73 | 69.54 | $49,971 | 84.70 | 6.09 | 11.82 |
| UTAH | 9.52 | 2.34 | 16.72 | 33.67 | $42,799 | 90.58 | 5.14 | 15.88 |
| VERMONT | 6.33 | 0.60 | 12.04 | 122.98 | $42,431 | 38.90 | 4.96 | 37.50 |
| VIRGINIA | 13.35 | 7.30 | 19.40 | 113.47 | $51,656 | 75.45 | 5.44 | 14.11 |
| WASHINGTON | 8.41 | 3.04 | 13.77 | 109.87 | $54,012 | 84.05 | 7.30 | 20.71 |
| WEST VIRGINIA | 11.39 | 5.33 | 17.44 | 117.64 | $35,385 | 48.72 | 6.84 | 31.55 |
| WISCONSIN | 6.47 | 0.74 | 12.19 | 85.88 | $45,195 | 70.15 | 6.51 | 15.95 |
| WYOMING | 5.73 | −1.48 | 12.94 | 41.20 | $63,715 | 64.76 | 4.82 | 32.55 |
| DISTRICT OF COLUMBIA | 13.31 | 7.63 | 19.00 | 104.88 | $164,536 | 100.00 | 8.17 | 33.78 |
Table 3.
Regression statistics when considering all dependent variables.
| SUMMARY OUTPUT (All Variables) | |||||
| Regression Statistics | |||||
| Multiple R | 0.54 | ||||
| R Square | 0.29 | ||||
| Adjusted R Square | 0.17 | ||||
| Standard Error | 9.48 | ||||
| Observations | 51 | ||||
| ANOVA | |||||
| df | SS | MS | F | Significance F | |
| Regression | 7 | 1551.28 | 221.61 | 2.46 | 0.03 |
| Residual | 43 | 3867.19 | 89.93 | ||
| Total | 50 | 5418.47 | |||
| Coefficients | Standard Error | t Stat | p-Value | ||
| Intercept | 11.55 | 25.24 | 0.46 | 0.65 | |
| Average Temperature (°C) | −116.43 | 212.08 | −0.55 | 0.59 | |
| Minimum Temperature (°C) | 56.32 | 106.29 | 0.53 | 0.60 | |
| Maximum Temperature (°C) | 59.37 | 105.85 | 0.56 | 0.58 | |
| Precipitation (cm) | 0.08 | 0.08 | 1.07 | 0.29 | |
| Per Capita Real GDP ($) | 0.00 | 0.00 | 1.51 | 0.14 | |
| % Urban Population | −0.26 | 0.13 | −1.94 | 0.06 | |
| Unemployment Rate | 1.03 | 1.13 | 0.91 | 0.37 | |
© 2017 by the authors. Licensee MDPI, Basel, Switzerland. This article is an open access article distributed under the terms and conditions of the Creative Commons Attribution (CC BY) license (http://creativecommons.org/licenses/by/4.0/).
Share and Cite
MDPI and ACS Style
Phelan, P.E.; Phelan, B.E. Relationship between Ambient Temperature and Mental Health in the USA. Environments 2017, 4, 71. https://doi.org/10.3390/environments4040071
AMA Style
Phelan PE, Phelan BE. Relationship between Ambient Temperature and Mental Health in the USA. Environments. 2017; 4(4):71. https://doi.org/10.3390/environments4040071
Chicago/Turabian StylePhelan, Patrick E., and Bernadette E. Phelan. 2017. "Relationship between Ambient Temperature and Mental Health in the USA" Environments 4, no. 4: 71. https://doi.org/10.3390/environments4040071
Note that from the first issue of 2016, this journal uses article numbers instead of page numbers. See further details here.