Diffusive Uptake Rates of Volatile Organic Compounds on Standard ATD Tubes for Environmental and Workplace Applications


Division of Epidemiology, Biostatistics and Environmental Health, School of Public Health, University of Memphis, Memphis, TN 38152, USA
*
Author to whom correspondence should be addressed.
Environments 2017, 4(4), 87; https://doi.org/10.3390/environments4040087
Submission received: 28 October 2017
/
Revised: 23 November 2017
/
Accepted: 2 December 2017
/
Published: 5 December 2017
Abstract
:Passive sampling for airborne volatile organic compounds (VOCs) has gained popularity; however, diffusive uptake rates (URs) have been experimentally determined for only a small subset of VOCs. This study aims to develop empirical models that can interpolate effective URs (UReff) for a wide range of VOCs. The modelling was based on the standard automated thermal desorption (ATD) tubes packed with Tenax TA and targeted the sampling efficiency (α), defined as the ratio between the ideal UR (URideal) and UReff. Available experimentally determined URs were compiled from literature. Method detection limits were determined on a thermal desorption-gas chromatography/mass spectrometry (TD-GC/MS) system. The 8-h UReff can be modeled with retention volumes or boiling points (BPs) and the biases were within ±20%. The α for 7-day UReff can be estimated by the model: α = 0.3626 Ln(BP) − 1.2324. The 8-h and 7-day UReff values were then compiled for 75 VOCs commonly encountered in the environmental and occupational settings. The TD analytical method showed high precision, linearity and sensitivity, suitable for measuring indoor and outdoor VOCs. The approach and data presented here are anticipated to ease passive monitoring of VOCs for the general users.
1. Introduction
Volatile organic compound (VOC) contamination represents a health concern in indoor, outdoor and occupational environments [1,2]. Current exposure and risk assessment of VOCs requires representative exposure measurements, which are achieved by large sample sizes and frequent and long-term sampling [3]. For example, the U.S. Environmental Protection Agency (EPA) requires monitoring programs to collect air samples once every 6 or 12 days [4]. Sample sizes of several hundred are common in large survey studies, e.g., Relationship of Indoor, Outdoor and Personal Air (RIOPA) study [5], National Health and Nutrition Examination Surveys (NAHANES) [6] and urban air toxics studies [7]. Thus, there is a critical need for simple, low-cost and reliable VOC measurement methods to realistically evaluate public health risks and regulation compliance.
Passive sampling is a widely used sampling technique for determining time-weighted average concentrations of airborne VOCs [8,9]. There are three major types of passive samplers: axial tube-type sampler, badge sampler and radial sampler. The stainless-steel automated thermal desorption (ATD) tube has been widely employed since it offers some clear advantages compared to other methods [10]. First, the field sampling is very easy: the methods only requires removal and replacement of sealing caps and does not require a pump as opposed to the active sampling method. Second, these small samplers are easy and inexpensive for shipping and storage, in comparison to bulky canisters favored by the U.S. EPA [4]. Third, the laboratory analysis of ATD tubes is simple with the latest thermal desorption-gas chromatography/mass spectrometry (TD-GC/MS) instrumentation. The major ATD systems—e.g., Markes International, PerkinElmer and Gerstel—are all equipped with an internal standard addition module that allows analyzing tubes with minimum or no sample preparation. Fourth, ATD tube-type samplers are preferred over badge samplers for the high sensitivity, low background, no need for extraction solvents and reusability for over 100 desorption times. In summary, passive sampling with ATD tubes can reduce field and lab staff’s burden, save the cost and obtain high quality analytical performance.
The most challenging step in passive sampling is to determine the sampling rates or diffusive uptake rates (URs) [11]. ATD tubes offer the greatest flexibility for users to select sorbents and determine tube configuration but at the same time, add complexity to the UR determination. Many studies have determined URs from the diffusion theory [12], in laboratory chambers [13,14,15,16] and by comparing active and passive sampling in the field [17,18]. Many factors influence URs, including sorbent selection, tube configuration, exposure duration and environmental conditions. The effective UR (UReff) is preferred as theoretically derived URs display large biases in the field [19]. Unfortunately, only a small subset of VOCs has their UReff values determined and validated in laboratory and/or field. The determination requires complex instruments, well-controlled laboratory environments and time-consuming field tests, making it impractical for the general users to determine URs experimentally.
The stainless-steel ATD tubes are the most popular, industry standard tubes for VOC sampling. Use of ATD tubes could be traced back to 1970s and tens of studies have applied and/or validated the passive sampling using ATD tubes. Many organizations have established standards based on ATD tubes [20,21], e.g., ISO 16017-2 [22], ASTM D6196 [23], EPA325b [24] and TO-17 [25] methods. However, even the most comprehensive reviews and compilations cover URs for limited numbers of compounds for each specific tube configuration and these URs were determined mainly for occupational applications. Current analytical laboratories are capable of analyzing tens of compounds, as standard mixtures containing >70 compounds are commercially available and GC/MS can be calibrated to analyze these compounds in one single injection. It is then an imperative task to determine UReff values for new compounds without laboratory or field experiments. This study aims to develop models that can estimate UReff values with available UR measurements and physicochemical properties. We then determine the method detection limits (MDLs) with the state-of-the-art TD-GC/MS system for a wide range of VOCs commonly found in community and occupational settings. We also make recommendations for passive sampling with ATD tubes.
2. Methods
2.1. The Passive Diffusion Theory
The theory for the passive diffusion process, primarily defined by the Fick’s First Law, has been well established and studied [19,26]. For a specific VOC, the ideal uptake rate (URideal, in mL/min) is determined as:
where D = the diffusion coefficient of the compound (cm2/s), A = the cross-sectional area of the tube (cm2), L = the air gap between the sampling end of the tube and the surface of sorbent (cm) and 60 = the conversion coefficient from mL/s to mL/min. D is a physical property of the chemical that can be experimentally determined or modelled. URideal can be theoretically calculated for any compound given a certain tube geometry of A/L. In reality, the UReff differs considerably from the URideal due to volatility of the chemical, weak sorbent, back diffusion and sorbent saturation during long-term sampling [19,27]. UReff is a percentage of URideal and this percentage can be defined as the sampling efficiency α:
UReff = α URideal
The key is to determine α for any given exposure duration, e.g., 8 h or 7 days.
2.2. Standard ATD Tubes
The standard ATD sorbent tube has a dimension of 89 mm long × 6.4 mm o.d. × 5 mm i.d. When in use, the sampler has, from the sampling end, a diffusion cap, an air gap, a retaining gauze mesh, a sorbent bed, another retaining gauze and a spring (Figure 1). Note:
- (1)
- The air gap (L) is 15 mm between the sampling end and sorbent surface when a diffusion cap is fitted. The UR changes with or without the diffusion cap, as it changes the air gap [28]. It is recommended to use the diffusion cap during passive sampling, as it prevents the convective transport of chemical molecules.
- (2)
- The cross-sectional diffusion area (A) is 0.196 cm2. The retaining gaze has a pore size of 80 mesh and the wire is 0.21 mm in diameter, giving an effective area of 46% of the full area by calculation. Previous studies [15,18] assumed full cross-sectional diffusion area without considering the effective area on the retaining gauze. This assumption is questionable; however, it does not impact the determination of UReff, since UReff is not determined directly from the tube geometry, rather, by experiments or modelling as presented later.
- (3)
- The sorbent tube is packed with only one sorbent for the passive sampling purpose. The multisorbent configuration is not necessary, as the later sorbent layers do not contact compounds. Tenax TA is the most common sorbent due to its high thermal stability, low inherent artifacts and degradation, hydrophobicity and accommodation for wide volatility [29,30]. It also allows efficient desorption and displays optimal GC performance when used as a chromatographic stationary phase. An ATD tube is typically packed with 150–250 mg of Tenax TA, allowing both active and passive sampling.
Thus, this study estimates UReff values for standard ATD tubes packed with 200 mg of Tenax TA, with L = 1.5 cm and A = 0.196 cm2. These parameters agree with those listed in a previous study [15]. The standard tubes are commercially available from a number of vendors, e.g., Markes International Inc. (Llantrisant, UK), PerkinElmer Inc. (Waltham, MA, USA), Sigma-Aldrich (St. Louis, MO, USA) and Camsco Inc. (Houston, TX, USA).
2.3. Diffusion Coefficients
Diffusion coefficients (Ds) can be obtained from many chemical properties handbooks. U.S. EPA developed a user-friendly on-line diffusion coefficient calculator [31]. This online tool uses three models to estimate the D for a chemical based on its molecular structure and boiling point [32]. The three models give very close estimates and thus the average of three estimates was used in this study. D does not change with respect to chemical concentrations or the sorbent but is dependent on temperature. DT at any absolute temperature (T) is calculated as a function of D298 at 25 °C (298 K):
DT = D298 (T/298)1.75
2.4. Modeling Short-Term Effective Uptake Rates
For short-term (8 h) sampling in workplaces, the work by European Standards, Measurements and Testing Programme (SMT) shows that α has an empirical linear relationship with logarithm retention volume (Vg, in L) [33]:
8h-α = 0.154 Log10Vg + 0.4
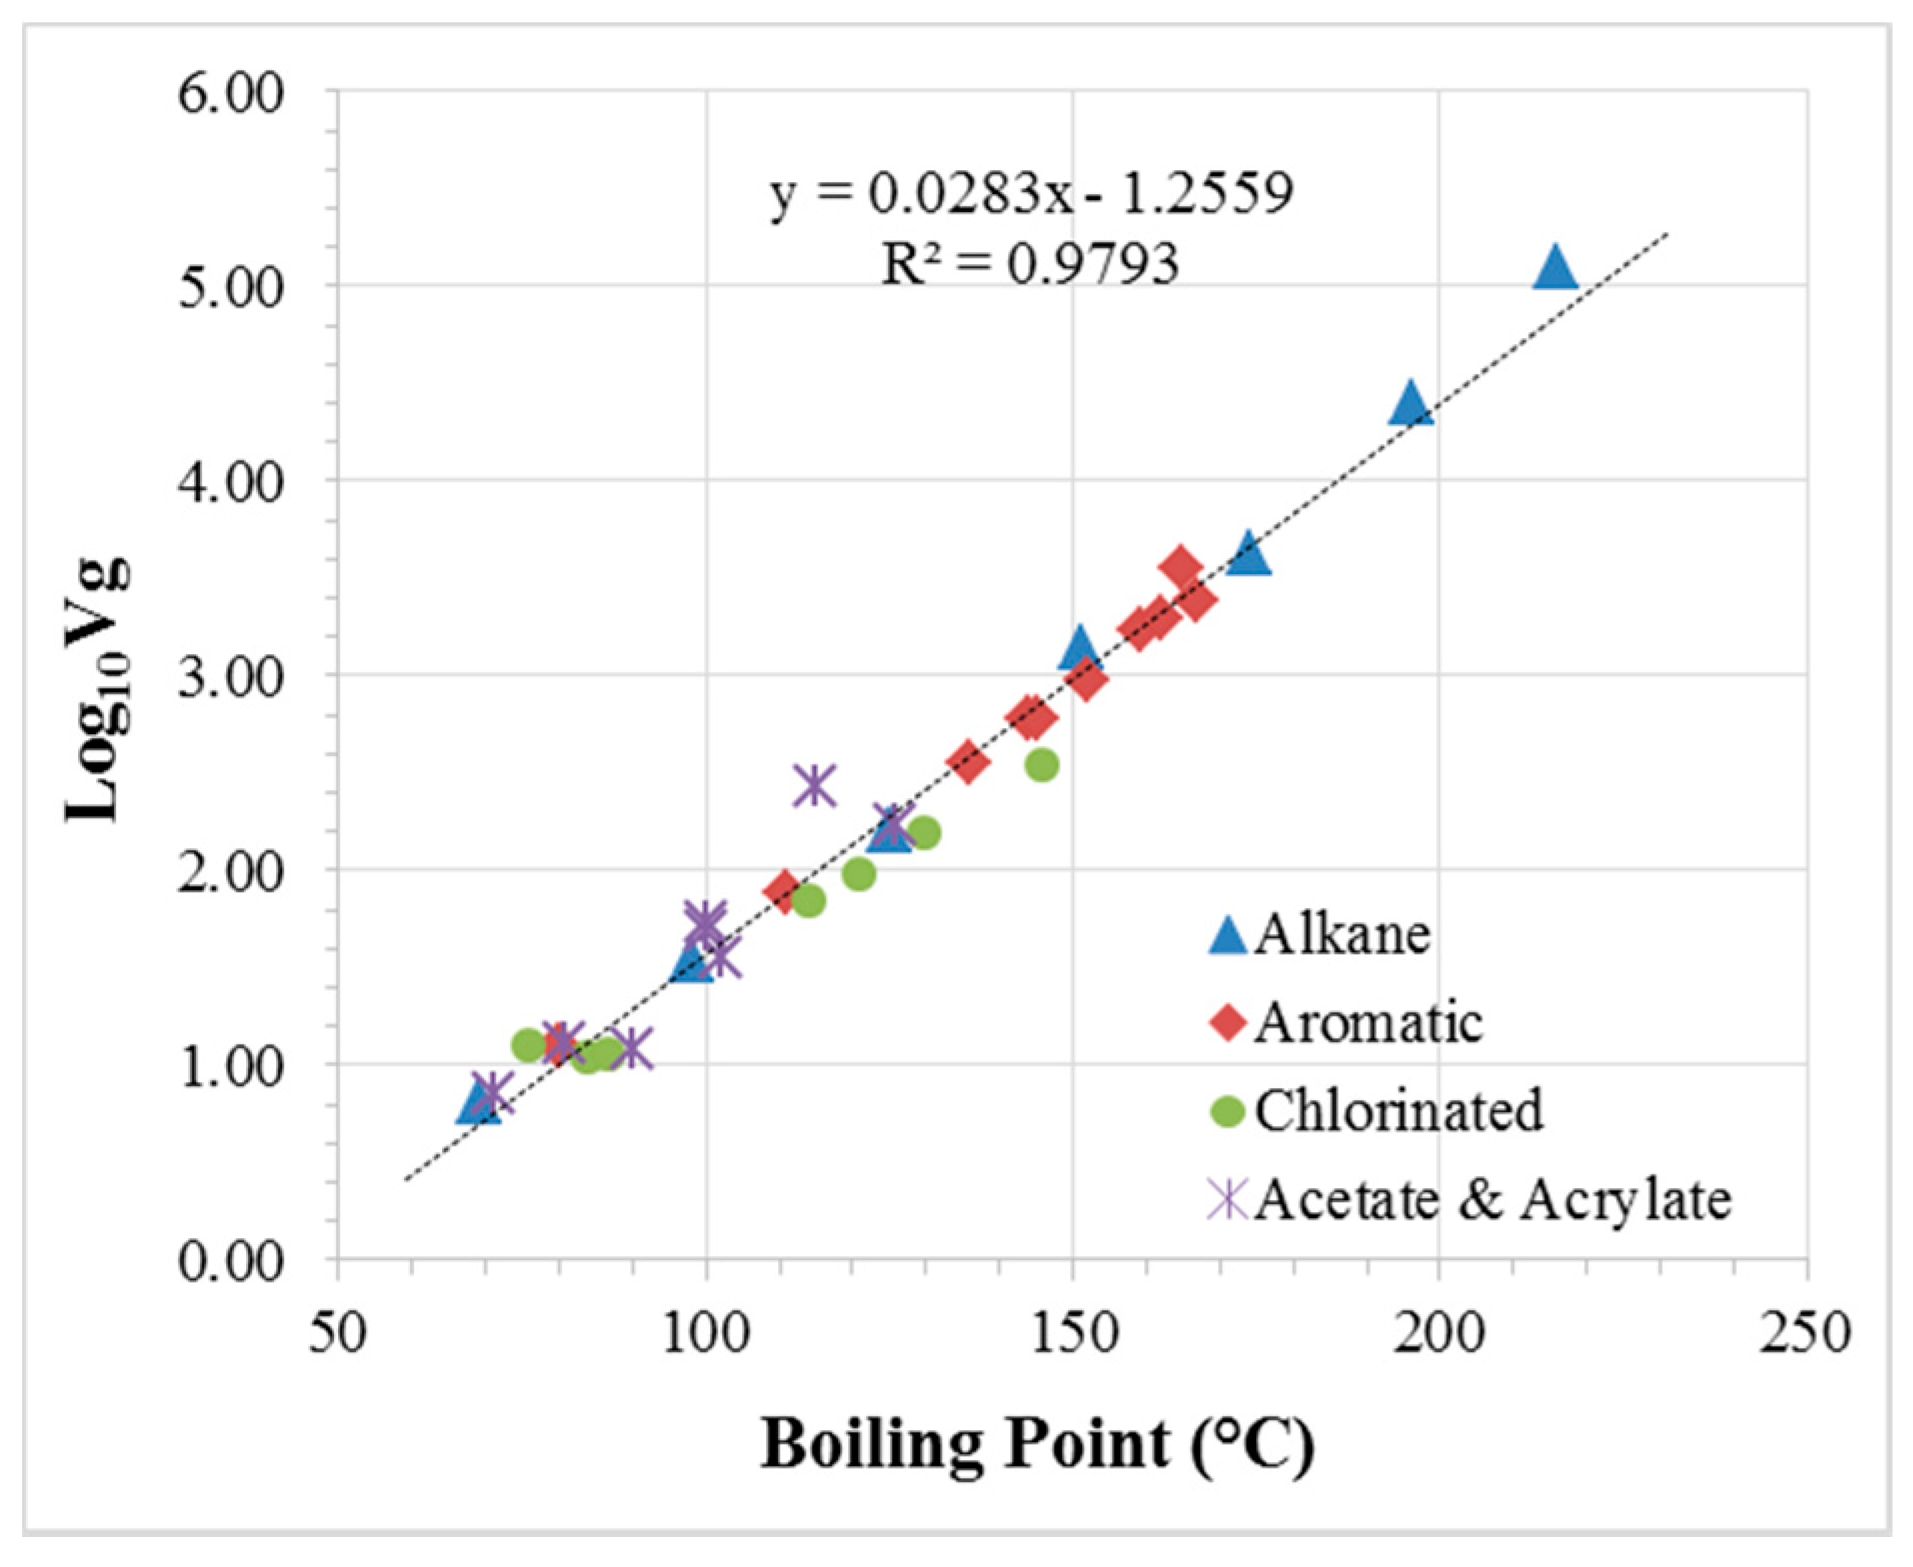
Vg values are available for many common VOCs in the latest ASTM protocol [23]. If it is unavailable, Vg can be experimentally determined following an established protocol [34]. Brown and Purnell’s fundamental work shows that Log10Vg and boiling point (BP, in °C) are highly correlated for most VOCs [35]. We then fitted Log10Vg against BP using the Vg data in the ASTM protocol. Log10Vg and BP displayed close relationships for alkanes, aromatics, chlorinated compounds, acetates and acrylates:
Log10Vg = 0.0283 × BP − 1.2559
The regression line showed high linearity (R2 = 0.98, Figure 2). Thus, Vg can be interpolated for these chemical groups if direct Vg measurements are unavailable.
The performance of modeling 8h-UReff using Equations (4) was then evaluated by comparing modeled UReff against measured UReff. This comparison used 25 compounds that had both measured 8h-UReff and Vg values from the ASTM protocol [23]. We also evaluated model performance for 47 compounds whose Vg values were unavailable but could be modeled by Equation (5). The measured 8h-UReff values were taken from the manufacturer’s application note [36], which summarized URs from over 10 data sources. All the data were summarized in Table A1. A relative bias of ±20% was considered acceptable.
2.5. Modeling Long-Term Effective Uptake Rates
For long-term (7 days) environmental sampling, we used URs from Walgraeve et al.’s study [18]. This study determined 7d-UReff values on standard Tenax TA ATD tubes for a total of 25 VOCs commonly found in indoor and outdoor air (Table A2). Most of the VOC measurements were below 10 µg/m3, with a few up to 150 µg/m3. Although many studies measured URs in chamber, a recent study recommended field calibration [37]. We propose the following three models:
Model (1) assumes 7d-α to be a constant across all the compounds for a given exposure duration. With calculated URideal and measured UReff, we can derive 7d-α by regressing UReff against URideal. The UReff for another compound will then be calculated by multiplying its URideal by 7d-α. This approach has been reported in two previous studies [38,39].
Model (2) assumes 7d-α to be a variable dependent on volatility and exposure duration. This is particularly true when much lower UReff values have been observed for more volatile compounds and on weak sorbents like Tenax during long-term sampling periods [40,41]. Similar to Equation (4), we propose that 7d-α be expressed as a linear function of BP:
7d-α = β0 + β1 BP
Model (3) is similar to Model (2) but we propose that 7d-α be expressed as a linear function of Ln(BP):
7d-α = β0 + β1 Ln(BP)
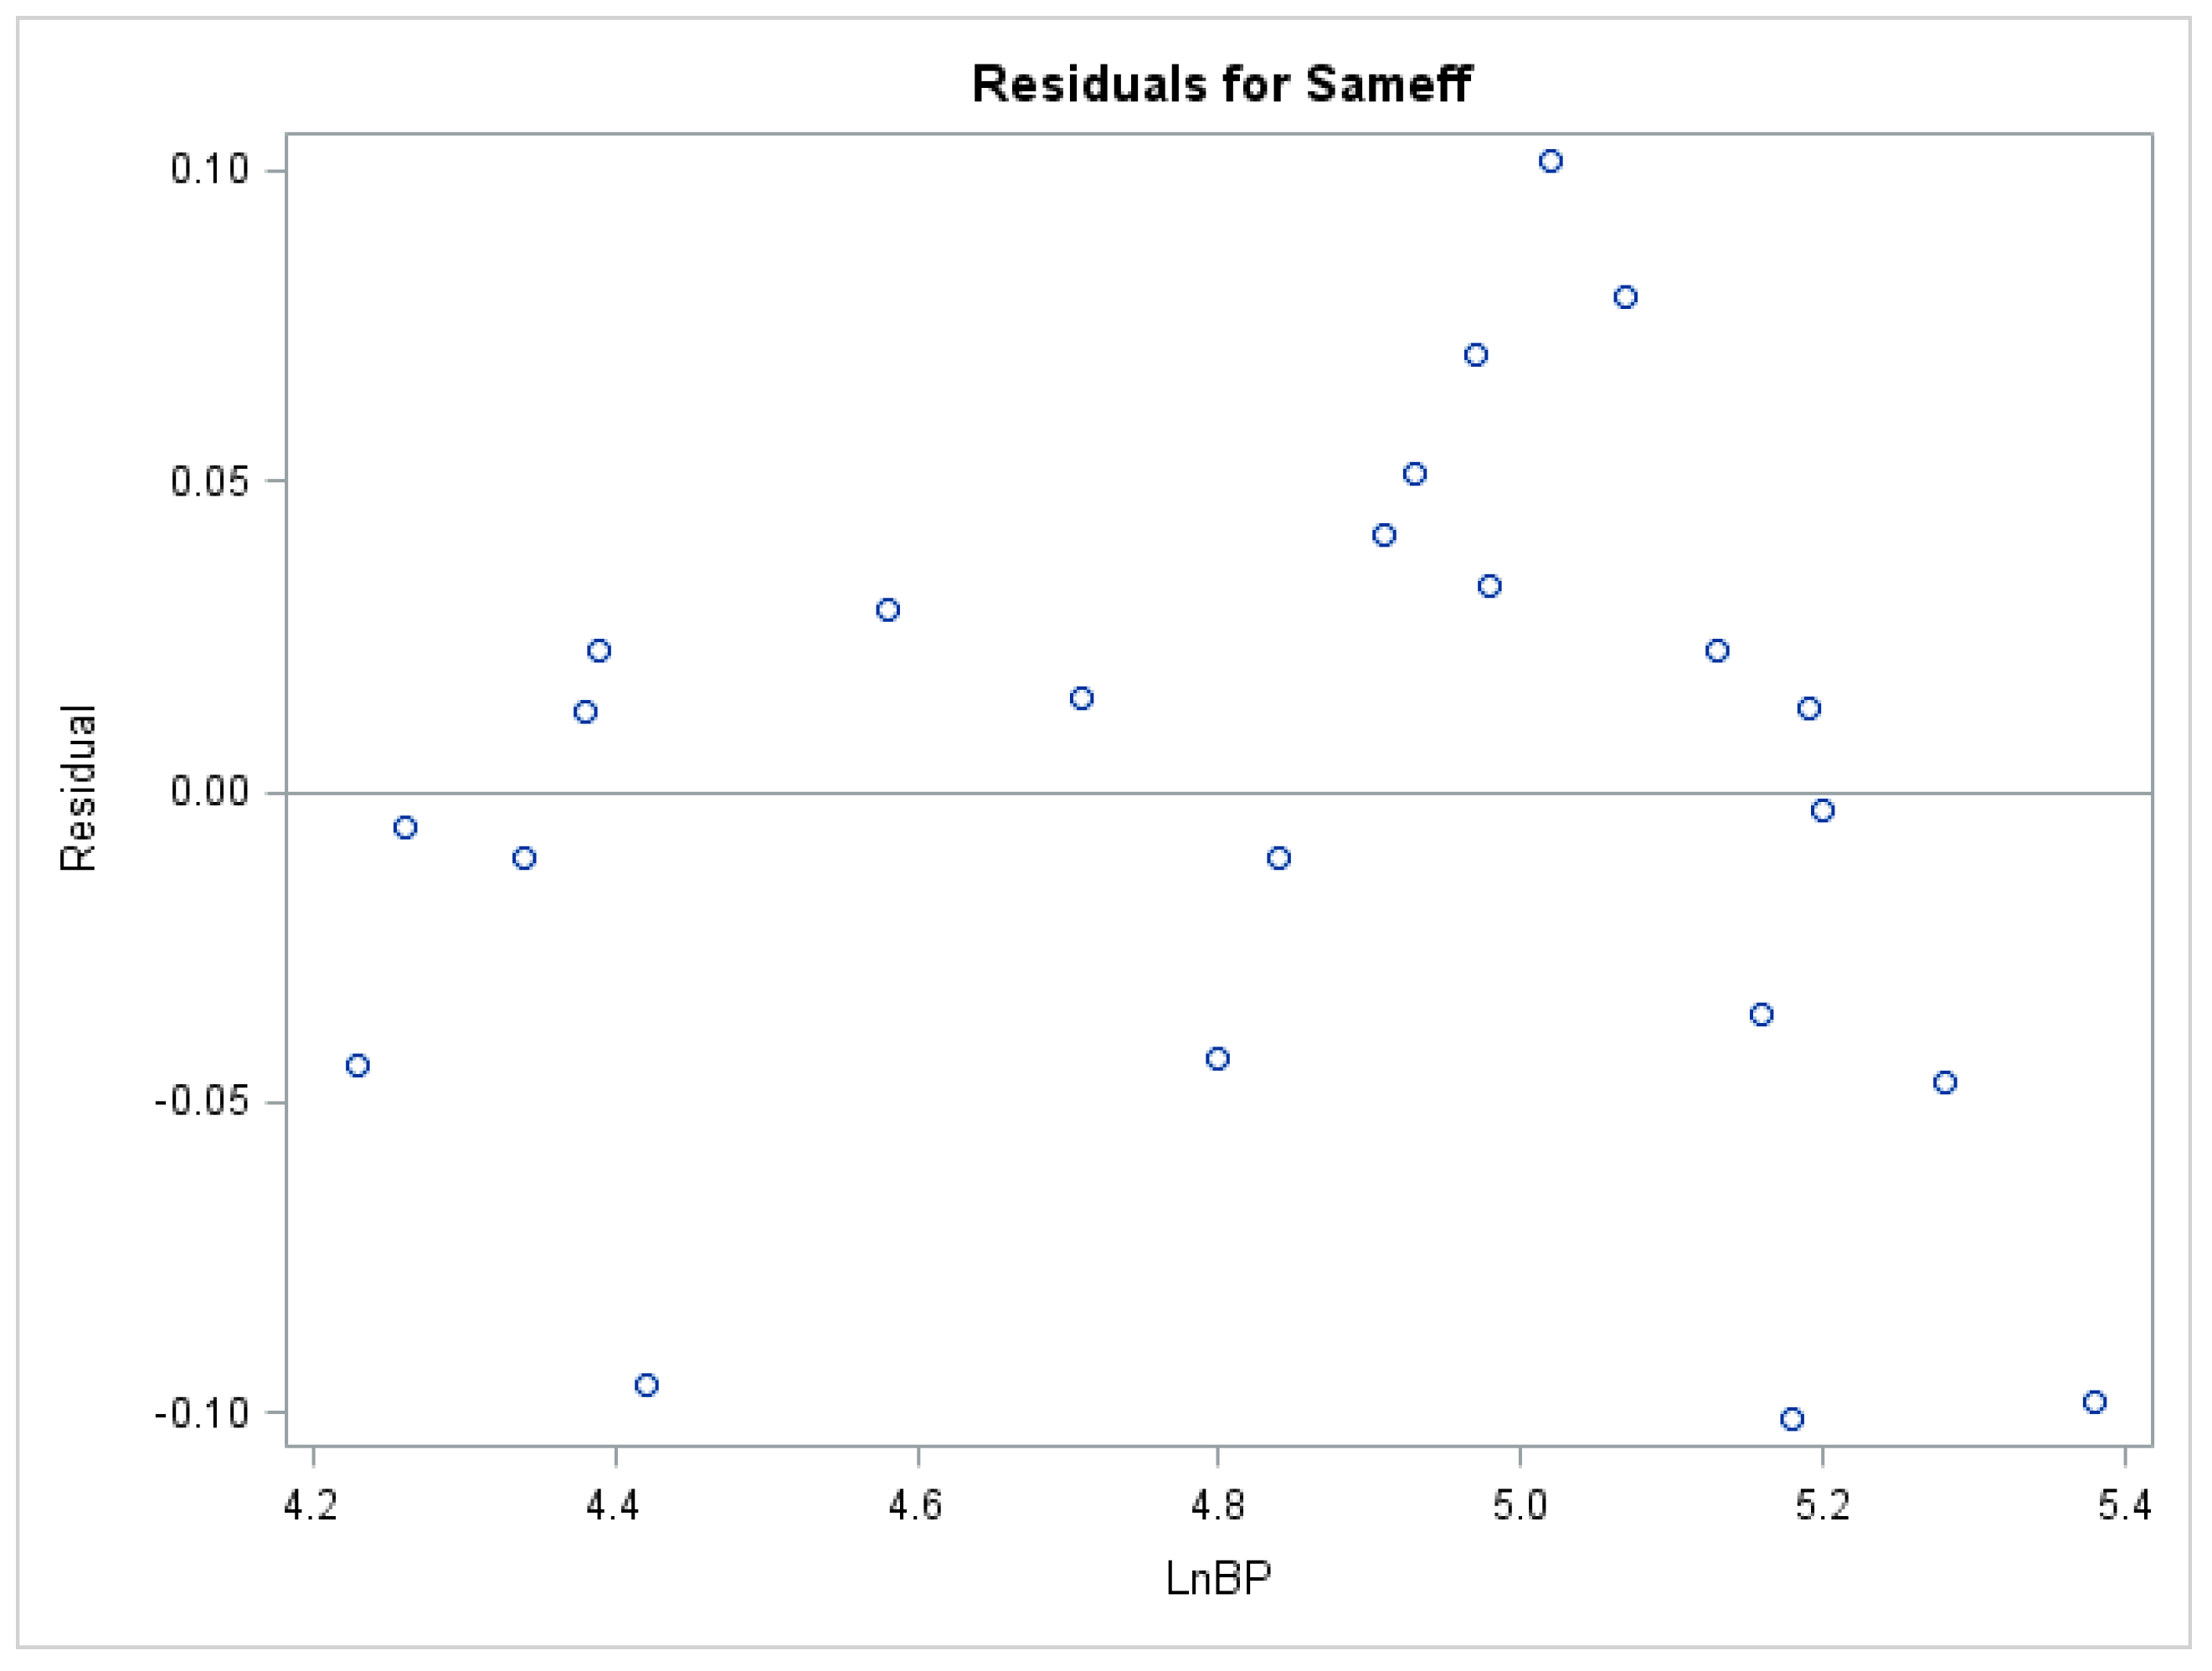
The 7d-α was calculated by dividing UReff by URideal for each compound. To fit Model (1), we regressed UReff against URideal without constant. To fit Models (2) and (3), we regressed 7d-α against BP or Ln(BP), respectively. We found a low UReff for α-pinene and treated it as an outlier and excluded it from Model (1) fitting. The low UReff of α-pinene might be caused by decomposition on Tenax during sampling [42] and storage [43]. We also excluded hexanal as the relationship between log10Vg and BP was not established for aldehydes due to lack of data [35]. We conducted regression analyses in Microsoft Excel and SAS (Version 9.4, SAS Institute Inc., Cary, NC, USA). The best-fit models were selected by checking the regression lines and regression R2. The linear relationship was confirmed by checking the pattern of residual points in the linear regression residual plot.
2.6. Determination of MDLs
Laboratory performance tests were conducted to determine the method detection limits (MDLs) of passive VOC sampling using ATD tubes followed by TD-GC/MS analysis. VOC standard solutions were prepared using EPA 524 VOC Mix (Part #: 502111, Sigma-Aldrich), EPA 524 Rev. 4 Update Mix, Part #: 47427-U, Sigma-Aldrich), C7–C17 alkanes (Part #: 49451-U, Sigma-Aldrich) and individual pure chemicals from Sigma-Aldrich. These compounds included aromatic, halogenated, aliphatic and terpenoid compounds, most listed as hazardous air pollutants (HAPs) by the U.S. EPA. Series solutions were prepared at 0.2, 0.5, 1.0, 5.0, 10, 40 and 200 µg/mL in methanol.
A Tenax TA ATD tube (Catalog No. C1-AXXX-5003, Markes International, Llantrisant, UK) was spiked with 1.0 µL of the solution on a calibration solution loading rig (Model: CSLR, Markes International, Llantrisant, UK) with a helium purge flow of 60 mL/min. After the spiking, the tube was retained on the rig for 3 min to ensure all the analytes were delivered and most of the solvent was purged. The spiked tubes were then placed in the autosampler of a TD system (ULTRA 2 + UNITY 2, Markes International, Llantrisant, UK). The TD was connected to a GC/MS system (Agilent 7890A/5975C, Agilent, Santa Clara, CA, USA). Conditions of the TD-GC/MS analysis were summarized in Table 1. An HP-5MS Ultra Inert GC column was used as it had low bleeding, good separation and fast elution [44]. After analysis, a list of 75 target compounds were identified and confirmed using NIST 2005 Spectral Library in ChemStation.
The calibration was established by analyzing all the 7 concentrations for each compound. The linearity was assessed by the R2 of the linear regression line. We also calculated the relative standard deviation (RSD, in %) of 7 relative response factors (RRFs). RRF at a calibration level is determined as follows:
where AS = peak area for quantitation ion of the target compound; AIS = peak area for quantitation ion of the assigned internal standard compound; CS = concentration of the target compound; CIS = concentration of the assigned internal standard compound. The RSD of RRFs calculated at 7 calibration levels was then calculated as:
RSD (in %) = Standard deviation of (7 RRFs)/Mean (7 RRFs) × 100%
An R2 of ≥0.99 and RSD of ≤30% were considered acceptable [4]. Duplicate analyses were conducted for each calibration level to determine the duplicate precision, expressed as percent difference:
where X1 = First measurement value; X2 = Second measurement value; and = Average of the two values. The lowest concentration of 0.2 µg/mL was analyzed 7 times to determine the MDL. The MDL was calculated by multiplying standard deviation of 7 determined masses by 3.14, the one-sided student’s T value at 99% confidence corresponding to 7 spikes analyzed.
The tube preparation, cleaning and handling strictly followed the manufacturer’s instructions. The MS was tuned following the tuning procedure before the analysis. A number of blank tubes were analyzed to check if the tubes had background contamination.
3. Results
3.1. Effective Uptake Rates (UReff) for Short-Term Workplace Sampling
Short-term UReff on Tenax ATD tubes can be modeled using available Vg or BP values with acceptable biases. In Figure 3, Modeled 8h-UReff values based on Vg values were all within ±20% of the measured 8h-UReff values, except for C9–C12 alkanes (Table A1). If direct Vg values were unavailable, 8h-UReff values were modeled using BP and the modeled values were within ±20% of the measured 8h-UReff values for most compounds. Besides the chemical groups referred by Figure 2, we found 8h-UReff values estimated by Equations (4) and (5) also applied to ketones and α-pinene. The models did not work for C9–C16 straight-chain alkanes or naphthalene though.
3.2. Effective Uptake Rates for Long-Term Environmental Sampling
Models for estimating long-term UReff in environmental sampling are compared in Figure 4. In Model (1), the 7d-UReff had an average sampling efficiency (α) of 0.49 (Figure 4A), meaning UReff is only half of the URideal on average. However, the scatter plot between UReff and URideal did not show a simple linear relationship. In contrast, Models (2) and (3) indicated a good linear relationship between 7d-α and BP (in °C, Figure 4B,C). Comparing the R2 of Models (2) and (3) showed that Model (3), i.e., Ln(BP) as a predicting variable, gave better fitting. The points of residual plot from Model (3) were randomly distributed (Figure A1), confirming that a linear relationship between 7d-α and LnBP was appropriate. We also tried BP in absolute temperature as a predicting variable in Model (3) but obtained a lower R2 of 0.80. Thus, the 7-day passive sampling efficiency can be calculated using the following empirical equation:
7d-α = 0.3626 Ln(BP) − 1.2324
3.3. Compilation of Ideal and Effective URs
For the convenience of use, we calculated diffusion coefficients at 25 °C (D298) for 75 common VOCs and then determined their 7d- and 8h-UReff values, as summarized in Table 2. UReff values of other compounds can be derived using Equations (4), (5) and (11). In short-term workplace sampling, the median 8h-UReff is 0.47 mL/min (min–max: 0.25–0.68 mL/min), corresponding to 0.23 L (0.12–0.33 L) of sampling volumes. In long-term environmental sampling, the median 7d-UReff is 0.32 mL/min (0.13–0.43 mL/min), resulting in a median sampling volume of 3.2 L (1.3–4.3 L) at 25 °C.
3.4. Analytical Performance and MDLs
The retention times (RTs) ranged from 1.907 min to 14.118 min for the 75 target compounds (Table 3). These RTs had variations within ±0.1 min. Blank tubes did not show any target VOCs except for trace levels of benzene, toluene, ethyl benzene and xylenes (BTEX, <0.1 ng). The average duplicate precision over the calibration range was within 10% for most compounds. The high percent differences for a few compounds were mainly caused by poor precisions at low concentrations. The R2 of linear calibration curves were all above 0.99 and most were above 0.999. RSDs of linear curves were all within 30% except for a few polar compounds, e.g., tetrahydrofuran, phenol and nitrobenzene. The MDLs ranged from 0.02 to 0.16 ng and this range indicted that the spiked amount (0.2 ng) met the criterion that it should be between MDL and 10-fold MDL [4]. Based on the 8-h and 7-day sampling rates, the MDLs can be expressed as 0.01 to 0.05 µg/m3 for 7-day environmental sampling and 0.08 to 0.86 µg/m3 for 8-h workplace sampling. The sample quantitation limits (SQLs) can be derived from MDLs as an SQL is defined as 3.18 times the MDL concentration [4].
4. Discussion
We developed empirical models that can estimate UReff values for a wide range of VOCs. Previous work developed Freundlich isotherm models [47,48], multilayer saturation models [12,49] and several computer programs [50,51]. However, the complexity and unavailability of parameters or programs impede the easy adoption of these models. Our models were an attempt to simplify the modeling process with reasonable biases. The relative biases of modeled 7d-UReff values were within 20% except for 1,2-dichloroethane (36%), in comparison to measured UReff values (Table A2). The relative biases of modeled 8h-UReff values were mostly within ±20% from measured values too. These biases were acceptable, considering the 16–69% variation of URs under different environmental conditions [37], inter-laboratory variation of 40% [52] and U.S. EPA’s criterion of ≤30% for accuracy [25].
The laboratory analysis using TD-GC/MS shows excellent performance. The high reproducibility, linearity and sensitivity meet requirements by the U.S. EPA [4]. In particular, the MDLs are comparable with or superior to reported MDLs using tube-type passive samplers [44,53]. The sensitivity is sufficient for concentrations commonly found in indoor environments [7,54] and ambient air [55].
The empirical models are applicable under certain conditions. The samplers should be standard Tenax TA ATD tubes. Models only apply to nonpolar chemicals and a few polar chemical groups, including aromatics, branched alkanes and cycloalkanes, chlorinated compounds, acetates, acrylates and ketones. Models do not apply to alcohols, acids, anhydrides, higher amines, or chlorobenzene as their retention volumes on the ATD tube and boiling points did not show simple linear relationship [35]. The measured and modeled UReff values are valid for 8-h and 7-day sampling in occupational and environmental settings, respectively. ATD tubes are not recommended for very short passive sampling, given the considerable variability of the UR during the first hours [27,56]. According to requirements for determining the retention volumes [34] and ASTM’s sampling protocols [23], ATD tubes can be used for 4–8 h passive sampling of job-related chemicals at a concentration range of 100 μg/m3–100 mg/m3 in workplaces.
In environmental applications, the sampling duration must be sufficient to collect enough mass measurable by GC/MS [11]. Although the current TD-GC/MS is sensitive enough for even <1 day samples, 7-day integrated samples are preferred in practice for several reasons. The total sample volume of ~3 L is appropriate for the generally low levels of VOCs in environmental settings. The 7-day sampling reflects the long-term exposure and accounts for weekday and weekend variations. UReff values in Table 2 are the best estimates for 7-day sampling as they were modelled from 7-day UR data. The applicable concentration range is from the detection limit to 10 μg/m3 based on the original measurements. ASTM states that uptake rates are valid for a concentration range of 1 μg/m3–1 mg/m3 for individual compounds for 4-week exposure time. Combining these two ranges, the 7d-UReff values are valid for a concentration range from the detection limit to 1 mg/m3 for individual compounds.
Several limitations should be recognized in our modeling approach. Our models were applicable to the specific sampling durations and a specific ATD tube configuration. Laboratory, field and theoretical validations are needed for other sampling methods that involve different sorbents, exposure durations, concentration ranges and/or microenvironments. The 7d-UReff values were modeled based on measured UReff data from only one study. We conducted an extensive search but only found this study measured UReff for over 20 VOCs. We assumed that the diffusion geometry is the same for all the standard tubes. In reality, within-vendor and between-vendor variations may exist in the diffusion cap, air gap, tube inside diameter and retaining gauze. The simplified models did not include other influential parameters, such as air velocity, humidity, chemical concentration, interference and competition of chemicals and degradation and artifacts [19]. They also bypassed complex calculations involving other physicochemical properties, chemical-adsorbent interaction and adsorption isotherm. For example, terpenes, aromatics, acetates and alkanes displayed different UR change patterns with respect to exposure time [40]. The efficiency of passive samplers is strongly influenced by adsorption isotherms, such as Langmuir, Freundlich and Dubinin-Radushkevich isotherms [48]. The scarcity and inconsistency of UR data warrants more laboratory and field measurements and future development and validation of practical models for estimating the UReff accurately.
Future measurement and modeling work should be extended to standard ATD tubes packed with other sorbents, or to different sampling durations. Some available UR datasets using ATD tubes include: (1) 24-h URs on Carbopack X solid sorbent for 27 VOCs determined in laboratory chamber [16]; (2) 4-day URs on Tenax TA and Carbopack B for 10 VOCs determined in laboratory chamber [37]; and (3) 4- to 10-day URs on Carbopack B for 68 VOCs determined by field tests [38]. Depending on the analyte/sorbent combination, the adsorption behavior might be completely different and new models should be developed. Future work should also consider other passive samplers, e.g., 3M OVM, SKC, GABIE and Radiello samplers. The advantage of these other samplers is their fixed geometry and configuration, in contrast to the flexibility of ATD tubes. We anticipate the need for a user friendly software program or an online database that is capable of generating effective uptake rates given input parameters such as sampler type, sorbent, target compound and exposure duration. The database will not only promote the popularity of passive sampling techniques but ensure valid measurements.
5. Conclusions
This study developed and confirmed empirical models that can determine effective uptake rates (UReff) on the standard ATD tubes for a wide range of VOCs commonly detected in the environment. It fills an important data gap in the passive air sampling research. For short-term passive sampling (4–8 h) in occupational settings, UReff values can be modeled with available retention volumes or boiling points for aromatics, branched alkanes and cycloalkanes, chlorinated compounds, esters and ketones but not for alcohols. For long-term passive sampling (7 days) in environmental settings, the sampling efficiency (α) can be calculated from a function of boiling point for alkanes, aromatics, chlorinated compounds, carbonyls and terpenes. Ideal URs calculated by the Fick’s Law and tube geometry typically overestimate the actual sampling rate and cause biases. In the order of preference, we recommend using laboratory determined URs followed by field validations, field determined URs and modelled URs under the same conditions. We suggest extending research on measuring and modeling effective uptake rates to ease the use of passive sampling among the general users.
Acknowledgments
Funding for this work was provided by a JPB Environmental Health Fellowship award granted by the JPB Foundation and managed by the Harvard T.H. Chan School of Public Health. The authors thank John Spengler (Harvard University), Jungfeng (Jim) Zhang (Duke University) and Gary Adamkiewicz (Harvard University) for their advice on this work and Jim Holt for proofreading the manuscript.
Author Contributions
Chunrong Jia conceived and designed the experiments, analyzed the data and wrote the paper; Xianqiang Fu performed the experiments, analyzed the data and reviewed the manuscript.
Conflicts of Interest
The authors declare no conflict of interest. The authors declare that they have no relevant or material financial interests that relate to the research described in this paper. The authors make no endorsement of any of the products, brands, trademarks, or companies they mentioned in this paper.
Appendix A

Table A1.
Physical and chemical properties, diffusion parameters, measured and modeled uptake rates of volatile organic compounds measured in workplaces.
Table A1.
Physical and chemical properties, diffusion parameters, measured and modeled uptake rates of volatile organic compounds measured in workplaces.
| VOCs | CAS# | MW | BP 1 | D298 2 | URideal 3 | 8h-UR 4 | 8h-UR | Vg 5 | Log10Vg | α 6 | Pred. UR 7 | Bias 8 |
|---|---|---|---|---|---|---|---|---|---|---|---|---|
| (g/mol) | (°C) | (cm2/sec) | (mL/min) | (ng/ppm·min) | (mL/min) | (L) | (mL/min) | (%) | ||||
| Alkanes | ||||||||||||
| n-Heptane | 142-82-5 | 100.2 | 98 | 0.0723 | 0.568 | 1.57 | 0.383 | 34 | 1.53 | 0.636 | 0.361 | −5.8 |
| n-Octane | 111-65-9 | 114.2 | 126 | 0.0671 | 0.527 | 1.67 | 0.357 | 160 | 2.20 | 0.739 | 0.390 | 9.0 |
| n-Nonane | 111-84-2 | 128.3 | 151 | 0.0628 | 0.493 | 1.75 | 0.334 | 1400 | 3.15 | 0.885 | 0.436 | 30.8 |
| n-Decane | 124-18-5 | 142.3 | 174 | 0.0592 | 0.465 | 1.96 | 0.337 | 4200 | 3.62 | 0.958 | 0.445 | 32.2 |
| n-Undecane | 1120-21-4 | 156.3 | 196 | 0.0562 | 0.441 | 1.97 | 0.308 | 25,000 | 4.40 | 1.000 | 0.441 | 43.2 |
| n-Dodecane | 112-40-3 | 170.3 | 216 | 0.0535 | 0.420 | 2.08 | 0.299 | 126,000 | 5.10 | 1.000 | 0.420 | 40.7 |
| n-Tridecane | 629-50-5 | 184.4 | 235 | 0.0512 | 0.402 | 2.33 | 0.309 | 5.40 | 1.000 | 0.402 | 30.1 | |
| n-Tetradecane | 629-59-4 | 198.4 | 253 | 0.0492 | 0.386 | 2.41 | 0.297 | 5.91 | 1.000 | 0.386 | 30.1 | |
| n-Pentadecane | 629-62-9 | 212.4 | 270 | 0.0473 | 0.371 | 2.19 | 0.252 | 6.39 | 1.000 | 0.371 | 47.4 | |
| n-Hexadecane | 544-76-3 | 226.5 | 287 | 0.0457 | 0.359 | 2.36 | 0.255 | 6.88 | 1.000 | 0.359 | 40.9 | |
| Cyclohexane | 110-82-7 | 86.2 | 81 | 0.0832 | 0.653 | 1.32 | 0.375 | 1.03 | 0.558 | 0.365 | −2.6 | |
| Methylcyclohexane | 108-87-2 | 98.2 | 101.1 | 0.0759 | 0.596 | 1.55 | 0.386 | 1.60 | 0.646 | 0.385 | −0.2 | |
| 2-Methylhexane | 591-76-4 | 100.2 | 90 | 0.0724 | 0.569 | 1.48 | 0.361 | 1.28 | 0.597 | 0.340 | −5.9 | |
| 3-Methylhexane | 589-34-4 | 100.2 | 91 | 0.0724 | 0.569 | 1.48 | 0.361 | 1.31 | 0.602 | 0.342 | −5.2 | |
| 2-Methylheptane | 592-28-8 | 114.2 | 116 | 0.0672 | 0.528 | 1.95 | 0.417 | 2.02 | 0.711 | 0.375 | −10.1 | |
| Aromatic compounds | ||||||||||||
| Benzene | 71-43-2 | 78.1 | 80.1 | 0.0928 | 0.729 | 1.3 | 0.407 | 12.5 | 1.10 | 0.569 | 0.415 | 1.9 |
| Toluene | 108-88-3 | 92.1 | 111 | 0.0829 | 0.651 | 1.67 | 0.443 | 76 | 1.88 | 0.690 | 0.449 | 1.3 |
| Ethylbenzene | 100-41-4 | 106.2 | 136 | 0.0756 | 0.594 | 2.00 | 0.461 | 360 | 2.56 | 0.794 | 0.471 | 2.3 |
| m-Xylene | 108-38-3 | 106.2 | 139 | 0.0756 | 0.594 | 1.82 | 0.419 | 600 | 2.78 | 0.828 | 0.492 | 17.3 |
| p-Xylene | 106-42-3 | 106.2 | 139 | 0.0756 | 0.594 | 1.82 | 0.419 | 600 | 2.78 | 0.828 | 0.492 | 17.3 |
| o-Xylene | 95-47-6 | 106.2 | 144 | 0.0756 | 0.594 | 1.82 | 0.419 | 600 | 2.78 | 0.828 | 0.492 | 17.3 |
| Styrene | 100-42-5 | 104.1 | 145 | 0.0757 | 0.595 | 2.40 | 0.563 | 600 | 2.78 | 0.828 | 0.492 | −12.6 |
| Isopropylbenzene | 98-82-8 | 120.2 | 153 | 0.0687 | 0.540 | 2.50 | 0.509 | 960 | 2.98 | 0.859 | 0.464 | −8.8 |
| Propylbenzene | 103-65-1 | 120.2 | 158 | 0.0669 | 0.525 | 2.37 | 0.482 | 1700 | 3.23 | 0.897 | 0.472 | −2.2 |
| 1,3,5-Trimethylbenzene | 108-67-8 | 120.2 | 165 | 0.0698 | 0.548 | 2.37 | 0.482 | 3600 | 3.56 | 0.948 | 0.520 | 7.8 |
| 1,2,4-Trimethylbenzene | 95-63-6 | 120.2 | 168 | 0.0686 | 0.539 | 2.37 | 0.482 | 3600 | 3.56 | 0.948 | 0.511 | 5.9 |
| o-Ethyltoluene | 611-14-3 | 120.2 | 165 | 0.0686 | 0.539 | 2.44 | 0.496 | 3.41 | 0.925 | 0.499 | 0.5 | |
| m-Ethyltoluene | 620-14-4 | 120.2 | 159 | 0.0687 | 0.540 | 2.25 | 0.458 | 3.24 | 0.899 | 0.485 | 6.0 | |
| p-Ethyltoluene | 622-96-8 | 120.2 | 161.7 | 0.0686 | 0.539 | 2.21 | 0.450 | 3.32 | 0.911 | 0.491 | 9.2 | |
| 1,3-Dimethyl-4-ethylbenzene | 874-41-9 | 134.2 | 185 | 0.0641 | 0.503 | 2.45 | 0.446 | 3.98 | 1.000 | 0.503 | 12.8 | |
| 1,4-Diethylbenzene | 105-05-5 | 134.2 | 184 | 0.0642 | 0.504 | 2.56 | 0.466 | 3.95 | 1.000 | 0.504 | 8.1 | |
| Naphthalene | 91-20-3 | 128.2 | 218 | 0.0691 | 0.543 | 2.14 | 0.408 | 4.92 | 1.000 | 0.543 | 32.9 | |
| Haloginated Hydrocarbons | ||||||||||||
| Tetrachloroethylene | 127-18-4 | 165.8 | 121 | 0.0767 | 0.602 | 2.80 | 0.413 | 96 | 1.98 | 0.705 | 0.425 | 2.9 |
| Benzyl chloride | 100-44-7 | 126.6 | 178.9 | 0.0728 | 0.572 | 2.72 | 0.525 | 3.81 | 0.986 | 0.564 | 7.3 | |
| Tetrachloroethene | 127-18-4 | 165.8 | 121.1 | 0.0767 | 0.602 | 2.80 | 0.413 | 2.17 | 0.734 | 0.442 | 7.0 | |
| Bromobenzene | 108-86-1 | 157.0 | 156 | 0.0789 | 0.620 | 3.31 | 0.515 | 3.16 | 0.886 | 0.549 | 6.5 | |
| Esters and Glycol Ethers | ||||||||||||
| Ethyl acetate | 141-78-6 | 88.1 | 77.1 | 0.0892 | 0.701 | 1.60 | 0.444 | 7 | 0.86 | 0.532 | 0.373 | −16.1 |
| n-Butyl acetate | 123-86-4 | 116.2 | 125.6 | 0.0738 | 0.580 | 2.26 | 0.476 | 2.29 | 0.753 | 0.436 | −8.3 | |
| Isobutyl acetate | 110-19-0 | 116.2 | 117.2 | 0.0739 | 0.580 | 1.91 | 0.402 | 265 | 2.42 | 0.773 | 0.449 | 11.6 |
| sec-Butyl acetate | 105-46-4 | 116.2 | 112.2 | 0.074 | 0.581 | 1.90 | 0.400 | 1.91 | 0.695 | 0.404 | 1.0 | |
| tert-Butyl acetate | 540-88-5 | 116.2 | 97.8 | 0.0742 | 0.583 | 1.79 | 0.377 | 1.50 | 0.632 | 0.368 | −2.3 | |
| Methyl acrylate | 96-33-3 | 86.1 | 80 | 0.0918 | 0.721 | 1.500 | 0.426 | 13 | 1.11 | 0.572 | 0.412 | −3.3 |
| Methyl methacrylate | 80-62-6 | 100.1 | 100 | 0.0825 | 0.648 | 1.77 | 0.432 | 55 | 1.74 | 0.668 | 0.433 | 0.1 |
| Butyl acrylate | 141-32-2 | 128.2 | 145 | 0.0697 | 0.547 | 2.60 | 0.496 | 2.84 | 0.838 | 0.459 | −7.5 | |
| Ethylhexyl acrylate | 1322-13-0 | 184.3 | 227.7 | 0.0552 | 0.434 | 2.99 | 0.397 | 5.19 | 1.000 | 0.434 | 9.3 | |
| Halothane | 151-67-7 | 197.4 | 50 | 0.0824 | 0.647 | 2.59 | 0.321 | 0.15 | 0.423 | 0.273 | −14.8 | |
| Enflurane | 13838-16-9 | 184.5 | 56 | 0.078 | 0.613 | 2.29 | 0.303 | 0.32 | 0.449 | 0.275 | −9.4 | |
| Isoflurane | 26675-46-7 | 184.5 | 49 | 0.0782 | 0.614 | 2.20 | 0.292 | 0.12 | 0.418 | 0.257 | −11.9 | |
| 2-Methoxyethyl acetane | 110-49-6 | 118.1 | 145 | 0.077 | 0.605 | 1.64 | 0.339 | 2.84 | 0.838 | 0.507 | 49.3 | |
| 2-Ethoxyethyl acetate | 111-15-9 | 132.2 | 156.1 | 0.0711 | 0.558 | 2.10 | 0.389 | 3.16 | 0.887 | 0.495 | 27.4 | |
| 2-Ethoxyethanol | 110-80-5 | 90.1 | 135 | 0.0859 | 0.675 | 1.80 | 0.488 | 2.56 | 0.794 | 0.536 | 9.7 | |
| 2-Propoxyethanol | 2807-30-9 | 104.1 | 153 | 0.0781 | 0.613 | 1.65 | 0.387 | 3.07 | 0.873 | 0.536 | 38.2 | |
| 2-Butoxyethanol | 117-76-2 | 118.2 | 171 | 0.0718 | 0.564 | 1.90 | 0.393 | 3.58 | 0.952 | 0.537 | 36.5 | |
| 1-Methoxyprppan-2-ol | 107-98-2 | 90.1 | 121 | 0.0862 | 0.677 | 1.56 | 0.423 | 2.16 | 0.733 | 0.496 | 17.3 | |
| 2-Methoxypropan-2-ol | 72360-66-8 | 90.1 | 94.8 | 0.0865 | 0.679 | 1.52 | 0.412 | 1.42 | 0.618 | 0.420 | 1.9 | |
| Ketones and Aldehydes | ||||||||||||
| Butan-2-one | 78-93-3 | 72.1 | 75.6 | 0.0943 | 0.741 | 1.34 | 0.454 | 0.87 | 0.534 | 0.396 | −12.9 | |
| Methyl isobutyl ketone | 108-10-1 | 100.2 | 118 | 0.0766 | 0.602 | 1.71 | 0.417 | 2.08 | 0.720 | 0.433 | 3.8 | |
| Cyclohexanone | 108-94-1 | 98.2 | 155.6 | 0.0786 | 0.617 | 2.30 | 0.573 | 340 | 2.53 | 0.790 | 0.488 | −14.9 |
| 2-Methylcyclohexanone | 583-60-8 | 112.2 | 162.8 | 0.0739 | 0.580 | 2.31 | 0.504 | 3.35 | 0.916 | 0.532 | 5.6 | |
| 3-Methylcyclohexanone | 591-24-2 | 112.2 | 170 | 0.0738 | 0.580 | 2.22 | 0.484 | 3.55 | 0.947 | 0.549 | 13.5 | |
| 4-Methylcyclohexanone | 589-92-4 | 112.2 | 171 | 0.0738 | 0.580 | 2.14 | 0.466 | 3.58 | 0.952 | 0.552 | 18.3 | |
| Furfural | 98-01-1 | 96.1 | 162 | 0.0889 | 0.698 | 2.5 | 0.636 | 600 | 2.78 | 0.828 | 0.578 | −9.1 |
| Hexanal | 66-25-1 | 100.2 | 131 | 0.0765 | 0.601 | 1.64 | 0.400 | 2.45 | 0.777 | 0.467 | 16.6 | |
| Decanal | 112-31-2 | 156.2 | 209 | 0.0584 | 0.459 | 2.32 | 0.363 | 4.66 | 1.000 | 0.459 | 26.3 | |
| Alcohols and Others | ||||||||||||
| Isobutanol | 78-83-1 | 74.1 | 108 | 0.0910 | 0.715 | 1.260 | 0.416 | 6 | 0.75 | 0.515 | 0.368 | −11.4 |
| Furfuryl alcohol | 98-00-0 | 98.1 | 170 | 0.0862 | 0.677 | 2.5 | 0.623 | 3.55 | 0.947 | 0.641 | 2.9 | |
| Tetrahydrofurfuryl alcohol | 97-99-4 | 102.1 | 178 | 0.0817 | 0.642 | 1.9 | 0.455 | 3.78 | 0.982 | 0.630 | 38.6 | |
| Allyl glycidyl ether | 106-92-3 | 114.2 | 154 | 0.0759 | 0.596 | 1.83 | 0.392 | 3.10 | 0.877 | 0.523 | 33.5 | |
| Butyl glycidyl ether | 2426-08-6 | 130.2 | 164 | 0.069 | 0.542 | 2.36 | 0.443 | 3.38 | 0.921 | 0.499 | 12.6 | |
| n-Methylpyrrolidone | 872-50-4 | 99.1 | 204 | 0.0808 | 0.635 | 1.83 | 0.451 | 4.52 | 1.000 | 0.635 | 40.6 | |
| n-Vinylpyrrolidone | 88-12-0 | 111.1 | 95 | 0.0771 | 0.606 | 2.51 | 0.552 | 1.42 | 0.619 | 0.375 | −32.1 | |
| α-Pinene | 80-56-8 | 136.2 | 156 | 0.0634 | 0.498 | 2.35 | 0.422 | 3.16 | 0.886 | 0.441 | 4.6 |
Notes: 1 BP: boiling point, from [46]; 2 D298: diffusion coefficient at 298K, from [31]; 3 URideal: ideal uptake rate, calculated from Equation (1); 4 8h-UR: Measured 8-h effective uptake rate, from [36]; 5 Vg: retention volume, taken from [23] or calculated by Equation (5) if missing. 6 α: sampling efficiency, calculated using Equation (4). α = 1 if the calculated value exceeds 1; 7 Pred. UR: predicted UR, calculated using Equation (2); 8 %Bias: Percent bias of predicted 8h-UR from measured 8h-UR. Values of <−20% or >20% were in bold highlighted.
Table A2.
Data used to model 7-day effective uptake rates.
| VOCs | CAS# | BP 1 | D298 2 | URideal 3 | 7d-UReff 4 (Obs.) | 7d-α 5 (Obs.) | 7d-UReff 6 (Mod.) | Bias 7 |
|---|---|---|---|---|---|---|---|---|
| (°C) | (cm2/s) | (mL/min) | (mL/min) | (mL/min) | (%) | |||
| n-Hexane | 110-54-3 | 69 | 0.0788 | 0.619 | 0.16 | 0.259 | 0.190 | 18.7 |
| n-Heptane | 142-82-5 | 98 | 0.0723 | 0.568 | 0.26 | 0.458 | 0.246 | −5.5 |
| n-Octane | 111-65-9 | 126 | 0.0671 | 0.527 | 0.27 | 0.512 | 0.275 | 2.0 |
| n-Nonane | 111-84-2 | 150.8 | 0.0628 | 0.493 | 0.34 | 0.689 | 0.289 | −14.9 |
| n-Decane | 124-18-5 | 174.1 | 0.0592 | 0.465 | 0.28 | 0.602 | 0.297 | 6.0 |
| n-Undecane | 1120-21-4 | 195.5 | 0.0562 | 0.441 | 0.28 | 0.634 | 0.300 | 7.2 |
| n-Dodecane | 112-40-3 | 216.3 | 0.0535 | 0.420 | 0.26 | 0.619 | 0.301 | 15.7 |
| Methylcyclopentane | 96-37-7 | 71 | 0.0827 | 0.650 | 0.20 | 0.308 | 0.206 | 3.0 |
| Cyclohexane | 110-82-7 | 81 | 0.0832 | 0.653 | 0.25 | 0.383 | 0.238 | −4.8 |
| Benzene | 71-43-2 | 80.1 | 0.0928 | 0.729 | 0.27 | 0.370 | 0.263 | −2.8 |
| Toluene | 108-88-3 | 111 | 0.0829 | 0.651 | 0.32 | 0.491 | 0.311 | −2.9 |
| Ethylbenzene | 100-41-4 | 136 | 0.0756 | 0.594 | 0.35 | 0.589 | 0.327 | −6.7 |
| m & p-Xylene | 108-38-3 | 139 | 0.0756 | 0.594 | 0.36 | 0.606 | 0.331 | −8.0 |
| o-Xylene | 95-47-6 | 144 | 0.0756 | 0.594 | 0.38 | 0.640 | 0.339 | −10.9 |
| Propylbenzene | 103-65-1 | 159.2 | 0.0669 | 0.525 | 0.36 | 0.685 | 0.319 | −11.5 |
| 1,2,4-Trimethylbenzene | 95-63-6 | 169.5 | 0.0686 | 0.539 | 0.35 | 0.650 | 0.339 | −3.2 |
| Styrene | 100-42-5 | 145 | 0.0757 | 0.595 | 0.36 | 0.606 | 0.341 | −5.4 |
| Phenol | 108-95-2 | 182 | 0.0844 | 0.663 | 0.43 | 0.649 | 0.434 | 0.9 |
| Benzaldehyde | 100-52-7 | 179 | 0.0788 | 0.619 | 0.41 | 0.662 | 0.401 | −2.1 |
| Ethyl acetate | 141-78-6 | 77 | 0.0881 | 0.692 | 0.23 | 0.332 | 0.239 | 4.1 |
| Hexanal | 66-25-1 | 130.5 | 0.0765 | 0.601 | 0.17 | 0.283 | n.a. | n.a. |
| 1,2-Dichloroethane | 107-06-2 | 83.5 | 0.0922 | 0.724 | 0.20 | 0.276 | 0.272 | 35.8 |
| Tetrachloroethylene | 127-18-4 | 121 | 0.0767 | 0.602 | 0.28 | 0.465 | 0.306 | 9.3 |
| α-Pinene | 80-56-8 | 155 | 0.0634 | 0.498 | 0.20 | 0.402 | n.a. | n.a. |
| d-Limonene | 5989-27-5 | 177 | 0.0632 | 0.496 | 0.27 | 0.544 | 0.320 | 18.5 |
Note: 1 BP: boiling point, from [46]; 2 D298: diffusion coefficient at 298K, from [31]; 3 URideal: ideal uptake rate, calculated from Equation (1); 4 7d-UReff (obs.): observed 7-day effective uptake rate, taken from [18]; 5 7d-α (obs.): observed 7-day sampling efficiency, calculated from Equation (2); 6 7d-UReff (mod.): modeled 7-day effective uptake rate, calculated using Equations (6) and (2); 7 %Bias: Percent bias of 7d-UReff (mod.) from 7d-UReff (obs.).
Figure A1.
Residual plot of linear regression of 7d-α (Sameff) against LnBP.
References
- Bolden, A.L.; Kwiatkowski, C.F.; Colborn, T. New look at BTEX: Are ambient levels a problem? Environ. Sci. Technol. 2015, 49, 5261–5276. [Google Scholar] [CrossRef] [PubMed]
- Mitchell, C.S.; Zhang, J.F.J.; Sigsgaard, T.; Jantunen, M.; Lioy, P.J.; Samson, R.; Karol, M.H. Current state of the science: Health effects and indoor environmental quality. Environ. Health Perspect. 2007, 115, 958–964. [Google Scholar] [CrossRef] [PubMed]
- European Commission. Sampling Strategies for Volatile Organic Compounds (VOCs) in Indoor Air (Report EUR 16051 EN); European Commission: Brussels, Belgium; Luxembourg, 1995. [Google Scholar]
- U.S. Environmental Protection Agency (USEPA). Technical Assistance Document for the National Air Toxics Trends Stations Program, Revision 3; USEPA: Research Triangle Park, NC, USA, 2016.
- Weisel, C.P.; Zhang, J.F.; Turpin, B.J.; Morandi, M.T.; Colome, S.; Stock, T.H.; Spektor, D.M.; Korn, L.; Winer, A.; Alimokhtari, S.; et al. Relationship of Indoor, Outdoor and Personal Air (RIOPA) Study: Study design, methods and quality assurance/control results. J. Expo. Anal. Environ. Epidemiol. 2005, 15, 123–137. [Google Scholar] [CrossRef] [PubMed]
- Jia, C.; D’Souza, J.; Batterman, S. Distributions of personal VOC exposures: A population-based analysis. Environ. Int. 2008, 34, 922–931. [Google Scholar] [CrossRef] [PubMed]
- Jia, C.; Batterman, S.; Godwin, C. VOCs in industrial, urban and suburban neighborhoods, Part 1: Indoor and outdoor concentrations, variation, and risk drivers. Atmos. Environ. 2008, 42, 2083–2100. [Google Scholar] [CrossRef]
- Gorecki, T.; Namiesnik, J. Passive sampling. TrAC-Trends Anal. Chem. 2002, 21, 276–291. [Google Scholar] [CrossRef]
- Krol, S.; Zabiegala, B.; Namiesnik, J. Monitoring VOCs in atmospheric air II. Sample collection and preparation. TrAC-Trends Anal. Chem. 2010, 29, 1101–1112. [Google Scholar] [CrossRef]
- Jia, C.; Batterman, S.; Godwin, C. Continuous, intermittent and passive sampling of airborne VOCs. J. Environ. Monit. 2007, 9, 1220–1230. [Google Scholar] [CrossRef] [PubMed]
- U.S. Environmental Protection Agency (USEPA). Passive Samplers for Investigations of Air Quality: Method Description, Implementation, and Comparison to Alternative Sampling Methods (EPA/600/R-14/434); USEPA: Cincinnati, OH, USA, 2014.
- Batterman, S.; Metts, T.; Kalliokoski, P. Diffusive uptake in passive and active adsorbent sampling using thermal desorption tubes. J. Environ. Monit. 2002, 4, 870–878. [Google Scholar] [CrossRef] [PubMed]
- Martin, N.A.; Marlow, D.J.; Henderson, M.H.; Goody, B.A.; Quincey, P.G. Studies using the sorbent Carbopack X for measuring environmental benzene with Perkin-Elmer-type pumped and diffusive samplers. Atmos. Environ. 2003, 37, 871–879. [Google Scholar] [CrossRef]
- Simpson, A.T.; Wright, M.D. Diffusive sampling of C(7)-C(16) hydrocarbons in workplace air: Uptake rates, wall effects and use in oil mist measurements. Ann. Occup. Hyg. 2008, 52, 249–257. [Google Scholar] [PubMed]
- Brown, V.M.; Crump, D.R.; Gardiner, D.; Yu, C.W.F. Long-term diffusive sampling of volatile organic-compounds in indoor air. Environ. Technol. 1993, 14, 771–777. [Google Scholar] [CrossRef]
- McClenny, W.A.; Oliver, K.D.; Jacumin, H.H.; Daughtrey, E.H.; Whitaker, D.A. 24 h diffusive sampling of toxic VOCs in air onto Carbopack X solid adsorbent followed by thermal desorption/GC/MS analysis—Laboratory studies. J. Environ. Monit. 2005, 7, 248–256. [Google Scholar] [CrossRef] [PubMed]
- Hellen, H.; Hakola, H.; Laurila, T.; Hiltunen, V.; Koskentalo, T. Aromatic hydrocarbon and methyl tert-butyl, ether measurements in ambient air of Helsinki (Finland) using diffusive samplers. Sci. Total Environ. 2002, 298, 55–64. [Google Scholar] [CrossRef]
- Walgraeve, C.; Demeestere, K.; Dewulf, J.; Van Huffel, K.; Van Langenhove, H. Diffusive sampling of 25 volatile organic compounds in indoor air: Uptake rate determination and application in Flemish homes for the elderly. Atmos. Environ. 2011, 45, 5828–5836. [Google Scholar] [CrossRef]
- Brown, R.H. Monitoring the ambient environment with diffusive samplers: Theory and practical considerations. J. Environ. Monit. 2000, 2, 1–9. [Google Scholar] [CrossRef] [PubMed]
- Markes International. Application Note 3: National and International Standard Methods Relating to Speciated Monitoring of Vapour-Phase Organic Compounds in Air; Markes International Ltd.: Llantrisant, UK, 2012. [Google Scholar]
- Seethapathy, S.; Górecki, T.; Li, X. Passive sampling in environmental analysis. J. Chromatogr. A 2008, 1184, 234–253. [Google Scholar] [CrossRef] [PubMed]
- International Organization for Standardization (ISO). ISO16017-2: Indoor, Ambient and Workplace Air -Sampling and Analysis of Volatile Organic Compounds by Sorbent Tube/Thermal Desorption/Capillary Gas Chromatography—Part 2: Diffusive Sampling; ISO: Geneva, Switzerland, 2003. [Google Scholar]
- ASTM International. Standard Practice for Choosing Sorbents, Sampling Parameters and Thermal Desorption Analytical Conditions for Monitoring Volatile Organic Chemicals in Air; ASTM International: West Conshohocken, PA, USA, 2015. [Google Scholar]
- U.S. Environmental Protection Agency (USEPA). EPA Method 325B, Volatile Organic Compounds from Fugitive and Area Sources: Sampler Preparation and Analysis; USEPA: Washington, DC, USA, 2015.
- U.S. Environmental Protection Agency (USEPA). Compendium Method TO-17, Determination of Volatile Organic Compounds in Ambient Air Using Active Sampling onto Sorbent Tubes; USEPA: Cincinnati, OH, USA, 1999.
- Brown, R.H. The use of diffusive samplers for monitoring of ambient air. Pure Appl. Chem. 1993, 65, 1859–1874. [Google Scholar] [CrossRef]
- Oury, B.; Lhuillier, F.; Protois, J.C.; Morele, Y. Behavior of the GABIE, 3M 3500, PerkinElmer Tenax TA, and RADIELLO 145 diffusive samplers exposed over a long time to a low concentration of VOCs. J. Occup. Environ. Hyg. 2006, 3, 547–557. [Google Scholar] [CrossRef] [PubMed]
- Cao, X.L.; Hewitt, C.N. Evaluation of Tenax-GR adsorbent for the passive sampling of volatile organic-compounds at low concentrations. Atmos. Environ. Part A 1993, 27, 1865–1872. [Google Scholar] [CrossRef]
- Camel, V.; Caude, M. Trace enrichment methods for the determination of organic pollutants in ambient air. J. Chromatogr. A 1995, 710, 3–19. [Google Scholar] [CrossRef]
- Dettmer, K.; Engewald, W. Adsorbent materials commonly used in air analysis for adsorptive enrichment and thermal desorption of volatile organic compounds. Anal. Bioanal. Chem. 2002, 373, 490–500. [Google Scholar] [CrossRef] [PubMed]
- U.S. Environmental Protection Agency (USEPA). EPA On-Line Tools for Site Assessment Calculation; USEPA: Washington, DC, USA, 2016.
- Lyman, W.J. Handbook of Chemical Property Estimation Methods: Environmental Behavior of Organic Compounds, Chapter 17; Reehl, W.F., Rosenblatt, D.H., Eds.; McGraw-Hill: New York, NY, USA, 1982. [Google Scholar]
- Wright, M.D. Diffusive Uptake Rates for the Perkin Elmer Tube—BCR Air Sampling Intercomparison At Vito. Mol, Belgium Feb 1991—April 1992; HSE Internal Report 1993 IR/L/IA/93/3; Health and Safety Laboratory: Buxton, UK, 1993.
- Markes International. Application Note 002: Prediction of Uptake Rates for Diffusive Tubes; Markes International Ltd.: Llantrisant, UK, 2012. [Google Scholar]
- Brown, R.H.; Purnell, C.J. Collection and analysis of trace organic vapor pollutants in ambient atmospheres—Performance of a Tenax-GC adsorbent tube. J. Chromatogr. 1979, 178, 79–90. [Google Scholar] [CrossRef]
- Markes International. Application Note 001: Uptake Rates for Tube-Type Axial Diffusive Samplers; Markes International Ltd.: Llantrisant, UK, 2015. [Google Scholar]
- McAlary, T.; Groenevelt, H.; Disher, S.; Arnold, J.; Seethapathy, S.; Sacco, P.; Crump, D.; Schumacher, B.; Hayes, H.; Johnson, P.; et al. Passive sampling for volatile organic compounds in indoor air-controlled laboratory comparison of four sampler types. Environ. Sci. Process. Impacts 2015, 17, 896–905. [Google Scholar] [CrossRef] [PubMed]
- Xian, Q.M.; Feng, Y.L.; Chan, C.C.; Zhu, J.P. Use of reference chemicals to determine passive uptake rates of common indoor air VOCs by collocation deployment of active and passive samplers. J. Environ. Monit. 2011, 13, 2527–2534. [Google Scholar] [CrossRef] [PubMed]
- Feigley, C.E.; Lee, B.M. Determination of sampling rates of passive samplers for organic vapors based on estimated diffusion-coefficients. Am. Ind. Hyg. Assoc. J. 1988, 49, 266–269. [Google Scholar] [CrossRef]
- Walgraeve, C.; Demeestere, K.; Dewulf, J.; Van Huffel, K.; Van Langenhove, H. Uptake rate behavior of tube-type passive samplers for volatile organic compounds under controlled atmospheric conditions. Atmos. Environ. 2011, 45, 5872–5879. [Google Scholar] [CrossRef]
- Kilic, N.; Ballantine, J.A. Comparison of various adsorbents for long-term diffusive sampling of volatile organic compounds. Analyst 1998, 123, 1795–1797. [Google Scholar] [CrossRef]
- Calogirou, A.; Larsen, B.R.; Brussol, C.; Duane, M.; Kotzias, D. Decomposition of terpenes by ozone during sampling on Tenax. Anal. Chem. 1996, 68, 1499–1506. [Google Scholar] [CrossRef] [PubMed]
- Schrader, W.; Geiger, J.; Klockow, D.; Korte, E.H. Degradation of alpha-pinene on Tenax during sample storage: Effects of daylight radiation and temperature. Environ. Sci. Technol. 2001, 35, 2717–2720. [Google Scholar] [CrossRef] [PubMed]
- Jia, C.; Batterman, S.; Chernyak, S. Development and comparison of methods using MS scan and selective ion monitoring modes for a wide range of airborne VOCs. J. Environ. Monit. 2006, 8, 1029–1042. [Google Scholar] [CrossRef] [PubMed]
- Brown, V.M.; Crump, D.R.; Gardiner, D. Measurement of volatile organic-compounds in indoor air by a passive technique. Environ. Technol. 1992, 13, 367–375. [Google Scholar] [CrossRef]
- Chemexper.com. Available online: http://www.chemexper.com/ (accessed on 28 October 2017).
- Adley, D.P.; Underhill, D.W. Fundamental factors in the performance of diffusive samplers. Anal. Chem. 1989, 61, 843–847. [Google Scholar] [CrossRef]
- Underhill, D.W. Efficiency of Passive Sampling by Adsorbents. Am. Ind. Hyg. Assoc. J. 1984, 45, 306–310. [Google Scholar] [CrossRef] [PubMed]
- Batterman, S.; Metts, T.; Kalliokoski, P.; Barnett, E. Low-flow active and passive sampling of VOCs using thermal desorption tubes: Theory and application at an offset printing facility. J. Environ. Monit. 2002, 4, 361–370. [Google Scholar] [CrossRef] [PubMed]
- Nordstrand, E.; Kristensson, J. A computer-program for simulating the performance of thick bed diffusive samplers. Am. Ind. Hyg. Assoc. J. 1994, 55, 935–941. [Google Scholar] [CrossRef]
- Vandenhoed, N.; Vanasselen, O.L.J. A computer-model for calculating effective uptake rates of tube-type diffusive air samplers. Ann. Occup. Hyg. 1991, 35, 273–285. [Google Scholar]
- Hafkenscheid, T.L.; Mowrer, J. Intercomparison of tube-type diffusive sampling for the determination of volatile hydrocarbons in ambient air. Analyst 1996, 121, 1249–1252. [Google Scholar] [CrossRef]
- Civan, M.Y.; Tuncel, G. Evaluation of adsorbents with passive sampling and their analytical methods to determine volatile organic compounds emitted from vehicular exhaust. Energy Educ. Sci. Technol. Part A 2012, 29, 563–576. [Google Scholar]
- Paciência, I.; Madureira, J.; Rufo, J.; Fernandes, E.; Moreira, A.; Teixeira, J.P. Trends of Volatile Organic Compounds in different indoor microenvironments: A review. In Occupational Safety and Hygiene IV; CRC Press: Boca Raton, FL, USA, 2016; pp. 7–10. [Google Scholar]
- Strum, M.; Scheffe, R. National review of ambient air toxics observations. J. Air Waste Manag. Assoc. 2016, 66, 120–133. [Google Scholar] [CrossRef] [PubMed]
- Tolnai, B.; Gelencser, A.; Hlavay, J. Theoretical approach to non-constant uptake rates for tube-type diffusive samplers. Talanta 2001, 54, 703–713. [Google Scholar] [CrossRef]
Figure 1.
Structure and geometry of the standard automated thermal desorption (ATD) tube type passive sampler. VOC: volatile organic compound.
Figure 1.
Structure and geometry of the standard automated thermal desorption (ATD) tube type passive sampler. VOC: volatile organic compound.
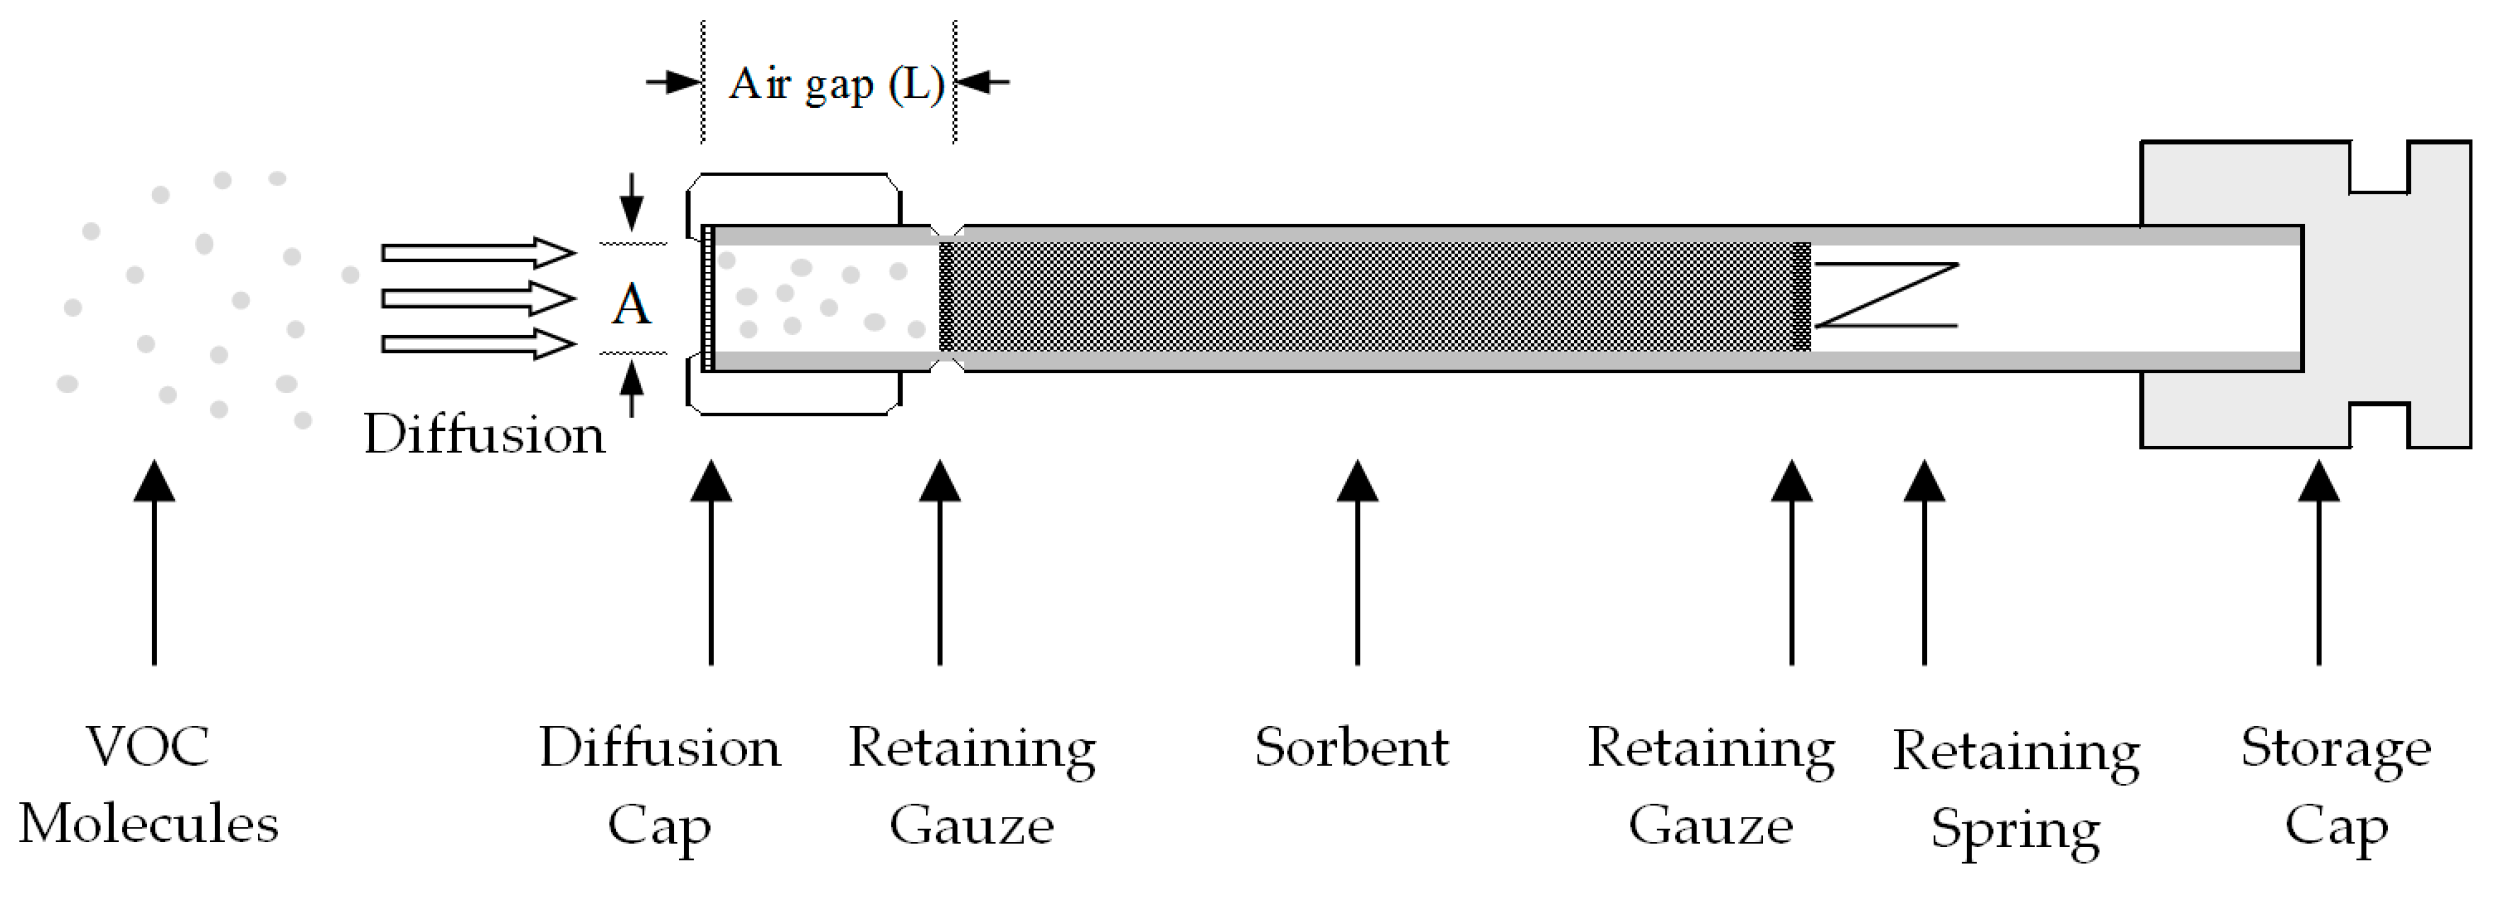
Figure 2.
Relationship between Log10Vg and boiling points (°C). Note: Only applies to alkanes, aromatics, chlorinated compounds, acetates and acrylates.
Figure 2.
Relationship between Log10Vg and boiling points (°C). Note: Only applies to alkanes, aromatics, chlorinated compounds, acetates and acrylates.

Figure 3.
Comparison of modeled and measured 8h-UReff values in occupational sampling.

Figure 4.
Comparison of three models for estimating 7d-UReff or 7d-α values in environmental sampling.
Figure 4.
Comparison of three models for estimating 7d-UReff or 7d-α values in environmental sampling.
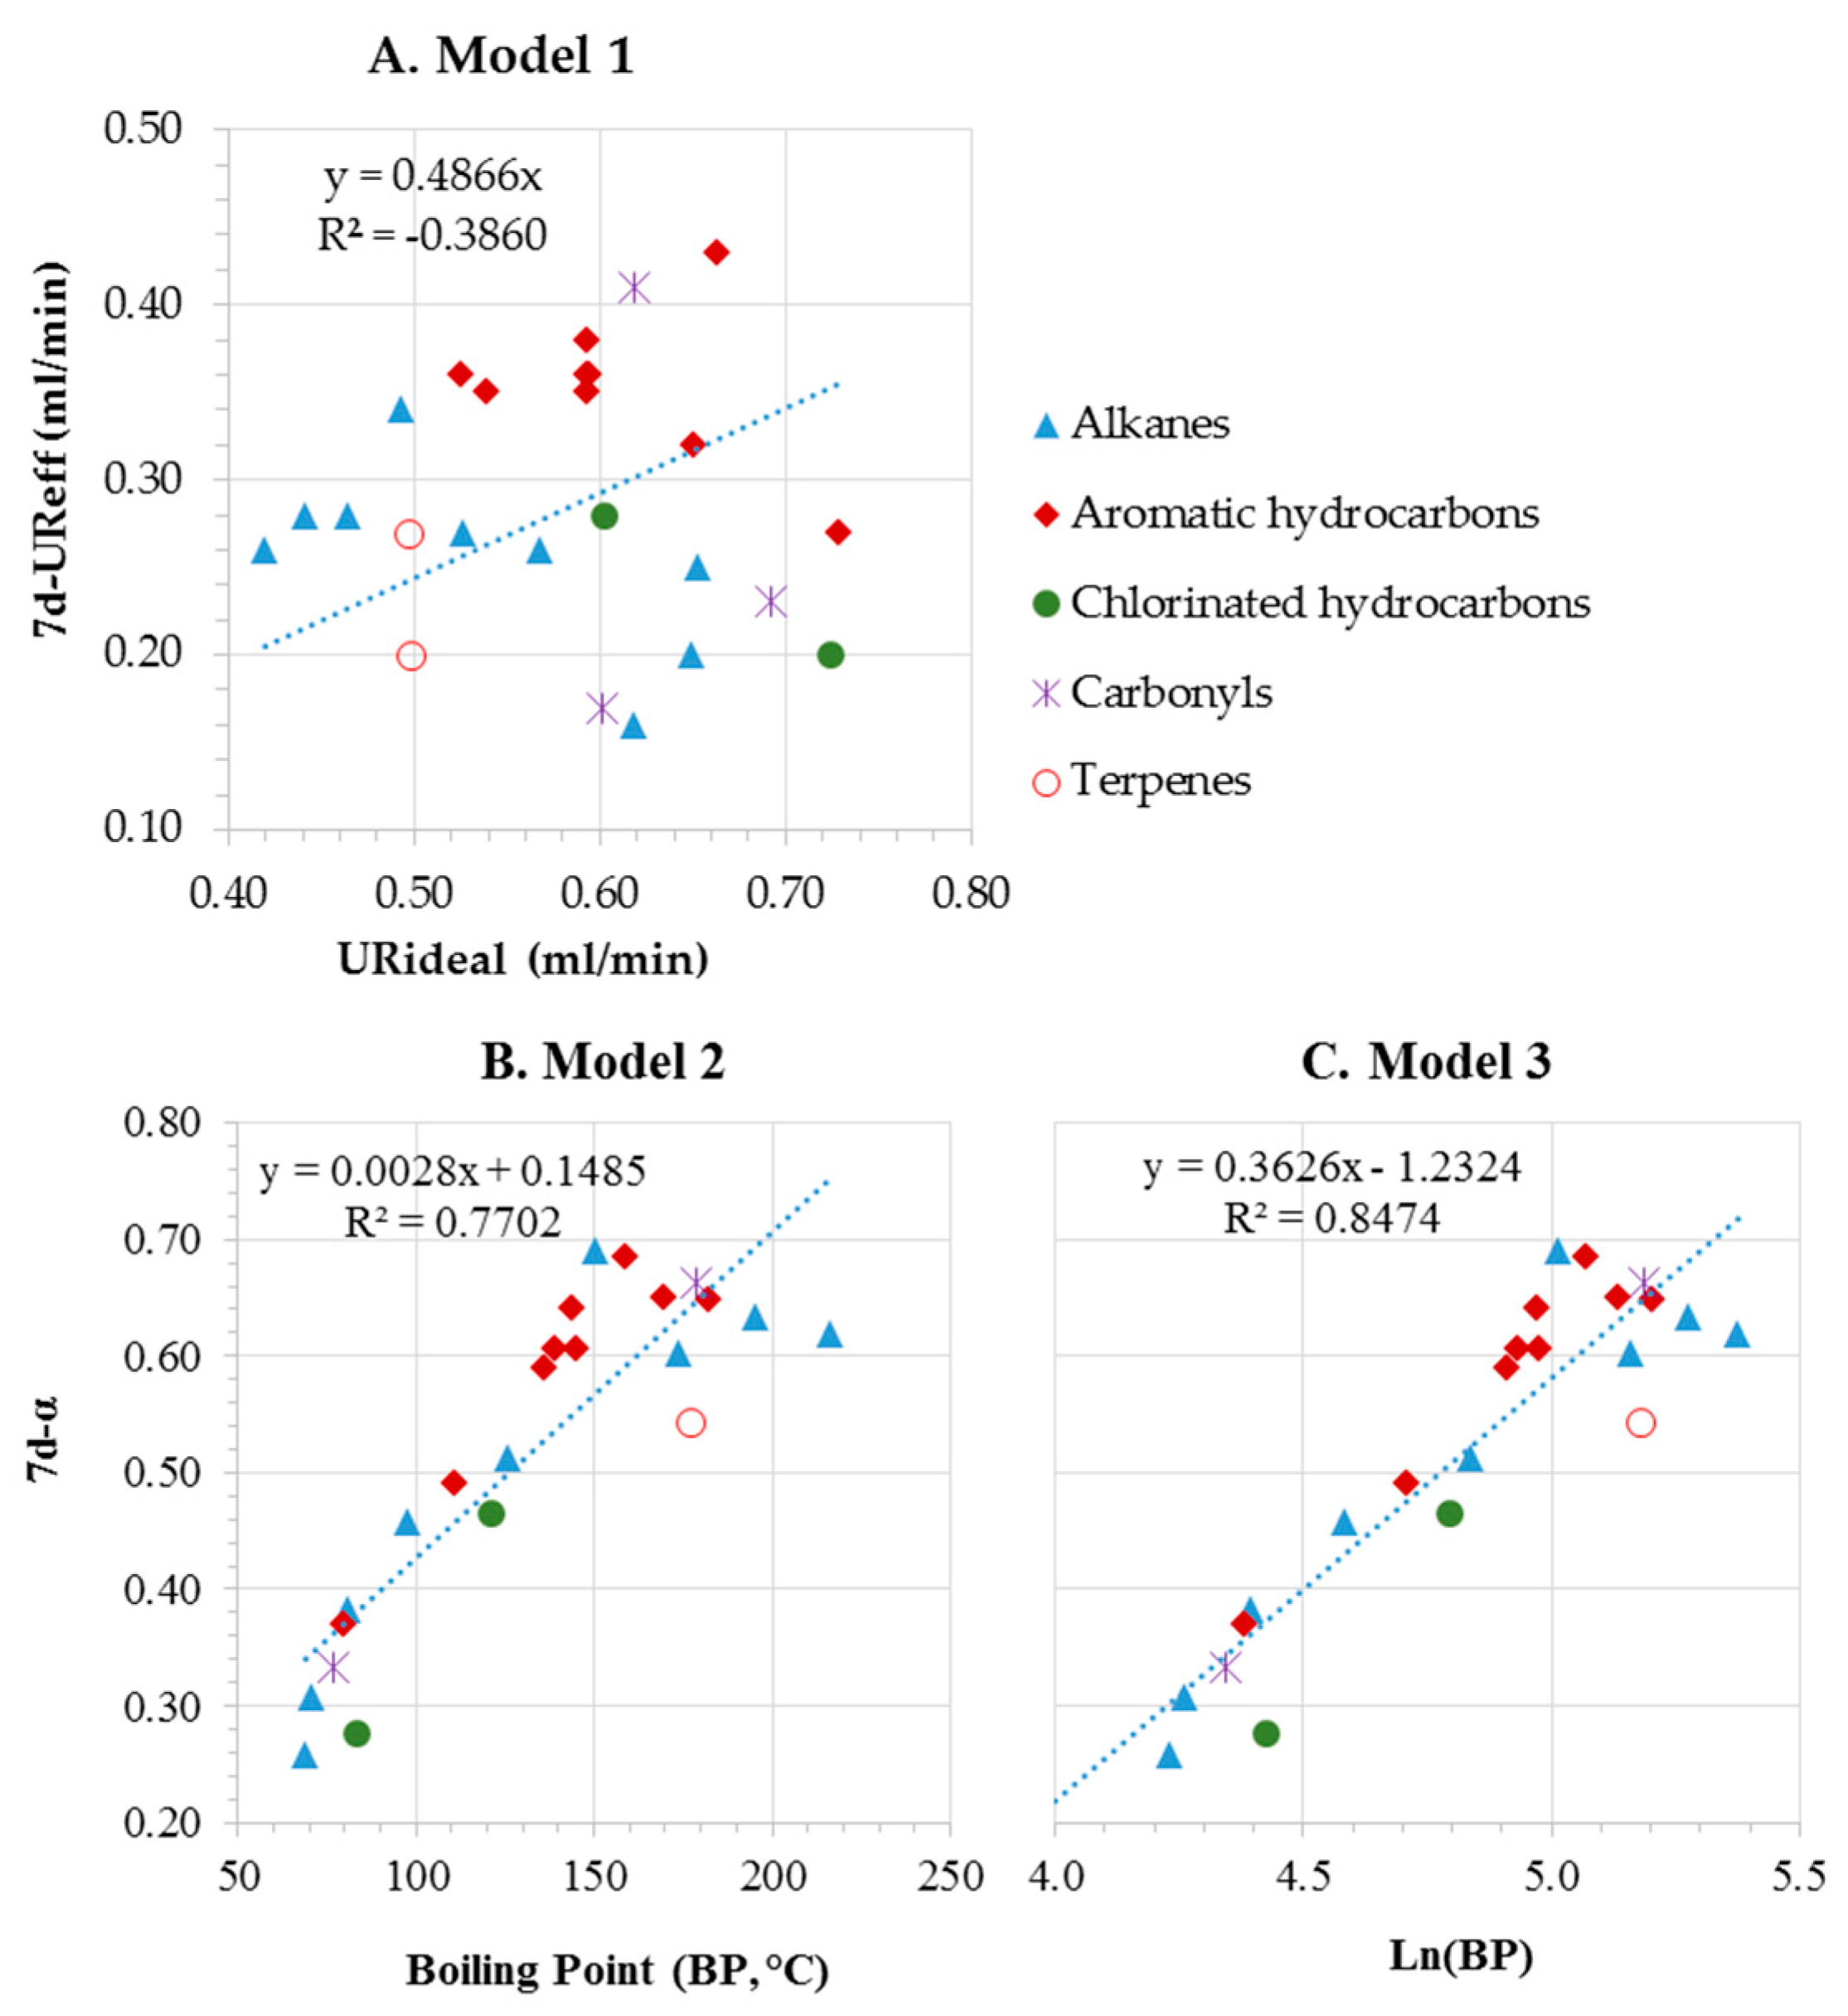
Table 1.
Thermal desorption-gas chromatography/mass spectrometry (TD-GC/MS) conditions.
| Instrument | Parameter | Settings |
|---|---|---|
| Thermal Desorption (TD) | Dry purge flow rate | 20 mL/min |
| Dry purge time | 1 min | |
| Desorption temperature | 260 °C | |
| Desorption flow rate | 50 mL/min | |
| Desorption time | 5 min | |
| Split ratio | 6.3:1 | |
| Trap low | 40 °C | |
| Heating rate | 40 °C/s | |
| Trap high | 280 °C | |
| Trap hold | 3 min | |
| Gas Chromatography (GC) | Injector | Splitless |
| Column | HP-5MSUI, 30 m × 250 µm × 0.25 µm | |
| Flow rate | 1.2 mL/min | |
| Temperature program | 35 °C hold for 3 min; 15 °C/min to 95 °C, hold for 2 min; | |
| 15 °C/min to 140 °C, no hold; 35 °C/min to 220 °C, no hold; | ||
| 40 °C/min to 300 °C, hold for 4 min | ||
| Total run time | 20.29 min | |
| Mass Spectrometry (MS) | Mass mode and range | Scan mode, solvent delay 1.5 min |
| 1.5–20.29 min: 35–350 amu, 4.5 scans/s, 0.1 m/z step size | ||
| MS quad temperature | 150 °C | |
| MS source temperature | 230 °C |
Table 2.
Physiochemical properties and uptake rates of 75 common volatile organic compounds (VOCs).
| VOCs | CAS # | MW 1 | BP 2 | Vg 3 | D 4 | URideal 5 | 8h-UReff 6 | 7d-UReff 7 |
|---|---|---|---|---|---|---|---|---|
| (g/mol) | (°C) | (L) | (cm2/s) | (mL/min) | (mL/min) | (mL/min) | ||
| Acrylonitrile | 107-13-1 | 53.1 | 77 | 0.1120 | 0.88 | 0.48 | 0.30 | |
| trans-1,2-Dichloroethylene | 156-60-5 | 96.9 | 48 | 0.0958 | 0.75 | 0.31 | 0.13 | |
| Methyl tert-butyl ether | 1634-04-4 | 88.1 | 55 | 0.0803 | 0.63 | 0.28 | 0.14 | |
| 1,1-Dichloroethane | 75-34-3 | 99.0 | 57 | 0.0927 | 0.73 | 0.33 | 0.17 | |
| Propionitrile | 107-12-0 | 55.1 | 97 | 0.1080 | 0.85 | 0.54 | 0.36 | |
| Methacrylonitrile | 126-98-7 | 67.1 | 91 | 0.0967 | 0.76 | 0.46 | 0.31 | |
| cis-1,2-Dichloroethylene | 156-59-2 | 96.9 | 60 | 0.0956 | 0.75 | 0.35 | 0.19 | |
| Methyl acrylate | 96-33-3 | 86.1 | 80 | 13 | 0.0918 | 0.72 | 0.43 | 0.26 |
| 2,2-Dichloropropane | 594-20-7 | 113.0 | 96 | 0.0805 | 0.63 | 0.40 | 0.27 | |
| Chloroform | 67-66-3 | 119.4 | 61 | 0.0917 | 0.72 | 0.34 | 0.19 | |
| Tetrahydrofuran | 109-99-9 | 72.1 | 66 | 0.0978 | 0.77 | 0.38 | 0.22 | |
| 1,1,1-Trichloroethane | 71-55-6 | 133.4 | 75 | 0.0826 | 0.65 | 0.35 | 0.22 | |
| 1,2-Dichloroethane | 107-06-2 | 99.0 | 83 | 11 | 0.0923 | 0.73 | 0.41 | 0.20 |
| 1,1-Dichloropropene | 563-58-6 | 111.0 | 78 | 0.0854 | 0.67 | 0.37 | 0.23 | |
| Benzene | 71-43-2 | 78.1 | 80 | 13 | 0.0928 | 0.73 | 0.41 | 0.27 |
| Carbon tetrachloride | 56-23-5 | 153.8 | 76 | 12 | 0.0809 | 0.64 | 0.59 | 0.22 |
| 1,2-Dichloropropane | 78-87-5 | 113.0 | 95 | 0.0830 | 0.65 | 0.41 | 0.27 | |
| Trichloroethylene | 79-01-6 | 131.4 | 87 | 11 | 0.0846 | 0.67 | 0.37 | 0.28 |
| Dibromomethane | 74-95-3 | 173.8 | 97 | 0.0953 | 0.75 | 0.47 | 0.32 | |
| Bromodichloromethane | 75-27-4 | 163.8 | 87 | 0.0880 | 0.69 | 0.41 | 0.27 | |
| 2,5-Dimethylfuran | 625-86-5 | 96.0 | 93 | 0.0781 | 0.62 | 0.38 | 0.25 | |
| Methyl methacrylate | 80-62-6 | 100.1 | 100 | 55 | 0.0825 | 0.65 | 0.43 | 0.28 |
| trans-1,3-Dichloropropene (E) | 10061-02-6 | 111.0 | 108 | 0.0850 | 0.67 | 0.45 | 0.31 | |
| cis-1,3-Dichloropropene(z) | 10061-01-5 | 111.0 | 108 | 0.0850 | 0.67 | 0.45 | 0.31 | |
| Toluene | 108-88-3 | 92.1 | 111 | 76 | 0.0829 | 0.65 | 0.44 | 0.32 |
| 1,1,2-Trichloroethane | 79-00-5 | 133.4 | 113 | 0.0821 | 0.65 | 0.45 | 0.31 | |
| 1,3-Dichloropropane | 142-28-9 | 113.0 | 121 | 0.0826 | 0.65 | 0.48 | 0.33 | |
| Ethyl methacrylate | 97-63-2 | 114.1 | 118 | 0.0744 | 0.59 | 0.42 | 0.29 | |
| Dibromochloromethane | 124-48-1 | 208.3 | 118 | 0.0850 | 0.67 | 0.48 | 0.33 | |
| n-Octane | 111-65-9 | 114.2 | 126 | 160 | 0.0671 | 0.53 | 0.36 | 0.27 |
| 1,2-Dibromoethane | 106-93-4 | 187.9 | 131 | 0.0480 | 0.38 | 0.29 | 0.20 | |
| Tetrachloroethene | 127-18-4 | 165.8 | 121 | 0.0767 | 0.60 | 0.43 | 0.28 | |
| Chlorobenzene | 108-90-7 | 112.6 | 131 | 52 | 0.0796 | 0.63 | 0.42 | 0.34 |
| 1,1,1,2-Tetrachloroethane | 630-20-6 | 167.8 | 131 | 156 | 0.0749 | 0.59 | 0.44 | 0.32 |
| Ethylbenzene | 100-41-4 | 106.2 | 136 | 360 | 0.0756 | 0.60 | 0.46 | 0.35 |
| m-Xylene | 108-38-3 | 106.2 | 144 | 600 | 0.0756 | 0.60 | 0.42 | 0.36 |
| p-Xylene | 106-42-3 | 106.2 | 144 | 600 | 0.0756 | 0.60 | 0.42 | 0.36 |
| Bromoform | 75-25-2 | 252.7 | 150 | 0.0826 | 0.65 | 0.56 | 0.38 | |
| Styrene | 100-42-5 | 104.1 | 145 | 600 | 0.0757 | 0.60 | 0.56 | 0.36 |
| o-Xylene | 95-47-6 | 106.2 | 144 | 600 | 0.0756 | 0.60 | 0.42 | 0.34 |
| n-Nonane | 111-84-2 | 128.3 | 151 | 1400 | 0.0628 | 0.49 | 0.40 | 0.34 |
| 1,1,2,2-Tetrachloroethane | 79-34-5 | 167.8 | 147 | 340 | 0.0747 | 0.59 | 0.46 | 0.34 |
| 1,2,3-Trichloropropane | 96-18-4 | 147.4 | 154 | 0.0749 | 0.59 | 0.52 | 0.35 | |
| Cumene | 98-82-8 | 120.2 | 153 | 0.0687 | 0.54 | 0.46 | 0.32 | |
| trans-1,4-Dichloro-2-butene | 110-57-6 | 125.0 | 126 | 0.0752 | 0.59 | 0.45 | 0.31 | |
| Bromobenzene | 108-86-1 | 157.0 | 156 | 0.0789 | 0.62 | 0.52 | 0.37 | |
| α-Pinene | 7785-70-8 | 136.2 | 155 | 0.0602 | 0.47 | 0.42 | 0.28 | |
| 2-Chlorotoluene | 95-49-8 | 126.6 | 158 | 0.0730 | 0.58 | 0.51 | 0.35 | |
| n-Propylbenzene | 103-65-1 | 120.2 | 158 | 0.0669 | 0.53 | 0.48 | 0.36 | |
| 4-chlorotoluene | 106-43-4 | 126.6 | 162 | 0.0730 | 0.58 | 0.52 | 0.35 | |
| 1,3,5-Trimethylbenzene | 108-67-8 | 120.2 | 165 | 3600 | 0.0698 | 0.55 | 0.48 | 0.34 |
| Pentachloroethane | 76-01-7 | 202.3 | 162 | 0.0692 | 0.55 | 0.50 | 0.33 | |
| Phenol | 108-95-2 | 94.1 | 182 | 480 | 0.0844 | 0.66 | 0.54 | 0.43 |
| tert-Butylbenzene | 98-06-6 | 134.2 | 169 | 0.0643 | 0.51 | 0.48 | 0.32 | |
| 1,2,4-Trimethylbenzene | 95-63-6 | 120.2 | 168 | 3600 | 0.0686 | 0.54 | 0.44 | 0.35 |
| n-Decane | 124-18-5 | 142.3 | 174 | 4200 | 0.0592 | 0.47 | 0.40 | 0.28 |
| 1,3-Dichlorobenzene | 541-73-1 | 147.0 | 173 | 0.0723 | 0.57 | 0.55 | 0.36 | |
| sec-Butylbenzene | 135-98-8 | 134.2 | 174 | 0.0643 | 0.51 | 0.49 | 0.32 | |
| 1,4-Dichlorobenzene | 106-46-7 | 147.0 | 173 | 0.0723 | 0.57 | 0.54 | 0.36 | |
| p-Isopropyltoluene | 99-87-6 | 134.2 | 177 | 0.0642 | 0.51 | 0.49 | 0.33 | |
| d-Limonene | 5989-27-5 | 136.2 | 176 | 0.0632 | 0.50 | 0.48 | 0.27 | |
| 1,2-Dichlorobenzene | 95-50-1 | 147.0 | 180 | 0.0722 | 0.57 | 0.56 | 0.37 | |
| n-Butylbenzene | 104-51-8 | 134.2 | 183 | 0.0642 | 0.51 | 0.51 | 0.33 | |
| Hexachloroethane | 67-72-1 | 236.7 | 187 | 0.0647 | 0.51 | 0.52 | 0.34 | |
| 1,2-Dibromo-3-chloropropane | 96-12-8 | 236.3 | 196 | 0.0709 | 0.56 | 0.59 | 0.38 | |
| Nitrobenzene | 98-95-3 | 123.1 | 210 | 28,000 | 0.0771 | 0.61 | 0.66 | 0.43 |
| n-Undecane | 1120-21-4 | 156.3 | 196 | 25,000 | 0.0562 | 0.44 | 0.31 | 0.28 |
| 1,2,4-Trichlorobenzene | 120-82-1 | 181.4 | 214 | 0.0668 | 0.53 | 0.60 | 0.38 | |
| Naphthalene | 91-20-3 | 128.2 | 218 | 0.0691 | 0.54 | 0.49 | 0.39 | |
| n-Dodecane | 112-40-3 | 170.3 | 216 | 126,000 | 0.0535 | 0.42 | 0.30 | 0.26 |
| 1,2,3-Trichlorobenzene | 87-61-6 | 181.4 | 218 | 0.0668 | 0.53 | 0.61 | 0.38 | |
| Hexachlorobutadiene | 87-68-3 | 260.8 | 215 | 0.0595 | 0.47 | 0.54 | 0.34 | |
| n-Tridecane | 629-50-5 | 184.0 | 234 | 0.0512 | 0.40 | 0.31 | 0.30 | |
| n-Tetradecane | 629-59-4 | 198.0 | 254 | 0.0506 | 0.40 | 0.30 | 0.31 | |
| n-Pentadecane | 629-62-9 | 212.0 | 271 | 0.0473 | 0.37 | 0.25 | 0.30 |
1 MW: molecular weight, from [46]; 2 BP: boiling point, from [46]; 3 Vg: retention volume, from [23]; 4 D: diffusion coefficient, from [31]; 5 Calculated by Equation (1); 6 Values in bold are measured 8-h effective uptake rates from [36]; other values are calculated using Equations (2), (4) and (5); 7 Values in bold are measured 7-day effective uptake rates from [18]; other values are calculated using Equations (2) and (11).
Table 3.
Performance of laboratory analysis of automated thermal desorption (ATD) tubes.
| VOCs | RT 1 | Precision 2 | R2 | RSD 3 | MDL 4 | MDL_8h 5 | MDL_7d 6 |
|---|---|---|---|---|---|---|---|
| (min) | (%) | (%) | (ng) | (µg/m3) | (µg/m3) | ||
| Acrylonitrile | 1.907 | 8.6 | 0.9992 | 18.9 | 0.13 | 0.56 | 0.042 |
| trans-1,2-Dichloroethylene | 2.074 | 9.3 | 0.9991 | 11.7 | 0.03 | 0.21 | 0.024 |
| Methyl tert-butyl ether | 2.100 | 5.4 | 0.9999 | 11.5 | 0.05 | 0.37 | 0.035 |
| 1,1-Dichloroethane | 2.157 | 5.6 | 0.9990 | 8.0 | 0.03 | 0.22 | 0.020 |
| Propionitrile | 2.168 | 8.7 | 0.9988 | 9.3 | 0.03 | 0.12 | 0.008 |
| Methacrylonitrile | 2.314 | 7.9 | 0.9994 | 7.8 | 0.13 | 0.60 | 0.043 |
| cis-1,2-Dichloroethylene | 2.370 | 8.2 | 0.9993 | 9.0 | 0.03 | 0.18 | 0.016 |
| Methyl acrylate | 2.430 | 7.9 | 0.9994 | 7.9 | 0.03 | 0.14 | 0.011 |
| 2,2-Dichloropropane | 2.430 | 3.7 | 0.9999 | 7.6 | 0.06 | 0.32 | 0.023 |
| Chloroform | 2.456 | 8.1 | 0.9993 | 7.4 | 0.04 | 0.22 | 0.019 |
| Tetrahydrofuran | 2.558 | 10.3 | 0.9988 | 97.0 | 0.02 | 0.12 | 0.010 |
| 1,1,1-Trichloroethane | 2.749 | 2.9 | 0.9998 | 17.3 | 0.04 | 0.26 | 0.020 |
| 1,2-Dichloroethane | 2.786 | 5.6 | 0.9991 | 7.4 | 0.04 | 0.20 | 0.020 |
| 1,1-Dichloropropene | 2.873 | 5.9 | 0.9999 | 6.4 | 0.04 | 0.22 | 0.016 |
| Benzene | 2.940 | 5.8 | 0.9998 | 22.2 | 0.03 | 0.16 | 0.012 |
| Carbon tetrachloride | 2.951 | 1.8 | 1.0000 | 4.3 | 0.04 | 0.14 | 0.018 |
| 1,2-Dichloropropane | 3.480 | 8.4 | 0.9976 | 18.3 | 0.06 | 0.32 | 0.023 |
| Trichloroethylene | 3.491 | 6.2 | 0.9986 | 8.0 | 0.03 | 0.15 | 0.010 |
| Dibromomethane | 3.517 | 5.5 | 0.9991 | 6.8 | 0.03 | 0.13 | 0.009 |
| Bromodichloromethane | 3.600 | 4.7 | 0.9990 | 8.1 | 0.03 | 0.13 | 0.009 |
| 2,5-Dimethylfuran | 3.630 | 5.4 | 0.9995 | 5.8 | 0.06 | 0.33 | 0.024 |
| Methyl methacrylate | 3.716 | 9.4 | 0.9988 | 9.3 | 0.08 | 0.37 | 0.027 |
| trans-1,3-Dichloropropene (E) | 4.170 | 7.5 | 0.9995 | 7.5 | 0.05 | 0.23 | 0.016 |
| cis-1,3-Dichloropropene (z) | 4.601 | 7.0 | 0.9996 | 6.4 | 0.04 | 0.18 | 0.013 |
| Toluene | 4.612 | 5.6 | 0.9996 | 13.1 | 0.06 | 0.26 | 0.017 |
| 1,1,2-Trichloroethane | 4.694 | 6.2 | 0.9999 | 7.2 | 0.04 | 0.18 | 0.012 |
| 1,3-Dichloropropane | 4.927 | 6.5 | 1.0000 | 6.9 | 0.03 | 0.14 | 0.010 |
| Ethyl methacrylate | 4.976 | 5.2 | 0.9999 | 10.2 | 0.06 | 0.28 | 0.020 |
| Dibromochloromethane | 5.077 | 5.3 | 1.0000 | 7.8 | 0.02 | 0.09 | 0.006 |
| n-Octane | 5.167 | 7.1 | 1.0000 | 18.7 | 0.07 | 0.43 | 0.027 |
| 1,2-Dibromoethane | 5.260 | 6.3 | 1.0000 | 7.0 | 0.05 | 0.33 | 0.023 |
| Tetrachloroethene | 5.324 | 4.3 | 0.9998 | 7.2 | 0.02 | 0.10 | 0.007 |
| Chlorobenzene | 5.916 | 2.7 | 0.9999 | 7.2 | 0.02 | 0.11 | 0.006 |
| 1,1,1,2-Tetrachloroethane | 5.980 | 2.1 | 1.0000 | 6.8 | 0.03 | 0.15 | 0.010 |
| Ethylbenzene | 6.160 | 7.7 | 0.9993 | 8.2 | 0.03 | 0.16 | 0.010 |
| m-Xylene | 6.284 | 4.9 | 0.9978 | 10.5 | 0.07 | 0.35 | 0.019 |
| p-Xylene | 6.284 | 4.9 | 0.9978 | 10.5 | 0.07 | 0.35 | 0.019 |
| Bromoform | 6.505 | 5.9 | 0.9999 | 13.0 | 0.05 | 0.19 | 0.013 |
| Styrene | 6.599 | 6.9 | 1.0000 | 10.0 | 0.05 | 0.17 | 0.013 |
| o-Xylene | 6.632 | 7.6 | 0.9996 | 9.4 | 0.05 | 0.23 | 0.013 |
| n-Nonane | 6.722 | 11.6 | 0.9991 | 17.7 | 0.04 | 0.22 | 0.012 |
| 1,1,2,2-Tetrachloroethane | 6.910 | 9.0 | 1.0000 | 10.1 | 0.04 | 0.16 | 0.011 |
| 1,2,3-Trichloropropane | 7.011 | 7.7 | 1.0000 | 8.4 | 0.05 | 0.20 | 0.014 |
| Cumene | 7.086 | 8.7 | 0.9996 | 7.5 | 0.03 | 0.14 | 0.009 |
| trans-1,4-Dichloro-2-butene | 7.131 | 10.6 | 0.9999 | 16.7 | 0.05 | 0.23 | 0.016 |
| Bromobenzene | 7.176 | 9.2 | 0.9999 | 6.4 | 0.06 | 0.25 | 0.016 |
| α-Pinene | 7.232 | 10.6 | 0.9998 | 8.1 | 0.04 | 0.20 | 0.014 |
| 2-Chlorotoluene | 7.483 | 8.5 | 0.9999 | 7.0 | 0.06 | 0.26 | 0.018 |
| n-Propylbenzene | 7.517 | 10.1 | 0.9995 | 9.5 | 0.06 | 0.26 | 0.017 |
| 4-chlorotoluene | 7.570 | 9.0 | 0.9999 | 7.7 | 0.05 | 0.21 | 0.015 |
| 1,3,5-Trimethylbenzene | 7.746 | 9.0 | 1.0000 | 7.4 | 0.04 | 0.19 | 0.013 |
| Pentachloroethane | 7.869 | 6.7 | 0.9998 | 13.7 | 0.05 | 0.20 | 0.014 |
| Phenol | 7.899 | 26.6 | 0.9999 | 30.9 | 0.16 | 0.60 | 0.036 |
| tert-Butylbenzene | 8.158 | 2.5 | 0.9996 | 6.6 | 0.06 | 0.25 | 0.018 |
| 1,2,4-Trimethylbenzene | 8.169 | 9.4 | 0.9995 | 7.2 | 0.06 | 0.31 | 0.018 |
| n-Decane | 8.244 | 17.7 | 0.9998 | 49.6 | 0.07 | 0.34 | 0.023 |
| 1,3-Dichlorobenzene | 8.387 | 5.7 | 0.9998 | 8.7 | 0.04 | 0.15 | 0.011 |
| sec-Butylbenzene | 8.484 | 6.5 | 0.9984 | 10.3 | 0.04 | 0.18 | 0.013 |
| 1,4-Dichlorobenzene | 8.507 | 6.4 | 0.9999 | 6.9 | 0.05 | 0.19 | 0.013 |
| p-Isopropyltoluene | 8.747 | 4.5 | 0.9998 | 9.9 | 0.04 | 0.16 | 0.012 |
| d-Limonene | 8.833 | 9.3 | 0.9995 | 14.5 | 0.12 | 0.53 | 0.046 |
| 1,2-Dichlorobenzene | 8.964 | 4.1 | 0.9999 | 7.7 | 0.04 | 0.13 | 0.010 |
| n-Butylbenzene | 9.384 | 6.6 | 0.9994 | 10.3 | 0.04 | 0.16 | 0.012 |
| Hexachloroethane | 9.733 | 14.5 | 0.9997 | 13.9 | 0.04 | 0.15 | 0.011 |
| 1,2-Dibromo-3-chloropropane | 9.894 | 6.5 | 0.9999 | 19.5 | 0.05 | 0.16 | 0.012 |
| Nitrobenzene | 9.976 | 13.0 | 0.9997 | 29.9 | 0.13 | 0.42 | 0.031 |
| n-Undecane | 10.145 | 9.2 | 0.9993 | 11.1 | 0.05 | 0.34 | 0.018 |
| 1,2,4-Trichlorobenzene | 11.431 | 7.8 | 0.9997 | 8.7 | 0.06 | 0.20 | 0.015 |
| Naphthalene | 11.532 | 9.5 | 0.9975 | 12.9 | 0.08 | 0.35 | 0.021 |
| n-Dodecane | 11.674 | 14.7 | 0.9974 | 13.0 | 0.05 | 0.32 | 0.017 |
| 1,2,3-Trichlorobenzene | 11.933 | 7.8 | 1.0000 | 7.5 | 0.08 | 0.27 | 0.020 |
| Hexachlorobutadiene | 11.978 | 8.0 | 1.0000 | 7.8 | 0.06 | 0.24 | 0.018 |
| n-Tridecane | 12.799 | 12.3 | 0.9978 | 13.6 | 0.06 | 0.41 | 0.020 |
| n-Tetradecane | 13.549 | 15.6 | 0.9960 | 25.5 | 0.10 | 0.67 | 0.031 |
| n-Pentadecane | 14.118 | 19.8 | 0.9944 | 26.2 | 0.10 | 0.85 | 0.034 |
1 RT: retention time; 2 Precision: duplicate precision; 3 RSD: relative standard deviation; 4 MDL: method detection limit; 5 MDL_8h: 8-h MDL; 6 MDL_7d: 7-day MDL.
© 2017 by the authors. Licensee MDPI, Basel, Switzerland. This article is an open access article distributed under the terms and conditions of the Creative Commons Attribution (CC BY) license (http://creativecommons.org/licenses/by/4.0/).
Share and Cite
MDPI and ACS Style
Jia, C.; Fu, X. Diffusive Uptake Rates of Volatile Organic Compounds on Standard ATD Tubes for Environmental and Workplace Applications. Environments 2017, 4, 87. https://doi.org/10.3390/environments4040087
AMA Style
Jia C, Fu X. Diffusive Uptake Rates of Volatile Organic Compounds on Standard ATD Tubes for Environmental and Workplace Applications. Environments. 2017; 4(4):87. https://doi.org/10.3390/environments4040087
Chicago/Turabian StyleJia, Chunrong, and Xianqiang Fu. 2017. "Diffusive Uptake Rates of Volatile Organic Compounds on Standard ATD Tubes for Environmental and Workplace Applications" Environments 4, no. 4: 87. https://doi.org/10.3390/environments4040087
Note that from the first issue of 2016, this journal uses article numbers instead of page numbers. See further details here.