Pervious Concrete as an Environmental Solution for Pavements: Focus on Key Properties


Faculty of Civil Engineering, Technical University of Košice, 042 00 Košice, Slovakia
*
Author to whom correspondence should be addressed.
Environments 2018, 5(1), 11; https://doi.org/10.3390/environments5010011
Submission received: 29 November 2017
/
Revised: 4 January 2018
/
Accepted: 8 January 2018
/
Published: 9 January 2018
(This article belongs to the Special Issue Advances in Environmental Engineering)
Abstract
:Pervious concrete is considered to be an advanced pavement material in terms of the environmental benefits arising from its basic feature—high water-permeability. This paper presents the results of experimental work that is aimed at testing technically important properties of pervious concrete prepared with three different water-to-cement ratios. The following properties of pervious concrete were tested—compressive and splitting tensile strength, unit weight at dry conditions, void content, and permeability. The mix proportions were expected to have the same volume of cement paste, and, to obtain the same 20% void content for all of the samples. The results show that changes of water-to-cement ratio from 0.35 to 0.25 caused only slight differences in strength characteristics. Arising tendency was found in the case of compressive strength and a decreasing tendency in the case of splitting tensile strength. The hydraulic conductivity ranged from 10.2 mm/s to 7.5 mm/s. The values of both the unit weight and void content were also analysed to compare the theoretical (calculated) values and real experiment results. A fairly good agreement was reached in the case of mixtures with 0.35 and 0.30 water-to-cement ratios, while minor differences were found in the case of 0.25 ratio. Finally, a very tight correlation was found between void content, hydraulic conductivity, and compressive strength.
1. Introduction
People change the natural environment when they build buildings and roads. One of the most notable changes is connected with the construction of impervious areas in places that were originally permeable. Impervious areas prevent water from infiltrating the soil underneath. Examples of impervious areas include rooftops, parking lots, and roadways.
The environment is adversely affected by the integration of impermeable areas into the surface—this fact causes disruption of the natural water cycle. It consequently causes the blocking of the natural process of water infiltration through the soil—thus, in the case of storm events and snowmelts, the water runoff from the impervious surfaces are very fast. There are three main aspects of this runoff, as given in [1]: “(1) a decrease in groundwater recharge due to lack of infiltration, (2) alteration in the natural flow patterns of a drainage basin, and (3) transportation of contaminants, deposited on impervious surfaces, to receiving water bodies”. This is the way how the interruption of both surface and subsurface water quantity and quality is affected [1].
With development of new urban areas, there is a great challenge in finding new ways to manage storm-water runoff. Among others, porous pavements are presented as an alternative method for storm-water control. Types of porous pavements include porous asphalt, pervious cement concrete, concrete paving-blocks, gravel paving systems, and grass paving systems, among others. According to [2], the way how the pervious pavements work lies in reduction of runoff volume by allowing for water to pass through them, be stored, and subsequently be released into the ground.
Focusing on the pervious concrete, it can be described as a material consisting of open-graded coarse aggregate, Portland cement, water, and admixtures. The basic arrangement of composition contains mainly characterization of the aggregate: size of approximately 8 mm; sand is neglected to leave the space between grains empty. A representative pervious concrete has 15% to 25% of void space [2,3].
The consistency of pervious concrete mixtures is characterized by little to no slump [4]. This inherent property is due to the low cement-paste content, allowing the creation of only a thin film coating the aggregate [5]. High-viscosity paste is needed to coat the aggregates, while resisting the drain-down of the paste. The mitigation of drain-down is pertinent for the matrix porosity to be maintained across the width of the concrete section. The structure relies on the stone-to-stone contact achieved through compaction, which allows for the cement-paste-coated aggregates to bond with one another. To achieve the proper void structure, it is recommended to use the appropriate cement paste, which should possess a low water-to-cement (w/c) ratio of about 0.20 to 0.25, in addition to superplasticizer and adequate mixing [6]. The experiment given in [7] shows a decrease in compressive strength with a decrease in w/c ratio, which is unlike the conventional dense-concrete behaviour. Another experiment shows a w/c ratio that ranges from 0.2 to 0.4. They report that pervious concrete mixtures with w/c ratios under 0.3 require water-reducing admixtures while those with w/c above 0.3 can be mixed without plasticizer [5,7]. In general, w/c in the range of 0.27–0.34 can be assumed as the most common and wide range applicable for pervious concrete mixtures [3].
Another options of pervious concrete involve the improvement of water quality in ground-water recharge [8]. Due to the storm-water runoff infiltration into the ground, the sediment is filtered and contaminants do not pass into the groundwater. Similarly, due to water infiltration through the concrete layer, pervious concrete parking lots can serve as recharge basins. Other benefits of pervious concrete are following: better road safety because of increased skid resistance, road sound dampening, and a reduction of the “heat island” effect [2,9,10].
This article presents a study that has been conducted to confirm the applicability of the w/c ratio in the range of 0.35–0.25 for locally available concrete components. The influence of w/c ratio on the key properties of pervious concrete was evaluated in terms of the following properties: compressive and splitting tensile strength, unit weight, void content, and hydraulic conductivity. The void content was assumed as constant, and, together with unit weight, was controlled for comparing the theoretical (calculated) values and real experiment results. The results were also analysed in terms of the dependence of the key properties. The specifications of correlation are given as well.
2. Materials and Methods
The experiment focused on the utilization of locally available materials (Eastern Slovakia), as follows:
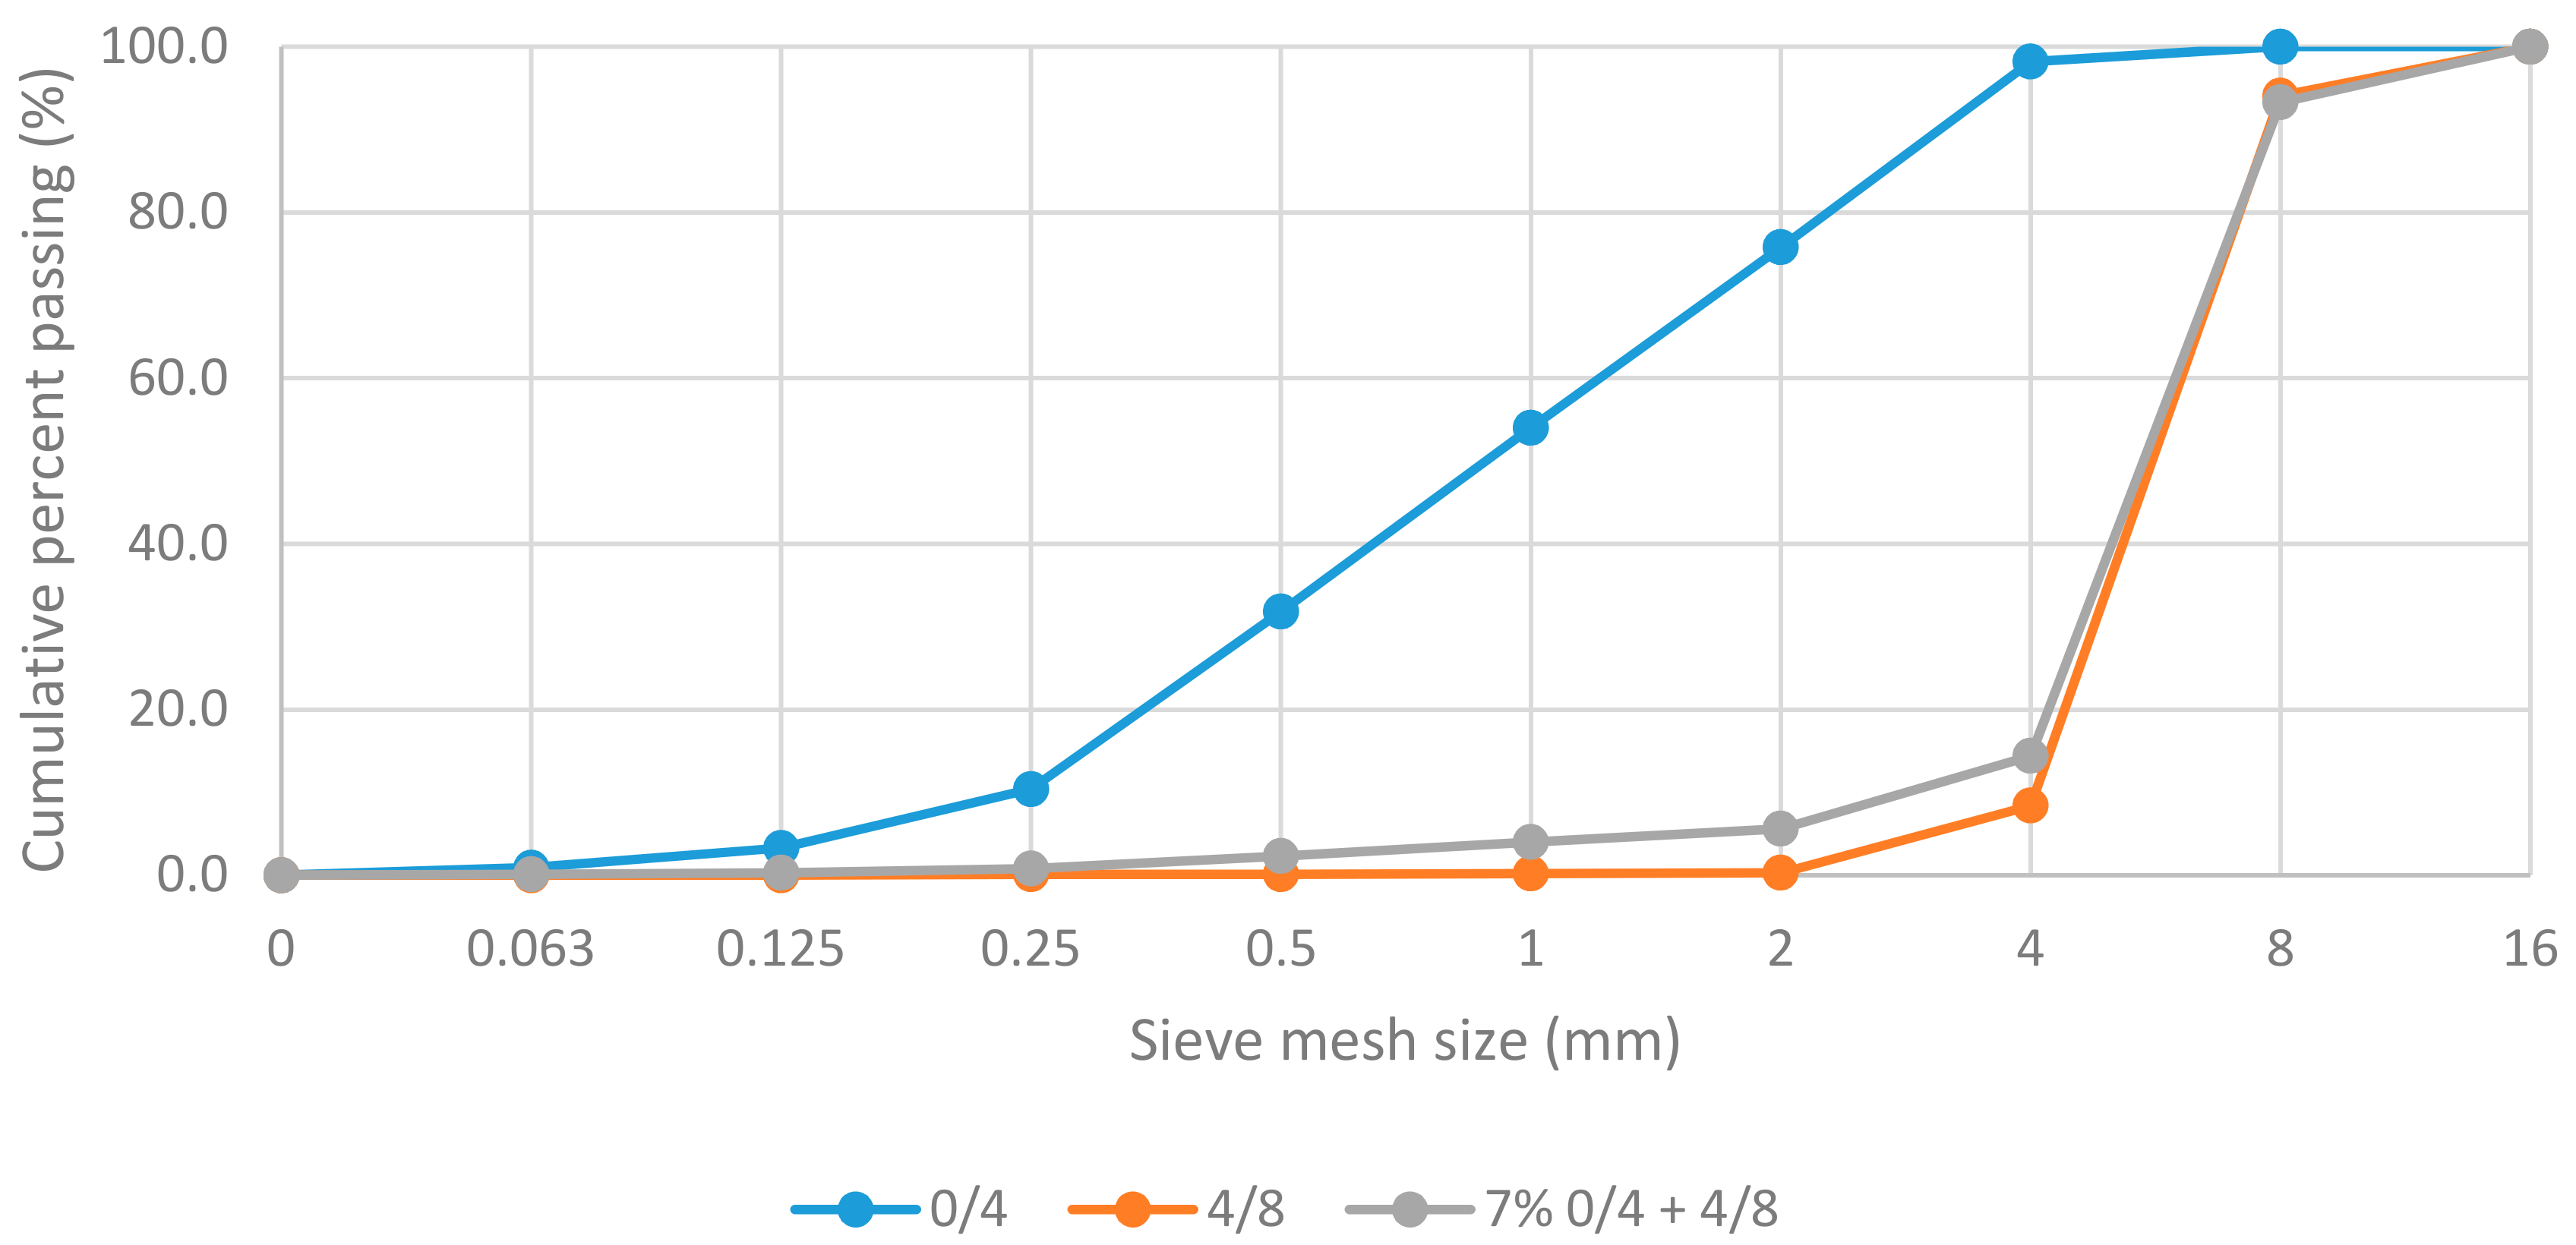
To create an open structure of concrete, single-size coarse aggregate of fraction 4/8 was used. To maintain the desirable performance of pervious concrete, 7% of sand was added to the aggregate mixture. The properties of aggregate are given in Table 1. The sieve analysis of aggregate is given in Figure 1.
The proportions of materials were calculated by the method given in [13]. Here, the void content is one of the input parameters. In the experiment, three recipes of pervious concrete mixtures were designed, where the void content was assumed as constant. The value was selected using the following considerations: according to [14], void content for pervious concrete should be 18–23%; according to [3], it should range between 15% and 25%. Assuming these boundaries, 20% void content was chosen for the calculation of mix proportions; hence, the volume of the aggregate (0.575 m3) and the volume of cement paste (0.225 m3) were constant for all of the mixtures. Mixtures differed from each other only in terms of w/c ratio (0.35, 0.30, and 0.25) and of plasticizer dosage to control the workability. Final proportions of mixtures for 1 m3 of fresh pervious concrete and the theoretical (calculated) unit weight are given in Table 2.
Samples of pervious concrete were mixed in the forced-action concrete mixer. The first step was to mix the aggregate for about 15 s. Then, cement was added and mixed for another 15 s. Finally, the water with superplasticizer was added and mixed thoroughly for 2 min, by a 3-min rest, and followed by a 1-min final mixing. Cylindrical specimens of 100 mm in diameter and 200 mm in height were prepared in three layers, through constant compacting (15 hits for each layer). This compaction process was chosen to determine if it is appropriate to achieve a 20% void content. Samples were demoulded after 24 h and were then cured under standard moisture and temperature conditions (water curing and 20 ± 3 °C) until the corresponding testing time. The strength properties were tested after 2 and 28 days of curing. Pace rate during compressive strength test was set to 0.6 MPa/s and 0.06 MPa/s for splitting tensile strength respectively. In addition, the compressive strength, as well as dry unit weight, void content and hydraulic conductivity were tested after 120 days of curing. The void content, together with unit weight were controlled by comparison of the theoretical (calculated) values and real experimental results. The results were also analysed by the dependence of individual properties and the specification of correlation.
The unit weight of pervious concrete specimens was tested under oven-dry conditions. Samples of pervious concrete were dried in the oven until they achieved a constant mass. That means the difference between mass of specific sample after 24 h of drying is less than 0.1%. The void content of pervious concrete specimens was tested and final values were calculated using following equation:
where:
- Vr—void content (%)
- w2—oven dried mass of sample (kg)
- w1—mass of sample submerged in water (kg)
- ρw—density of water (kg/m3)
- V—volume of sample (m3)
The hydraulic conductivity of pervious concrete specimens was tested using the falling-head permeability test. For this purpose, our own apparatus was constructed, as illustrated in Figure 2. The initial water level in the stand-pipe was 350 mm and the final water level was 50 mm. The time needed for water level to fall from 350 mm to 50 mm was recorded. Values of hydraulic conductivity were calculated and were expressed using the following equation:
where:
- k—hydraulic conductivity (mm/s)
- a—cross section area of stand pipe (mm2)
- L—length of specimen (mm)
- A—cross section area of specimen (mm2)
- t—elapsed time (s)
- h0—water head height at the beginning of the test (mm)
- ht—water head height at the end of the test (mm)
Initial water level in stand pipe was 350 mm and final water level was 50 mm. Time needed to fall water level from 350 mm to 50 mm was recorded.
3. Results and Discussion
In this chapter, the results in terms of compressive strength, splitting tensile strength, unit weight, void content, and hydraulic conductivity are given. The appropriate discussion is attached to the results where unexpected behaviour was observed. All of the results are given as an average of four samples, while the standard deviation is given in the parentheses. The relationships between the key features of pervious concrete are given in the end of this chapter.
During the mixing, the workability of fresh mixture was visually controlled. Mixture W35 (w/c = 0.35) showed a slightly runny character immediately after mixing; however, after a few minutes, the excessive water was soaked by the aggregate. On the other hand, mixture W25 (w/c = 0.25) showed a very stiff nature and despite the higher dosage of plasticizer (lignosulphonate base), it was difficult to process it.
3.1. Compressive and Splitting Tensile Strength
The compressive and splitting tensile strength of concrete samples were tested. Compressive strength was tested after 2, 28, and 120 days of curing, while the splitting tensile strength was tested after 2 and 28 days of curing (Table 3).
The highest compressive strength after two days of curing was achieved by the W25 mixture (10.5 MPa). The highest compressive strength after 28 days of curing was also achieved by the W25 mixture (17.5 MPa). After 120 days of curing, the highest compressive strength was achieved by the W35 mixture (20.0 MPa). The differences between the compressive strength values of mixtures are very slight and can probably be interpreted as negligible from the point of view of w/c ratio range.
The highest splitting tensile strength after two days of curing was achieved by the W30 mixture (1.5 MPa). The highest splitting tensile strength after 28 days of curing was achieved by the W35 mixture (2.0 MPa). Since this mixture has the highest w/c (0.35), it probably can be explained by better workability, and thus better bond between the aggregate and the cement paste. In the case of the W30 and W25 mixtures, stiffer cement paste showed a weaker adhesion to aggregate grains, which resulted in lower splitting tensile strength. Similar behaviour is observed and discussed in [15,16]. However, due to the very slight difference in splitting tensile strength between mixtures (difference was smaller than measurement accuracy), it can be assumed that the present variation in the w/c ratio does not have a significant influence on the splitting tensile strength. Testing the splitting tensile strength enables the study of the nature of failure, since it is clearly visible. The failure crack came through most of the aggregate grains; this indicates the good performance of cement stone. Therefore, the strength of the aggregate seems to be a limiting factor here, and further increasing of the cement-paste strength by lowering the w/c ratio would not necessarily lead to a better strength of concrete, as also shown in [16].
3.2. Density and Void Content
The results of unit weight at dry conditions and void content are given in Table 4. Since these properties directly affect the permeability, it is first evaluated whether they meet the theoretical values. Mixtures W35 and W30 are close to the calculated unit weight (given in Table 2), while mixture W25 achieved slightly lower unit weight than expected. According to the calculations and theoretical assumptions, the unit weight should increase as the w/c ratio decreases. This behaviour is not observed in our experiment. It can be explained by application of the same way of compaction for all of the samples, while the stiffer W30 and W25 mixtures require more compaction effort to reach the target unit weight. The void content of mixtures did not exactly achieve the calculated values (20%); the values were higher—23% for mixtures W35 and W30 and 26% for the W25 mixture. The void content theoretically should not change with w/c ratio variations because it comes from the mixture design method, and because all the mixtures had the same volume of cement paste and aggregate. The same explanation of different behaviour than expected can be stated here as above. However, it only describes consistency between theoretical calculation and real experiment results. What is more important is that the values of void content are practically the same, as expected.
3.3. Hydraulic Conductivity
The hydraulic conductivity is the basic parameter to define the permeability of pervious concrete. The results of hydraulic conductivity are given in Table 4. Values are comparable with those presented in studies like [17,18]. The highest hydraulic conductivity was achieved by the W25 mixture (10.2 mm/s). As in the case of void content, the hydraulic conductivity should be the same for all of the mixtures and should not vary with changes in w/c ratio, since it is mainly the function of interconnected void content, which has been assumed in the calculation at 20% for all of the mixtures. In practice, the results of hydraulic conductivity in the experiment on average corresponds with those of void content given in Table 4—higher is the void content, higher is the hydraulic conductivity. Similarly, it is presented in [17] that the mixture with the highest hydraulic conductivity supports the conclusion that the low w/c ratio would have led to decreased workability and lower density. This lower density results in a greater amount of pore space available for water to pass through, thus increase the hydraulic conductivity.
A wide range of hydraulic conductivity results was achieved with the W35 mixture (2.4–15 mm/s), which is represented by high standard deviation. This is probably a consequence of higher w/c ratio (0.35)—it makes the cement paste too runny and affects the void structure, and thus also the hydraulic conductivity in an inappropriate way (the cement paste settles down and closes the open void structure). It could be hard to repeat the same results with the same mixture.
3.4. Interactions between Pervious Concrete Properties
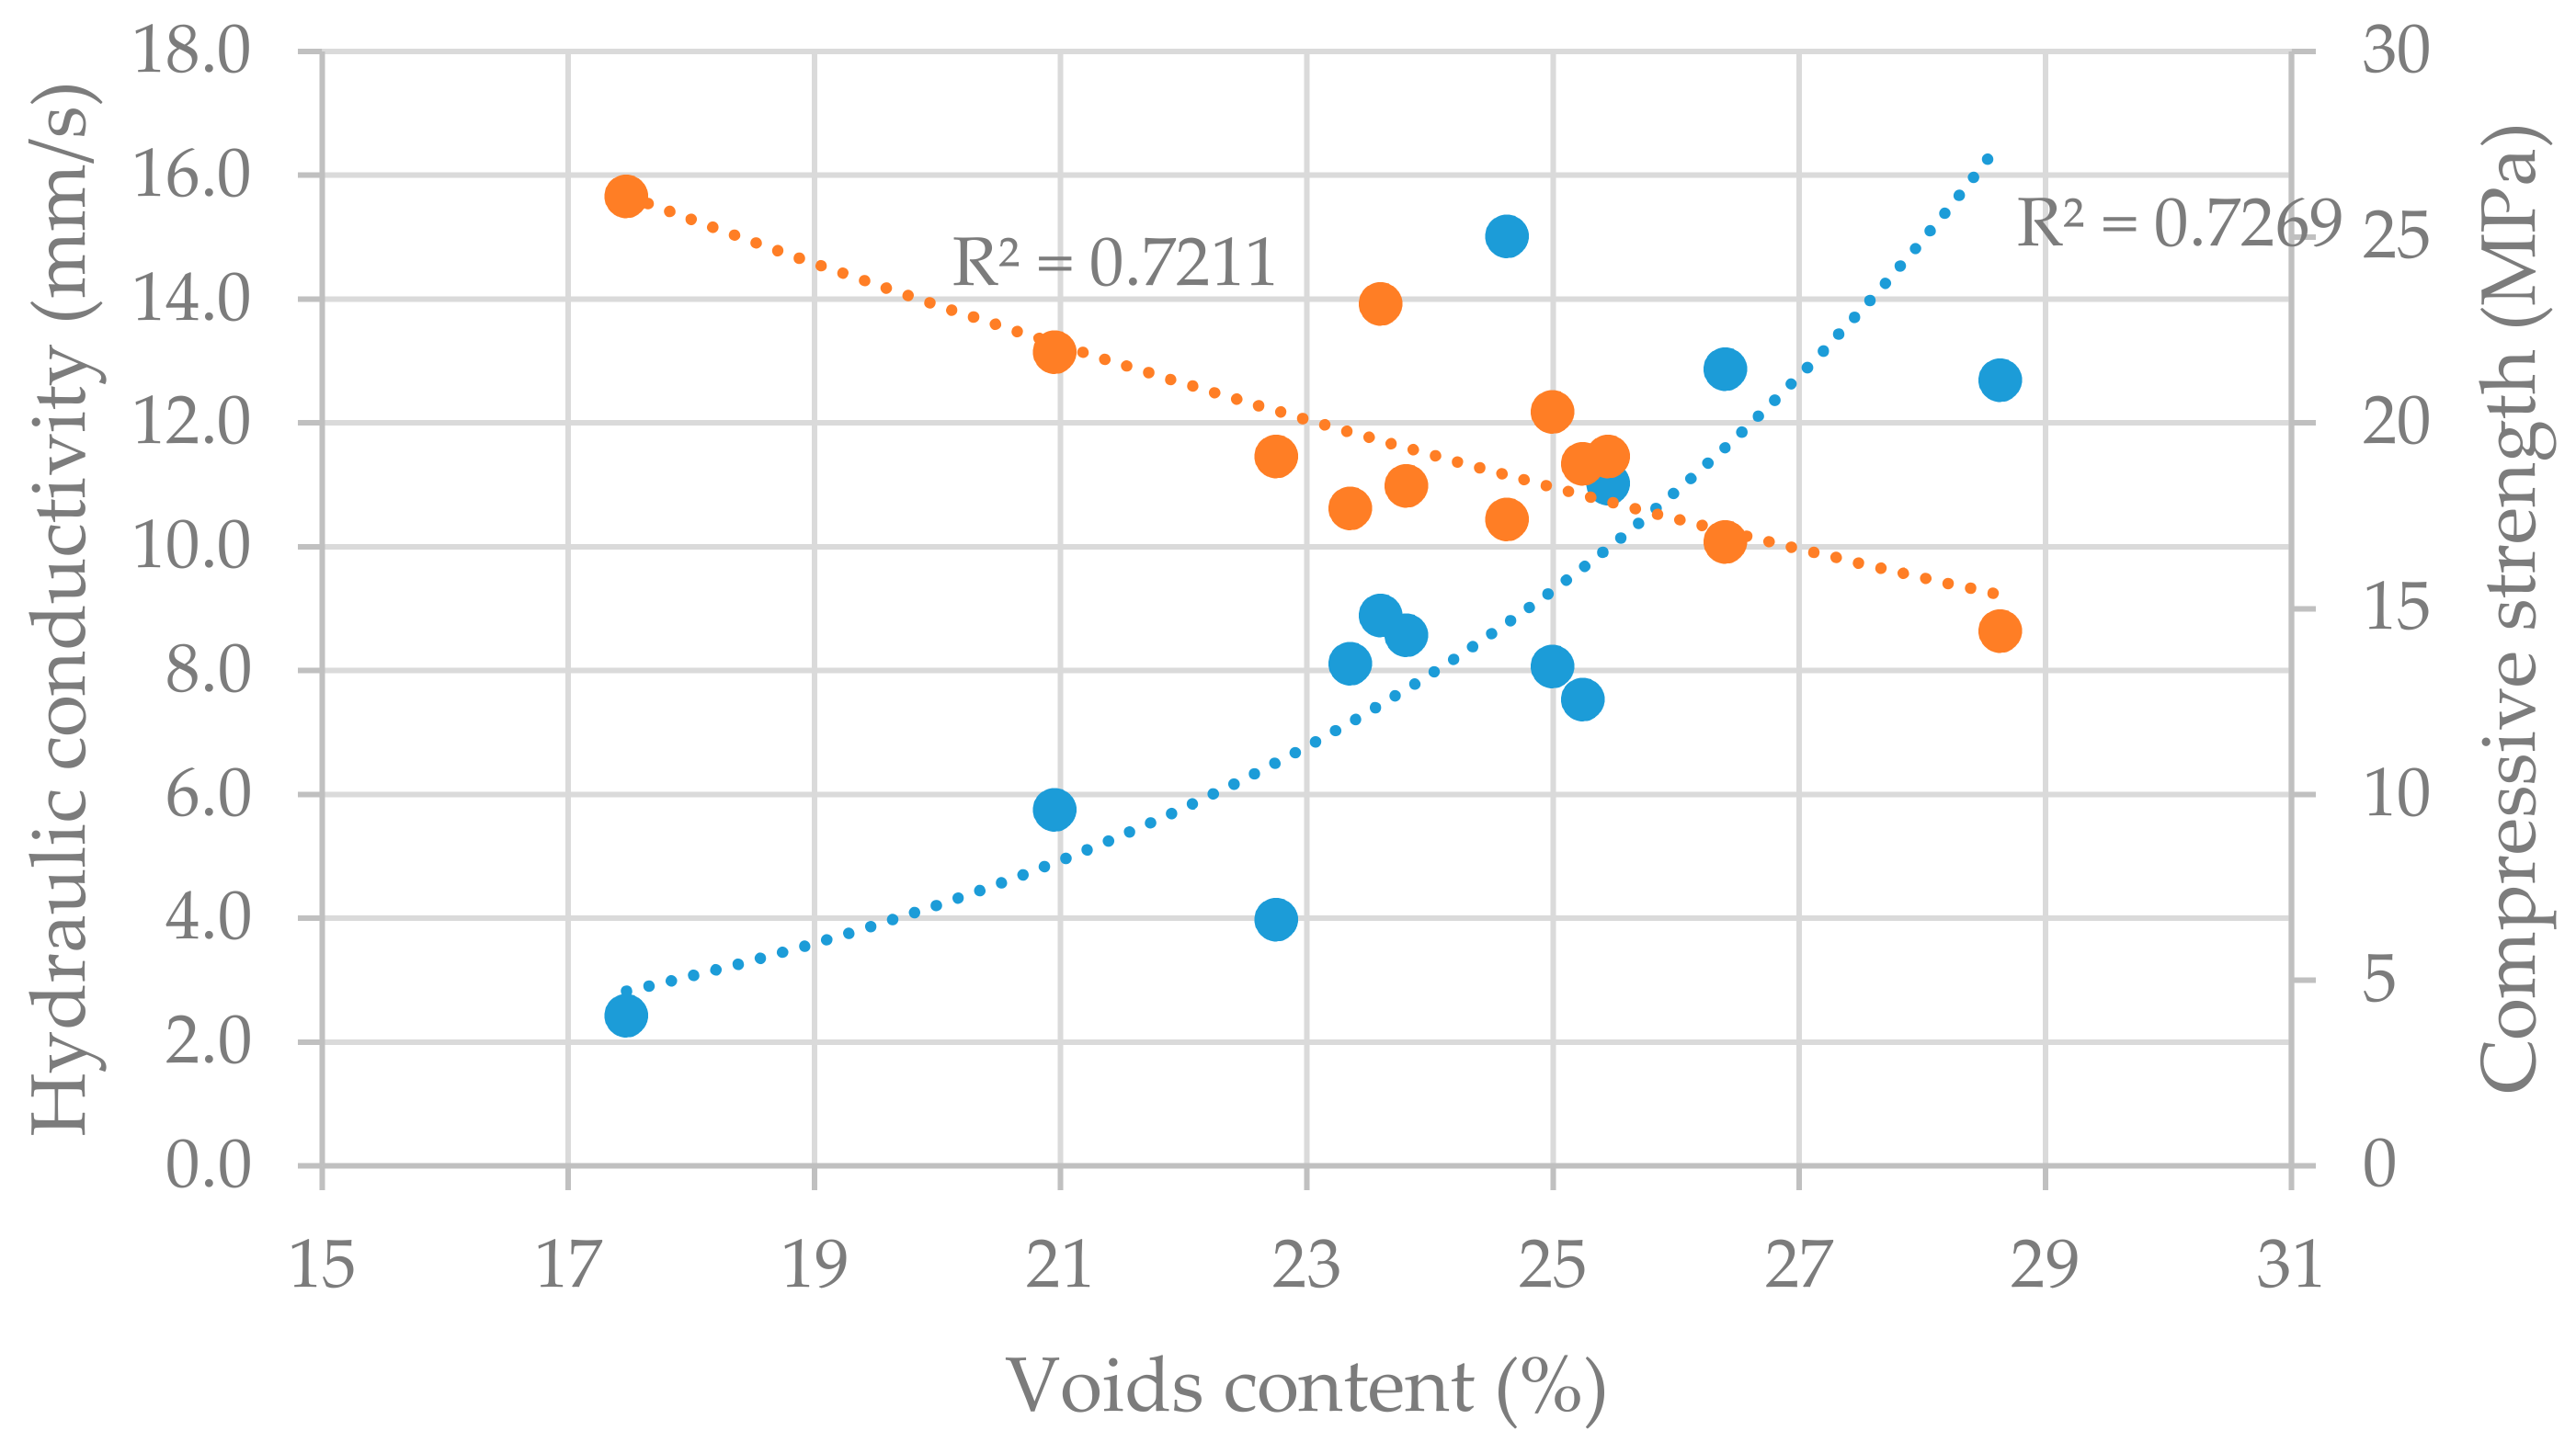
The dependence between void content, hydraulic conductivity, and compressive strength is illustrated in the Figure 3, while the exponential regression model was applied. The experiment shows very tight dependence between void content and hydraulic conductivity (R2 = 0.73), as well as between void content and compressive strength (R2 = 0.72).
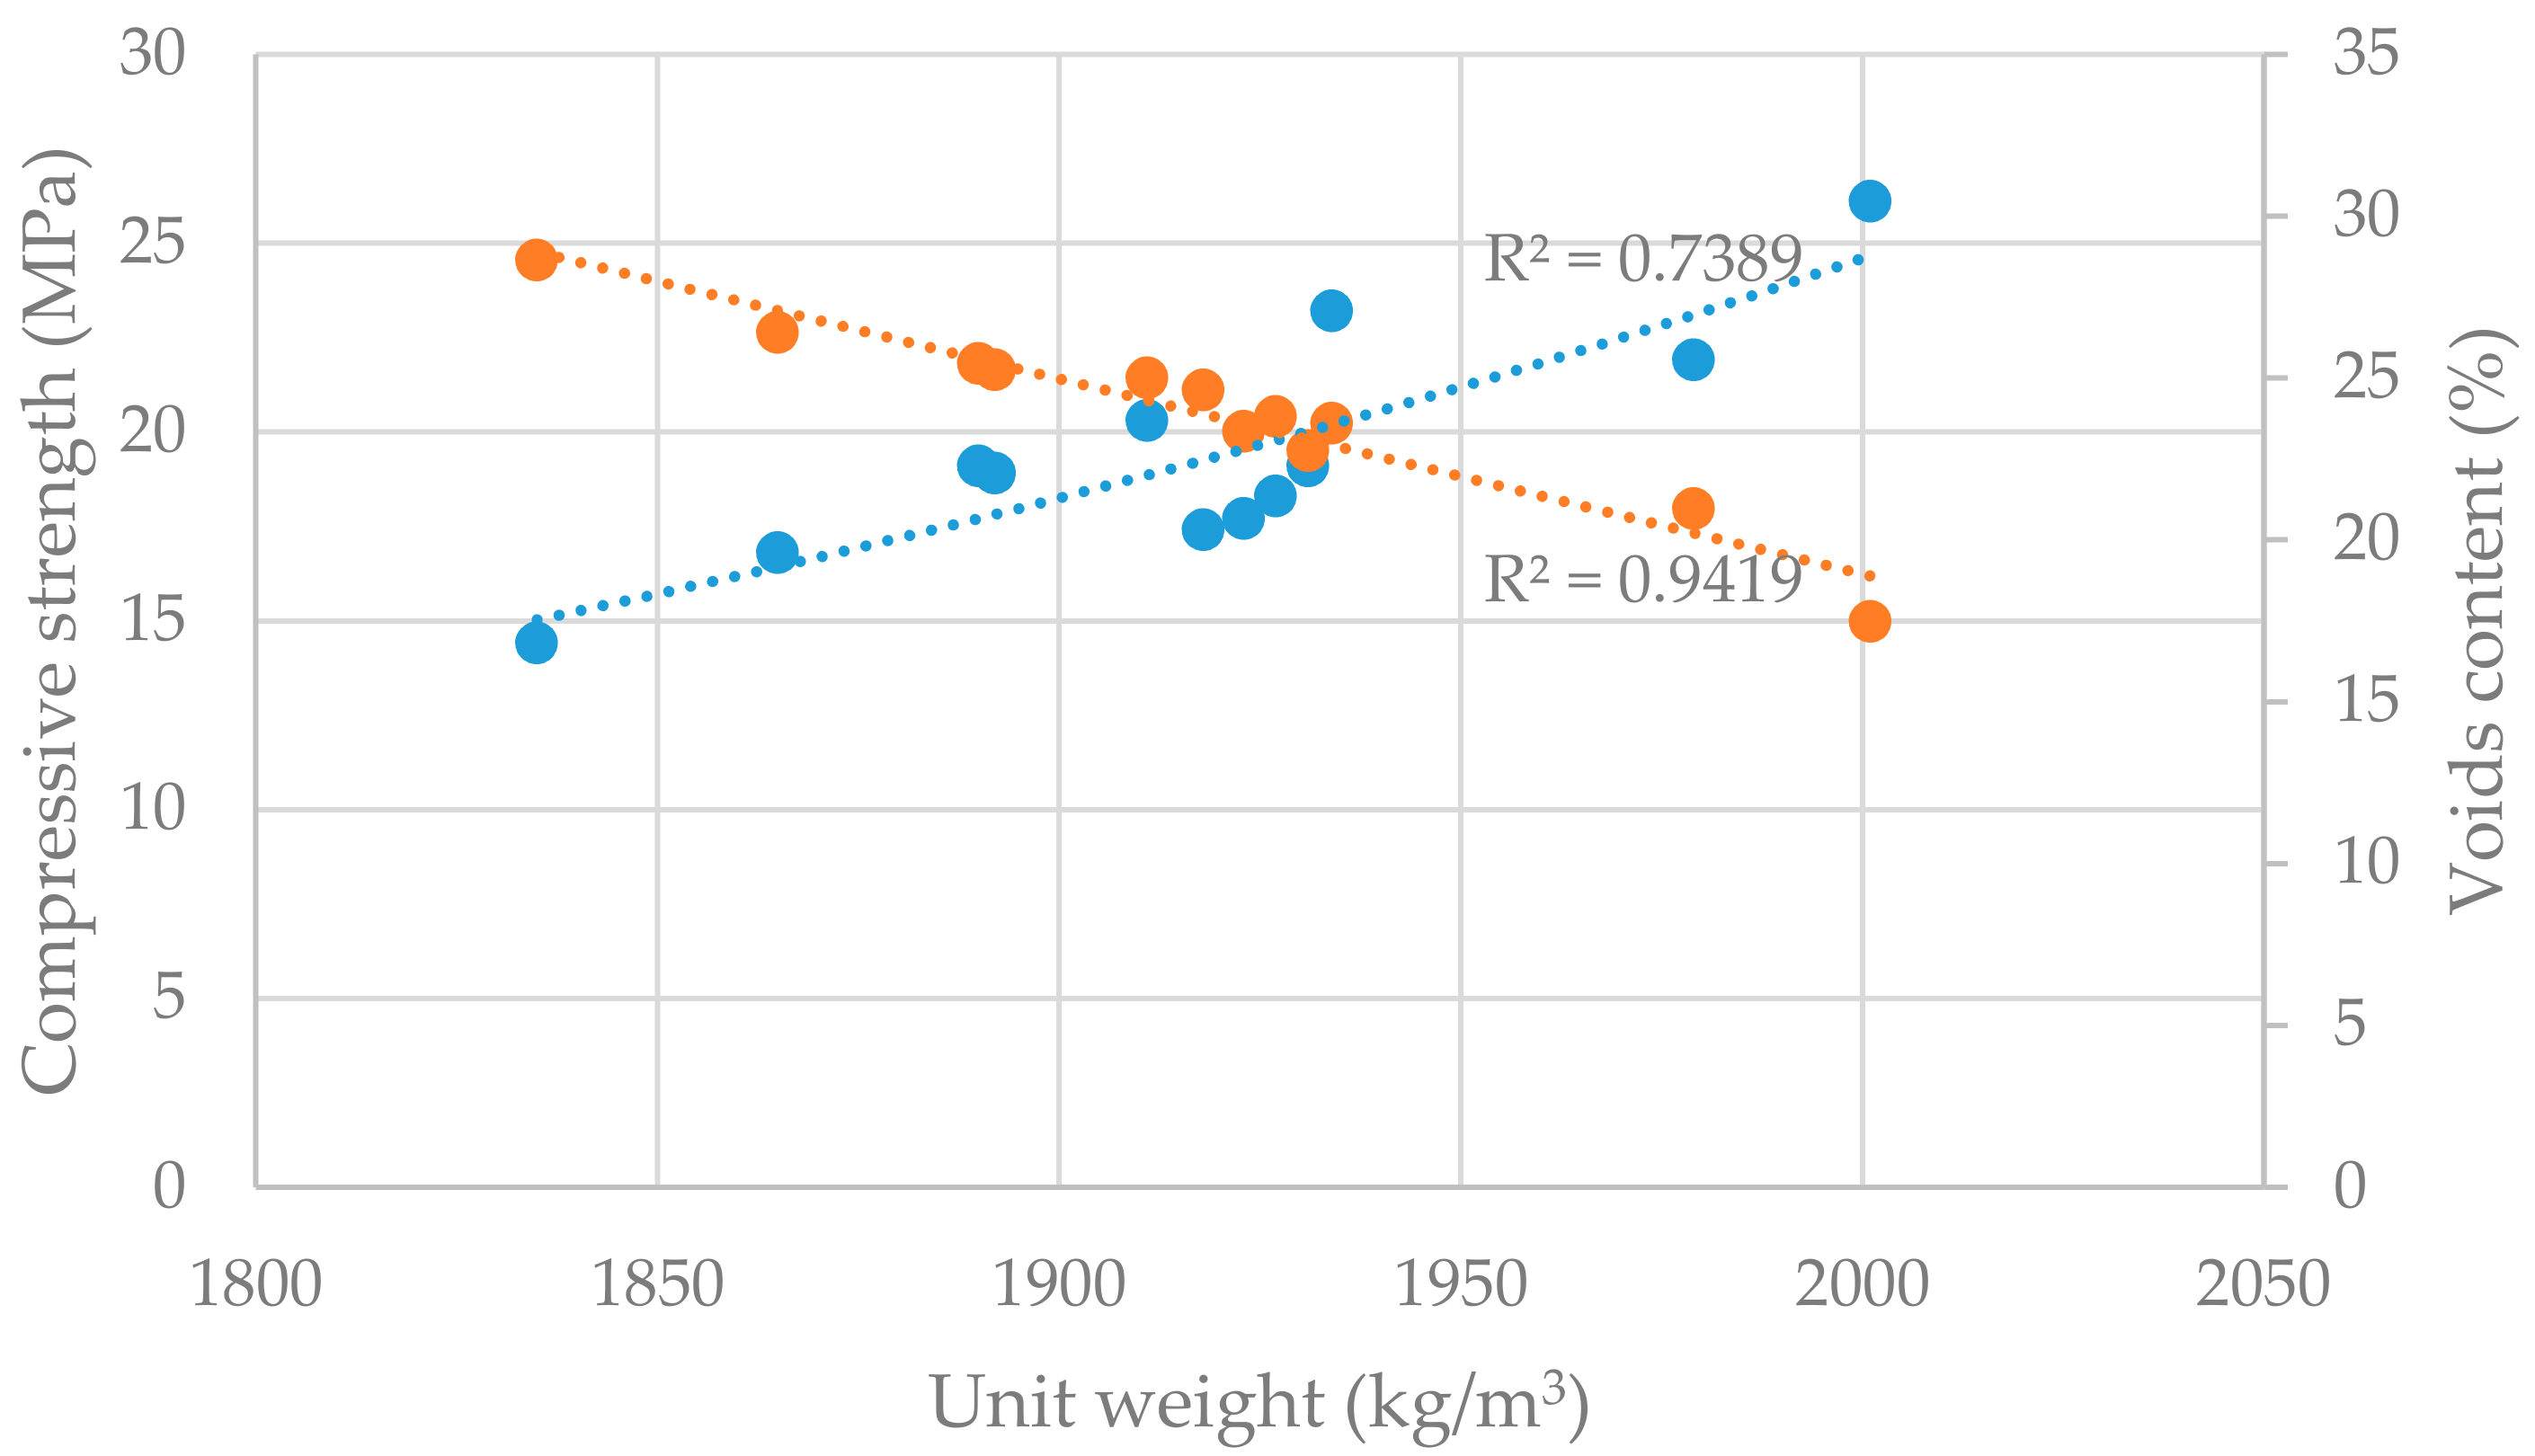
The dependence between unit weight, compressive strength, and void content is illustrated in the Figure 4, while the linear regression model was applied. The experiment shows very tight dependence between unit weight and compressive strength (R2 = 0.74), as well as between unit weight and void content (R2 = 0.94).
4. Conclusions
The experiment shows results pertaining to the key properties of pervious concrete made of locally available materials. As such, the test results could be useful for others working in the same area. The influence of w/c ratio in the range 0.35 to 0.25 on pervious concrete properties was tested. The findings should be weighted from the point of view of specific approach to design of mix proportions that were used in this experiment—the constant volume of the aggregate and the cement paste for all tested mixtures. Changes in the w/c ratio were made not only by changing the amount of water to the same amount of cement, but the amount of cement was corrected accordingly to keep the same volume of cement paste. The following conclusions can be formulated:
- Decrease in w/c ratio caused the fresh pervious concrete to be stiffer, and thus more difficult to process—despite the use of higher volume of plasticizer. This probably resulted in unexpectedly lower unit weight, higher void content, and higher hydraulic conductivity of the W25 mixture.
- The tested range of w/c ratio caused only very slight differences in strength characteristics of pervious concrete, though practically sufficient values were achieved: 14.5–17.5 MPa of compressive strength and 1.6–2.0 MPa of splitting tensile strength.
- The strength of the aggregate seems to be a limiting factor in the further strengthening of pervious concrete. This opinion is based on the crack formation that occurs at yield strength of samples.
- When applying 0.35–0.25 w/c ratio, hydraulic conductivity values ranging from 8.6 to 10.2 mm/s were achieved.
- A good correlation was found for the key properties of pervious concrete, namely unit weight, compressive strength, void content, and hydraulic conductivity. The regression analysis shows high R2 values (0.72–0.94).
- Optimization of the kind and dose of chemical admixtures is necessary for the production of pervious concrete with very low w/c ratio.
The results of strength characteristics found in the presented experiment are promising and open up opportunities for future experimental work focusing on various locally available materials. The achieved values of hydraulic conductivity can be usable in storm-water management of urban areas when applying the pervious concrete for pavements, thus bringing environmental benefit to the lives of people who reside in cities.
Acknowledgments
This work was supported by the project ITMS Center of excellent integrated research of progressive building constructions, materials and technologies (grant number 26220120037) and by the project VEGA (grant number 1/0524/18).
Author Contributions
Marek Kováč conceived, designed and performed the experiment, analyzed data and wrote the paper; Alena Sičáková wrote the paper. Both authors read and approved the final manuscript.
Conflicts of Interest
The authors declare no conflict of interest.
References
- Brattebo, B.; Booth, D. Long-Term Stormwater Quantity and Quality Performance of Permeable Pavement Systems. Water Res. 2003, 37, 4369–4376. [Google Scholar] [CrossRef]
- Brown, D. Pervious Concrete Pavement: A Win-Win System. Concr. Technol. Today 2003, 24, 1–3. [Google Scholar]
- Tennis, P.D.; Leming, M.L.; Akers, D.J. Pervious Concrete Pavements; Portland Cement Association: Skokie, IL, USA, 2004. [Google Scholar]
- Haselbach, L.; Freeman, R. Vertical Porosity Distribution in Pervious Concrete Pavement. ACI Mater. J. 2006, 103, 452–458. [Google Scholar]
- Wang, K.; Schaefer, V.R.; Kevern, J.T.; Suleiman, M.T. Development of Mix Proportion for Functional and Durable Pervious Concrete; NRMCA Concrete Technology Forum: Nashville, TN, USA, 2006. [Google Scholar]
- Chindaprasirt, P.; Hatanaka, S.; Chareerat, T.; Mishima, N.; Yuasa, Y. Cement Paste Characteristics and Porous Concrete Properties. Constr. Build. Mater. 2008, 22, 894–901. [Google Scholar] [CrossRef]
- Joshi, T.; Dave, U. Evaluation of Strength, Permeability and Void Ratio of Pervious Concrete with Changing w/c Ratio and Aggregate Size. Int. J. Civ. Eng. Technol. 2016, 7, 276–284. [Google Scholar]
- Legret, M.; Colandini, V.; Le Marc, C. Effects of a Porous Pavement with Reservoir Structure on the Quality of Runoff Water and Soil. Sci. Total Environ. 1996, 190, 335–340. [Google Scholar] [CrossRef]
- Yang, J.; Jiang, G. Experimental Study on Properties of Pervious Concrete Pavement Materials. Cem. Concr. Res. 2003, 33, 381–386. [Google Scholar] [CrossRef]
- The United States Environmental Protection Agency (US EPA). Preliminary Data Summary of Urban Storm Water Best Management Practices; The United States Environmental Protection Agency: Washington, DC, USA, 1999.
- Slovak Office of Standards, Metrology and Testing. STN EN 197-1 Cement. Part 1: Composition, Specifications and Conformity Criteria for Common Cements; Slovak Office of Standards, Metrology and Testing: Bratislava, Slovakia, 2011. [Google Scholar]
- Slovak Office of Standards, Metrology and Testing. STN EN 12620: Aggregates for Concrete; Slovak Office of Standards, Metrology and Testing: Bratislava, Slovakia, 2008. [Google Scholar]
- Nguyen, D.H.; Sebaibi, N.; Boutouil, M.; Leleyter, L.; Baurd, F. A Modified Method for the Design of Pervious Concrete Mix. Constr. Build. Mater. 2014, 73, 271–282. [Google Scholar] [CrossRef]
- Slovak Office of Standards, Metrology and Testing. STN 73 6124-2: Road Construction. Part 2: Concrete Drainage Layers; Slovak Office of Standards, Metrology and Testing: Bratislava, Slovakia, 2013. [Google Scholar]
- Neamitha, M.; Supraja, T.M. Influence of Water Cement Ratio and the Size of Aggregate on The Properties Of Pervious Concrete. Int. Ref. J. Eng. Sci. 2017, 6, 9–16. [Google Scholar]
- Chopra, M.; Wanielista, J.; Mulligan, A.M. Compressive Strength of Pervious Concrete Pavements; Storm Water Managenent Academy, University of Central Florida: Orlando, FL, USA, 2007. [Google Scholar]
- McCain, G.N.; Dewoolkar, M.M. Porous Concrete Pavements: Mechanical and Hydraulic Properties. Available online: http://www.uvm.edu/~transctr/publications/TRB_2010/10-2228.pdf (accessed on 29 November 2017).
- Batezini, R.; Balbo, J.T. Study on the hydraulic conductivity by constant and falling head methods for pervious concrete. Revista IBRACON de Estruturas e Materiais 2015, 8. [Google Scholar] [CrossRef]
Figure 1.
Sieve analysis of aggregate used in experiment.

Figure 2.
The apparatus and arrangement for testing the hydraulic conductivity of pervious concrete sample.
Figure 2.
The apparatus and arrangement for testing the hydraulic conductivity of pervious concrete sample.
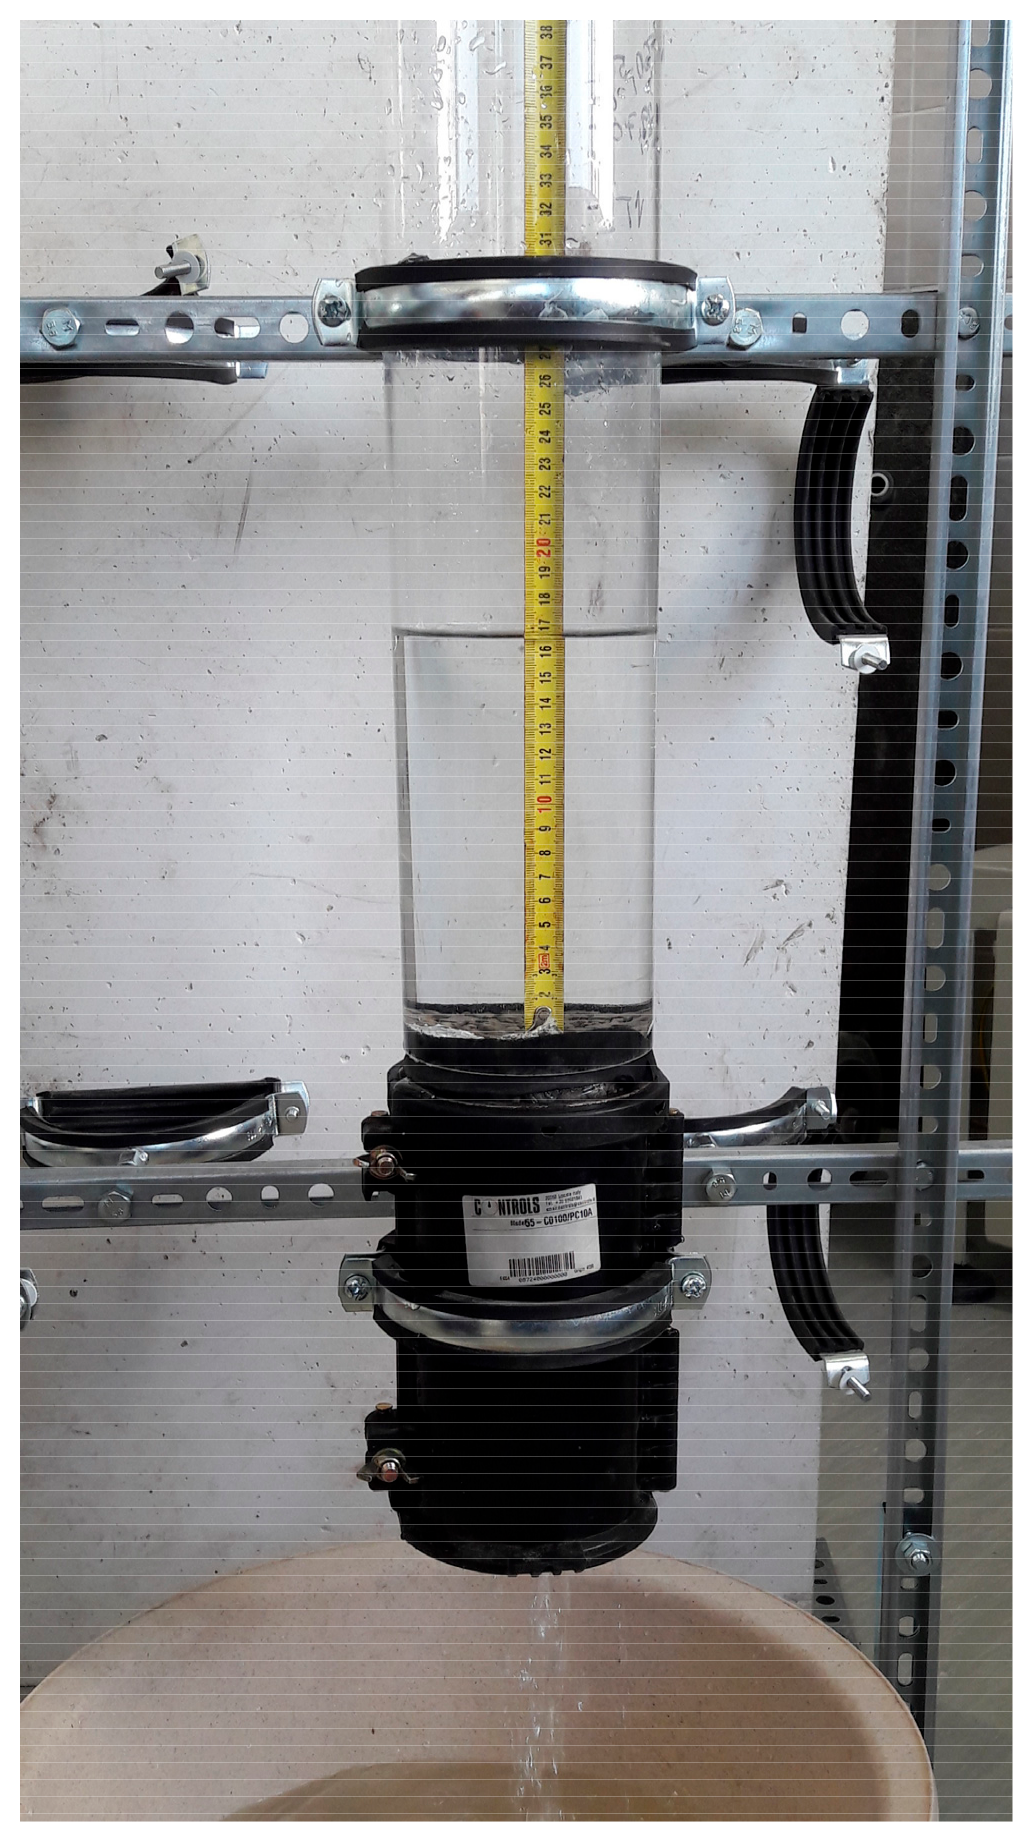
Figure 3.
Interaction between hydraulic conductivity, void content, and the compressive strength of pervious concrete samples.
Figure 3.
Interaction between hydraulic conductivity, void content, and the compressive strength of pervious concrete samples.

Figure 4.
Interaction between compressive strength, unit weight and void content of pervious concrete samples.
Figure 4.
Interaction between compressive strength, unit weight and void content of pervious concrete samples.


Table 1.
Properties of aggregate used in experimental work.
| Properties | Aggregate Fraction | |
|---|---|---|
| 0/4 | 4/8 | |
| Density (kg/m3) | 2600 | 2580 |
| Dry rodded unit weight (kg/m3) | 1830 | 1580 |
| Water absorption (%) | 1.2 | 1.4 |
| Void content (%) | 30 | 39 |
Table 2.
Proportions of pervious concrete mixtures per 1 m3.
| Material | Units | Mixture | ||
|---|---|---|---|---|
| W35 | W30 | W25 | ||
| Cement | (kg/m3) | 327 | 354 | 384 |
| Water | 115 | 106 | 96 | |
| Aggregate 0/4 | 96 | 96 | 96 | |
| Aggregate 4/8 | 1375 | 1375 | 1375 | |
| Plasticizer | 0.3 | 1.4 | 4.2 | |
| w/c | (–) | 0.35 | 0.30 | 0.25 |
| Calculated unit weight | (kg/m3) | 1913 | 1931 | 1951 |
| Calculated void content | (%) | 20 | 20 | 20 |
Table 3.
Results of compressive (fc) and splitting tensile strength (ft) including standard deviation.
Table 3.
Results of compressive (fc) and splitting tensile strength (ft) including standard deviation.
| Sample | fc after 2 Days (MPa) | ft after 2 Days | fc after 28 Days (MPa) | ft after 28 Days | fc after 120 Days (MPa) |
|---|---|---|---|---|---|
| W35 | 9.5 (0.9) | 1.3 (0.10) | 14.5 (0.3) | 2.0 (0.21) | 20.0 (4.3) |
| W30 | 9.0 (0.6) | 1.5 (0.21) | 16.0 (1.2) | 1.7 (0.53) | 19.0 (1.9) |
| W25 | 10.5 (1.7) | 1.4 (0.23) | 17.5 (2.8) | 1.6 (0.26) | 19.5 (3.7) |
Table 4.
Results of unit weight, void content, and hydraulic conductivity, including standard deviation.
Table 4.
Results of unit weight, void content, and hydraulic conductivity, including standard deviation.
| Sample | ρv (Dry) (kg/m3) | Vr (%) | k (mm/s) |
|---|---|---|---|
| W35 | 1930 (56) | 23 (3.9) | 8.6 (6.3) |
| W30 | 1930 (36) | 23 (1.8) | 7.5 (1.2) |
| W25 | 1890 (42) | 26 (2.6) | 10.2 (2.1) |
© 2018 by the authors. Licensee MDPI, Basel, Switzerland. This article is an open access article distributed under the terms and conditions of the Creative Commons Attribution (CC BY) license (http://creativecommons.org/licenses/by/4.0/).
Share and Cite
MDPI and ACS Style
Kováč, M.; Sičáková, A. Pervious Concrete as an Environmental Solution for Pavements: Focus on Key Properties. Environments 2018, 5, 11. https://doi.org/10.3390/environments5010011
AMA Style
Kováč M, Sičáková A. Pervious Concrete as an Environmental Solution for Pavements: Focus on Key Properties. Environments. 2018; 5(1):11. https://doi.org/10.3390/environments5010011
Chicago/Turabian StyleKováč, Marek, and Alena Sičáková. 2018. "Pervious Concrete as an Environmental Solution for Pavements: Focus on Key Properties" Environments 5, no. 1: 11. https://doi.org/10.3390/environments5010011
Note that from the first issue of 2016, this journal uses article numbers instead of page numbers. See further details here.