Electrochemistry-High Resolution Mass Spectrometry to Study Oxidation Products of Trimethoprim

 and
and
Abstract
:1. Introduction
2. Material and Methods
2.1. Reagents and Chemicals
2.2. Cyclic Voltammetry and Electrolysis
2.3. Electro-Assisted Fenton Reaction
2.4. Thin-Layer Flow Cell Coupled Online to High-Resolution Mass Spectrometry
2.5. Liquid Chromatography–Quadrupole–Time of Flight Mass Spectrometry (LC-QqTOFMS)
2.6. Identification of Oxidation Products
3. Results and Discussion
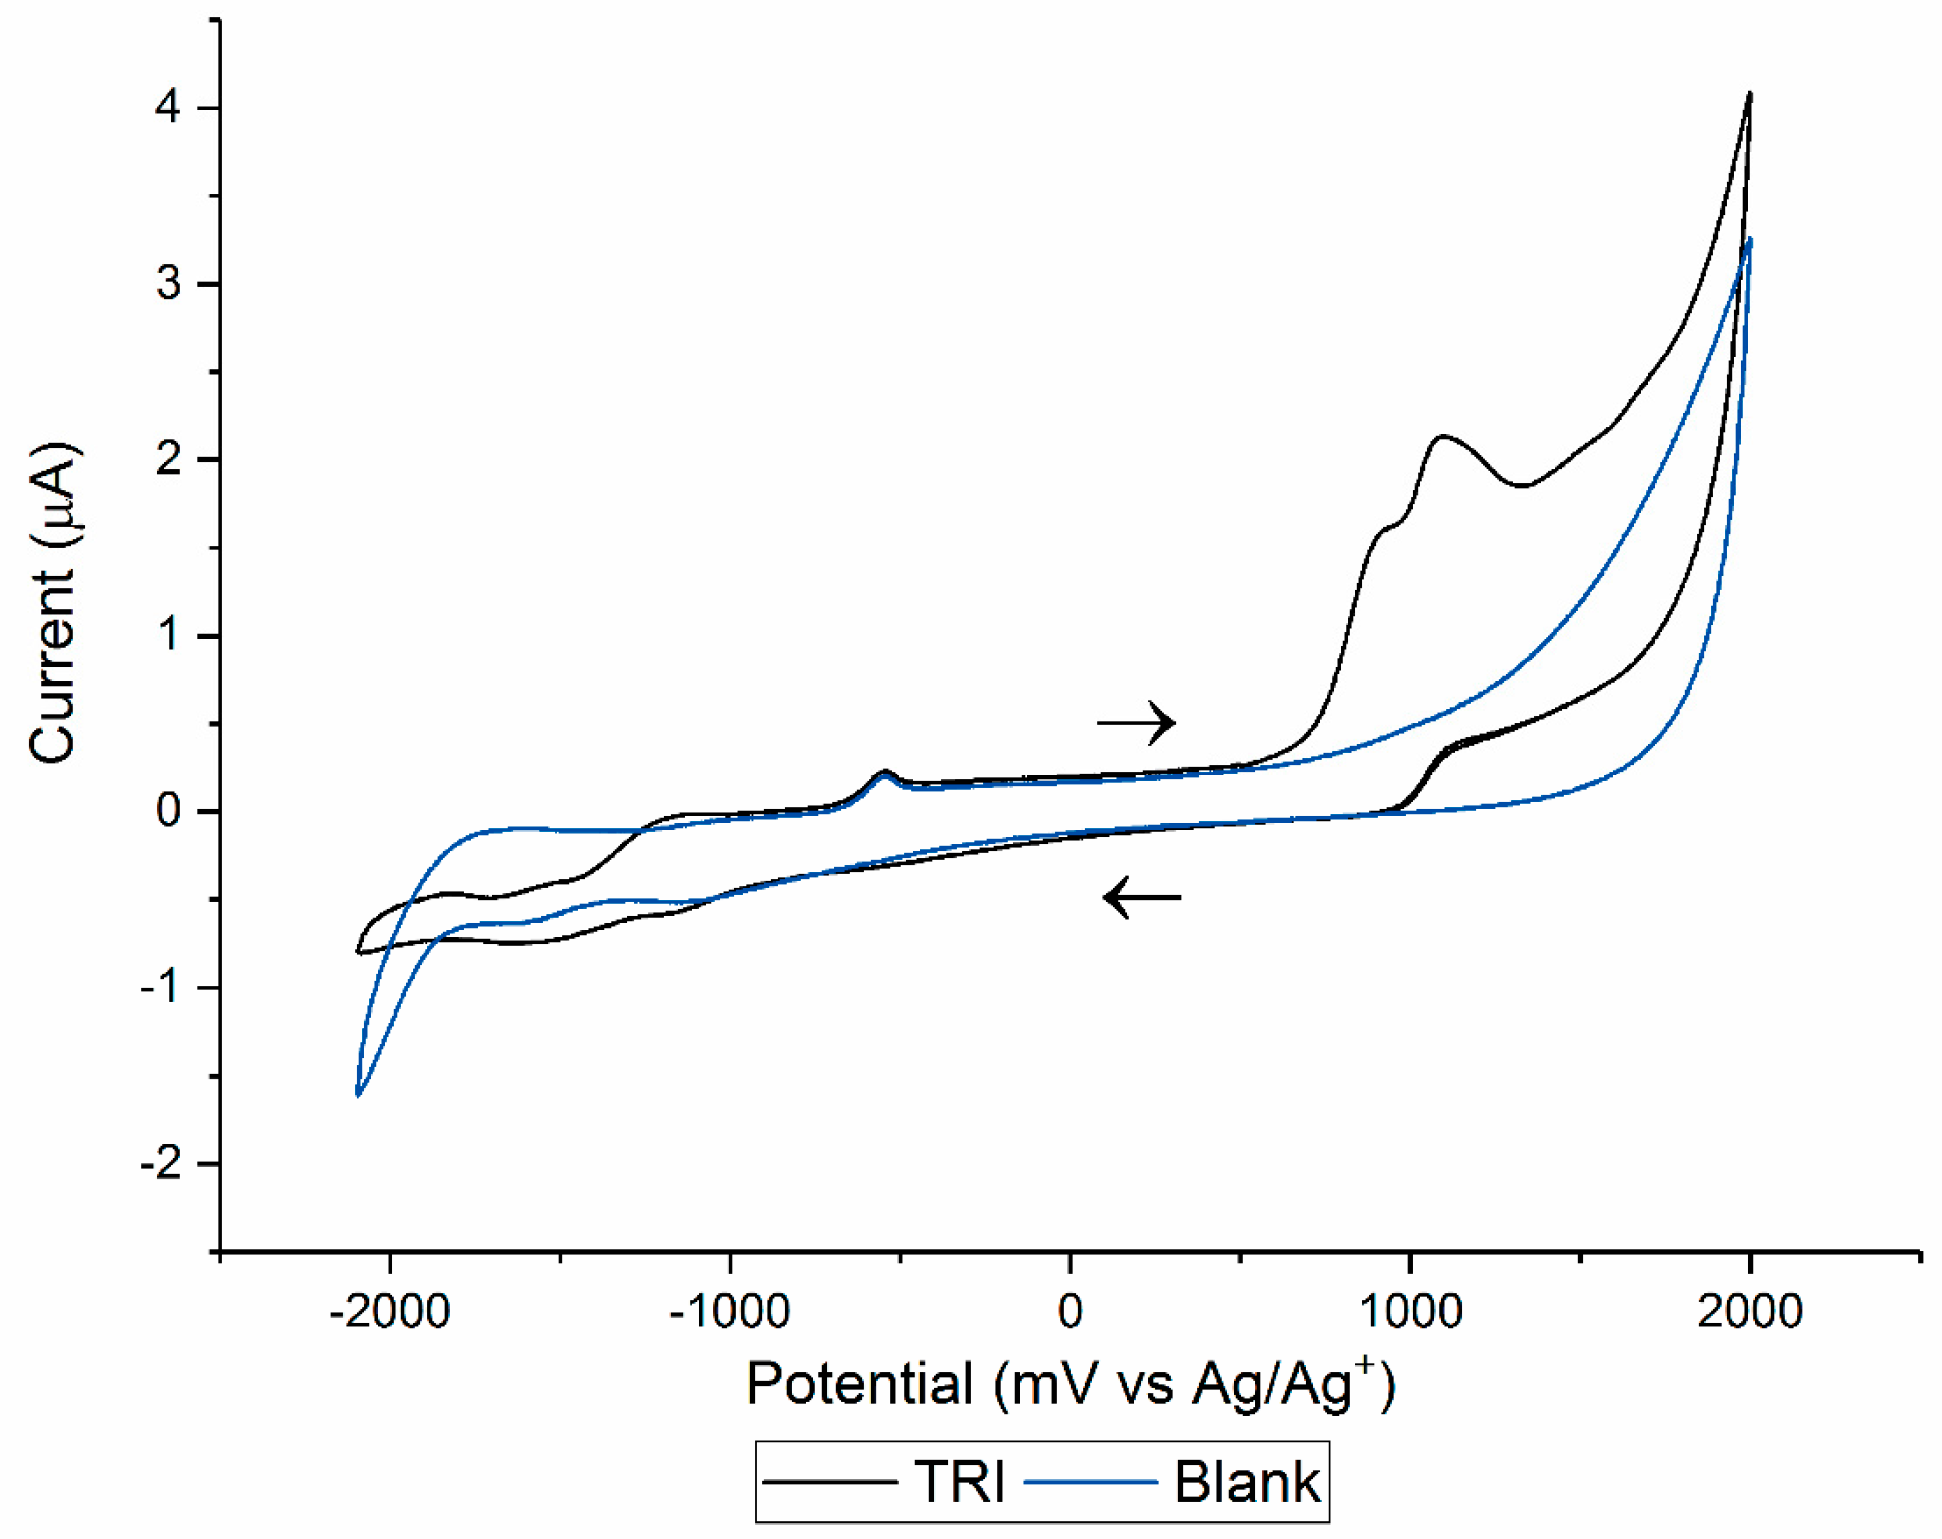
3.1. Cyclic Voltammetry and Electrolysis
3.2. Electrochemically-Assisted Fenton Reaction
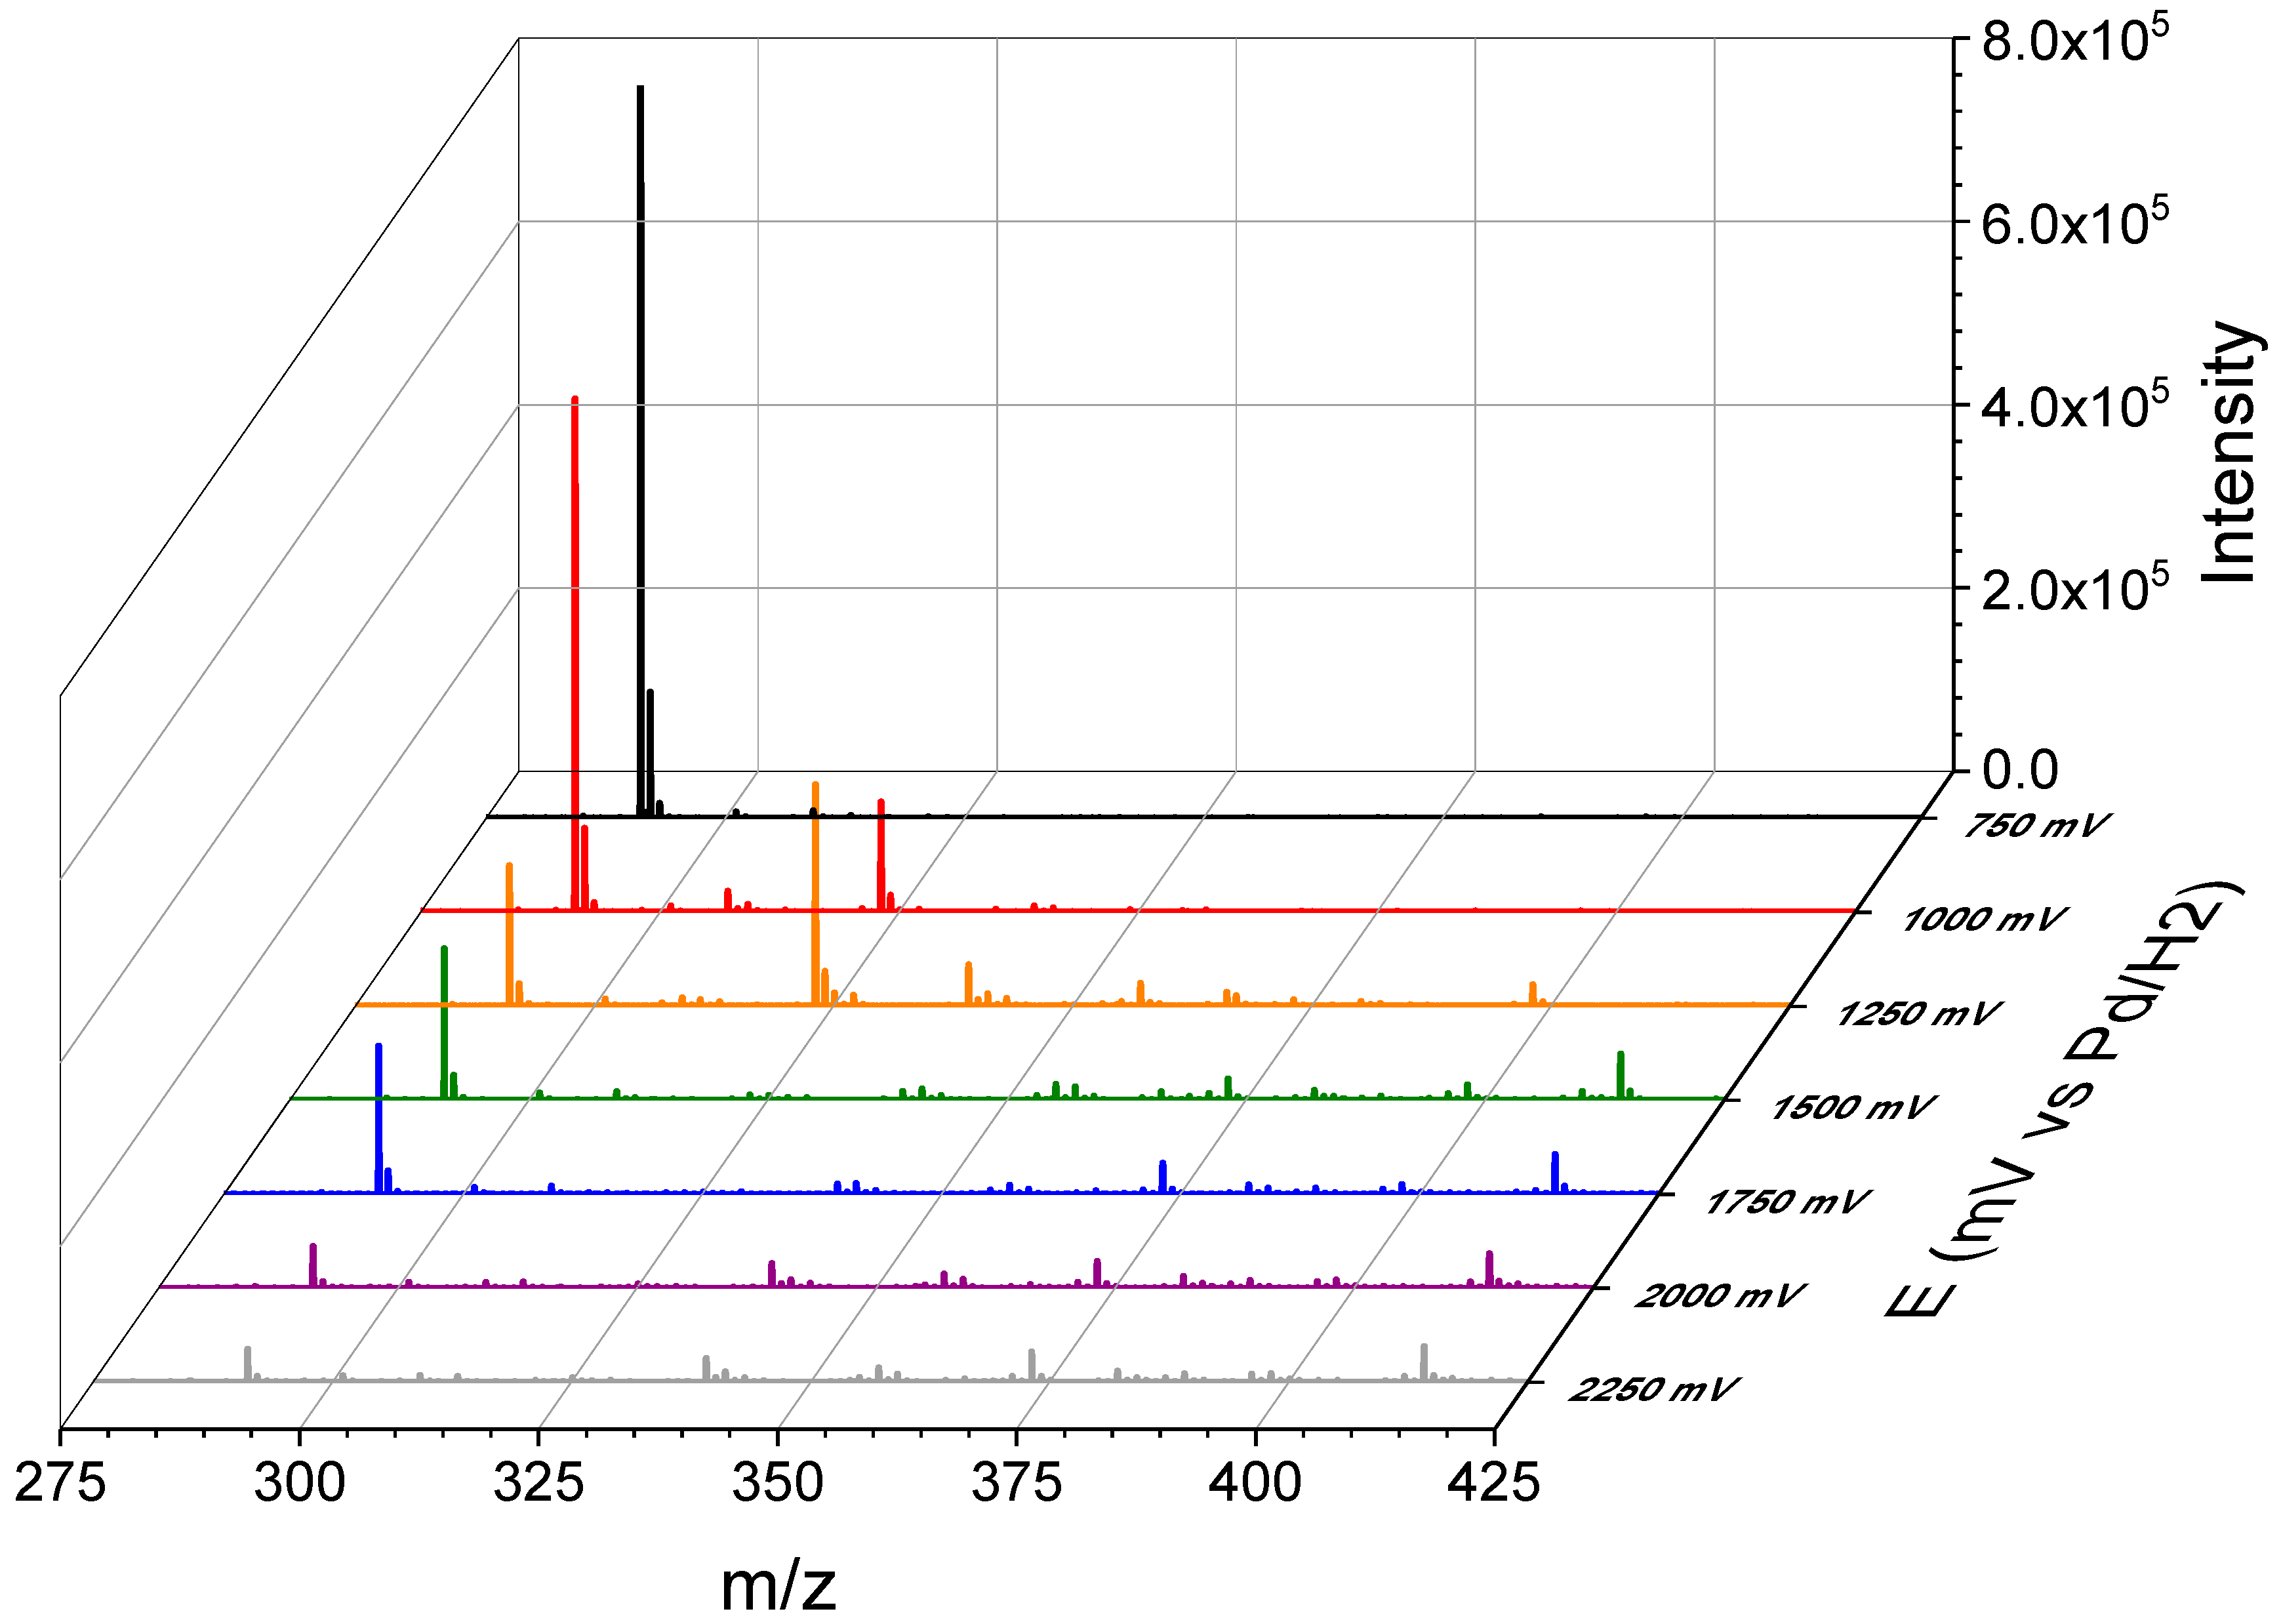
3.3. Thin-Layer Flow Cell Coupled Online to High-Resolution Mass Spectrometry
4. Conclusions
Supplementary Materials
Acknowledgments
Author Contributions
Conflicts of Interest
References
- Snyder, M.J. Cytochrome P450 enzymes in aquatic invertebrates: Recent advances and future directions. Aquat. Toxicol. 2000, 48, 529–547. [Google Scholar] [CrossRef]
- Lohmann, W.; Karst, U. Biomimetic modeling of oxidative drug metabolism. Anal. Bioanal. Chem. 2008, 391, 79–96. [Google Scholar] [CrossRef] [PubMed]
- Jahn, S.; Karst, U. Electrochemistry coupled to (liquid chromatography/) mass spectrometry—Current state and future perspectives. J. Chromatogr. A 2012, 1259, 16–49. [Google Scholar] [CrossRef] [PubMed]
- Yan, Z.; Caldwell, G.W. Stable-isotope trapping and high-throughput screenings of reactive metabolites using the isotope MS signature. Anal. Chem. 2004, 76, 6835–6847. [Google Scholar] [CrossRef] [PubMed]
- Glaze, W.H.; Kang, J.-W.; Chapin, D.H. The chemistry of water treatment processes involving ozone, hydrogen peroxide and ultraviolet radiation. Ozone-Sci. Eng. 1987, 9, 335–352. [Google Scholar] [CrossRef]
- Ikehata, K.; Naghashkar, N.J.; El-Din, M.G. Degradation of aqueous pharmaceuticals by ozonation and advanced oxidation processes: A review. Ozone-Sci. Eng. 2006, 28, 353–414. [Google Scholar] [CrossRef]
- Segura, P.A.; Saadi, K.; Clair, A.; Lecours, M.-A.; Yargeau, V. Application of XCMS online and toxicity bioassays to the study of transformation products of levofloxacin. Water Sci. Technol. 2015, 72, 1578–1587. [Google Scholar] [CrossRef] [PubMed]
- Boxall, A.; Rudd, M.; Brooks, B.; Caldwell, D.; Choi, K.; Hickmann, S.; Innes, E.; Ostapyk, K.; Staveley, J.; Verslycke, T.; et al. Pharmaceuticals and Personal Care Products in the Environment: What are the Big Questions? Environ. Health Perspect. 2012, 120, 1221–1229. [Google Scholar] [CrossRef] [PubMed]
- Bussy, U.; Chung-Davidson, Y.-W.; Li, K.; Li, W. Phase I and phase II reductive metabolism simulation of nitro aromatic xenobiotics with electrochemistry coupled with high resolution mass spectrometry. Anal. Bioanal. Chem. 2014, 406, 7253–7260. [Google Scholar] [CrossRef] [PubMed]
- Johansson, T.; Weidolf, L.; Jurva, U. Mimicry of phase I drug metabolism–novel methods for metabolite characterization and synthesis. Rapid Commun. Mass Spectrom. 2007, 21, 2323–2331. [Google Scholar] [CrossRef] [PubMed]
- Jurva, U.; Wikström, H.V.; Weidolf, L.; Bruins, A.P. Comparison between electrochemistry/mass spectrometry and cytochrome P450 catalyzed oxidation reactions. Rapid Commun. Mass Spectrom. 2003, 17, 800–810. [Google Scholar] [CrossRef] [PubMed]
- Hoffmann, T.; Hofmann, D.; Klumpp, E.; Küppers, S. Electrochemistry-mass spectrometry for mechanistic studies and simulation of oxidation processes in the environment. Anal. Bioanal. Chem. 2011, 399, 1859–1868. [Google Scholar] [CrossRef] [PubMed]
- Bussy, U.; Boujtita, M. Advances in the electrochemical simulation of oxidation reactions mediated by cytochrome P450. Chem. Res. Toxicol. 2014, 27, 1652–1668. [Google Scholar] [CrossRef] [PubMed]
- Seiwert, B.; Golan-Rozen, N.; Weidauer, C.; Riemenschneider, C.; Chefetz, B.; Hadar, Y.; Reemtsma, T. Electrochemistry Combined with LC–HRMS: Elucidating Transformation Products of the Recalcitrant Pharmaceutical Compound Carbamazepine Generated by the White-Rot Fungus Pleurotus ostreatus. Environ. Sci. Technol. 2015, 49, 12342–12350. [Google Scholar] [CrossRef] [PubMed]
- Segura, P.A.; Takada, H.; Correa, J.A.; El Saadi, K.; Koike, T.; Onwona-Agyeman, S.; Ofosu-Anim, J.; Sabi, E.B.; Wasonga, O.V.; Mghalu, J.M.; et al. Global occurrence of anti-infectives in contaminated surface waters: Impact of income inequality between countries. Environ. Int. 2015, 80, 89–97. [Google Scholar] [CrossRef] [PubMed]
- Sirtori, C.; Agüera, A.; Gernjak, W.; Malato, S. Effect of water-matrix composition on Trimethoprim solar photodegradation kinetics and pathways. Water Res. 2010, 44, 2735–2744. [Google Scholar] [CrossRef] [PubMed]
- Kuang, J.; Huang, J.; Wang, B.; Cao, Q.; Deng, S.; Yu, G. Ozonation of trimethoprim in aqueous solution: Identification of reaction products and their toxicity. Water Res. 2013, 47, 2863–2872. [Google Scholar] [CrossRef] [PubMed]
- Hu, L.; Stemig, A.M.; Wammer, K.H.; Strathmann, T.J. Oxidation of antibiotics during water treatment with potassium permanganate: Reaction pathways and deactivation. Environ. Sci. Technol. 2011, 45, 3635–3642. [Google Scholar] [CrossRef] [PubMed]
- Ji, Y.; Xie, W.; Fan, Y.; Shi, Y.; Kong, D.; Lu, J. Degradation of trimethoprim by thermo-activated persulfate oxidation: Reaction kinetics and transformation mechanisms. Chem. Eng. J. 2016, 286, 16–24. [Google Scholar] [CrossRef]
- Michael, I.; Hapeshi, E.; Osorio, V.; Perez, S.; Petrovic, M.; Zapata, A.; Malato, S.; Barceló, D.; Fatta-Kassinos, D. Solar photocatalytic treatment of trimethoprim in four environmental matrices at a pilot scale: Transformation products and ecotoxicity evaluation. Sci. Total Environ. 2012, 430, 167–173. [Google Scholar] [CrossRef] [PubMed]
- Radjenović, J.; Godehardt, M.; Hein, A.; Farré, M.; Jekel, M.; Barceló, D. Evidencing generation of persistent ozonation products of antibiotics roxithromycin and trimethoprim. Environ. Sci. Technol. 2009, 43, 6808–6815. [Google Scholar] [CrossRef] [PubMed]
- Eichhorn, P.; Ferguson, P.L.; Pérez, S.; Aga, D.S. Application of ion trap-MS with H/D exchange and QqTOF-MS in the identification of microbial degradates of trimethoprim in nitrifying activated sludge. Anal. Chem. 2005, 77, 4176–4184. [Google Scholar] [CrossRef] [PubMed]
- Zhang, Z.; He, L.; Lu, L.; Liu, Y.; Dong, G.; Miao, J.; Luo, P. Characterization and quantification of the chemical compositions of Scutellariae Barbatae herba and differentiation from its substitute by combining UHPLC–PDA–QTOF–MS/MS with UHPLC–MS/MS. J. Pharm. Biomed. Anal. 2015, 109, 62–66. [Google Scholar] [CrossRef] [PubMed]
- Nouri-Nigjeh, E.; Permentier, H.P.; Bischoff, R.; Bruins, A.P. Lidocaine oxidation by electrogenerated reactive oxygen species in the light of oxidative drug metabolism. Anal. Chem. 2010, 82, 7625–7633. [Google Scholar] [CrossRef] [PubMed]
- Nouri-Nigjeh, E.; Permentier, H.P.; Bischoff, R.; Bruins, A.P. Electrochemical oxidation by square-wave potential pulses in the imitation of oxidative drug metabolism. Anal. Chem. 2011, 83, 5519–5525. [Google Scholar] [CrossRef] [PubMed]
- Oloman, C.; Watkinson, A. Hydrogen peroxide production in trickle-bed electrochemical reactors. J. Appl. Electrochem. 1979, 9, 117–123. [Google Scholar] [CrossRef]
- Dodd, M.C.; Buffle, M.-O.; Von Gunten, U. Oxidation of antibacterial molecules by aqueous ozone: Moiety-specific reaction kinetics and application to ozone-based wastewater treatment. Environ. Sci. Technol. 2006, 40, 1969–1977. [Google Scholar] [CrossRef] [PubMed]
- Antec. m-Prepcell User Manual (204.0010, 5th ed.); Antec: Zoeterwoude, The Netherlands, 2013; p. 45. [Google Scholar]
- Schymanski, E.L.; Jeon, J.; Gulde, R.; Fenner, K.; Ruff, M.; Singer, H.P.; Hollender, J. Identifying small molecules via high resolution mass spectrometry: Communicating confidence. Environ. Sci. Technol. 2014, 48, 2097–2098. [Google Scholar] [CrossRef] [PubMed]
- Eysseric, E.; Bellerose, X.; Lavoie, J.-M.; Segura, P.A. Post-column hydrogen-deuterium exchange technique to assist in the identification of small organic molecules by mass spectrometry. Can. J. Chem. 2016, 94, 781–787. [Google Scholar] [CrossRef]
- Wang, Y.; Gu, M. The concept of spectral accuracy for MS. Anal. Chem. 2010, 82, 7055–7062. [Google Scholar] [CrossRef] [PubMed]
- Meshi, T.; Sato, Y. Studies on sulfamethoxazole/trimethoprim. Absorption, distribution, excretion and metabolism of trimethoprim in rat. Chem. Pharm. Bull. 1972, 20, 2079–2090. [Google Scholar] [CrossRef] [PubMed]
- Liu, W.-T.; Li, K.-C. Application of reutilization technology to calcium fluoride sludge from semiconductor manufacturers. J. Air Waste Manag. Assoc. 2011, 61, 85–91. [Google Scholar] [CrossRef] [PubMed]
- Jewell, K.S.; Castronovo, S.; Wick, A.; Falås, P.; Joss, A.; Ternes, T.A. New insights into the transformation of trimethoprim during biological wastewater treatment. Water Res. 2016, 88, 550–557. [Google Scholar] [CrossRef] [PubMed]
- Baumann, A.; Lohmann, W.; Jahn, S.; Karst, U. On-Line Electrochemistry/Electrospray Ionization Mass Spectrometry (EC/ESI-MS) for the Generation and Identification of Nucleotide Oxidation Products. Electroanalysis 2010, 22, 286–292. [Google Scholar] [CrossRef]
- Marselli, B.; Garcia-Gomez, J.; Michaud, P.-A.; Rodrigo, M.; Comninellis, C. Electrogeneration of hydroxyl radicals on boron-doped diamond electrodes. J. Electrochem. Soc. 2003, 150, D79–D83. [Google Scholar] [CrossRef]
- Moreira, F.C.; Garcia-Segura, S.; Boaventura, R.A.; Brillas, E.; Vilar, V.J. Degradation of the antibiotic trimethoprim by electrochemical advanced oxidation processes using a carbon-PTFE air-diffusion cathode and a boron-doped diamond or platinum anode. Appl. Catal. B Environ. 2014, 160, 492–505. [Google Scholar] [CrossRef]
- Gattrell, M.; Kirk, D. A study of electrode passivation during aqueous phenol electrolysis. J. Electrochem. Soc. 1993, 140, 903–911. [Google Scholar] [CrossRef]
- Jahn, S.; Faber, H.; Zazzeroni, R.; Karst, U. Electrochemistry/mass spectrometry as a tool in the investigation of the potent skin sensitizer p-phenylenediamine and its reactivity toward nucleophiles. Rapid Commun. Mass Spectrom. 2012, 26, 1453–1464. [Google Scholar] [CrossRef] [PubMed]


| Observed Ions (m/z) | Name | Most Likely Molecular Formula a (Neutral) | ∆m (mDa) | Spectral Accuracy (%) | RDBE b | Product Ions c (m/z) |
|---|---|---|---|---|---|---|
| Electrolysis | ||||||
| 307.1411 | OP306 | C14H18N4O4 | 1 | 93.9 | 7.5 | 259.0825 (100), 243.0875 (58), 274.1055 (22), 289.1286 (11) |
| Electro-assisted Fenton reaction | ||||||
| 237.1026 | OP236 | C10H12N4O3 | 4 | 64.6 | 6.5 | N.A. |
| C13H16O4 | −10 | 64.8 | 5.5 | |||
| 291.1082 | OP290 | C13H14N4O4 | 0.5 | N.A. | 8.5 | 258.0736 (100), 273.0984 (66), 240.0645 (44), 241.0703 (40), 291.1084 (31) |
| 307.1398 | OP306 | C14H18N4O4 | −0.2 | 69.8 | 7.5 | 259.0822 (100), 243.0878 (60), 274.1054 (30), 231.0869 (14), 244.0927 (14) |
| 323.1345 | OP322a | C14H18N4O5 | −0.5 | 89.2 | 7.5 | 249.0983 (100), 231.0887 (88), 259.0827 (86), 216.0624 (73), 323.1345 (59) |
| 323.1346 | OP322b | C14H18N4O5 | −0.4 | 84.6 | 7.5 | 249.0979 (100), 231.0875 (90), 259.0826 (78), 216.0637 (45), 323.1349 (41) |
| 325.1504 | OP324 | C14H20N4O5 | −0.2 | 87.3 | 6.5 | 181.0680 (100), 325.1497 (55) |
| Thin later flow cell coupled online to high-resolution mass spectrometry (HRMS) d | ||||||
| 307.1421 | OP306 | C14H18N4O4 | 2 | 50.3 | 7.5 | N.A. |
| 323.1372 | OP322 | C14H18N4O5 | 2 | 92.9 | 7.5 | 323.1372 (100), 259.0998 (22), 291.1109 (20), 231.0893 (13) |
| 339.1325 | OP338 | C14H18N4O6 | 3 | N.A. | 7.5 | N.A. |
| 357.1431 | OP356 | C14H20N4O7 | 3 | N.A. | 6.5 | N.A. |
| 398.1700 | OP397 | C10H23N9O8 * | −4 | 94.1 | 3.5 | N.A. |
| C11H23N7O9 * | 7 | 94.1 | 3.5 | |||
| C16H23N5O7 * | 3 | 92.0 | 7.5 | |||
| Observed Product Ions m/z | Relative Abundance % | Isomer | ||||
|---|---|---|---|---|---|---|
| A | B | C | D | E | ||
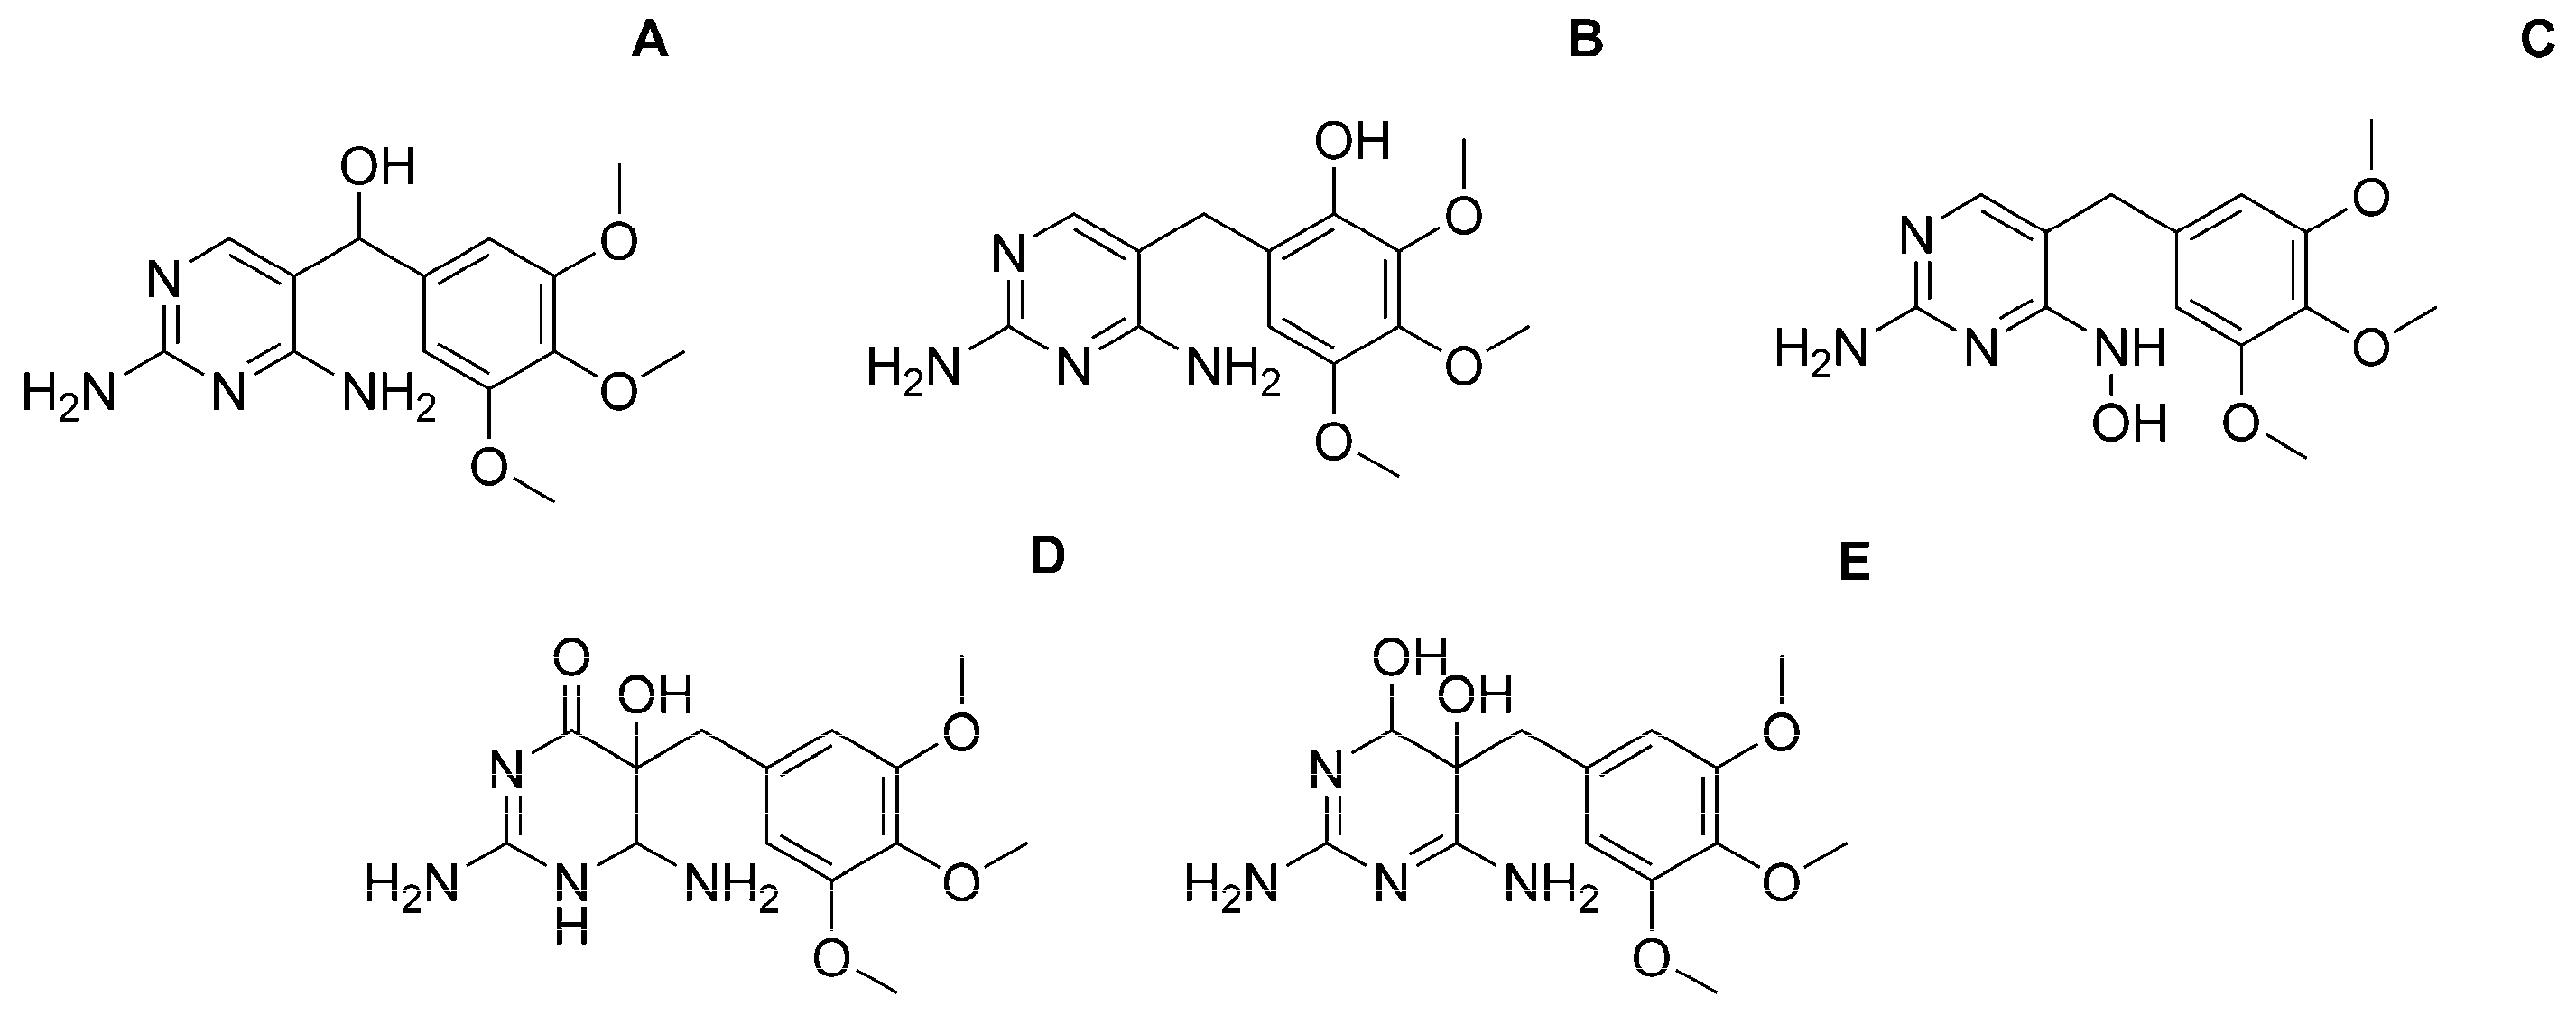
 |  |  |  |  | ||
| 212.0700 | 10.5 | −0.7 | ||||
| 216.0519 | 14.3 | |||||
| 230.0790 | 18.3 | 0.8 | ||||
| 234.0660 | 9.4 | −2.5 | ||||
| 240.0645 | 43.9 | |||||
| 241.0703 | 40.4 | 1.7 | 1.7 | |||
| 249.0866 | 25.4 | 11.6 | 0.4 | 0.4 | 11.6 | 0.4 |
| 258.0736 | 100 | 13.7 | 1.1 | 1.1 | 1.1 | 1.1 |
| 261.0613 | 8.0 | 0.5 | ||||
| 261.0968 | 6.5 | 1.4 | 1.4 | 1.4 | 1.4 | 1.4 |
| 273.0984 | 66.4 | −0.2 | −0.2 | −0.2 | −0.2 | −0.2 |
| 276.0849 | 15.0 | 13.0 | 13.0 | 13.0 | 13.0 | 0.4 |
| Technique | Conditions | TRI Oxidation Products Generated | Identification Level [29] | Previous Reports of the Oxidation Product |
|---|---|---|---|---|
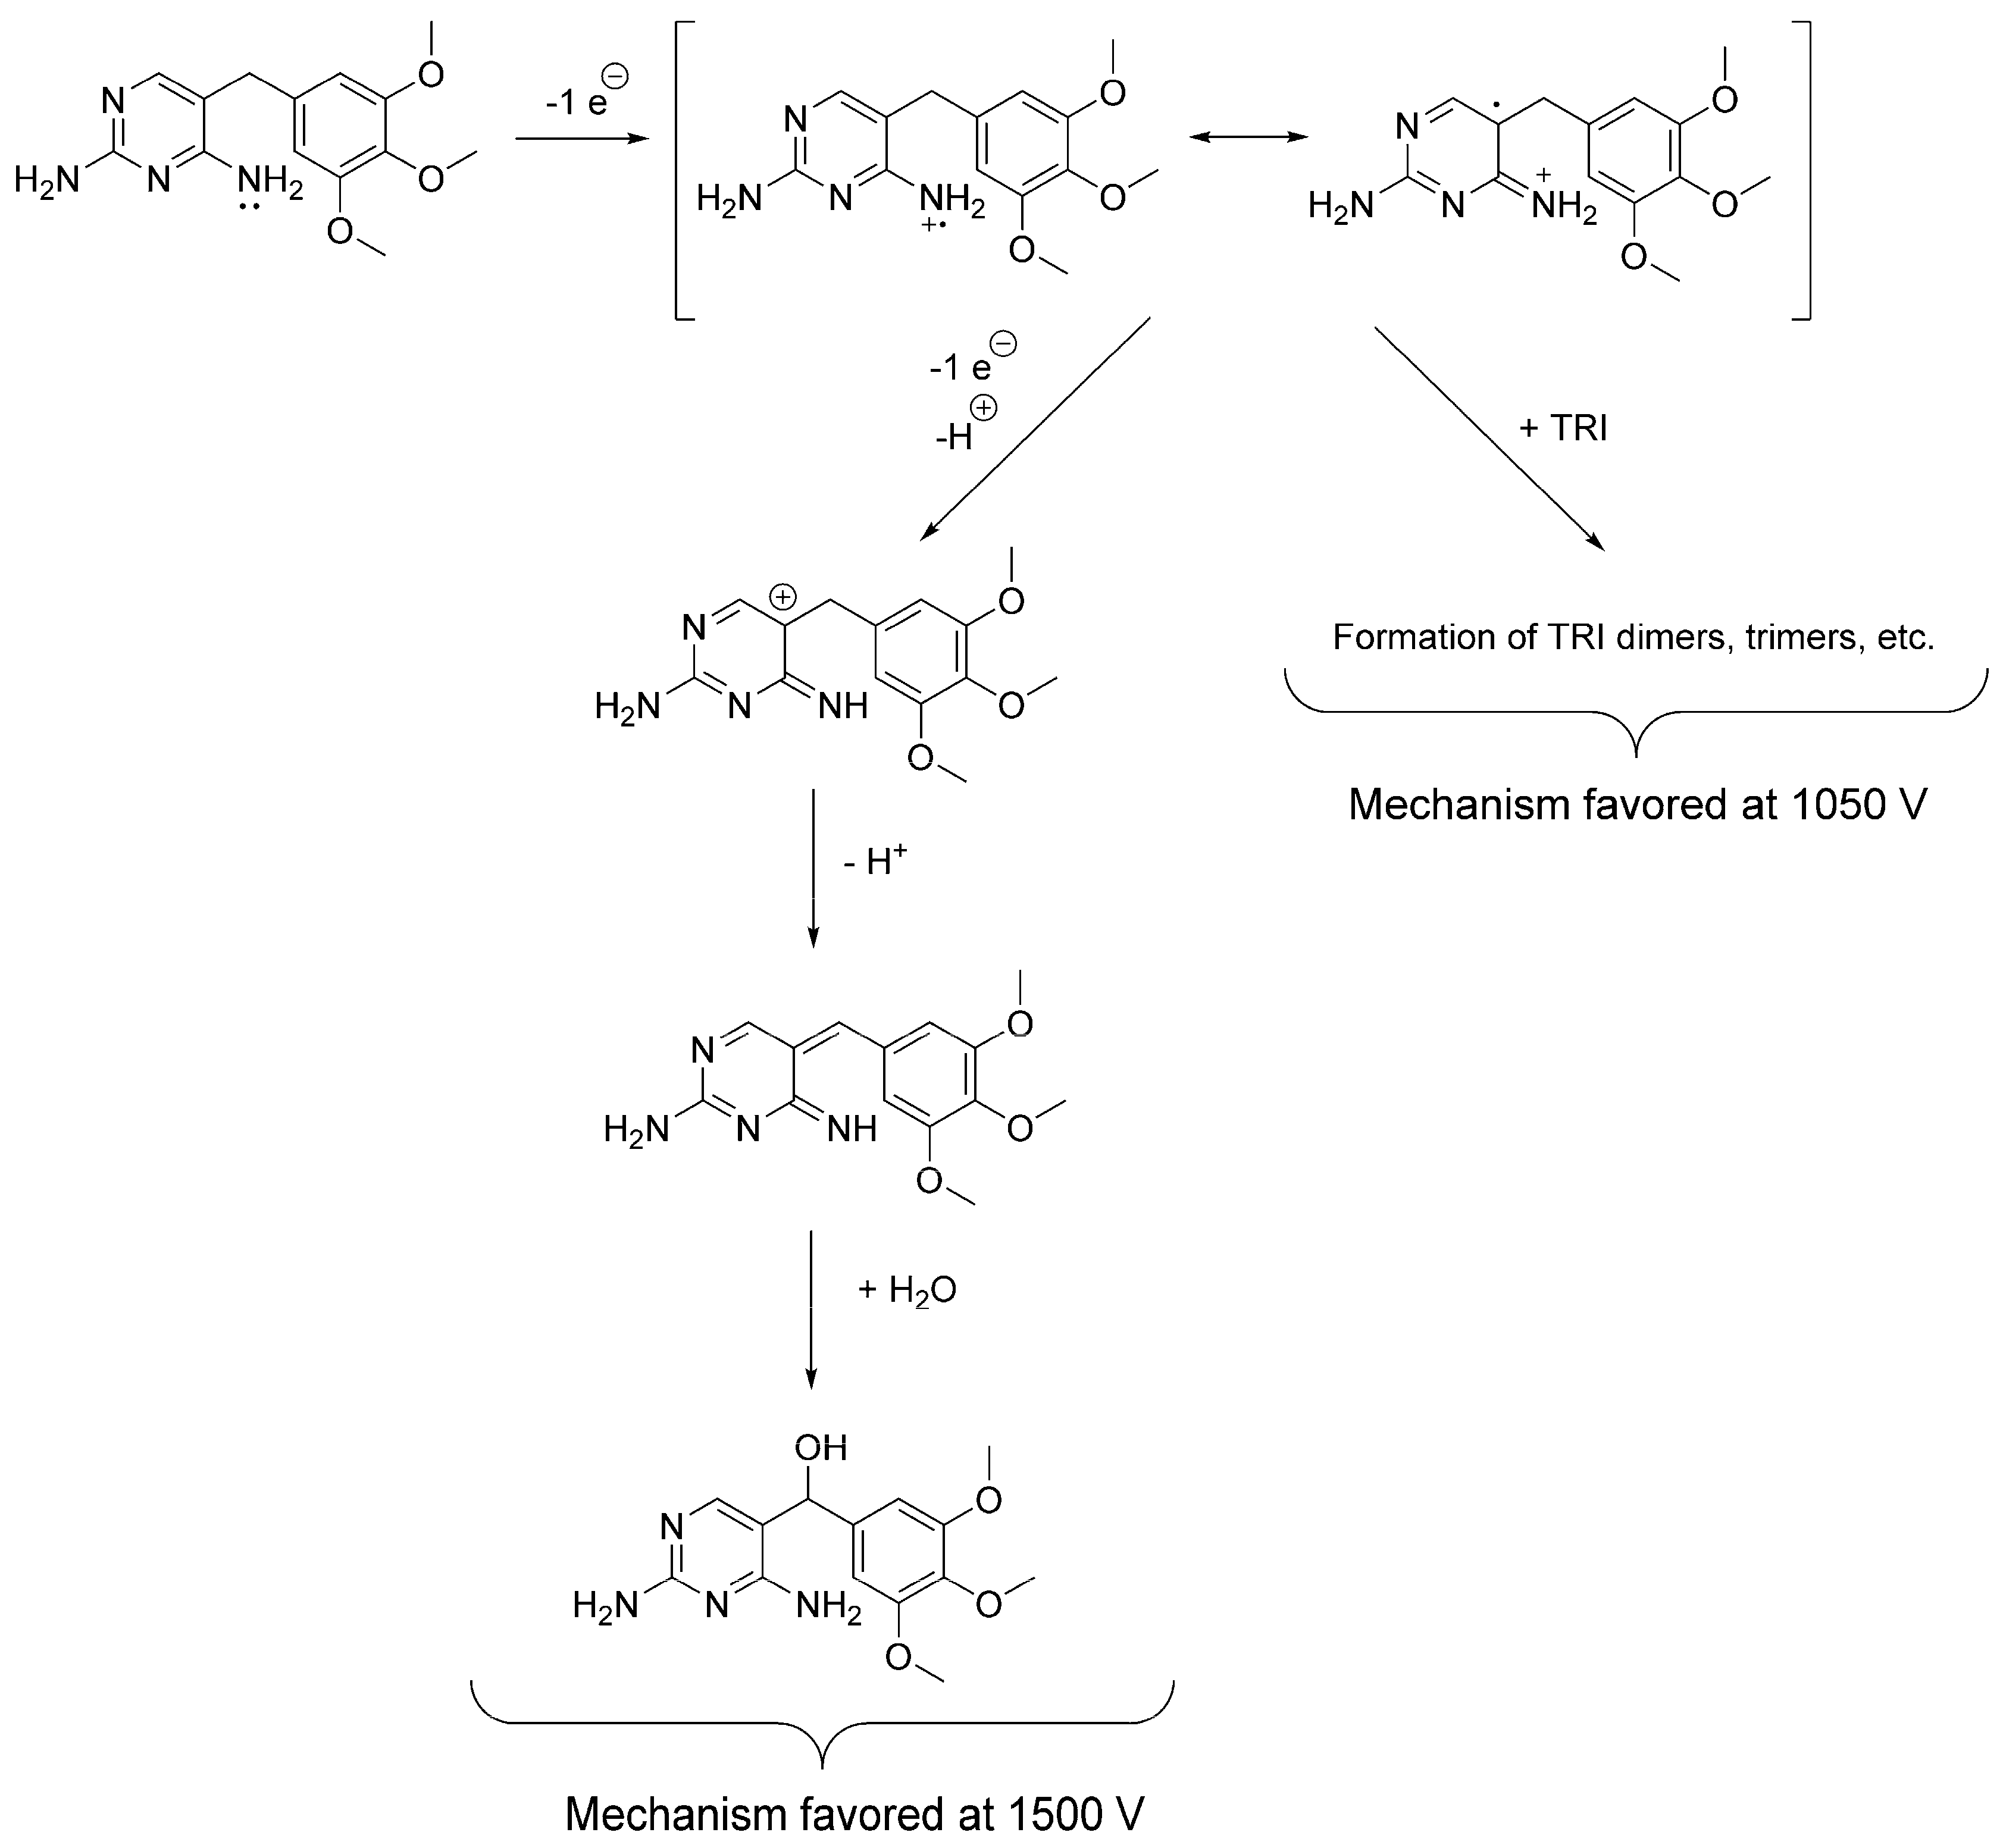
| Electrolysis | Solution: ACN:H2O 99: 1 (v/v) with 100 mM TBAP. WE: Glassy carbon maintained under a N2(g) atmosphere. Potential applied: 1500 mV (vs. Ag/Ag+). | OP306 (α-OH-TRI) | Probable structure (level 2b): based on spectral and mass accuracy, H/D exchange, experimental and literature MS/MS spectra. | Rat metabolism [32]. Nitrifying bacteria in activated sludge [22], direct photolysis and solar TiO2 photocatalysis [16], Oxidation by KMnO4 [18], thermo-activated persulfate oxidation [19]. |
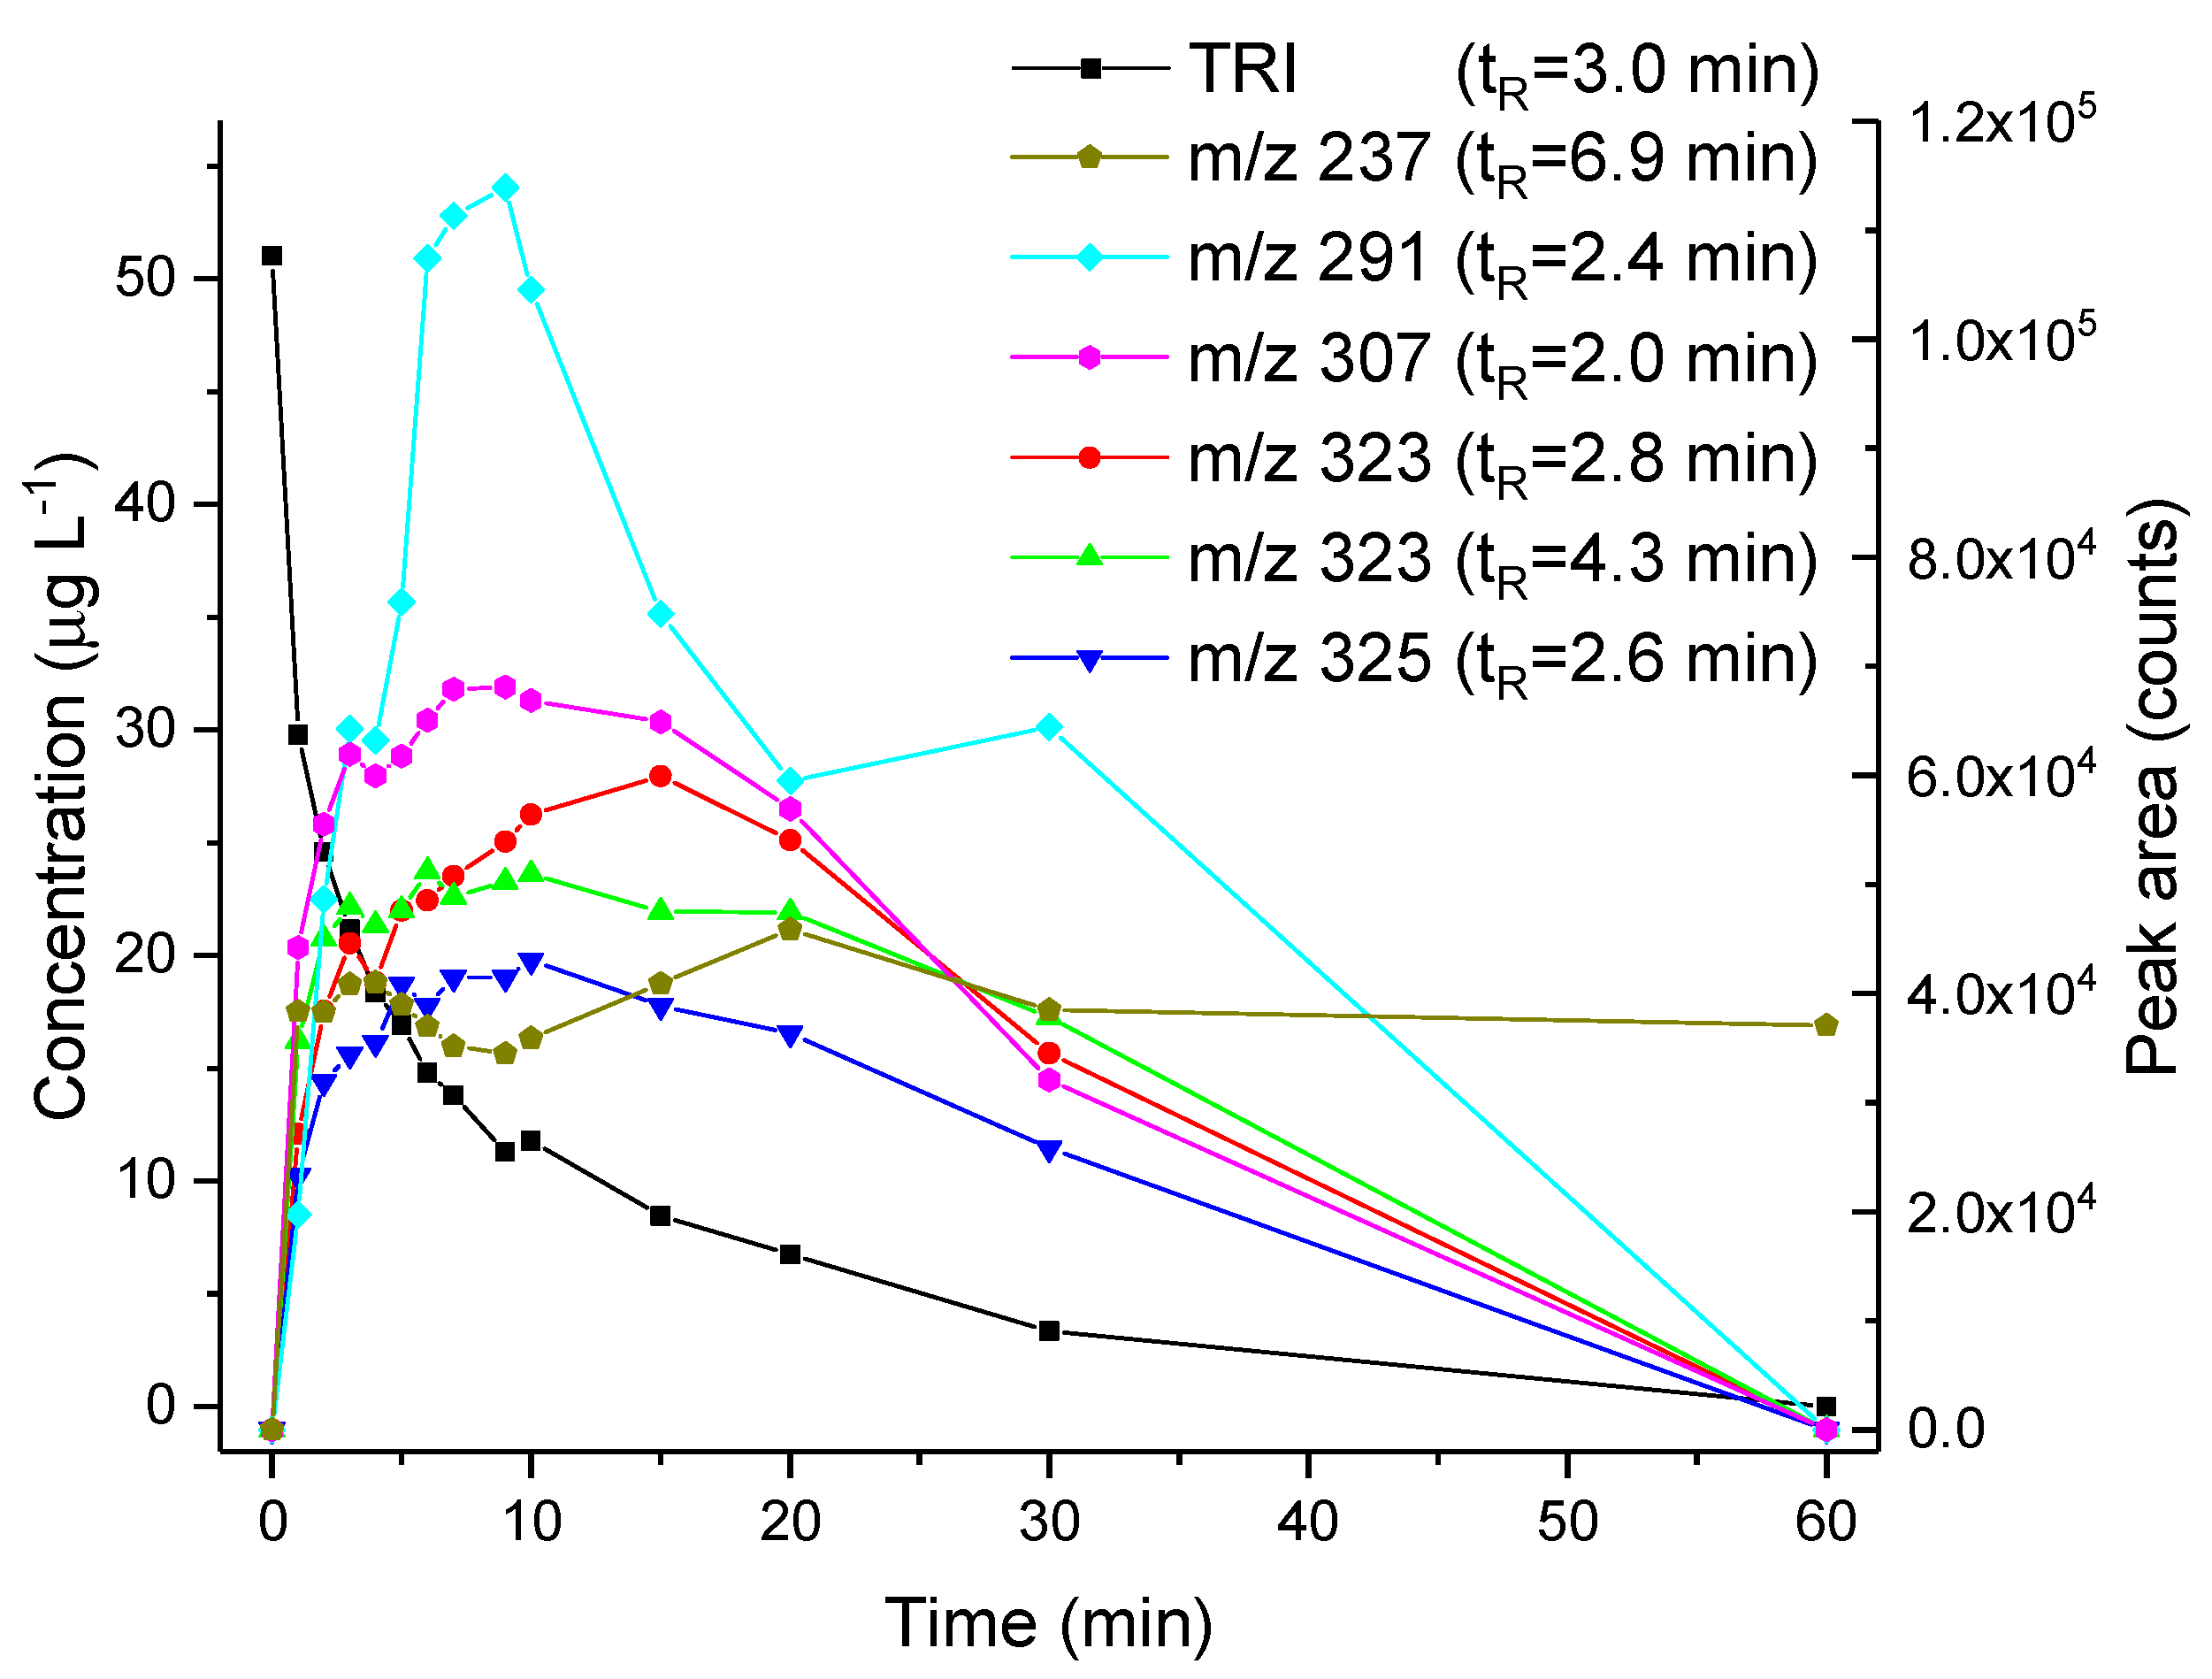
| Electro-assisted Fenton reaction | Solution: 50 mM Na2SO4, 0.1 mM FeSO4 in acidified H2O with H2SO4 at pH 2. WE: Glassy carbon. Current density: 1 mA cm−2. | OP236 (m/z 237.1026) | Accurate mass (level 5): mass and spectral accuracy could not assign unequivocally a formula to the observed m/z. | Not reported previously. |
| OP290 [2,4-diaminopyrimidin-5-yl)-(4-hydroxy-3,5-dimethoxyphenyl)methanone] | Probable structure (level 2b): based on spectral and mass accuracy, and comparative in-silico MS/MS fragmentation analysis. | Nitrifying bacteria in activated sludge [34]. | ||
| OP306 (α-OH-TRI) | Probable structure (level 2b): based on spectral and mass accuracy, experimental and literature MS/MS spectra. | Same as indicated for the three-compartment cell with stationary electrodes. | ||
| OP322 (2OH-TRI) isomers | Tentative structures (level 3): based on spectral and mass accuracy, experimental and literature MS/MS spectra. | Direct photolysis and solar TiO2 photocatalysis [16], thermo-activated persulfate oxidation [19]. | ||
| OP324 (C14H20N4O5) | Tentative structures (level 3): based on spectral and mass accuracy. Experimental and literature MS/MS spectra could not assign unambiguously one structure. | Nitrifying bacteria in activated sludge [22]. | ||
| Thin-layer flow cell coupled online to HRMS | Solution: 0.1% FA in H2O:ACN 1:1 WE: Boron-doped diamond. Potential applied: 1000 to 1500 vs. Pd/H2. | OP306 (m/z 323.1372) | Accurate mass (level 5): mass and spectral accuracy could not assign unequivocally a formula to the observed m/z. | Same as indicated for the three-compartment cell with stationary electrodes. |
| OP322 (2OH-TRI) | Tentative structures (level 3): based on spectral and mass accuracy, experimental and literature MS/MS spectra. | Same as indicated for the three-compartment cell with stationary electrodes. | ||
| OP338 (m/z 339.1325) | Exact mass (level 5): mass and spectral accuracy could not assign unequivocally a formula to the observed m/z. | Photoelectro-Fenton with Pt anode [37]. |
© 2018 by the authors. Licensee MDPI, Basel, Switzerland. This article is an open access article distributed under the terms and conditions of the Creative Commons Attribution (CC BY) license (http://creativecommons.org/licenses/by/4.0/).
Share and Cite
Lecours, M.-A.; Eysseric, E.; Yargeau, V.; Lessard, J.; Brisard, G.M.; Segura, P.A. Electrochemistry-High Resolution Mass Spectrometry to Study Oxidation Products of Trimethoprim. Environments 2018, 5, 18. https://doi.org/10.3390/environments5010018
Lecours M-A, Eysseric E, Yargeau V, Lessard J, Brisard GM, Segura PA. Electrochemistry-High Resolution Mass Spectrometry to Study Oxidation Products of Trimethoprim. Environments. 2018; 5(1):18. https://doi.org/10.3390/environments5010018
Chicago/Turabian StyleLecours, Marc-André, Emmanuel Eysseric, Viviane Yargeau, Jean Lessard, Gessie M. Brisard, and Pedro A. Segura. 2018. "Electrochemistry-High Resolution Mass Spectrometry to Study Oxidation Products of Trimethoprim" Environments 5, no. 1: 18. https://doi.org/10.3390/environments5010018