An Exploratory Analysis of the Impact of Climate Change on Macedonian Agriculture †


Centre for Environmental and Climate Research (CEC), Lund University, Sölvegatan 37, 22362 Lund, Sweden
†
This paper is an extended version of our paper published in the International Conference of Agricultural Economists on The University of Milan, Milan, Italy, 8–14 August 2015.
Environments 2018, 5(1), 3; https://doi.org/10.3390/environments5010003
Submission received: 22 November 2017
/
Revised: 19 December 2017
/
Accepted: 21 December 2017
/
Published: 25 December 2017
(This article belongs to the Special Issue Agriculture and Climate Change)
Abstract
:Using a mixed input–output model, this study examines potential changes in sector output and water requirements in Macedonia arising from climate change. By defining three climate change scenarios and exogenously specifying the warming shocks for five key agricultural sub-sectors, the effects on the economy were quantified. The results indicated that except for cereals and grapes, agricultural production would benefit from the low climate change scenario due to moderate changes in precipitation and temperature and longer cropping period, while there would be negligible effects on the rest of the economy. Contrary, the medium and high climate change scenarios would negatively affect agriculture due to increase in temperature and decline in precipitation, with severe losses in grape, apple and cereal production, but again with low effects on other economic sectors. As a result, water consumption by agriculture sector will increase by around 6% in the low climate change scenario, and decrease by around 8% and 16% in the medium and high climate change scenarios, respectively, relative to the current agriculture water consumption. Capital investment in irrigation equipment could mitigate the negative climate change impacts in the medium and high climate change scenarios. However, it would impose additional stresses on the existing limited water resource over time.
1. Introduction
Climate change has become an important issue that has potential impacts on national economies, particularly in countries where agriculture is a key sector [1], mainly through impacts on water resource availability, as water is a key input for crop and livestock production. Climate change will most likely influence not just the direct water demand by agriculture, but also indirect demand by the other sectors in the economy, leading to competition for this natural resource.
In the former Yugoslav Republic of Macedonia—FYROM (Macedonia’s constitutional name is the Republic of Macedonia). Within the United Nations system, it is being provisionally referred to as “the former Yugoslav Republic of Macedonia—FYROM” (UNSC Resolution 817/1993) (hereafter “Macedonia”), agriculture plays an important role in the national economy. In the period 2005–2011, its contribution to national Gross Domestic Product (GDP) was about 11% on average, while it employed a significant proportion (20%) of the total available labor force [2]. The agricultural sector is expected to be vulnerable to climate change events mainly as a result of a shorter growing period, accompanied by increased temperature and decreased rainfall [3]. Thus, reductions in yields and consequently in farm income, are likely to occur. In Macedonia, the rural population represents around 43% of the total population (Total population in Macedonia in 2011 is estimated to be around 2.05 million [4]). Semi-subsistence farming is dominant where around 58% of the rural population earns less than 2000 euros annually [5]. Future warming effects of climate change, will most likely amplify their vulnerability.
Due to the interlinkages between the agriculture sector and the rest of the economy, climate change impacts may lead to indirect variations in the outputs of other sectors. However, the knowledge of such interactions and variations is limited. Usual practice in studying climate change is explaining and understanding the physical damages, but valuing these damages in monetary terms is less easy to understand [6]. Therefore, one of the aims of this paper is to investigate the implications of climate change for Macedonia’s agriculture sector in terms of output variation and the rest of its economy.
The impacts of climate change on agricultural production and the other sectors are closely associated with water demand and availability. Therefore, the second aim of this paper is to quantify the resulting water requirements, given the climate change impacts. Although the current national water resources in Macedonia are sufficient to meet existing water consumption (around 6.4 billion m3; [7]), there are issues with availability and demand due the uneven spatial and temporal distribution of water resources throughout the country, with a more favorable supply in western Macedonia. Such water scarcity can be mitigated by irrigation to ensure the necessary crop water demand. However, neglect or poor maintenance by the water management authorities has caused deterioration in the functioning of already old irrigation schemes (built in the 60s and 70s) [8]. In addition, many farmers have adopted the practice of punching holes in the authority’s concrete channels and irrigate without paying [9]. This has also resulted in high water losses in water supply systems (up to 40%) accompanied by soil erosion and water quality issues [4]. Therefore, to mitigate the change in output production in the long run and ensure a sufficient supply of water as input, capital investment in the development, reconstruction and maintenance of irrigation infrastructure would appear to be essential. Thus, the third aim of the paper is to investigate how the mitigating measure of investment in irrigation infrastructure will directly and indirectly affect output production. This is important because “the changing demand for agricultural products and the increasing understanding of the impacts of climate change on agriculture and the water cycle will also influence future investment in irrigation and water control” [10].
Implications at macro-economic national level related to changes in economic activity are usually measured by gross domestic product, consumer expenditures (consumption), investment and government spending, etc. The input–output (IO) model framework is the most suitable for this purpose [11]. Therefore the method chosen for the analysis was an environmentally extended version of an IO model developed by [12], combined with a mixed model approach and water accounts. The advantage of this modelling approach is that it allows the so-called “backward linkage” effect to be investigated from a supply side perspective, whereby a reduction in agricultural output due to climate change impacts will reduce the demand for farm inputs. This in turn will trigger a whole series of indirect effects for other economic sectors, which will have to adjust their output to the new lower level of activity [11]. The impact of capital investment in irrigation was analyzed using a general IO technique in an open economy (Open economy indicates that the final demand and value added are exogenous sectors and are not considered in the intersectoral relationships [11]. This means that the intermediate product is sold to final demand sectors, but the economic sectors are also able to buy inputs such as labor, capital, etc. to produce the commodities) framework. To provide deeper understandings of the analyzed issues, the agricultural sector was disaggregated into several sub-sectors. Therefore, understanding the impacts of climate change variability and measuring the resulting outcomes for agriculture at disaggregated level and other sectors of the Macedonian economy could provide insights to policy makers tasked with developing and designing future adaptation measures for the country’s agriculture sector to mitigate the impacts of climatic change.
The paper is structured by providing insights of the methodological framework and the disaggregation procedure in Section 2, as well as data used and the climate change scenarios applied in the analysis. After the results are presented in Section 3, the paper ends in Section 4 with a discussion and concluding remarks.
2. Conceptual Framework
2.1. Modeling Procedure
Two approaches were used in the analyses: a supply-driven approach, where climate change shocks on agricultural output were investigated, and a demand-driven approach, where changes in output as a result of capital investment in irrigation were investigated.
An IO model is defined as a linear model of all intersectoral relationships of an economy in static production technical relations. The original model developed by [13] takes the following form:
where X is a column vector of total output production; A denotes a matrix of direct technical coefficients of production (aij = zij/xj, with z indicating the transactions between sectors); and F represents a column vector of the final demand for goods by each sector. Household and government consumption, as well as capital investment and exports, are included in this column vector.
The supply-driven changes due to climate change shocks on agricultural output were investigated using a mixed model approach. As argued above, the application of a mixed model framework is useful when the aim is to model exogenous changes in output and the associated relative changes in the output of other sectors. The authors of [14] reviewed some previous empirical studies applying a mixed IO model. In most of these the main focus was on agriculture [15,16], for which the output was considered to be an exogenous component.
Using Equation (1), a mixed IO model with three sectors, where output of one sector is treated as being fixed, i.e., an exogenous component (in this case x1), takes the following form:
Rewriting and re-ordering the right-hand side gives:
From Equation (3), it can be seen that the items x1, f2 and f3 serve as exogenous drivers for the three respective sectors. However, since only output x1 is fixed, to be able to investigate the exogenous effect of change in x1 on other outputs (x2 and x3), f2 and f3 are set to zero. In matrix notation, this becomes:
Thus, solving the mixed IO model as a function of the exogenously specified column vector in Equation (4) permits investigation of the impact of the supply-driven shock upon the agriculture sector due to climate change-related variations in temperature and precipitation:
The demand-driven approach is modeled by rearranging Equation (1), i.e., by moving all x terms to the left-hand side. In matrix notation this becomes:
Using Equation (6), by matrix algebra it is possible to calculate the demand-driven output changes induced by direct capital investment in irrigation schemes. Identifying ΔFI as the column vector of increment in irrigation capital investment, the demand-driven change in gross output is defined as:
where ΔX reflects the direct and indirect change in total output due to changes in demand for products of each sector through intermediate inputs, but also due to changes in demand arising from household consumption and exports.
2.2. Disaggregation Procedure
In most published national IO tables, agriculture is considered as a single economic sector that includes the products of hunting and other related agricultural services. However, a significant novel aspect of the present study was disaggregation of agriculture into several sub-sectors important for the Macedonian economy, through the development of an appropriate IO table.
The importance of disaggregating agriculture was highlighted in an United Nations report [7], which showed that Macedonian agriculture is a key water-consuming sector, with direct intensive water consumption of around 38% of total national demand, imposing significant pressure on national freshwater resources. A comprehensive understanding of the agricultural consumption patterns at the sectoral level is important but also will provide greater transparency of vulnerability regarding climate change. The national water endowment is directly related to rainfall. Because the proportion of irrigated land in Macedonia is currently very small but also declining, a negative impact of future climate change on crop output can be expected in almost all agricultural sectors and regions due to the decrease in annual rainfall, with longer dry periods followed by droughts. This will result in a greater water deficit on national level.
Another reason why disaggregation is important is because there are major discrepancies in the recent data on irrigated area in Macedonia. From Table 1 it may be noticed that two different reports state very different values, e.g., according to the 2008 Annual Agricultural Report [4], the area of irrigated land in Macedonia over the period 2004–2008 remained stable at around 21,000 ha on average. In contrast, the Agricultural Census [17] reported a more than three-fold greater area of irrigated land (Table 1). This discrepancy can jeopardize the reliability of research results. Therefore we decided to use both sources. It is important to obtain a detailed picture of agriculture sector interactions and of climate change variations at disaggregated level if further insights are to be conveyed to policy makers responsible for sustainable water management and climate change adaptation measures.
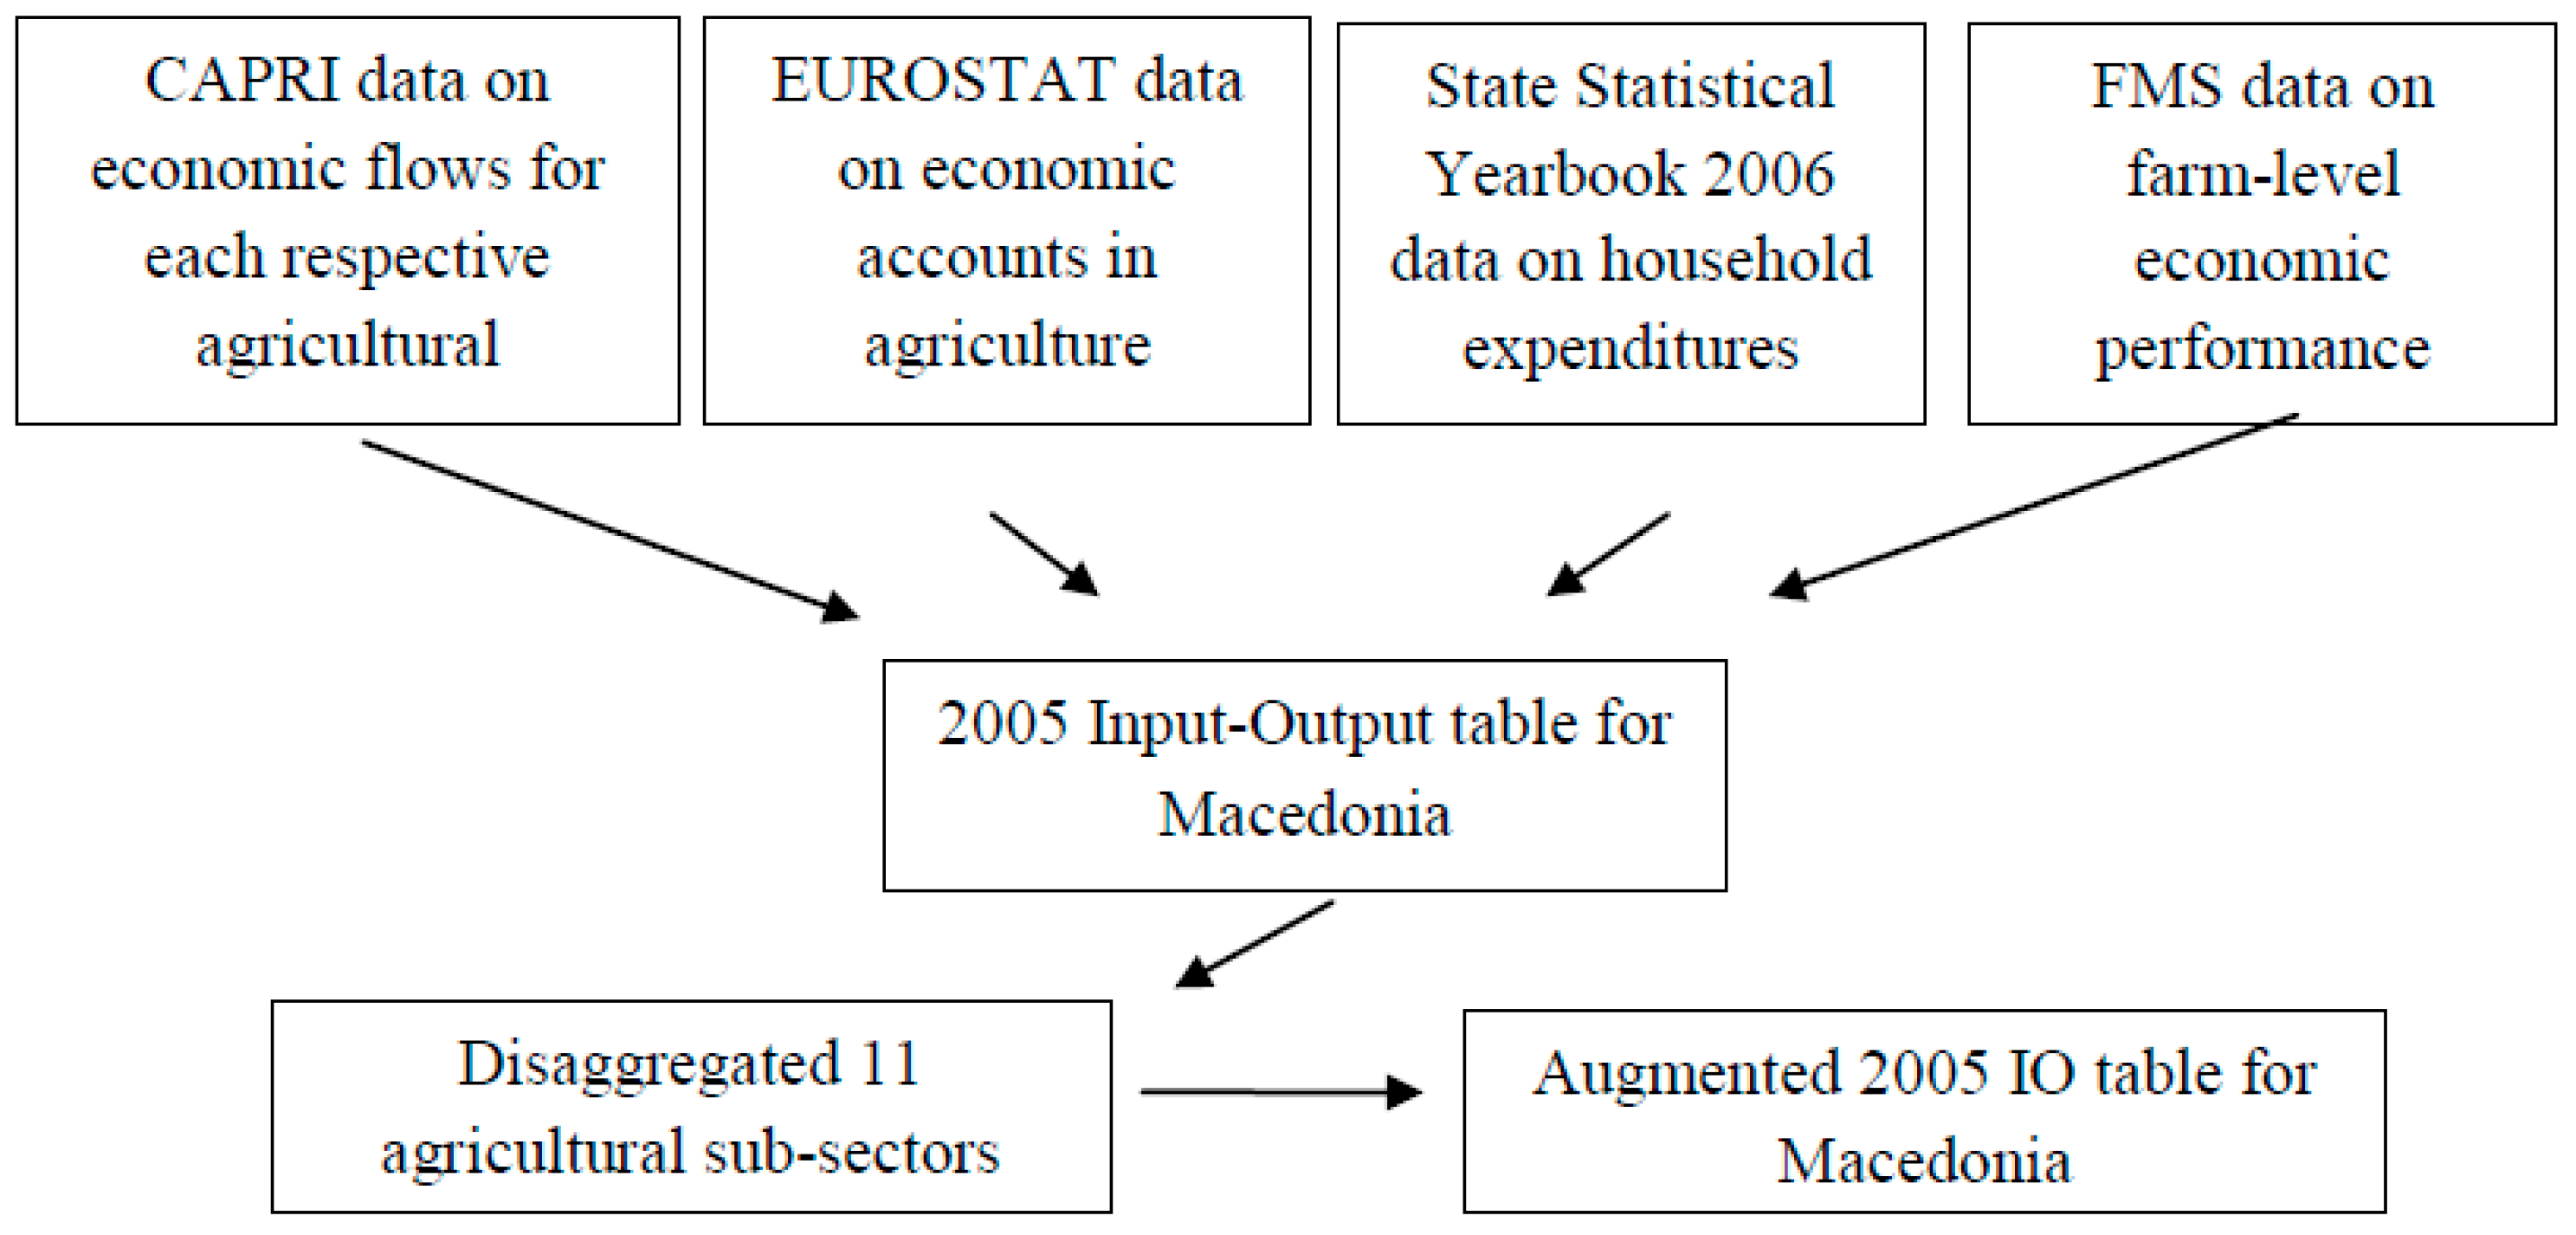
The agricultural sector was disaggregated into 11 sub-sectors using the [18] disaggregation procedure. Besides the 2005 IO table for Macedonia [19], data on the economic flows to each agricultural production enterprise obtained from the Common Agricultural Policy Regionalized Impact model (CAPRI) (More information about CAPRI may be found at: http://www.capri-model.org/dokuwiki/doku.php?id=start); the EUROSTAT data on economic accounts for agriculture; the Farm Monitoring Survey (FMS) (The Farm Monitoring System (FMS) is an annual survey carried out by the Macedonian National Extension Agency, gathering farm return data from around 300 farms, in line with the Farm Accountancy Date Network (FADN) principles) on farm performance; and papers and reports published by the State Statistical Office (SSO) in Macedonia were used in the disaggregation procedure (Figure 1).
Sub-sectoral outputs were calculated based on the EUROSTAT agricultural economic accounts. Micro-level farm data are scarce and of insufficient quality, but the FMS farm data on income, crop- and livestock-specific costs and gross margins [20,21] and the CAPRI data on trade and operating costs helped us calculate the flows between the agriculture sector and other sectors in the Macedonia’s IO table. The total demand for products by households was determined using the [22] data on expenditure by agricultural, mixed and non-agricultural households on the most important products originating from the sub-sectors.
Information on the area of irrigated land was combined with indicators for crop water requirements (CWR) per hectare (ha) calculated specifically for Macedonia by [23] and with [24] crop level estimates in order to construct the water accounts at disaggregated agriculture sub-sector level. CWR is defined as the “amount of water required to compensate for the evapo-transpiration loss from the cropped field” [25]. CWR explicitly includes both blue and green water (Blue water refers to surface water available from lakes, rivers, reservoirs, etc., while green water is the amount of water which returns to the atmosphere through evapotranspiration from surface water sources or soils [26]) and from the definition it may be noted that blue water is used to compensate for loss of green water in crops. However, in order to determine the blue CWR and relate it to water consumption, the effective precipitation is subtracted from the total CWR. Data on the proportion of irrigated crops within the main categories listed in the 2010 Annual Agricultural Report [4] were also important for the water accounts at disaggregated level. Regarding the livestock sectors, data on the water requirements per day for each group as reported in [27] were used.
2.3. Climate Change Scenarios
Climate change impacts on crop production and water availability in Macedonia have been investigated in several previous studies [6,28,29,30,31]. Although projections vary, the evidence from all these studies suggests that the stress imposed by climate change will have a negative impact on the yields of most crops in Macedonia.
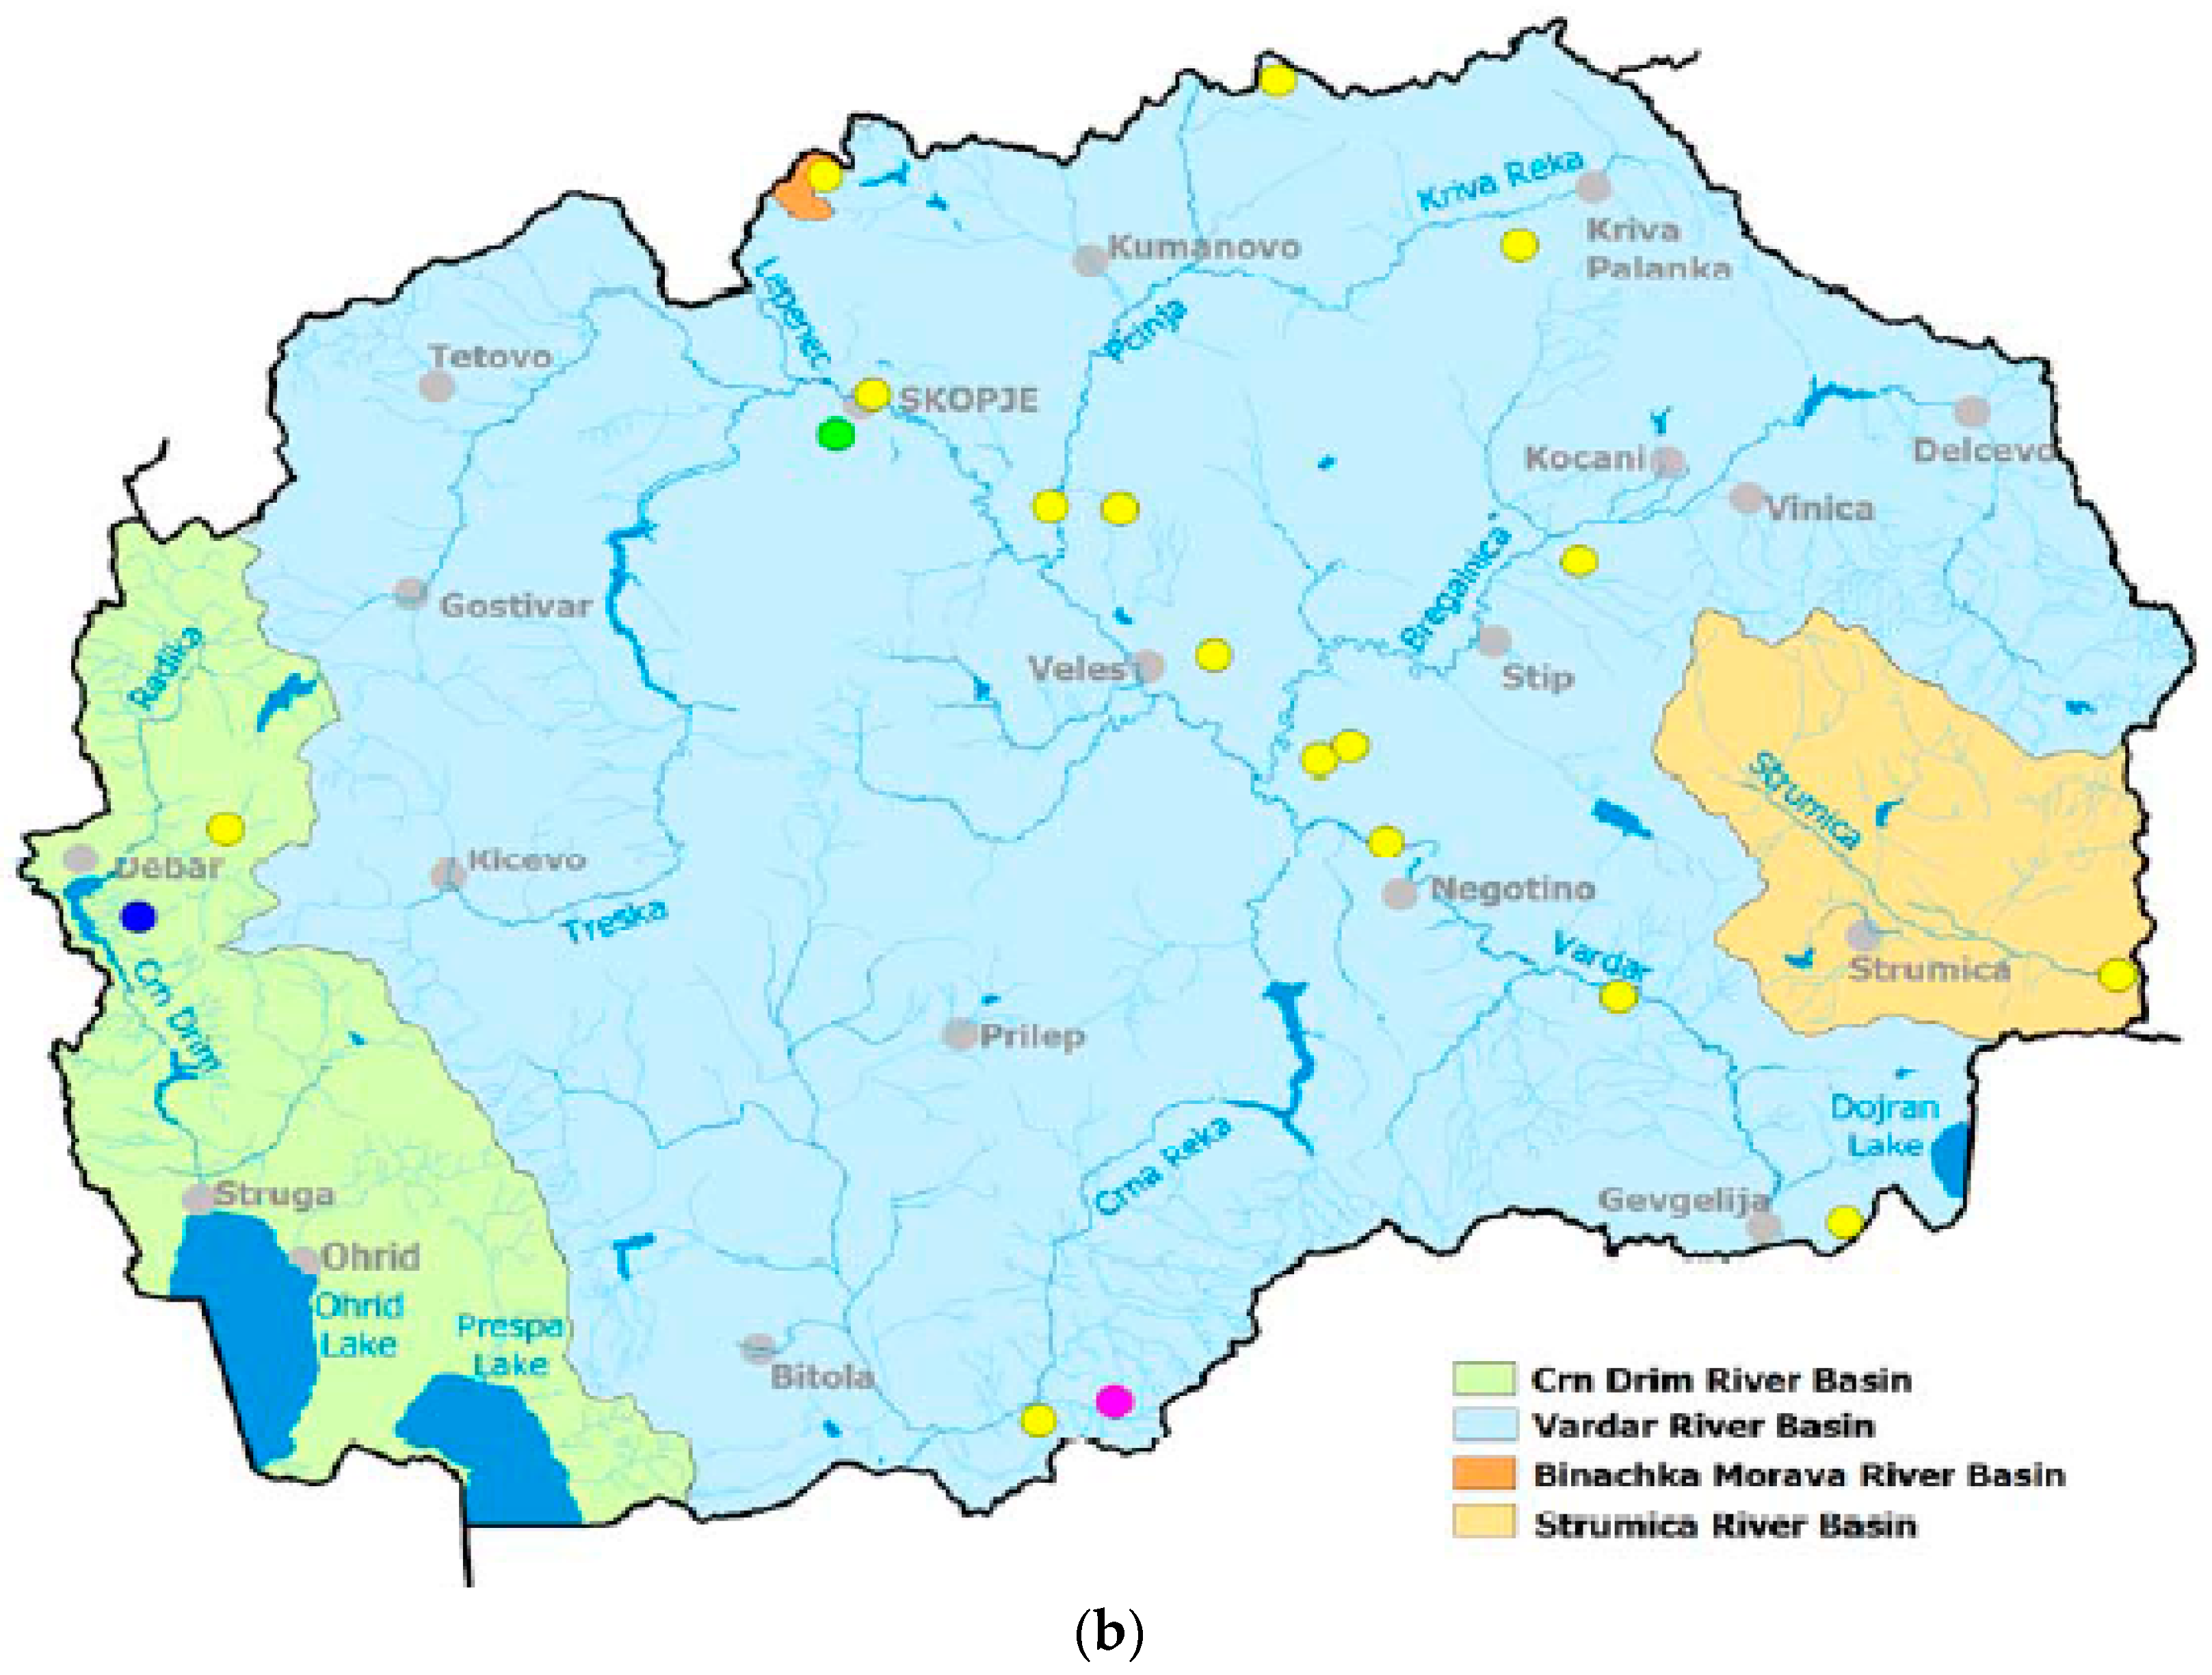
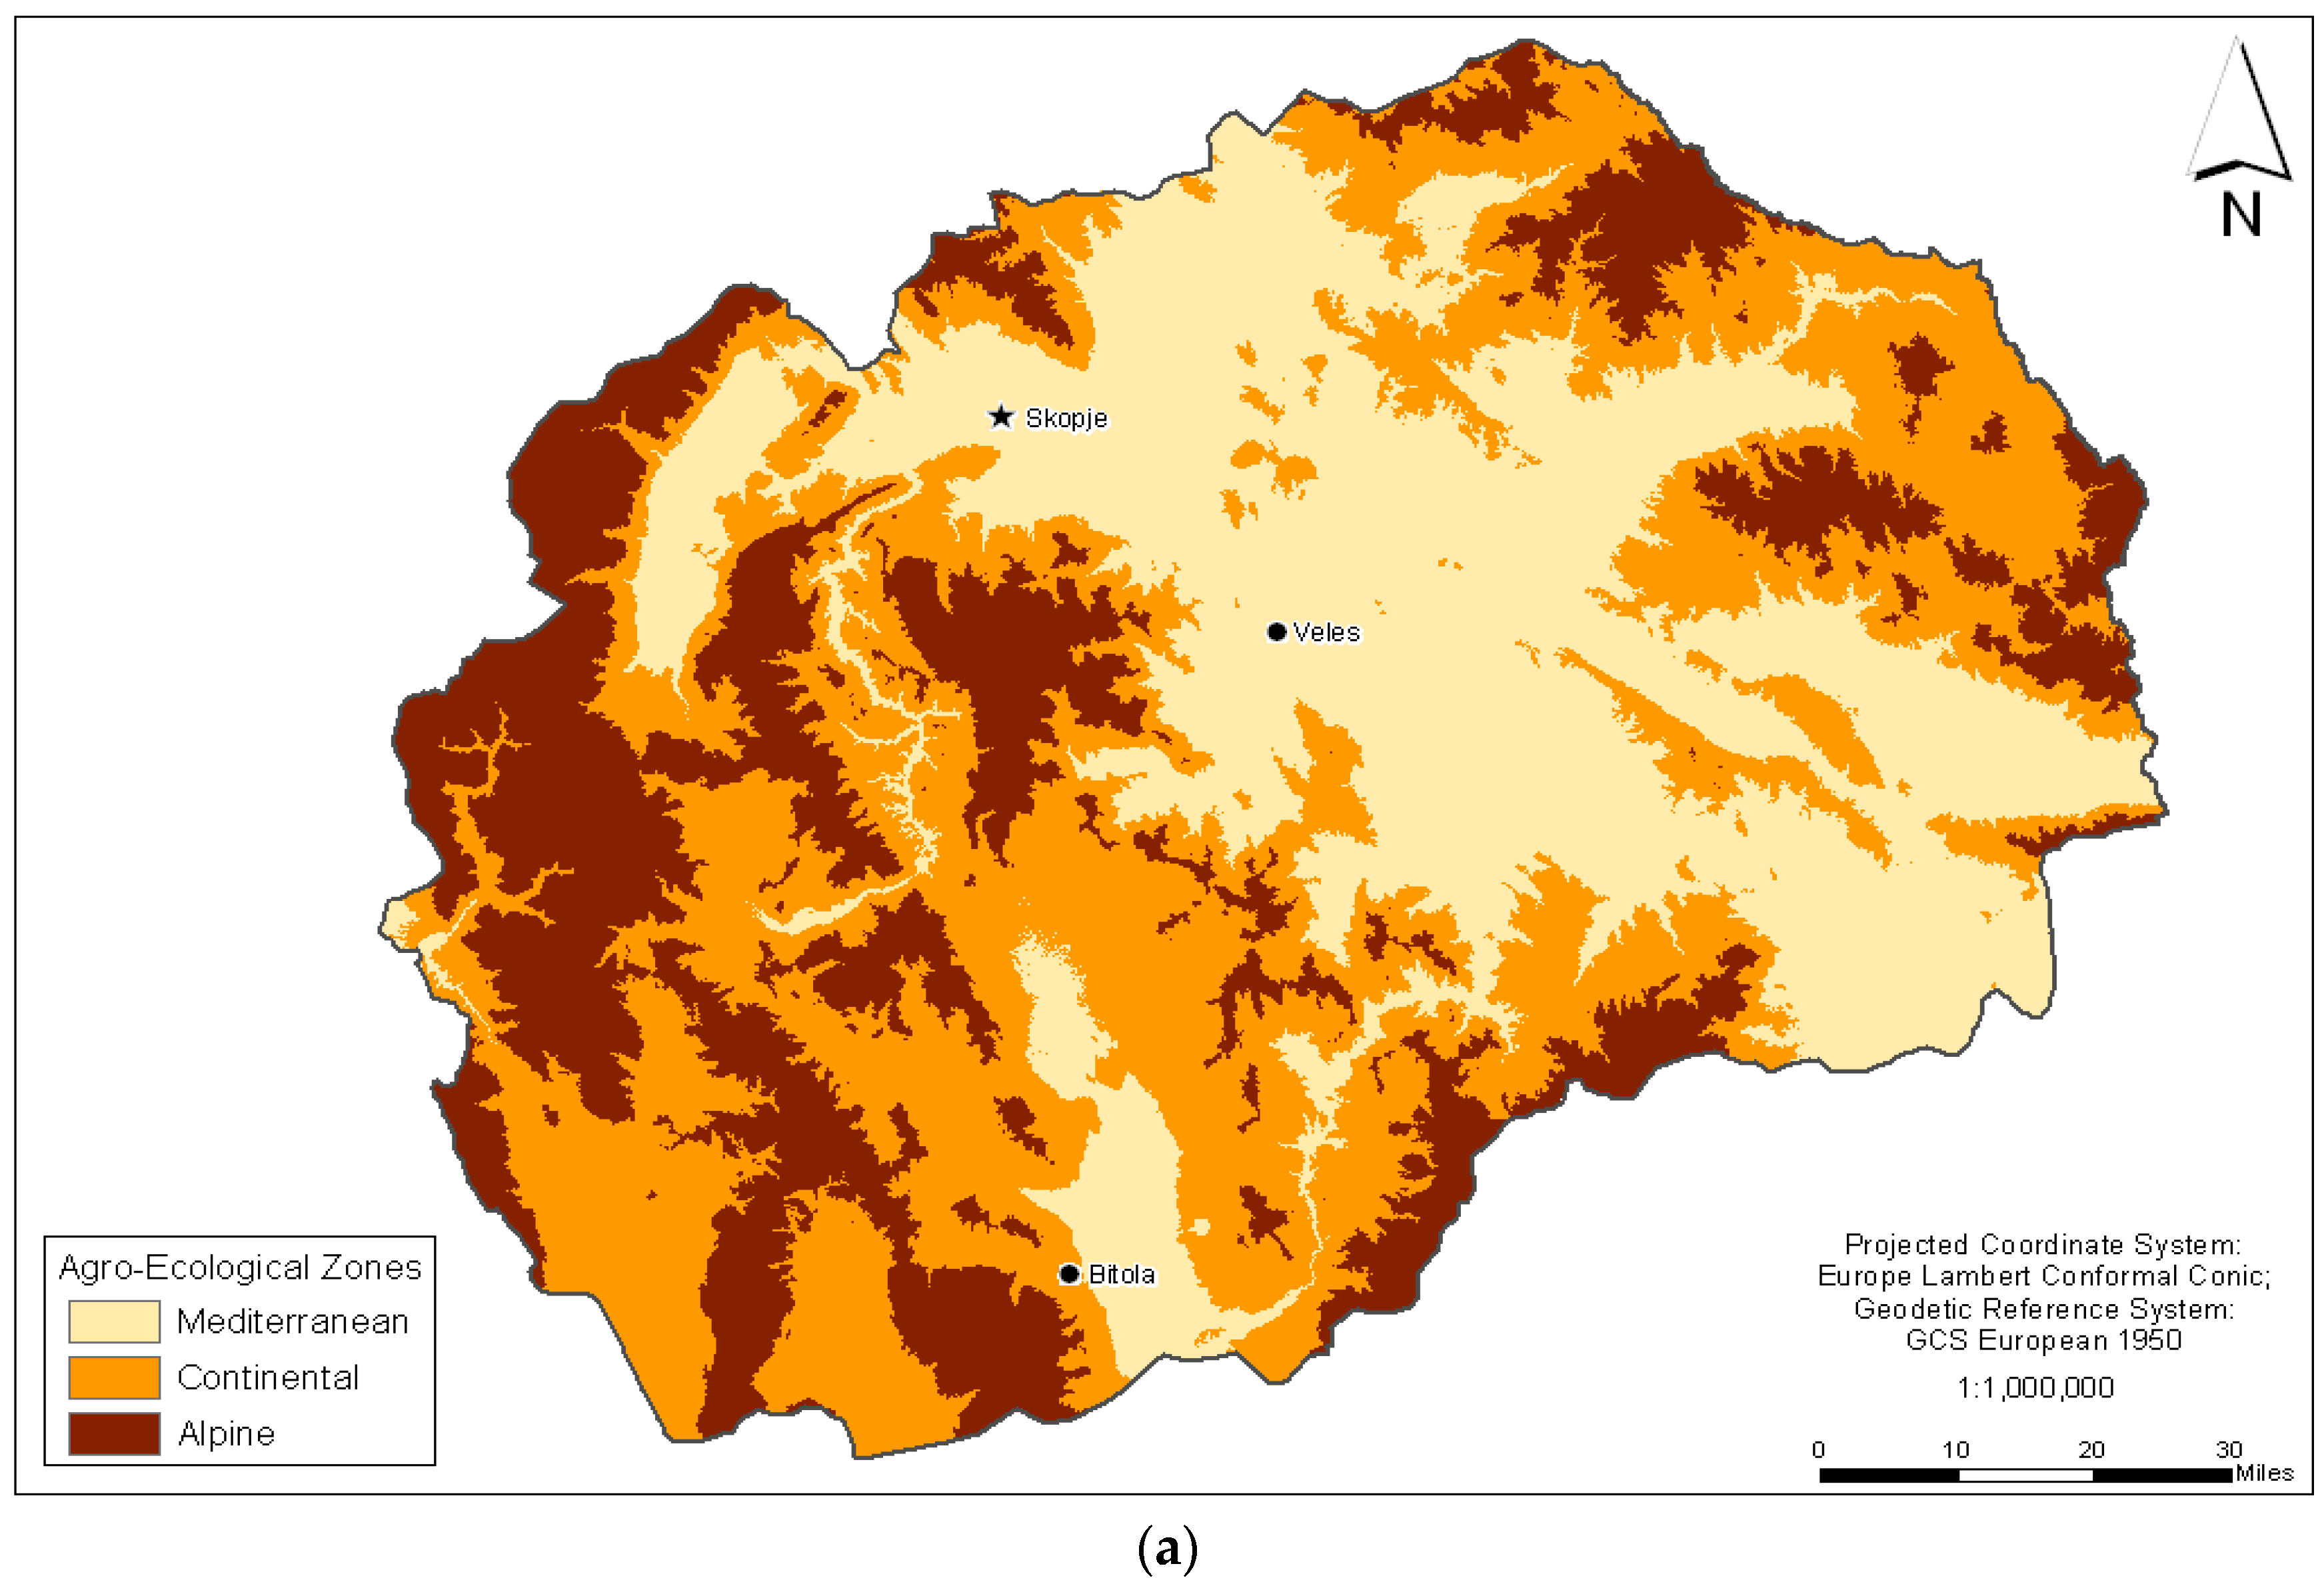
The projections vary mainly due to the three different major climate types that prevail, resulting in the existence of three agro-ecological zones (AEZ), namely Mediterranean, Continental and Alpine [32]. The Alpine type is somewhat marginal for the territory of Macedonia (see Appendix A), covering only 4% of total area, while the Mediterranean and Continental zones represent 35% and 61% of total area, respectively [4]. The AEZ are characterized with significant seasonal temperature variations, resulting in hot summers and cold winters. Mean summer temperature ranges from 20.6 to 24.3 °C and winter temperature from 0.9 to 4.9 °C [33], but it can reach extreme highs of 45.7 °C (summer 2007) and lows of −30.4 °C (winter 1993) [29]. In addition to the temperature variations, there is also an uneven temporal and spatial distribution of precipitation, with more favorable conditions in the western part of the country [31]. The annual rainfall amount ranges from 400 mm to about 1000 mm, with an average of 733 mm (ibid). Climate change projections by [28] indicate that the average temperature will increase by 1 °C and 1.9 °C by 2025 and 2050, respectively. In addition, the mean precipitation for the corresponding periods is projected to decline by 3% and 5%, respectively, increasing the likelihood of more arid or drier climate conditions in Macedonia. The authors of [30] concluded that increased aridity will lead up to 50% crop losses for all irrigated agriculture in the Crna River basin by the 2040s (west part of Figure A1b in Appendix A). In the period 1961–2003 there was already a noticeable decline in river flow in all Macedonian water basins [34] which combined with a likely decrease in future precipitation, will induce even greater water scarcity.
Given the temperature and water availably variations in the dominating AEZ, several crops have been identified to be likely vulnerable to climate change (Table 2). More specifically, grape production in the Mediterranean AEZ (see Figure A1a in Appendix A) is categorized as the most vulnerable crop. In the same AEZ, tomato and winter wheat will be moderately affected whereas the effect upon alfalfa and apple production in the Continental AEZ will be the least affected production.
For the present analysis, the most recent projections, from the study conducted by [30], were applied to both datasets for 2005 and 2007 given the discrepancies in the data (Table 1). Three climate change scenarios were distinguished by using 10-year historical data on meteorological and soil characteristics and water resources, in combination with the global circulation model (GCM) (GCM is the most advanced tool currently available for simulating the response of the global climate system to increasing greenhouse gas concentrations [35]) for all three AEZ in Macedonia. The ‘driest’ (high), the “wettest” (low), and a “medium” scenario were defined by taking the average Climate Moisture Index (CMI) as an indicator of the aridity of a region. Generating the decennial, monthly and daily changes in temperature, precipitation and irrigation in combination with the AquaCrop, CropWat and Water Evaluation and Planning System (WEAP) (WEAP is a user-friendly software tool that takes an integrated approach to water resources planning [36]) model, the authors were able to simulate the impact of climate change on crop yield variance for the main crops currently grown in Macedonia in irrigated and rainfed environments, considering the water shortage due to climate change.
Overall, Table 3 shows that if no irrigation practices are applied, in almost all scenarios all crops can be expected to have diminished yields by 2040s. On the other hand, in the situation where the crops are irrigated, only grape and maize growers will be affected negatively by climate change in almost all scenarios in all AEZ. This means that the yield change can be mitigated by irrigation practices overall. The Alpine AEZ was omitted from this analysis due to its marginal spatial coverage in the territory of Macedonia, although Table 3 reveals that climate change can be expected to have positive effects on yield of alfalfa and wheat in that zone. In comparison to the [31] report, the authors of the [30] study categorize maize as a vulnerable crop with negative yield change in both AEZ (Table 3).
The available data does not distinguish and quantify the amount of crop output that originates from each AEZ. In order to relate the simulated output changes in Table 3 for each AEZ to the agricultural sub-sector output in the IO table, the following assumptions were made. A simple average of the yield change for both Mediterranean and Continental was calculated, for each respective crop and climate change scenario. This means e.g., that the yield change for irrigated and rainfed maize by the 2040s according to the low impact scenario was 8% and −22%, respectively. Furthermore, it was assumed that the total output is distributed in same proportions of irrigated and rainfed land as shown in Table 4, an assumption justified on the grounds that there is no available information on how much of the output originates from irrigated land and how much from rainfed. Hence, it was assumed for example that yield of 3.02% of cereal production was affected by +8% and that 96.98% of the rainfed output was affected negatively, by −22%. However, the respective changes were adjusted by the proportion contributed by the vulnerable crop to total sector output as listed in the EUROSTAT data on the economic accounts for agriculture. For instance, maize output in 2005 comprised 30.68% of total cereal output. Thus, only 30.68% of the total cereal sector output in 2005 was affected by the demand-driven changes regarding each climate change scenario for maize in the IO table. The same applied for wheat, tomato, apple and alfalfa data.
Once the changes in the AEZ under the climate change scenarios had been identified, this information was used to derive the impact on agricultural production and the associated water requirement by using the mixed IO model approach. The next section shows how the changes in agriculture according to the climate change scenarios interacted with the rest of the economy.
3. Results
3.1. Mixed Model Results (Supply-Driven)
In the 2005 disaggregated IO table there are 40 sectors (Table 5), of which five outputs were fixed given the vulnerable crops identified in the previous section. According to the mixed model approach, the direct and indirect output changes given the supply-driven change and the water requirements for associated sectors under the three climate change scenarios are summarized in Table 5.
In the low case scenario, it is immediately obvious that the sectors cereals (1) and grape production (6) are predicted to decline by about 4% and 1%, respectively, due to the climate change effect. Other sectors such as vegetables (4), fruit (5) and other crops (7) gain a benefit in the low climate change scenario. This is particularly evident for sector (7), mainly dominated by alfalfa, which is predicted to fully utilize the increased cropping period and temperature and the moderate changes in precipitation, leading to an increase in output of around 38%. Alfalfa, the most irrigated crop in this sector, will impose additional stress upon the already intensive water consumption, which will consequently be increased by 2040s by roughly 16 million m3 (around 7% of the current total water use by agriculture). The climate change effects on indirect output (from the rest of the economy) can be disregarded as they represent a marginal percentage change (less than 1%). Therefore, overall there will be net positive effects of low impact climate change, but these will increase water use by 15.71 million m3 (around 6% of the current water use by agriculture) up to the 2040s.
In the medium and high case scenarios, it is evident that the direct effects of climate change are likely to have a strong negative impact on all sectors. The high impact scenario, with less precipitation and higher evapotranspiration, has a severe impact for the grape (6), cereals (1) and fruit (5) sub-sectors, with a decline in output of around 47%, 20%, and 16%, respectively. The medium case scenario follows the same pattern, with a marked output decline for these sub-sectors (around 27%, 11%, and 11%, respectively), but the impact is lower due to the moderate increase in temperature and precipitation. These results are to some extent consistent with the [31] report, where grape production is categorized as the most vulnerable crop, followed by cereals. Although apple is characterized as a less vulnerable crop, from the results presented in Table 5 it is apparent that fruit production should be categorized as highly vulnerable, given the projected range of negative impact. In contrast, given the projected change in output the vegetable sector should be considered a less vulnerable crop sub-sector. This is because most Macedonian vegetable growers produce their goods as early season crops in controlled conditions, either in greenhouses or plastic tunnels.
Due to the negative impact of global warming in the medium and high impact scenarios, a marked decline in the overall use of water can be expected in the respective scenarios if the same irrigation practices are maintained. More specifically, for the medium case scenario, the water use is most likely to decline up to 2040s by 20.57 million m3 (around 8% of current water use by agriculture). In addition, for the high case scenario it will decline up to 2040s by 39.56 million m3 (around 16% of current water use by agriculture) compared with the base case scenario in 2005.
The indirect effect on output of other sectors in these two scenarios, is again less than 1% for most sectors, i.e., marginal and hence insignificant. However, there is a decline in output for the sectors refined petroleum (24) and chemical products (25) in response to agricultural output decline, since these products are used as major inputs in agricultural production. The water consumption associated with indirect effects, is consequently insignificant and is not necessary to be considered in detail.
Applying the supply-driven changes to the data on irrigated land based on Agricultural Census [17], the results show that the same pattern holds as the above analysis in all three scenarios for all outputs directly and indirectly affected by the exogenous shock (Appendix B). Of course, the magnitude is different because of the higher reported area of irrigated land, which is able to mitigate the climate change impact to a greater extent, with e.g., a less severe negative effect in the medium and high case scenarios. Therefore, this will lead to greater water use for the high and medium climate change scenarios compared with the 2005 case, and less water use for the low change scenario.
3.2. Capital Investment Results (Demand-Driven)
For the economic valuation of the policy change arising from capital investment in irrigation equipment, figures from the 2010 Annual Agricultural Report published by the MAFWE were used. It reports that 204 million euros will be allocated for building dams, reconstruction and development of new irrigation systems, thereby aiding in capital formation. Assuming that this amount will be proportionally allocated to the current irrigation infrastructure (reflected in the 2005 IO table gross fixed capital formation column for the 11 agricultural sectors), the proportions of the gross fixed capital formulation were used to analyse the demand-driven output change from exogenous capital investment in irrigation. The results show how climate change negative effect may be mitigated and output may be increased by this policy shock (Table 6).
All crops will benefit from improvements in irrigation infrastructure, with an increase in output ranging from around 10% for grape (6) to 40% for other crop (7) production. Other crops (7) sub-sector benefits the most because it includes alfalfa, sunflower, and other industrial crops which occupy around 25% of the total irrigated area (industrial, forage, other in Table 4). However, this output change is small relative to the total amount produced in 2005 (Table 5). What is more important is the change in output in the sub-sectors such as cereals (1) and vegetables (4). Although the change is smaller than other crops (7) production, 25% and 29%, respectively, the increase is significant at macro level relative to the total amount produced in 2005.
Analysing the indirect effects, most of the output changes are marginal (less than 1%). However, there are some spillovers which are important to consider. For instance, sectors such as petroleum (24), chemical products (25), and machinery (30) provide some of the most important inputs in agricultural production. Hence, in order to satisfy the increase in output of the agriculture sector, an increase in output of around 3% and 2%, respectively, is required from these sectors.
Finally, the water demand associated with such changes in agricultural output must be considered. If the investment in irrigation control, maintenance, and repair ensures a sufficient flow, the climate change effect will be mitigated but at the same time an additional stress will be imposed on the existing limited water resources. Sub-sectors with high amount of water use and significant contribution to the total economy output, will be the key players driving the water use. For instance, assuming future water efficiency in the economy remains at the same level as in 2005, water use for cereals (1), vegetables (4) and other crops (7) production will increase by additional 7.52, 10.40 and 17.18 million m3 fresh water annually, given the demand-driven shock. In total the water use with the remaining agricultural sub-sectors will be 49.51 million m3. For comparison, water use in agriculture was 255.1 million m3 in 2005, meaning that every year, an additional demand of around 19% will be imposed by the agricultural sub-sectors in Macedonia.
4. Discussion and Conclusions
This analysis provides indications of the direct impacts of projected climate change on Macedonian agricultural output, and of the indirect effects on the rest of the economy. It shows that the exogenous shocks from climate change will in fact matter the most for the agriculture sector in terms of yield reduction and associated water requirements. It will matter particularly for grape, fruit, cereal and alfalfa production, as they are the most vulnerable crops in the climate change scenarios defined here. Some of crops are the driving forces of the local economy. For instance, the value of the production of cereals for the analysed period represents around 11% of the total value of agricultural production. The country is very dependent on the domestic cereal production since most of the demand is met through imports [38]. In addition, abolishing the intervention purchase of state supplies in 2005 as well as the change of the principle for issuing import licenses “first come—first served” puts an additional pressure to the domestic cereal producers [4]. Thus, any change in the domestic cereal production will have a significant effect for both human and cattle diet and use in the food processing industry. Change in fruit and grape production is also important aspect for the national economy. The processing industry is highly dependent on the domestic production because of issues such as high import tariffs and complex procedures for fresh product imports [39]. Moreover, these are the main export commodities and together with vegetables contributed to around 50% of the total export value of agricultural products in 2005 [22]. Climate change effect on vegetables production was shown to be insignificant. However, special attention should be given to this production irrespective of the result. Vegetable production output contributes roughly 30% of the total agricultural output. In addition vegetables are also major export commodity (16% of the total export value in 2005) but most important they are input for the processing industry. Especially for the local pepper-based product “ajvar” which is of great importance for the country by contributing to around 19% of the total agri-food processing production [39]. Therefore, even marginal change in output may have greater implications for the local economy or semi-subsistence small scale producers.
However, in terms of water demand, climate change will have no major impact on the other sectors in the economy. A potential long-term decline in water resources, combined with the irrigation issues the farmers are facing, is not likely to lead to an increasing competition for water demand from other sectors of the Macedonian economy, especially during the summer, when water use is highest. Capital investment in irrigation infrastructure may mitigate the negative effect of the warming effects. However, this will come at cost to the environment by increasing water use by the agricultural sub-sector such as: cereals, vegetables and other crops, especially alfalfa, which will put additional pressure to the existing water resources. Although sufficient water supply and increased output would be assured by capital investment in irrigation infrastructure, the existing water resources are likely to be depleted owing to the warming effect of increased temperature and evapotranspiration, followed by less annual rainfall. This recognises that farming must be more efficient in its use of water. In real life separation into supply-driven and demand-driven results can’t be done, because these changes occur simultaneously. However, considering the equilibrium impact it turns that there will be always excess demand for water by agriculture irrespective of which scenario is considered. Therefore, care is needed when applying the policy-driven impacts and associated water quantifications reported here, which are based on future climate projections for temperature and annual precipitation at national level, in deriving adaptation measures.
The general findings that agricultural output and water requirements will vary across climate change scenarios may be considered with a level of uncertainty when using the findings for adaptation measures.
The main limitation in the analysis is that for the climate change impact, the 2005 IO table for the Macedonian economy published by the State Statistical Office [19] was used as the base case scenario. Thus, the analysis is static and the scenarios do not consider any technological improvements, resulting in uncertainty on how agriculture and the rest of the economy will develop in the long-run. Macedonia has been recognized as a potential candidate member of the European Union (EU), and is thus likely to be affected by the EU Common Agricultural Policy (CAP) and trade liberalization agreements. Liberalisation and integration into the Central European Free Trade Agreement (CEFTA) markets are challenging the competitiveness of Macedonian agriculture [40], and this situation could be further exacerbated by EU accession. On the other hand, due to the new agricultural and rural development policy support there is farm modernization and agricultural intensification which also affects the projections of future climate change impacts.
There have been several attempts to forecast and project agricultural output by the 2040s using the EURO method [41] and the forecasting technique devised by [42], but the predictive performance of the model deteriorates rapidly as the time difference between the base and projected year increases. The EURO method is very sensitive at disaggregated level and high growth rates, which characterized some sectors in the Macedonian economy over the period 2005–2010. Consequently, the method overestimates the output and final demand. For example the total output in 2010 in the recent officially published IO table is 18,642 million euros [43], whereas the corresponding output using the EURO method forecasting technique is 25,277 million euros, a discrepancy of around 6635 million euros.
The linearity assumption of the IO model structure as well as fixed proportion production technology with constant prices ensures additional limitation of this methodology [11]. Absence of substitution in consumption or input use may not be in line with the reality. Even though it may be argued that the results are overestimated because of such assumption, still the results indicate that the adaptation measures should be towards new irrigation technologies or water resistant crop varieties. Water is an essential input and cannot be substituted with any other input during the production process.
The assumption that irrigation technology and efficiency will remain constant at the 2005 level until the 2040s is another limitation. Irrigation efficiency will most likely decrease due to the increase in temperature and associated increase in evapotranspiration. Deterioration in the functioning of existing irrigation schemes due to the inability of the water management associations and officials to cover the costs of historical bad debt and capital depreciation will emphasize the inefficiency even more, unless there is rapid modernization. If we were able to observe agricultural development or structural change over time we could presume expansion of irrigated farmland or modernised irrigation in future scenarios.
Importantly, in defining the climate change scenarios and exogenous shocks, it was proved impossible to capture the yield changes for each AEZ separately in an IO framework, as done by [30]. The uncertainty in the projected climate change scenarios was reduced by considering a wide range of studies elaborating on such matters, which produced the same general conclusions as were used to specify the scenarios. Still, the projected water shortages that [30] used to define the climate change scenarios do not consider the use of groundwater resources, but are limited to the use of surface water.
The direct effect of heat stress upon livestock was not included, despite the fact that in all studies cited on climate change and Macedonia, the livestock sector is categorized as vulnerable, but without any specific quantitative impacts. The increase in temperature and the associated risk of diseases and increased mortality are especially important for the modern highly productive livestock breeds. However, with the exogenous shock on forage crop production it proved possible to capture the indirect effect on cattle production, which turned out to be very marginal.
The analytical method used to investigate climate change from an economic perspective may be an additional cause of uncertainty in the projections. In their study, the authors of [3] used a Computable General Equilibrium (CGE) model. However, in order to implement such a model, data on prices, input substitution and elasticities as key instruments in the adjustment of the economy to climate change shock are needed, which are not available for the Macedonian economy. Thus, the choice of IO model was based on its ability to explain the relationships between climate-sensitive sectors in a disaggregated environment [44]. It is noteworthy that it provided informative preliminary results on climate change impact which give a possible indication of how the economy may develop in the future and which adaptation measures to prioritize. A sensitivity analysis is probably necessary, however, given the assumptions and uncertainties created while constructing the climate change scenarios. It is also important to mention that the demand-driven analysis was done by assuming that the investment was done in one year, which probably results in overestimated output changes. In reality investment in irrigation projects for the restoration and development is conducted in several stages over many years. Thus, such analysis requires a dynamic aspect together with the forecasting technique regarding the economic growth, to be more accurate.
Despite these limitations which we identified above, the direction of impacts and their magnitudes are well identified from which several major points may be concluded. First, the indirect effect upon the rest of the economy is insignificant from an exogenously defined direct climate change effect on agricultural crop output. Second, the physical impact on water consumption will vary, with the differing direct effects of climate change across scenarios, with an increase in the low impact scenario and a decrease in the medium and high scenarios. However, not necessary means that decrease in consumption will mitigate the water scarcity issues. Since the spatial effect or regional distribution of water resource availability is not captured, some regions will probably still endure problems with sufficient water supply at the right time and place. Third, the policy shock of capital investment in the development, reconstruction and maintenance of irrigation infrastructure in order to meet the requirements of future water consumption will increase the output of the agriculture sector, but also its water demand. Therefore, there will most likely be an additional stress of intensive water consumption over time by the agriculture sector. Overall, the results obtained in this study indicate that special attention should be paid to agricultural production sectors posing the greatest potential opportunities and threats. Profound climate mitigation policy recommendations are possible given the revealed interactions and variations in output.
Acknowledgments
I would like to thank Aleksandra Martinovska-Stojcheska from the Institute of Agricultural Economics, Faculty of Agriculture Sciences and Food, “Ss. Cyril and Methodius University”—Skopje, Macedonia, Yves Surry from the Department of Economics at the Swedish University of Agricultural Sciences in Uppsala, Sweden and two anonymous reviewers, for their valuable comments and suggestions that help improve this paper. In addition, I would like to acknowledge the financial support received from the Swedish International Development Cooperation Agency (SIDA) under the UniCoop project. The views expressed in this paper are solely those of the author and do not represent the views of SIDA.
Conflicts of Interest
The authors declare no conflicts of interest.
Appendix A

Appendix B

Table A1.
Changes in output and water use due to different climate change scenarios, based on data on rainfed and irrigated land area taken from the 2007 Agricultural Census [17].
Table A1.
Changes in output and water use due to different climate change scenarios, based on data on rainfed and irrigated land area taken from the 2007 Agricultural Census [17].
| Sector | 2005 | Output Change (%) | Change in Water Use (Mill. m3) | ||||||
|---|---|---|---|---|---|---|---|---|---|
| Output (Mill. Euros) | Water Use (Mill. m3) | Low | Medium | High | Low | Medium | High | ||
| 1 | Cereals | 103.79 | 26.11 | −1.85 | −8.08 | −17.36 | −0.48 | −2.11 | −4.53 |
| 2 | Rice | 7.93 | 14.07 | 0.02 | −0.09 | −0.18 | 0.00 | −0.01 | −0.02 |
| 3 | Raw tobacco | 67.63 | 11.27 | 0.00 | 0.00 | 0.00 | 0.00 | 0.00 | 0.00 |
| 4 | Vegetables | 276.68 | 41.98 | 0.65 | −0.68 | −2.59 | 0.27 | −0.29 | −1.09 |
| 5 | Fruits | 60.62 | 23.65 | 1.67 | −5.71 | −8.97 | 0.40 | −1.35 | −2.12 |
| 6 | Grapes and wine | 89.53 | 49.82 | 0.58 | −24.53 | −44.84 | 0.29 | −12.22 | −22.34 |
| 7 | Other crops | 53.95 | 43.73 | 37.82 | −1.20 | −8.98 | 16.54 | −0.52 | −3.93 |
| 8 | Cattle | 122.83 | 25.59 | 0.01 | −0.04 | −0.08 | 0.00 | −0.01 | −0.02 |
| 9 | Pigs | 43.85 | 5.02 | 0.01 | −0.04 | −0.09 | 0.00 | 0.00 | 0.00 |
| 10 | Sheep/lamb | 32.60 | 11.04 | 0.01 | −0.02 | −0.04 | 0.00 | 0.00 | 0.00 |
| 11 | Other livestock | 45.71 | 2.81 | 0.01 | −0.03 | −0.06 | 0.00 | 0.00 | 0.00 |
| 12 | Forestry | 24.26 | 0.00 | 0.00 | −0.01 | −0.01 | 0.00 | 0.00 | 0.00 |
| 13 | Fishing activities | 1.17 | 0.00 | 0.03 | −0.03 | −0.07 | 0.00 | 0.00 | 0.00 |
| 14 | Mining and quarrying | 94.42 | 161.32 | 0.03 | −0.05 | −0.11 | 0.05 | −0.07 | −0.18 |
| 15 | Other mining | 59.17 | 26.43 | 0.02 | −0.06 | −0.13 | 0.01 | −0.02 | −0.03 |
| 16 | Food and beverages | 503.27 | 103.37 | 0.02 | −0.11 | −0.21 | 0.02 | −0.11 | −0.22 |
| 17 | Tobacco products | 145.93 | 0.40 | 0.00 | 0.00 | 0.00 | 0.00 | 0.00 | 0.00 |
| 18 | Textiles | 48.57 | 0.45 | 0.00 | 0.00 | 0.00 | 0.00 | 0.00 | 0.00 |
| 19 | Wearing apparel; furs | 439.43 | 0.97 | 0.00 | 0.00 | 0.00 | 0.00 | 0.00 | 0.00 |
| 20 | Leather products | 46.78 | 0.04 | 0.00 | 0.00 | 0.00 | 0.00 | 0.00 | 0.00 |
| 21 | Wood products | 27.22 | 2.20 | 0.01 | −0.02 | −0.04 | 0.00 | 0.00 | 0.00 |
| 22 | Pulp, paper products | 83.82 | 0.08 | 0.06 | −0.06 | −0.14 | 0.00 | 0.00 | 0.00 |
| 23 | Printed matter | 17.20 | 0.29 | 0.02 | −0.06 | −0.12 | 0.00 | 0.00 | 0.00 |
| 24 | Refined petroleum | 361.67 | 0.28 | 0.52 | −0.89 | −1.84 | 0.00 | 0.00 | −0.01 |
| 25 | Chemicals | 94.08 | 4.71 | 0.14 | −0.72 | −1.48 | 0.01 | −0.03 | −0.07 |
| 26 | Rubber and plastic | 70.05 | 0.07 | 0.07 | −0.30 | −0.56 | 0.00 | 0.00 | 0.00 |
| 27 | Other mineral prod. | 106.89 | 1.46 | 0.03 | −0.05 | −0.10 | 0.00 | 0.00 | 0.00 |
| 28 | Basic metals | 490.05 | 68.13 | 0.00 | 0.00 | 0.00 | 0.00 | 0.00 | 0.00 |
| 29 | Fabricated metal | 68.80 | 0.09 | 0.03 | −0.03 | −0.07 | 0.00 | 0.00 | 0.00 |
| 30 | Machinery | 34.42 | 4.52 | 0.20 | −0.46 | −0.90 | 0.01 | −0.02 | −0.04 |
| 31 | Electrical machinery | 83.85 | 42.81 | 0.02 | −0.03 | −0.06 | 0.01 | −0.01 | −0.03 |
| 32 | Medical instruments | 6.50 | 0.01 | 0.00 | 0.00 | −0.01 | 0.00 | 0.00 | 0.00 |
| 33 | Motor vehicles | 29.51 | 0.17 | 0.02 | −0.02 | −0.04 | 0.00 | 0.00 | 0.00 |
| 34 | Other transport | 10.72 | 0.13 | 0.00 | 0.00 | 0.00 | 0.00 | 0.00 | 0.00 |
| 35 | Furniture | 28.98 | 0.31 | 0.03 | −0.03 | −0.06 | 0.00 | 0.00 | 0.00 |
| 36 | Secondary materials | 11.12 | 0.002 | 0.01 | −0.01 | −0.02 | 0.00 | 0.00 | 0.00 |
| 37 | Electrical energy | 236.37 | 1.00 | 0.08 | −0.11 | −0.28 | 0.00 | 0.00 | 0.00 |
| 38 | Collected water | 43.07 | 0.00 | 0.01 | −0.03 | −0.05 | 0.00 | 0.00 | 0.00 |
| 39 | Construction work | 689.53 | 1.00 | 0.01 | −0.01 | −0.02 | 0.00 | 0.00 | 0.00 |
| 40 | Other services | 4127.02 | 8.40 | 0.06 | −0.06 | −0.13 | 0.00 | −0.01 | −0.01 |
| Total | 683.78 | 17.14 | −16.79 | −34.66 | |||||
Note: Mill. = million; Bold indicates the five fixed sectors in the mixed model approach or the direct supply-driven shock for the vulnerable crops. The absolute variation in water use was obtained using the derived water coefficients for each sector [37] which were assumed to be the same over the years, i.e., water use/output = direct water coefficient. Therefore, by knowing the change in output, the absolute change in water use is: i.e., direct water coefficient × output variation = water use variation.
References
- Ciscar, J.C.; Iglesias, A.; Perry, M.; van Regemorter, D. Agriculture, Climate Change and the Global Economy. In Proceedings of the Macroeconomics and Climate Change, Cowles Foundation for Research in Economics, New Haven, CT, USA, 11–12 June 2012. [Google Scholar]
- State Statistical Office (SSO). Labor Force Survey 2011; State Statistical Office (SSO): Skopje, Macedonia, 2012.
- Iglesias, A.; Garrote, L.; Quiroga, S.; Moneo, M. A regional comparison of the effects of climate change on agricultural crops in Europe. Clim. Chang. 2012, 112, 29–46. [Google Scholar] [CrossRef] [Green Version]
- Ministry of Agriculture. Forestry and Water Economy (MAFWE) (2009–2012). Agricultural Annual Report (Various Issues, 2008–2011); Ministry of Agriculture. Forestry and Water Economy (MAFWE): Skopje, Macedonia, 2009–2012.
- State Statistical Office (SSO). Typology of Agricultural Holdings; News release No. 5.1.11.06; State Statistical Office (SSO): Skopje, Macedonia, 2011.
- Callaway, J.M.; Markovska, N.; Cukaliev, O.; Causevski, A.; Gjoshevski, D.; Taseska, V.; Nikolova, S. Assessing the Economic Impact of Climate Change: National Case Studies; United Nations Development Programme (UNDP): Skopje, Macedonia, 2011. [Google Scholar]
- United Nations Economic Commission for Europe (UNECE). 2nd Environmental Performance Review: The Former Yugoslav Republic of Macedonia; United Nations Economic Commission for Europe (UNECE): New York, NY, USA; Geneva, Switzerland, 2011. [Google Scholar]
- Cornish, G.; Bosworth, B.; Perry, C.; Burkey, J. Water Charging in Irrigated Agriculture: An Analysis of International Experience; FAO Water Reports 28; Food and Agricultural Organization of the United Nations: Rome, Italy, 2004. [Google Scholar]
- Gorton, M.; Sauer, J.; Peshevski, M.; Bosev, D.; Shekerinov, D.; Quarrie, S. Water Communities in the Republic of Macedonia: An empirical analysis of membership satisfaction and payment behaviour. World Dev. 2009, 37, 1951–1963. [Google Scholar] [CrossRef]
- Svendsen, M.; Turral, H. Reinventing Irrigation in Water for Food, Water for Life: A Comprehensive Assessment of Water Management in Agriculture; Molden, D., Ed.; Earthscan, London and International Water Management Colombo Institute: London, UK, 2007; p. 354. [Google Scholar]
- Miller, R.E.; Blair, P.D. Input–Output Analysis. Foundations and Extensions, 2nd ed.; Cambridge University Press: Cambridge, UK, 2009. [Google Scholar]
- Leontief, W. Environmental repercussions and the economic structure: An input–output approach. Rev. Econ. Stat. 1970, 52, 262–271. [Google Scholar] [CrossRef]
- Leontief, W. Quantitative input–output relations in the economic system of the United States. Rev. Econ. Stat. 1936, 18, 105–125. [Google Scholar] [CrossRef]
- Steinback, S. Using ready-made regional input–output models to estimate backward linkage effects of exogenous output shocks. Rev. Reg. Stud. 2004, 34, 57–71. [Google Scholar]
- Roberts, D. A modified Leontief model for analysing the impact of milk quotas on the wider economy. J. Agric. Econ. 1994, 45, 90–101. [Google Scholar] [CrossRef]
- Tanjuakio, R.; Hastings, S.E.; Tytus, P.J. The Economic contribution of agriculture in Delaware. Agric. Resour. Econ. Rev. 1996, 25, 46–53. [Google Scholar] [CrossRef]
- State Statistical Office (SSO). Agricultural Census, Book III; State Statistical Office (SSO): Skopje, Macedonia, 2007; p. 101.
- Lindberg, G.; Hansson, H. Economic impacts of agriculture in Sweden: A disaggregated input–output approach. Food Econ. Acta Agric. Scand. C 2009, 6, 119–133. [Google Scholar] [CrossRef]
- State Statistical Office (SSO). Symmetric Input–Output Tables for the Republic of Macedonia, 2005. In Statistical Review: National Economy and Finances; State Statistical Office (SSO): Skopje, Macedonia, 2008. [Google Scholar]
- Martinovska-Stojcheska, A.; Georgiev, N.; Erjavec, E. Farm income analysis of agricultural holdings in Macedonia using FADN methodology. Acta Agric. Slov. 2008, 92, 41–51. [Google Scholar]
- Martinovska-Stojcheska, A.; Dimitrievski, D.; Surry, Y.; Sergo, L.; Andersson, H. Economic and technical analysis of Macedonian farms based on the farm accountancy data: 2005–2009 period. In UniCoop publication, Faculty of Agricultural Sciences and Food—Skopje and Swedish University of Agricultural Sciences—Uppsala; Faculty of Agricultural Sciences and Food: Skopje, Macedonia, 2011. [Google Scholar]
- State Statistical Office (SSO). State Statistical Yearbook 2006; State Statistical Office (SSO): Skopje, Macedonia, 2007.
- Hoekstra, A.Y.; Hung, P.Q. Virtual Water Trade: A Quantification of Virtual Water Flows between Nations in Relation to International Crop Trade; Value of Water Research Report Series No. 11; UNESCO-IHE: Delft, The Netherlands, 2002. [Google Scholar]
- Iljovski, I. Irrigation: Compendium for the Students at the Faculty for Agriculture in Skopje; Faculty of Agriculture: Skopje, Macedonia, 1990. [Google Scholar]
- Allen, R.G.; Pereira, L.S.; Raes, D.; Smith, M. Crop Evapotranspiration: Guidelines for Computing Crop Water Requirements; FAO irrigation and drainage paper No. 56; Food and Agriculture Organization (FAO): Rome, Italy, 1998. [Google Scholar]
- Falkenmark, M.; Rockström, J. The new blue and green water paradigm: Breaking new ground for water resources planning and management. J. Water Resour. Plan. Manag. 2006, 132, 129–132. [Google Scholar] [CrossRef]
- Galev, T.; Arsovski, B. Organization of Agricultural Enterprises and Organization of Livestock Production; Ss. Cyril and Methodius University of Skopje: Skopje, Macedonia, 1990. [Google Scholar]
- Bergant, K. Climate Change Scenarios for Macedonia—Summary; University of Nova Gorica: Gorica, Slovenia, 2006. [Google Scholar]
- Ministry of Environment and Physical Planning (MOEPP). Second National Communication on Climate Change; Ministry of Environment and Physical Planning (MOEPP): Skopje, Macedonia, 2008.
- Sutton, W.R.; Srivastava, J.P.; Neumann, J.E.; Strzępek, K.M.; Boehlert, B.B. Reducing the Vulnerability of the Former Yugoslav Republic of Macedonia’s Agricultural Systems to Climate Change; Report Number 81590; World Bank: Washington, DC, USA, 2013. [Google Scholar]
- World Bank. The Former Yugoslav Republic of Macedonia: Agriculture and Climate Change Country Note; World Bank: Washington, DC, USA, 2010. [Google Scholar]
- Aladzajkov, L. Collection and Study of Vegetables and Small Fruits throughout Macedonia; Final Report Project No. E30-SR-33; Institute of Agriculture: Skopje, Macedonia, 1974. [Google Scholar]
- World Bank. Country Profile: Republic of Macedonia. Available online: http://siteresources.worldbank.org/CMUDLP/Resources/Macedonia_report.pdf (accessed on 7 March 2014).
- Ministry of Environment and Physical Planning (MOEPP). Second National Report under the United Nations Climate Change Kyoto Protocol: Assessment of Vulnerability and Adaptation of the Water Resource Sector; Ministry of Environment and Physical Planning (MOEPP): Skopje, Macedonia, 2006.
- Intergovernmental Panel on Climate Change (IPCC). What Is GCM? Available online: http://www.ipcc-data.org/guidelines/pages/gcm_guide.html (accessed on 20 May 2014).
- Water Evaluation and Planning (WEAP). Available online: http://www.weap21.org/index.asp?NewLang=EN (accessed on 20 May 2014).
- Velazquez, E. An input–output model of water consumption: Analyzing intersectoral water relationships in Andalusia. Ecol. Econ. 2006, 56, 226–240. [Google Scholar] [CrossRef]
- Ažderski, J.; Belkovski, N.; Georgiev, N.; Dimitrievski, D.; Gjorgjevski, D.; Gjosevski, D.; Janeska Stamenkovska, I.; Kotevska, A.; Krstevska, A.; Manevska Tasevska, G.; et al. Sector study—Macedonian agriculture in the period 1994–2007. In UniCoop (Building Capacity for Macedonian Higher Education, Research and Policy Analysis in Agriculture—With a Focus on Agricultural Economics); Dimitrievski, D., Ericson, T., Eds.; Faculty of Agricultural Sciences and Food: Skopje, Macedonia, 2010. [Google Scholar]
- Risteski, S. Survey on the Performance of the Fruit and Vegetable Processing Industry 2011; Macedonian Association of Processors: Skopje, Macedonia, 2012. [Google Scholar]
- Dimitrievski, D.; Kotevska, A. Challenges faced by the agro-food sector in the Republic of Macedonia as regards its integration with the EU markets. In Agriculture in Western Balkans and EU Integration; DAES: Ljubljana, Slovenia, 2008; pp. 47–67. [Google Scholar]
- EUROSTAT. Eurostat Manual of Supply, Use and Input–Output Tables; Office for Official Publications of the European Communities: Luxembourg, 2008. [Google Scholar]
- Midmore, P. Input–output forecasting of regional agricultural policy impacts. J. Agric. Econ. 1993, 44, 284–300. [Google Scholar] [CrossRef]
- State Statistical Office (SSO). Symmetric Input–Output Tables for the Republic of Macedonia, 2010. In Statistical Review: National Economy and Finances; State Statistical Office (SSO): Skopje, Macedonia, 2013. [Google Scholar]
- Rose, A.; Cao, Y.; Oladosu, G. Simulating the economic impacts of climate change in the Mid-Atlantic Region. Clim. Res. 2000, 14, 175–183. [Google Scholar] [CrossRef]
- Ministry of Environment and Physical Planning (MOEPP). Water Strategy of the Republic of Macedonia: Draft Final Version; Ministry of Environment and Physical Planning (MOEPP): Skopje, Macedonia, 2010.
Figure 1.
Steps involved in disaggregating the agriculture sector of the input–output table for Macedonia.
Figure 1.
Steps involved in disaggregating the agriculture sector of the input–output table for Macedonia.

Table 1.
Area (ha) of irrigated crop land in Macedonia, according to two reports.
| Crop | 2008 Annual Agricultural Report | Agricultural Census | ||||
|---|---|---|---|---|---|---|
| 2004 | 2005 | 2006 | 2007 | 2008 | 2007 | |
| Cereals | 7501 | 6170 | 6780 | 7743 | 6919 | 24,360 |
| Industrial crops | 2129 | 2131 | 1550 | 1300 | 1012 | 4533 |
| Vegetables | 2283 | 2801 | 1956 | 1468 | 1920 | 15,499 |
| Forage crops | 3159 | 2468 | 2943 | 2807 | 2907 | 4388 |
| Fruit | 1785 | 1574 | 1194 | 1371 | 1501 | 5908 |
| Grapes | 5988 | 5045 | 3592 | 7155 | 6211 | 8467 |
| Other | 315 | 551 | 319 | 317 | 1100 | 1635 |
| Pastures and meadows | 4277 | |||||
| Total irrigated land | 23,160 | 20,740 | 18,334 | 22,161 | 21,570 | 69,070 |
Table 2.
Vulnerability of agricultural regions and crops in Macedonia to climate change by 2100.
| Vulnerability | Agro-Ecological Zone And Location | Crop |
|---|---|---|
| Most vulnerable | Mediterranean Zone: Povardarie | Grape |
| Highly vulnerable | Mediterranean Zone: Strumica | Tomato |
| Mediterranean Zone–Gevgelija: southern Vardar valley | Tomato | |
| Mediterranean Zone–Skopje: Kumanovo valley | Winter wheat | |
| Mediterranean Zone–Ovce Pole | Winter wheat | |
| Less vulnerable | Continental Zone: Pelagonija valley | Alfalfa |
| Continental Zone: Prespa/Ohrid region | Apple |
Source: ([31]).
Table 3.
Range of crop yield change relative to the current situation (% by 2040s) across the three climate scenarios high, medium and low.
Table 3.
Range of crop yield change relative to the current situation (% by 2040s) across the three climate scenarios high, medium and low.
| Crop | Mediterranean | Continental | Alpine | |||||||
|---|---|---|---|---|---|---|---|---|---|---|
| Low | Medium | High | Low | Medium | High | Low | Medium | High | ||
| Irrigated | Alfalfa | 33 | 5 | 4 | 42 | 28 | 21 | 92 | 71 | 68 |
| Apples | 10 | 9 | 9 | 15 | 13 | 11 | 15 | 15 | 14 | |
| Grapes | −3 | −14 | −35 | 12 | −23 | −39 | N/A | N/A | N/A | |
| Maize | −9 | 0 | −11 | 25 | 27 | 19 | N/A | N/A | N/A | |
| Vegetables | 19 | 11 | 3 | 8 | 10 | 3 | N/A | N/A | N/A | |
| Wheat | 15 | 16 | 13 | 28 | 30 | 25 | 113 | 100 | 76 | |
| Rainfed | Alfalfa | 45 | −10 | −17 | 42 | 2 | −10 | 56 | 42 | 43 |
| Apples | −7 | −45 | −60 | 6 | −41 | −63 | −4 | 6 | 13 | |
| Grapes | −12 | −25 | −47 | 8 | −32 | −53 | N/A | N/A | N/A | |
| Maize | −52 | −62 | −76 | 8 | −54 | −77 | N/A | N/A | N/A | |
| Vegetables | 10 | −11 | −21 | −8 | −9 | −28 | N/A | N/A | N/A | |
| Wheat | −1 | 6 | −3 | 15 | 25 | 13 | 105 | 99 | 70 | |
Source: Adapted from [30]. Note: N/A indicates that the crop is not grown in the agro-ecological zones (AEZ) in question.
Table 4.
Comparison of irrigated and rainfed agricultural cropping area in Macedonia according to two official sources.
Table 4.
Comparison of irrigated and rainfed agricultural cropping area in Macedonia according to two official sources.
| Source/Year | MAFWE-2005 | Agricultural Census-2007 | ||||||
|---|---|---|---|---|---|---|---|---|
| Crop | Area (ha) | Proportion (%) | Area (ha) | Proportion (%) | ||||
| Irrigated | Rainfed | Irrigated | Rainfed | Irrigated | Rainfed | Irrigated | Rainfed | |
| Cereals | 6170 | 197,830 | 3.02 | 96.98 | 24,360 | 158,917 | 13.29 | 86.71 |
| Industrial crops | 2131 | 16,357 | 11.53 | 88.47 | 4534 | 12,598 | 26.46 | 73.54 |
| Vegetables | 2801 | 49,401 | 5.37 | 94.71 | 15,499 | 42,705 | 26.63 | 73.37 |
| Forage crops | 2468 | 31,532 | 7.26 | 92.74 | 4389 | 29,611 | 12.91 | 87.09 |
| Fruit | 1574 | 11,426 | 12.11 | 87.89 | 5908 | 7092 | 45.45 | 54.55 |
| Grape | 5045 | 19,999 | 20.14 | 79.86 | 8467 | 12,845 | 39.73 | 60.27 |
| Other | 551 | 198,164 | 0.28 | 99.72 | 5912 | 187,250 | 3.06 | 96.94 |
| Total | 20,740 | 524,709 | 69,070 | 451,018 | ||||
Table 5.
Changes in output and water use of agriculture and other sectors due to different climate change scenarios.
Table 5.
Changes in output and water use of agriculture and other sectors due to different climate change scenarios.
| Sector | 2005 | Output Change (%) | Change in Water Use (Mill. m3) | ||||||
|---|---|---|---|---|---|---|---|---|---|
| Output (Mill. Euros) | Water Use (Mill. m3) | Low | Medium | High | Low | Medium | High | ||
| 1 | Cereals | 103.79 | 26.11 | −3.41 | −10.65 | −20.49 | −0.89 | −2.78 | −5.35 |
| 2 | Rice | 7.93 | 14.07 | 0.01 | −0.11 | −0.21 | 0.02 | 0.00 | −0.03 |
| 3 | Raw tobacco | 67.63 | 11.27 | 0.00 | 0.00 | 0.00 | 0.00 | 0.00 | 0.00 |
| 4 | Vegetables | 276.68 | 41.98 | 0.25 | −1.34 | −3.47 | 0.11 | −0.56 | −1.46 |
| 5 | Fruits | 60.62 | 23.65 | 0.33 | −11.28 | −16.34 | 0.08 | −2.67 | −3.87 |
| 6 | Grapes and wine | 89.53 | 49.82 | −0.69 | −26.49 | −47.38 | −0.35 | −13.20 | −23.61 |
| 7 | Other crops | 53.95 | 43.73 | 38.12 | −2.22 | −10.28 | 16.68 | −0.97 | −4.50 |
| 8 | Cattle | 122.83 | 25.59 | 0.01 | −0.05 | −0.09 | 0.00 | −0.01 | −0.02 |
| 9 | Pigs | 43.85 | 5.02 | 0.00 | −0.06 | −0.10 | 0.00 | 0.00 | 0.00 |
| 10 | Sheep/lamb | 32.60 | 11.04 | 0.00 | −0.03 | −0.05 | 0.00 | 0.00 | −0.01 |
| 11 | Other livestock | 45.71 | 2.81 | 0.00 | −0.04 | −0.08 | 0.00 | 0.00 | 0.00 |
| 12 | Forestry | 24.26 | 0.00 | 0.00 | −0.01 | −0.01 | 0.00 | 0.00 | 0.00 |
| 13 | Fishing activities | 1.17 | 0.00 | 0.03 | −0.04 | −0.08 | 0.00 | 0.00 | 0.00 |
| 14 | Mining and quarrying | 94.42 | 161.32 | 0.02 | −0.07 | −0.14 | 0.04 | −0.11 | −0.22 |
| 15 | Other mining | 59.17 | 26.43 | 0.01 | −0.08 | −0.15 | 0.00 | −0.02 | −0.04 |
| 16 | Food and beverages | 503.27 | 103.37 | 0.01 | −0.14 | −0.26 | 0.01 | −0.14 | −0.26 |
| 17 | Tobacco products | 145.93 | 0.40 | 0.00 | 0.00 | 0.00 | 0.00 | 0.00 | 0.00 |
| 18 | Textiles | 48.57 | 0.45 | 0.00 | 0.00 | 0.00 | 0.00 | 0.00 | 0.00 |
| 19 | Wearing apparel; furs | 439.43 | 0.97 | 0.00 | 0.00 | 0.00 | 0.00 | 0.00 | 0.00 |
| 20 | Leather products | 46.78 | 0.04 | 0.00 | 0.00 | 0.00 | 0.00 | 0.00 | 0.00 |
| 21 | Wood products | 27.22 | 2.20 | 0.01 | −0.03 | −0.05 | 0.00 | 0.00 | 0.00 |
| 22 | Pulp, paper products | 83.82 | 0.08 | 0.05 | −0.08 | −0.16 | 0.00 | 0.00 | 0.00 |
| 23 | Printed matter | 17.20 | 0.29 | 0.02 | −0.08 | −0.14 | 0.00 | 0.00 | 0.00 |
| 24 | Refined petroleum | 361.67 | 0.28 | 0.40 | −1.16 | −2.18 | 0.00 | 0.00 | −0.01 |
| 25 | Chemicals | 94.08 | 4.71 | 0.03 | −0.95 | −1.78 | 0.00 | −0.04 | −0.08 |
| 26 | Rubber and plastic | 70.05 | 0.07 | 0.04 | −0.38 | −0.66 | 0.00 | 0.00 | 0.00 |
| 27 | Other mineral prod. | 106.89 | 1.46 | 0.02 | −0.06 | −0.12 | 0.00 | 0.00 | 0.00 |
| 28 | Basic metals | 490.05 | 68.13 | 0.00 | 0.00 | −0.01 | 0.00 | 0.00 | 0.00 |
| 29 | Fabricated metal | 68.80 | 0.09 | 0.03 | −0.04 | −0.08 | 0.00 | 0.00 | 0.00 |
| 30 | Machinery | 34.42 | 4.52 | 0.15 | −0.58 | −1.06 | 0.01 | −0.03 | −0.05 |
| 31 | Electrical machinery | 83.85 | 42.81 | 0.02 | −0.04 | −0.07 | 0.01 | −0.02 | −0.03 |
| 32 | Medical instruments | 6.50 | 0.01 | 0.00 | 0.00 | −0.01 | 0.00 | 0.00 | 0.00 |
| 33 | Motor vehicles | 29.51 | 0.17 | 0.01 | −0.02 | −0.04 | 0.00 | 0.00 | 0.00 |
| 34 | Other transport | 10.72 | 0.13 | 0.00 | 0.00 | 0.00 | 0.00 | 0.00 | 0.00 |
| 35 | Furniture | 28.98 | 0.31 | 0.03 | −0.04 | −0.08 | 0.00 | 0.00 | 0.00 |
| 36 | Secondary materials | 11.12 | 0.002 | 0.00 | −0.01 | −0.02 | 0.00 | 0.00 | 0.00 |
| 37 | Electrical energy | 236.37 | 1.00 | 0.06 | −0.16 | −0.35 | 0.00 | 0.00 | 0.00 |
| 38 | Collected water | 43.07 | 0.00 | 0.01 | −0.03 | −0.06 | 0.00 | 0.00 | 0.00 |
| 39 | Construction work | 689.53 | 1.00 | 0.00 | −0.01 | −0.03 | 0.00 | 0.00 | 0.00 |
| 40 | Other services | 4127.02 | 8.40 | 0.05 | −0.08 | −0.15 | 0.00 | −0.01 | −0.01 |
| Total | 683.78 | 15.71 | −20.57 | −39.56 | |||||
Note: Mill. = million; Bold indicates the five fixed sectors in the mixed model approach or the direct supply-driven shock for the vulnerable crops. The absolute variation in water use was obtained using the derived water coefficients for each sector [37] which were assumed to be the same over the years, i.e., water use/output = direct water coefficient. Therefore, by knowing the change in output, the absolute change in water use is: i.e., direct water coefficient × output variation = water use variation.
Table 6.
Impacts of capital investment in irrigation equipment on agriculture sub-sectors and other sectors of the Macedonian economy.
Table 6.
Impacts of capital investment in irrigation equipment on agriculture sub-sectors and other sectors of the Macedonian economy.
| Sector | Output Change (%) | Change in Water Consumption (Million m3) | |
|---|---|---|---|
| 1 | Cereals | 28.81 | 7.52 |
| 2 | Rice | 19.03 | 2.68 |
| 3 | Raw tobacco | 24.92 | 2.81 |
| 4 | Vegetables | 24.78 | 10.40 |
| 5 | Fruits | 16.60 | 3.92 |
| 6 | Grapes and wine | 9.91 | 4.94 |
| 7 | Other crops | 39.29 | 17.18 |
| 8 | Cattle | 0.16 | 0.04 |
| 9 | Pigs | 0.18 | 0.01 |
| 10 | Sheep/lamb | 0.09 | 0.01 |
| 11 | Other livestock | 0.13 | 0.00 |
| 12 | Forestry. logging | 0.03 | 0.00 |
| 13 | Fishing activities | 0.13 | 0.00 |
| 14 | Mining and quarrying | 0.67 | 1.08 |
| 15 | Other mining | 0.27 | 0.07 |
| 16 | Food and beverages | 0.44 | 0.46 |
| 17 | Tobacco products | 0.00 | 0.00 |
| 18 | Textiles | 0.00 | 0.00 |
| 19 | Wearing apparel; furs | 0.00 | 0.00 |
| 20 | Leather products | 0.00 | 0.00 |
| 21 | Wood products | 0.09 | 0.00 |
| 22 | Pulp, paper products | 0.28 | 0.00 |
| 23 | Printed matter | 0.21 | 0.00 |
| 24 | Refined petroleum | 3.44 | 0.01 |
| 25 | Chemicals | 3.26 | 0.15 |
| 26 | Rubber and plastic | 0.74 | 0.00 |
| 27 | Other mineral products | 0.17 | 0.00 |
| 28 | Basic metals | 0.01 | 0.01 |
| 29 | Fabricated metal | 0.13 | 0.00 |
| 30 | Machinery | 1.62 | 0.07 |
| 31 | Electrical machinery | 0.31 | 0.13 |
| 32 | Medical instruments | 0.01 | 0.00 |
| 33 | Motor vehicles | 0.07 | 0.00 |
| 34 | Other transport | 0.00 | 0.00 |
| 35 | Furniture | 0.12 | 0.00 |
| 36 | Secondary materials | 0.03 | 0.00 |
| 37 | Electrical energy | 1.84 | 0.02 |
| 38 | Collected water | 0.13 | 0.00 |
| 39 | Construction work | 0.00 | 0.00 |
| 40 | Other services | 0.25 | 0.02 |
| Total | 51.55 |
© 2017 by the author. Licensee MDPI, Basel, Switzerland. This article is an open access article distributed under the terms and conditions of the Creative Commons Attribution (CC BY) license (http://creativecommons.org/licenses/by/4.0/).
Share and Cite
MDPI and ACS Style
Hristov, J. An Exploratory Analysis of the Impact of Climate Change on Macedonian Agriculture. Environments 2018, 5, 3. https://doi.org/10.3390/environments5010003
AMA Style
Hristov J. An Exploratory Analysis of the Impact of Climate Change on Macedonian Agriculture. Environments. 2018; 5(1):3. https://doi.org/10.3390/environments5010003
Chicago/Turabian StyleHristov, Jordan. 2018. "An Exploratory Analysis of the Impact of Climate Change on Macedonian Agriculture" Environments 5, no. 1: 3. https://doi.org/10.3390/environments5010003
Note that from the first issue of 2016, this journal uses article numbers instead of page numbers. See further details here.