Riverine Water Quality Response to Precipitation and Its Change


1
Civil Engineering, Schulich School of Engineering, University of Calgary, Calgary, AB T2N 1N4, Canada
2
Geomatics Engineering, Schulich School of Engineering, University of Calgary, Calgary, AB T2N 1N4, Canada
*
Author to whom correspondence should be addressed.
Environments 2018, 5(1), 8; https://doi.org/10.3390/environments5010008
Submission received: 24 November 2017
/
Revised: 29 December 2017
/
Accepted: 30 December 2017
/
Published: 2 January 2018
(This article belongs to the Special Issue Environmental Risk and Climate Change)
Abstract
:Surface waters are prone to the influences from both natural condition and anthropogenic activities. The aim of this paper was to study the impacts of one natural variable, precipitation, and its change posed by a changing climate on water quality of three rivers in Alberta, Canada. Eleven water quality parameters monitored during the time period of 1988–2014 were used to investigate the impact of precipitation. The results showed the significant dependence of most water quality parameters as well as river flow on the cumulative antecedent precipitation. Water quality parameters however had different associations with precipitation; and thus they would respond to climate change qualitatively and quantitatively differently in the rivers and at the stations of each river. In general, some water quality parameters such as turbidity and total phosphorus would increase; whereas other parameters would decrease or show no appreciable change under the projected increase of precipitation under the median climate change scenario for the river basins. On all three rivers, the maximum increase (17.20%) and decrease (−1.53%) were projected for turbidity and chloride, respectively, in the 2050s; while the maximum increase (29.68%) and decrease (−2.45%) were calculated for turbidity and chloride, respectively, in the 2080s. The results imply the need to manage riverine water quality considering precipitation and its change under a changing climate.
1. Introduction
Surface waters are one of the major sources for human and animal usage and their quality depends on many factors which are either natural or anthropogenic in nature. The impact of anthropogenic activities on water quality has been studied extensively in the literature [1,2,3]. Many previous studies have suggested the ways to improve water quality by mitigating pollutant loading from point sources, which are primarily produced from anthropogenic activities. One example of the effective ways is to enhance sewage treatment efficiency. However, the temporal variations and changes of natural factors such as meteorological and hydrological conditions, which are usually beyond human control, also induce variations and changes in water quality of receiving water bodies such as rivers. Several studies have investigated the potential impact of climate change on water quality in rivers under projected climate scenarios [4,5,6]. These works concluded that climate change has both a direct and indirect effect on the quality of surface waters. For instance, the increase of temperature that is the direct consequence of climate change would affect chemical reactions [7]. Many studies [8,9] have focused on the impact of increasing temperature on water quality.
Surface runoff, which is one of the important components of the hydrologic cycle, is the important water source of many rivers, the primary driver of river hydrodynamics as well as the carrier of a variety of pollutants into receiving water bodies [10,11]. Precipitation, which produces surface runoff, undoubtedly affects water quantity and consequently water quality indirectly. Many studies have demonstrated the increase of concentrations and/or loadings of various pollutants including total suspended solids (TSS), nutrients, and microorganisms (e.g., E. coli and pathogens) during storm events and extensive rainfalls [12,13,14,15,16]. The linkage between water quality and precipitation is more prominent in heavy rainfalls. For instance, the studies conducted by Rueda et al. [17] and Chorus and Bartram [18] demonstrated that heavy rainfall events can contribute to up to 80% and 400% of the average annual input of nitrogen and phosphorus, respectively, into water bodies. Clark et al. [19] showed that from 36% to more than 50% of annual dissolved organic carbon (DOC) export occurs during high-intensity rainfall events. Heavy rainfalls, especially after a long dry period which allows more pollutants accumulated in runoff pathways and available for transport by runoff, could wash-off a lot of pollutants into rivers [15]. The detrimental effects of elevated water quality concentrations resulted from extreme precipitation have also been well documented in the literature. The flooding caused by the extreme precipitation was blamed to lead to fish kills for example in the Elbe River, Germany, in 2002 as surface runoff generated from the extreme precipitation washed off a large amount of nutrients into the river [20]. To avoid or reduce the elevation of water quality concentrations, Eghball et al. [21], who investigated the effect of the long-term manure application on nitrogen and phosphorus in surface waters, recommended that the application of manure and fertilizer should be avoided if the chance of rainfall event immediately after their application is high.
Under a changing climate, changes in precipitation magnitude and pattern are and will be continuously occurring. Many existing studies have examined climate change impact on water quality through using the future precipitation scenarios, which often demonstrate the increase in precipitation magnitude as well as the occurrence of extreme events such as floods and droughts in a changing climate [6,7,22]. The existing studies have used the future climate scenarios projected by different general circulation models (GCMs) under different emission scenarios to study the potential impacts of climate change on water quantity and quality [6,7,22,23,24,25,26] and the results have emphasized the possible consequences of a changing climate in water resources. Changes in surface runoff and thus river hydrodynamics under a changing climate have also demonstrated to result in the changes in the transport of a variety of pollutants into water bodies and consequently water quality [7,27,28,29]. Furthermore a study by Fan and Shibata [6] stated that the impact of climate change on water quality is more prominent than that of land-use change.
In the view above, the observed and projected linkage between precipitation and water quality prompts the need and also argues the importance to consider meteorological conditions especially precipitation when managing riverine water quality. Although these have been investigated in the literature, due to the fact of the geography and site-specific nature of water quality and its management the objectives of this paper were therefore to: (1) investigate the relationship between flow and precipitation; (2) examine water quality under different magnitudes of precipitation aiming to shed light on the possibility to manage riverine water quality based upon precipitation information which is easily and feasibly obtained; (3) project the potential changes in water quality under projected future climate scenarios, in three major rivers situated in Alberta, Canada.
2. Materials and Methods
2.1. Study Area
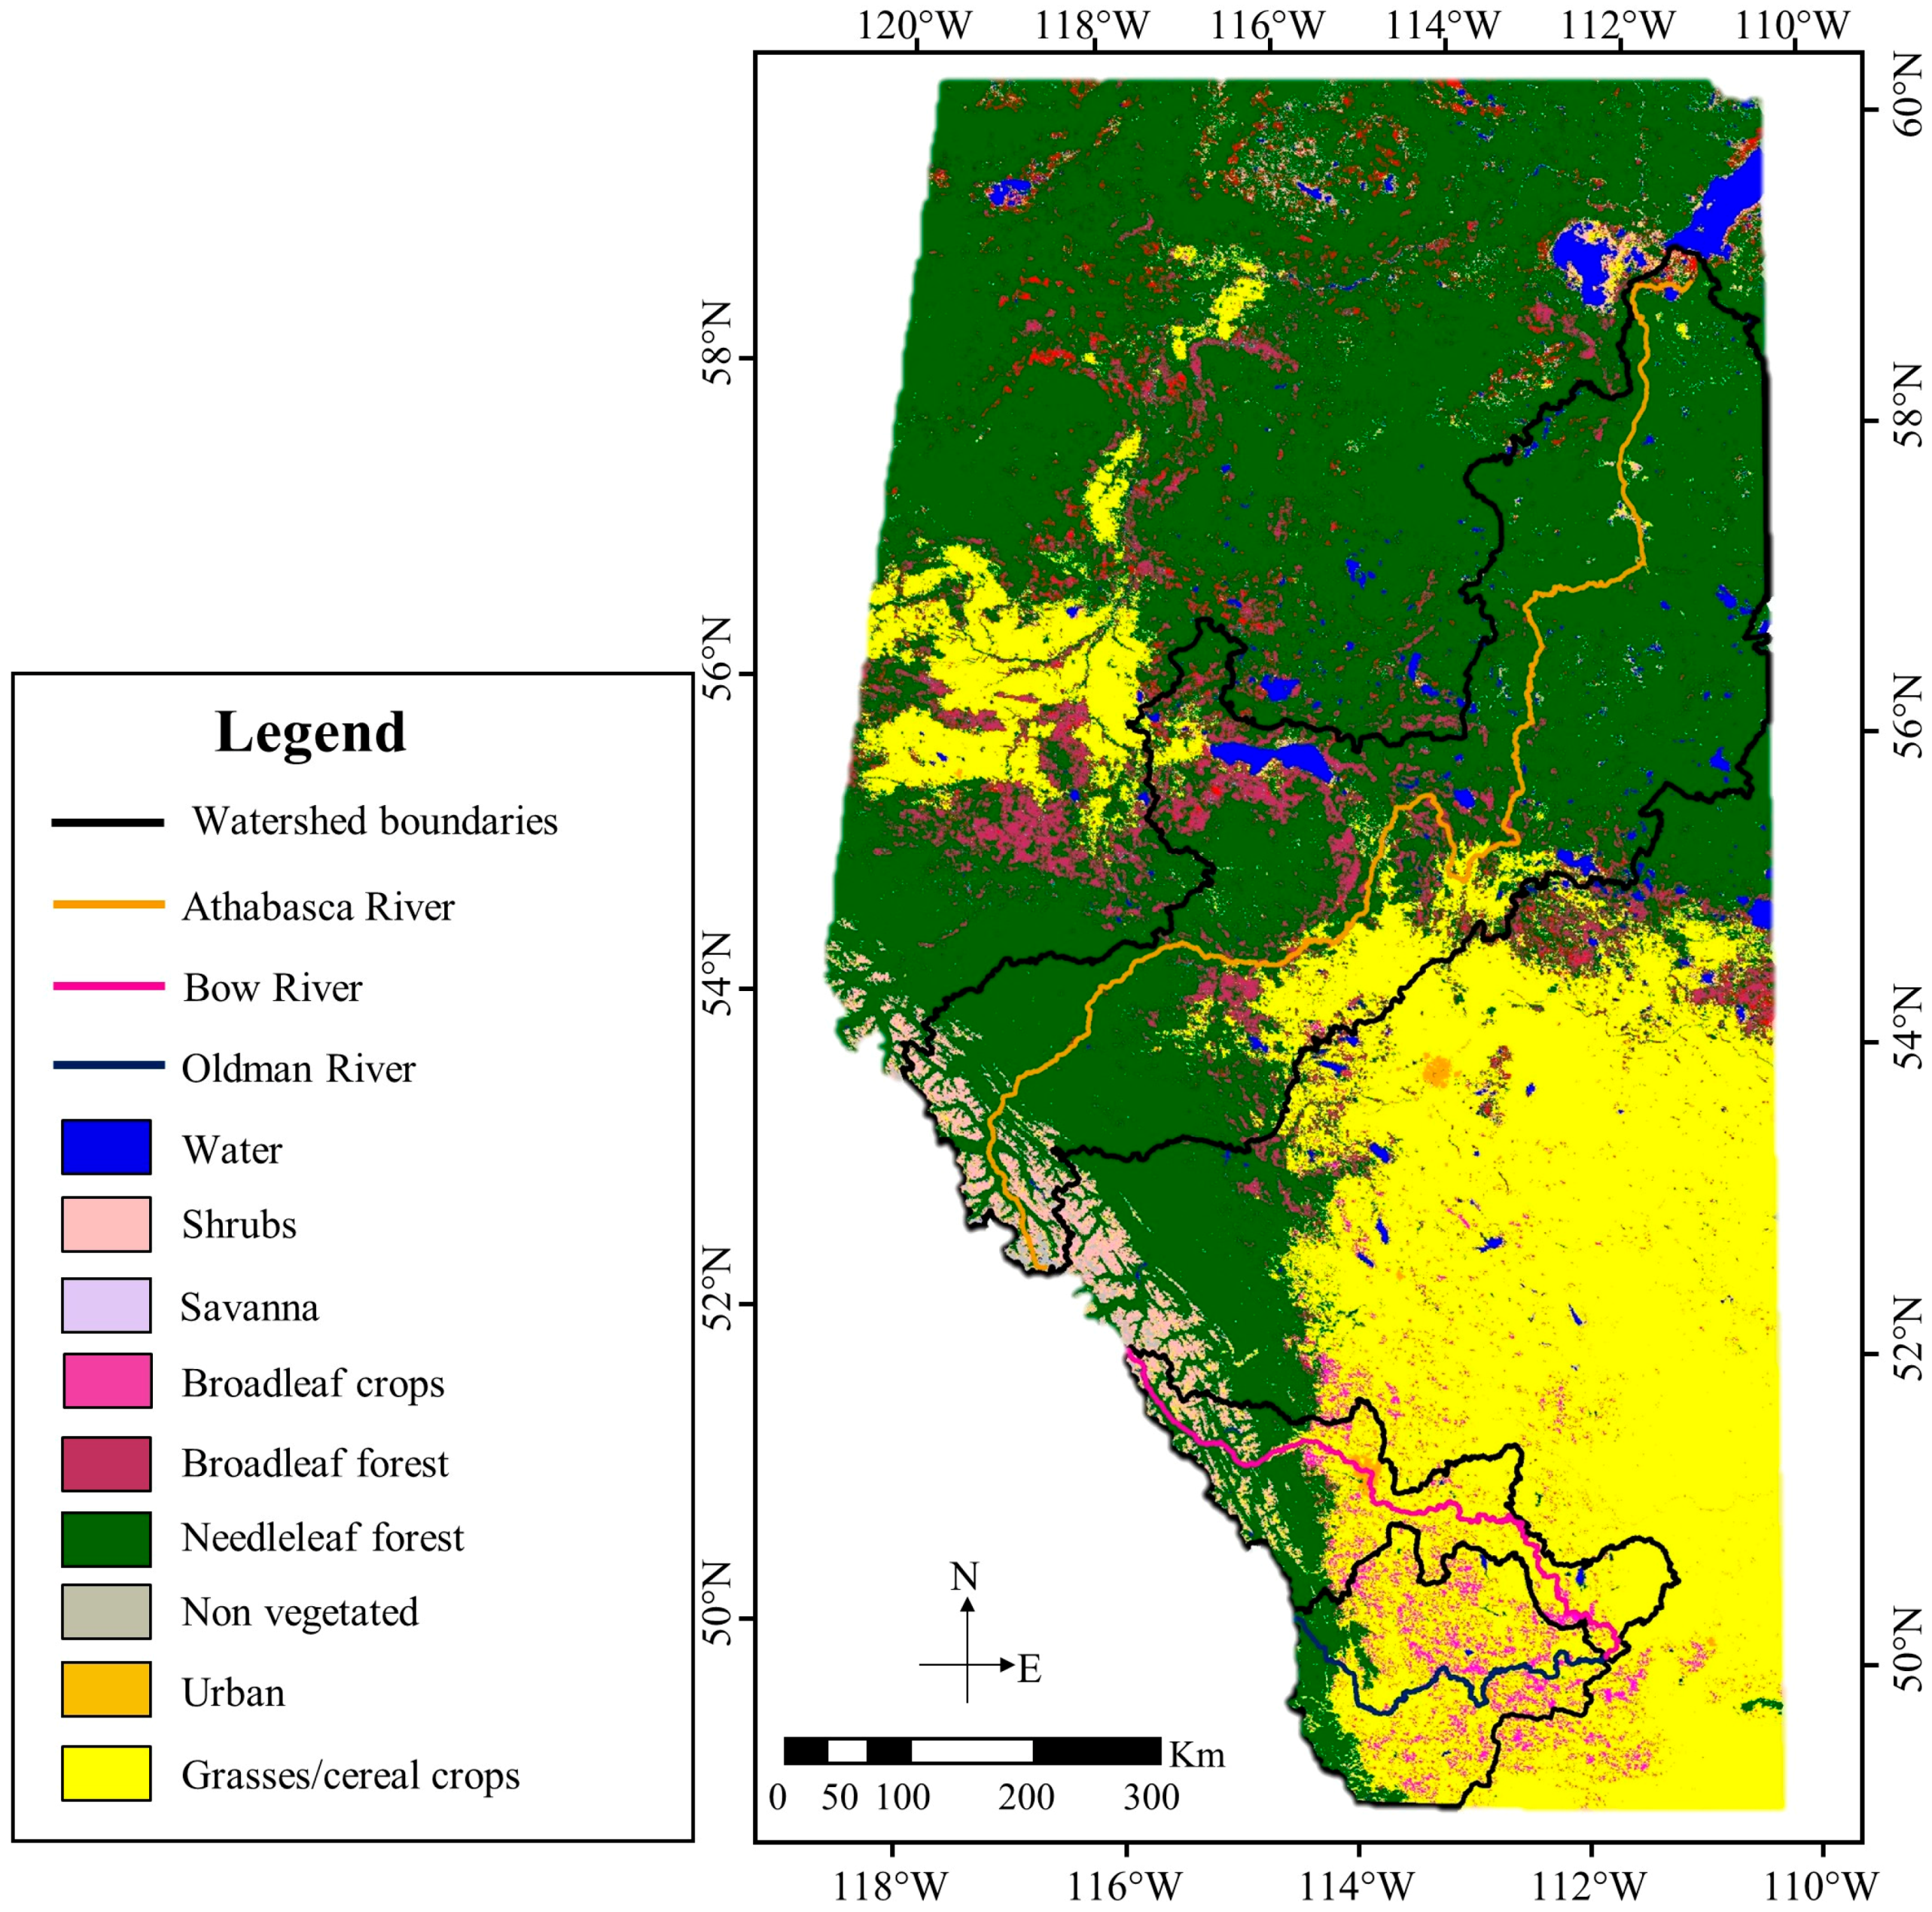
Three rivers including the Athabasca, Bow, and Oldman Rivers situated in Alberta, Canada were chosen for this paper. Alberta is located in western Canadian prairies and has a semi-arid climate due to its location in the rain shadow of the Rocky Mountains. As the climate of Alberta demonstrates a large variation, different precipitation patterns are observed from 6 different regions including northern Alberta Boreal forest occupying 48% of the province, Foothills (15%), southern Alberta grasslands (14%), central Aspen Parklands (12%), the Rocky Mountains (8%) and the Canadian Shield (3%). The Rocky Mountains situated on the west side of the province has the highest mean annual precipitation of 798 mm and the grasslands primarily in the east side of the province receive the least annual precipitation (average of 374 mm) [30]. Alberta has cold winters with the average daytime temperature of −10 °C in the south and −24 °C in the north, while average summer temperature is +13 °C in the Rocky Mountains and +18 °C from the dry prairie to the south-east. The major municipalities in the province are the Cities of Calgary and Edmonton, which are located in the southern and central parts of the province, respectively. The oil sand industry is concentrated in the central part of the province and most of the agricultural activities occur in the southern area.
The Athabasca River with a basin area of 95,300 in the central and northern Alberta (Figure 1) is the second largest river in the province. The Athabasca River originates from the Rocky Mountains passing through mountainous areas, agricultural plains, boreal forests, wetlands, and small urban centers and reaches to the Lake Athabasca after a 1538 km path. Oil sand industry is concentrated in the watershed of Athabasca River. The Bow and Oldman Rivers are situated in the southern part of the province (Figure 1) and their river basins are 26,200 and 28,000 , respectively. Both of the Bow and Oldman Rivers flow passing through mountains, foothills, and prairies and join the South Saskatchewan River in the end while the Bow River originates from the Rocky Mountains and the Oldman River originates from a small lake near the mountains. Urbanization has been occurring in the midstream river basin of the Bow River, in which the City of Calgary, the most populated city of the province, is situated in. The agricultural activities occur mainly in the downstream river basin of the Bow River and the major part of the Oldman River basin where many field crops including grains, oil seed, pulse, sugar beets, and potatoes are cultivated. Besides, there is also developed cattle feedlot industry located in the north of Lethbridge in the river basin of the Oldman River.
2.2. Water Quality, Flow, and Precipitation Data
Monthly water quality data during the time period of 1988–2014 were collected from Alberta Environment and Parks. Considering the data availability, two water quality stations (AB07BE0010 and AB07CC0030) situated in the midstream and downstream of the Athabasca River, three water quality stations (AB05BH0010, AB05BM0010, and AB05BN0010) in the upstream, midstream, and downstream of the Bow River, and three stations (AB05AB0070, AB05AD0010, and AB05AG0010) in the upstream, midstream, and downstream of the Oldman River were chosen. This paper did not intend to target specific water quality parameters, thus a total of eleven water quality parameters including chlorophyll-a (Chl-a), water temperature (WT), dissolved oxygen (DO), turbidity (TURB), DOC, total phosphorus (TP), total nitrogen (TN), pH, chloride (Cl−), sulphate () and specific conductance (SC), whose data are available, were studied. The daily flow data were collected from the Water Survey of Canada. The flow gauge stations used are in close proximity to the water quality stations on the rivers. These flow gauge stations include two flow gauge stations (07BE001 and 07DA001) on the Athabasca River, and three gauge stations (05BH008, 05BM002 and 05BN012) on the Bow River, and three gauge stations (05AA024, 05AD007 and 05AG006) on the Oldman River. The locations of the water quality monitoring stations and flow gauge stations are also indicated in Figure 1.
Due to the fact that precipitation is not uniformly distributed over a river basin, the average areal precipitation (AAP), which takes into account of the spatial distribution of precipitation, was used. In this paper, two forms of AAP, namely the antecedent AAP and the cumulative antecedent AAP, were considered when investigating the associations of flow and water quality with precipitation, as these two precipitation metrics have been often used in the literature [12,13,14,15,16]. The antecedent AAP is the AAP on a designated antecedent day, while the cumulative antecedent AAP is the sum of AAPs from the current day to a designated antecedent day. The precipitation data provided by Alberta Agriculture and Forestry were used to calculate the AAP for the watershed corresponding to each studied water quality station using the formula below. The data source provides long-term meteorological data at a spatial resolution of 10 km × 10 km. At the center of each grid, precipitation data is derived by interpolating of nearby meteorological stations of Environment Canada, Alberta Environment and Parks, and Alberta Agriculture and Forestry using inverse distance weighted interpolation procedure. The observed field data from meteorological stations within 60 km radius or a maximum of eight closest stations, all of which are within 60 km radius, are used in the interpolation. Note that the closest meteorological station is used if no stations are located within 60 km radius of a grid center. The watershed corresponding to each water quality station was delineated using the Digital Elevation Model map having a resolution of 10 m.
where and denote the precipitation and area of each grid, respectively.
It has been well acknowledged that there is a significant amount of uncertainty in the projected future climate scenarios. A variety of GCMs have produced different climate projections especially for precipitation given the same greenhouse gases emission scenario. The precipitation projections used in a previous work by Barrow and Yu [31], who studied the future climate scenarios for Alberta, were applied. This work quantified the variations of the projected future precipitation scenarios for the 2020s (2010–2039), 2050s (2040–2069) and 2080s (2070–2099) in the range from −10% to +15% relative to the baseline time period of 1961–1990 in Alberta; while it also suggested that the HadCM3 climate model under the B2 emission scenario yielded the median future climate scenario. The quantification of the uncertainty in the projected future precipitation and thus the uncertainty in the projected water quality for the three rivers is beyond the scope of this paper. Therefore, the median future precipitation scenarios in the 2050s and 2080s produced by the HadCM3 under the B2 emission scenario were used herein. The future precipitation projection by the HadCM3, which has a resolution of 200 × 200 km2, was downloaded from the grids overlapping the watersheds. The average annual precipitation projected was calculated using the projections of the grids and then used to quantify the changes relative to the baseline time period. In this paper, water quality data collected during the time period of 1988–2014 were used, thus this time period was used as the baseline time period. The change percentages of average annual precipitation relative to the baseline time periods of 1961–1990 and 1988–2014 are presented in Table 1 for the Athabasca, Bow, and Oldman River basins, respectively. The change percentages relative to the time period of 1988–2014 were calculated using linear interpolation.
2.3. Analysis Methods
The conventional correlation analysis was adopted to investigate the associations between flow and precipitation and between water quality and precipitation at each water quality station. The exploration of their associations in historical observations would help in identifying whether precipitation is an appropriate explanatory variable to predict riverine water quality and subsequently to project it under a changing climate. There is baseflow on the three study rivers. The baseflow is considered insignificant at all downstream flow gauge stations according to hydrographs at these stations (not shown). Although the baseflow at the upstream and midstream flow gauge stations is more significant compared to that at the downstream stations, the inclusion of baseflow does not largely affect the correlation between flow and precipitation as baseflow at all stations appears to be more or less constant. Furthermore, precipitation data were classified into three categories, each of which corresponds to low, medium and high magnitudes of precipitation, respectively. The 50th and 90th percentiles of precipitation were used as the cut-offs. To demonstrate the potential climate change impact on riverine water quality, the Kruskal-Wallis (KW) test was also employed to statistically analyze whether the level of riverine water quality in terms of the median is different among the above three precipitation magnitudes in historical observations. The KW test is a non-parametric method, which is preferable when the requirement on the normal distribution of datasets is violated for using parametric statistical analysis. Riverine water quality datasets often do not follow the normal distribution. The statistical analyses were performed at a significance level of 5%.
To investigate climate change impact on water quality, quantitative models describing the dependence of water quality concentrations on precipitation were developed using regression analysis. In the regression analysis, the best candidate model was selected from various functions of precipitation including linear, exponential, polynomial, and logarithmic functions. The model, which produced the highest coefficient of determination (), was selected and applied to project water quality concentrations under a changing climate. The use of R2 to determine the optimal models for conducting projection was mainly due to the facts that water quality data are in different magnitudes, some of them present large variation, and many model performance evaluation metrics (e.g., root mean square error and mean absolute error) are dependent on the magnitudes of data. The estimation of climate change impact on water quality was made using the regression models developed based upon historical data assuming the dependence of water quality on precipitation obtained in the historical time period is still valid in the future, which is the common assumption adopted when studying climate change impact on water resources. In the literature, two approaches (the statistical downscaling and the delta change or the climate change factor) have been commonly used to generate future climate scenarios to study climate change impact. Comparing these two approaches, the statistical downscaling is more complex but not superior to the intuitive delta change method [32,33]. Therefore, the delta change method was adopted to estimate the future precipitation used in the models.
3. Results and Discussions
3.1. The Dependence of Flow on Precipitation
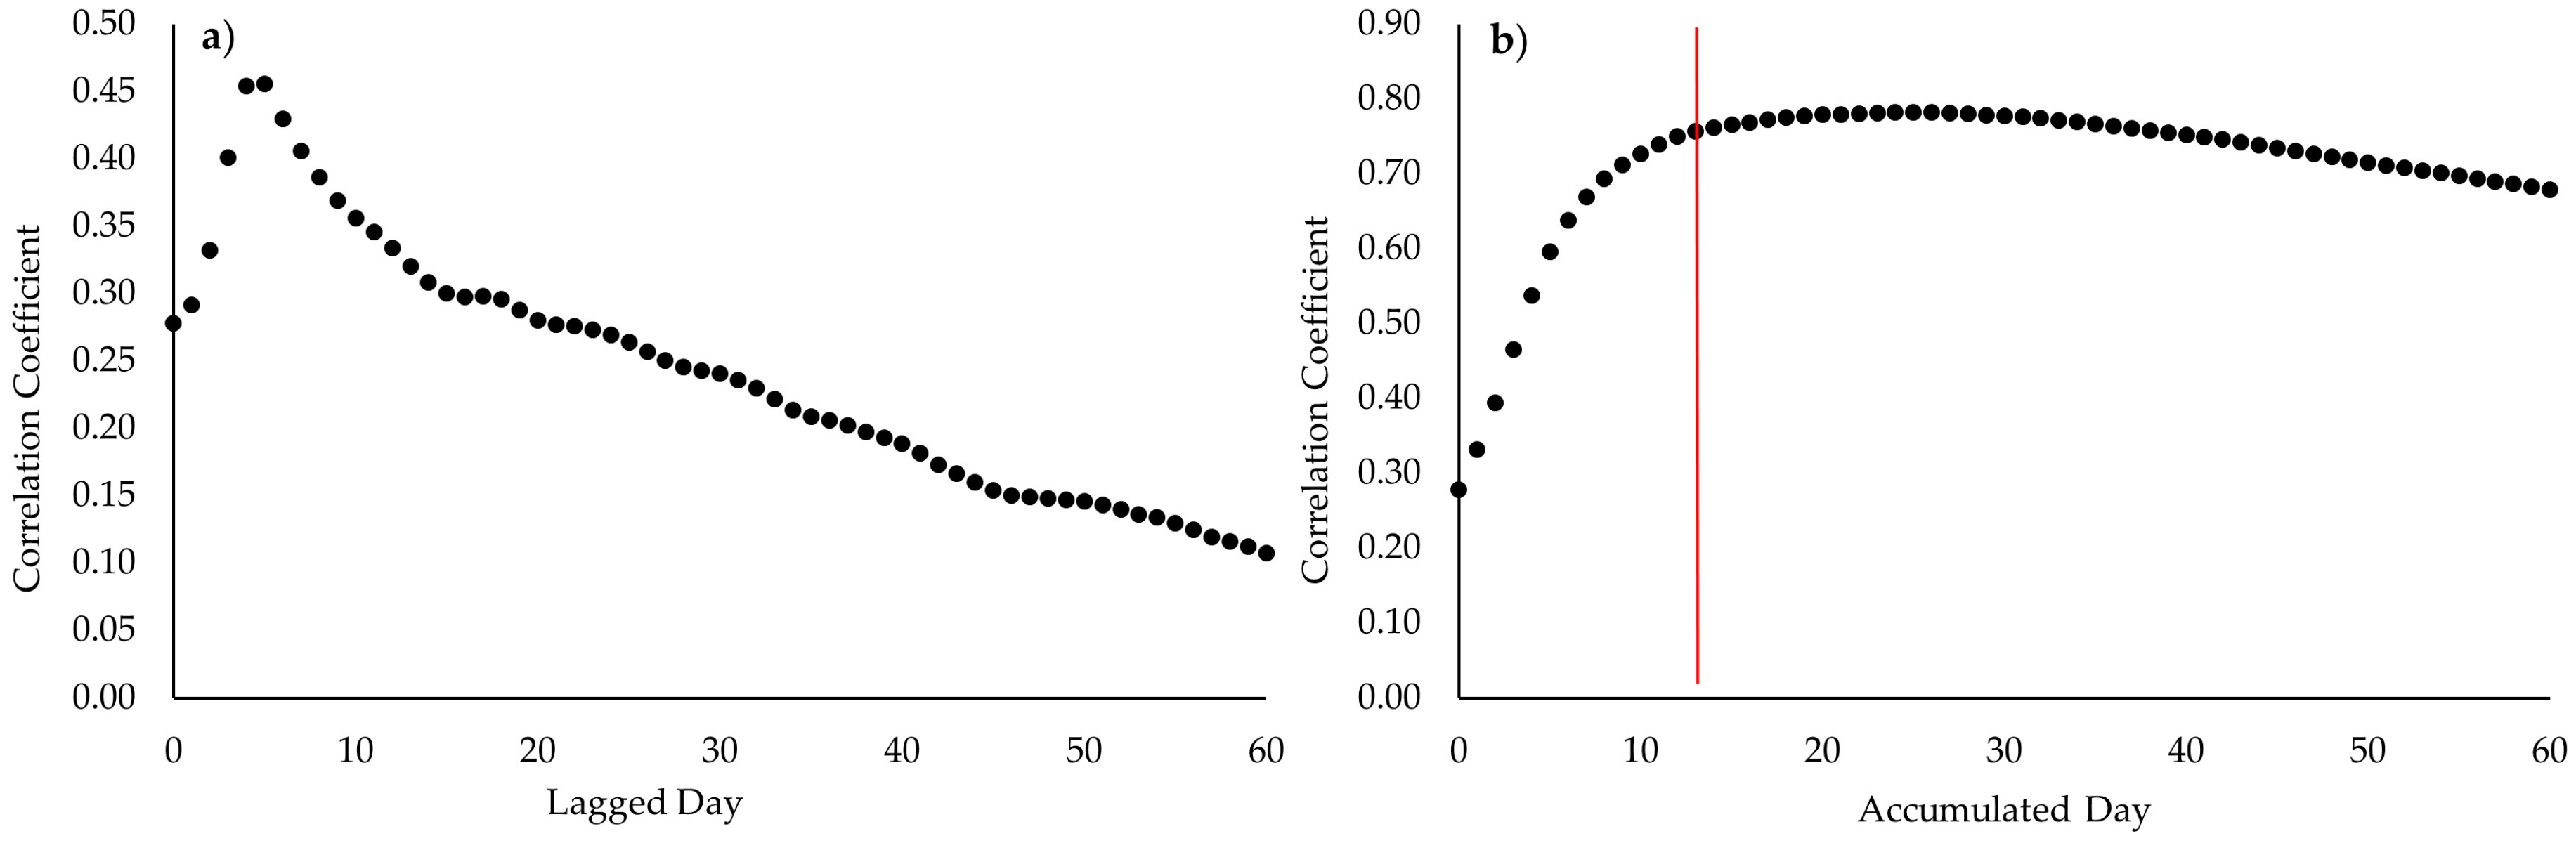
The daily flow was correlated with the antecedent AAP and the cumulative antecedent AAP up to 60 days. Table 2 presents the optimal lagged day and cumulative day determined according to the calculated correlation coefficients between the antecedent AAP and flow and between the cumulative antecedent AAP and flow at all stations on the three rivers. Figure 2 shows the plots of the calculated correlation coefficients versus the lagged day and the cumulative day for the antecedent AAP and the cumulative antecedent AAP, respectively, at the midstream station (07BE001) of the Athabasca River as an example. The optimal 5 lagged day, at which the highest correlation coefficient was calculated, was determined for the antecedent AAP; while the optimal 14 cumulative day was determined for the cumulative antecedent AAP as the increment at the next accumulated day (here 15 cumulative day) was less than 0.01.
The results shown in Table 2 demonstrate that the identified optimal lagged day and optimal cumulative day are different from station to station and from watershed to watershed. It has been well acknowledged that catchment characteristics including the physical (e.g., area, topography, and geometry) and hydrological (e.g., roughness) characteristics affect the lag time between rainfall and streamflow. In addition, the correlation of flow and the cumulative antecedent AAP appeared to be always stronger than those of flow and the antecedent AAP. This result aligns with the fact that the antecedent soil moisture condition of a catchment can largely affect its hydrologic response, e.g., runoff volume generated from a storm event. The cumulative antecedent precipitation is, of course, a better indicator of the antecedent soil moisture condition. These results show that the inclusion of the cumulative antecedent precipitation as one explanatory variable in hydrological modeling can enhance the prediction and forecasting of river flow.
In general, the increase of the watershed area leads to the increases of the lag time (here the optimal lagged day) as well as the time of concertation. On these three rivers, the increase of the optimal lagged day along the rivers was observed; although the same lagged days were calculated at the upstream and midstream stations on both the Bow and the Oldman Rivers. The river reach between 05BH008 (upstream station) and 05BM002 (midstream station) on the Bow River is 292 km; while the river reach is 189 km long between the 05AA024 (upstream station) and 05AD007 (midstream station) on the Oldman River. For example, the average velocity measured in the Calgary reach (middle reach of the Bow River) in October of 2010 is approximately 1 m/s; whereas the velocity can be up to 7 m/s during high flows (e.g., during 2013 flooding) on the Bow River. Therefore, the traveling time between the upstream and midstream stations might not lead to the obvious difference in the optimal lagged days identified at these two stations on the Bow and Oldman Rivers especially during high flows. Similar results were also obtained for the optimal cumulative day in general, namely the optimal cumulative day increased along the rivers except the Bow River. The longest optimal cumulative day was identified at the upstream station (05BH008) on the Bow River. Note that the correlation coefficient of the daily flow and the cumulative antecedent APP continuously increased with the increase of the cumulative day (up to 60 days) at this station (result not shown), which is different from all other stations on the three rivers. Besides watershed size, the optimal cumulative day is also expected to be associated with the land use and cover, soil characteristics, and hydraulic connection of the river basin. According to the hydrographs at the three flow gauge stations on the Bow River (not shown), significant increases in flows during most baseflow period at these three stations and non-baseflow period between the upstream and downstream stations were not observed. It is speculated that the complex hydraulic connections between the upper and lower parts of the river basin might result in the observed hydrologic behavior at these three stations. However, further investigation is required to confirm this explanation.
3.2. The Dependence of Water Quality on Precipitation
It has been shown that flow is one of the primary variables contributing to the variation of water quality in water bodies in the literature [7,34,35]. In addition, as shown above significant and strong correlation (correlation coefficient > 0.50) was observed between the daily flow and the cumulative antecedent AAP within the optimal cumulative day (called optimal cumulative AAP) (Table 2). The dependence of river flow on precipitation varies among rivers as well as locations on a river. Different ranges of correlation coefficient have been reported in the literature but several studies [36,37] have reported and argued strong dependence between precipitation and river flow when the correlation coefficient is approximately above 0.50. The calculated correlation coefficient (>0.50) on the three rivers was considered to indicate strong dependence between flow and precipitation. Therefore, the optimal cumulative AAP was used to investigate the dependence of water quality and precipitation in this paper. Water quality and precipitation are often measured at different frequencies. Water quality of the three rivers has been monitored at an approximately monthly frequency; whereas daily precipitation data are available. The calculated correlation coefficients between water quality and the optimal cumulative AAP, which is the sum of precipitation from water quality sampling dates to the designated antecedent day (namely the identified optimal cumulative day), are presented in Table 3, Table 4 and Table 5 at all stations on the Athabasca, Bow, and Oldman Rivers, respectively. In addition, the calculated correlation coefficients between the water quality concentrations and the antecedent AAP on the optimal lagged day (called optimal antecedent AAP) were also illustrated in Table 3, Table 4 and Table 5.
As illustrated in Table 3, Table 4 and Table 5, concentrations of most water quality parameters generally demonstrated a stronger dependence on the optimal cumulative AAP than on the optimal antecedent AAP. This result might be explained by the result obtained previously that the dependence of the daily flow on the cumulative antecedent AAP, which might also reflect the antecedent soil moisture condition, was found to be stronger than that on the antecedent AAP. The strong association between flow and water quality has often been observed in rivers [3,34,36,38]; thus the detected stronger dependence of water quality concentration on the optimal cumulative AAP is under expectation.
Among the eleven investigated water quality parameters, some of them such as TURB, DOC and TP were positively correlated with the optimal cumulative AAP. The elevated concentrations of the pollutant constituents associated with particulate solids (e.g., TURB) or attached to particulate solids (e.g., TP) in water bodies can be ascribed to their wash-off (mobilization and transport) from non-point source pollutants accumulated on land surface by surface runoff generated from precipitation. Same results were obtained in studies by Budai and Clement [39] and by Akbar et al. [40] in Alberta rivers. A study by Delpla et al. [27] also showed that DOC is also transported from soil to rivers during rainfall events from watersheds consisting of agricultural land. In these three river basins, 9.67%, 54.47% and 68.71% of the land is used for agriculture in the Athabasca, Bow, and Oldman River basins, respectively. Note that the land use percentages of agricultural land in the river basins were calculated using the land use raster map of Alberta (Appendix, Figure A1). Other water quality parameters such as , , and SC were generally negatively correlated with both the optimal antecedent AAP and the optimal cumulative AAP. All these results show that the concentrations of these parameters are primarily diluted by surface runoff generated from precipitation while the wash-off of these pollutant constituents by surface runoff/precipitation would be minor or secondary. In another word, the loading of these pollutant constituents is largely from point sources which often release pollutants at more or less constant rates.
At the stations on the three rivers, TN exhibited different behavior corresponding to precipitation. One of the major sources of TN is the agricultural land. This might explain the absence of significant correlation of TN with both the optimal antecedent AAP and the optimal cumulative AAP at the stations on the Athabasca River as only 9.67% of the river basin is used for agriculture. The percentages of agricultural land in the catchments corresponding to the upstream, midstream and downstream stations of the Bow River are 13.33%, 31.11%, and 52.64%, respectively; while the stronger association between TN and the optimal cumulative AAP was also calculated at the midstream and downstream stations on the river. However different results were obtained on the Oldman River as the dependence between TN and the optimal cumulative AAP did not increase with the increase of the percentages of agriculture land in the upstream, midstream, and downstream catchments (29.54%, 61.62%, and 67.35%, respectively). TN consists of several nitrogen species, which exist in the form of either particulate/particulate attached or dissolved, and thus the response of TN to precipitation can be more complex than many other pollutant constituents. Further investigation on the relationship between precipitation and different species of nitrogen is required to better understand TN behavior and to explain the inconsistent findings between the Oldman River and other two rivers (the Athabasca and Bow Rivers).
The calculated positive correlations between Chl-a and the optimal cumulative AAP at many stations on the three rivers implies that nutrient discharged into the water bodies enhances aquatic plants growth. At all stations on the three rivers, flow in cold season is more or less constantly low; while high flow and large variation in flow are measured in warm and rainy season. Thus, it is expected to observe the positive correlation between WT and the optimal cumulative AAP. In general, DO is negatively dependent on the optimal cumulative AAP. The increase of WT enhances chemical and biological reactions that consume oxygen and also decreases the solubility of oxygen [20]. Therefore, the opposite dependence of WT and DO on the optimal cumulative AAP is under expectation.
3.3. Water Quality Variation under Different Precipitation Magnitudes
As illustrated and discussed above, the concentrations of water quality parameters appeared to be more dependent on the optimal cumulative AAP than the optimal antecedent AAP in general, as larger correlation coefficients were often calculated between water quality concentrations and the optimal cumulative AAP. In addition, river flow was also found to be more associated with the cumulative antecedent AAP than with the antecedent AAP. Therefore, the optimal cumulative AAP was used to investigate the variation in water quality among different precipitation magnitudes in this section and to estimate the climate change impact on water quality in next section.
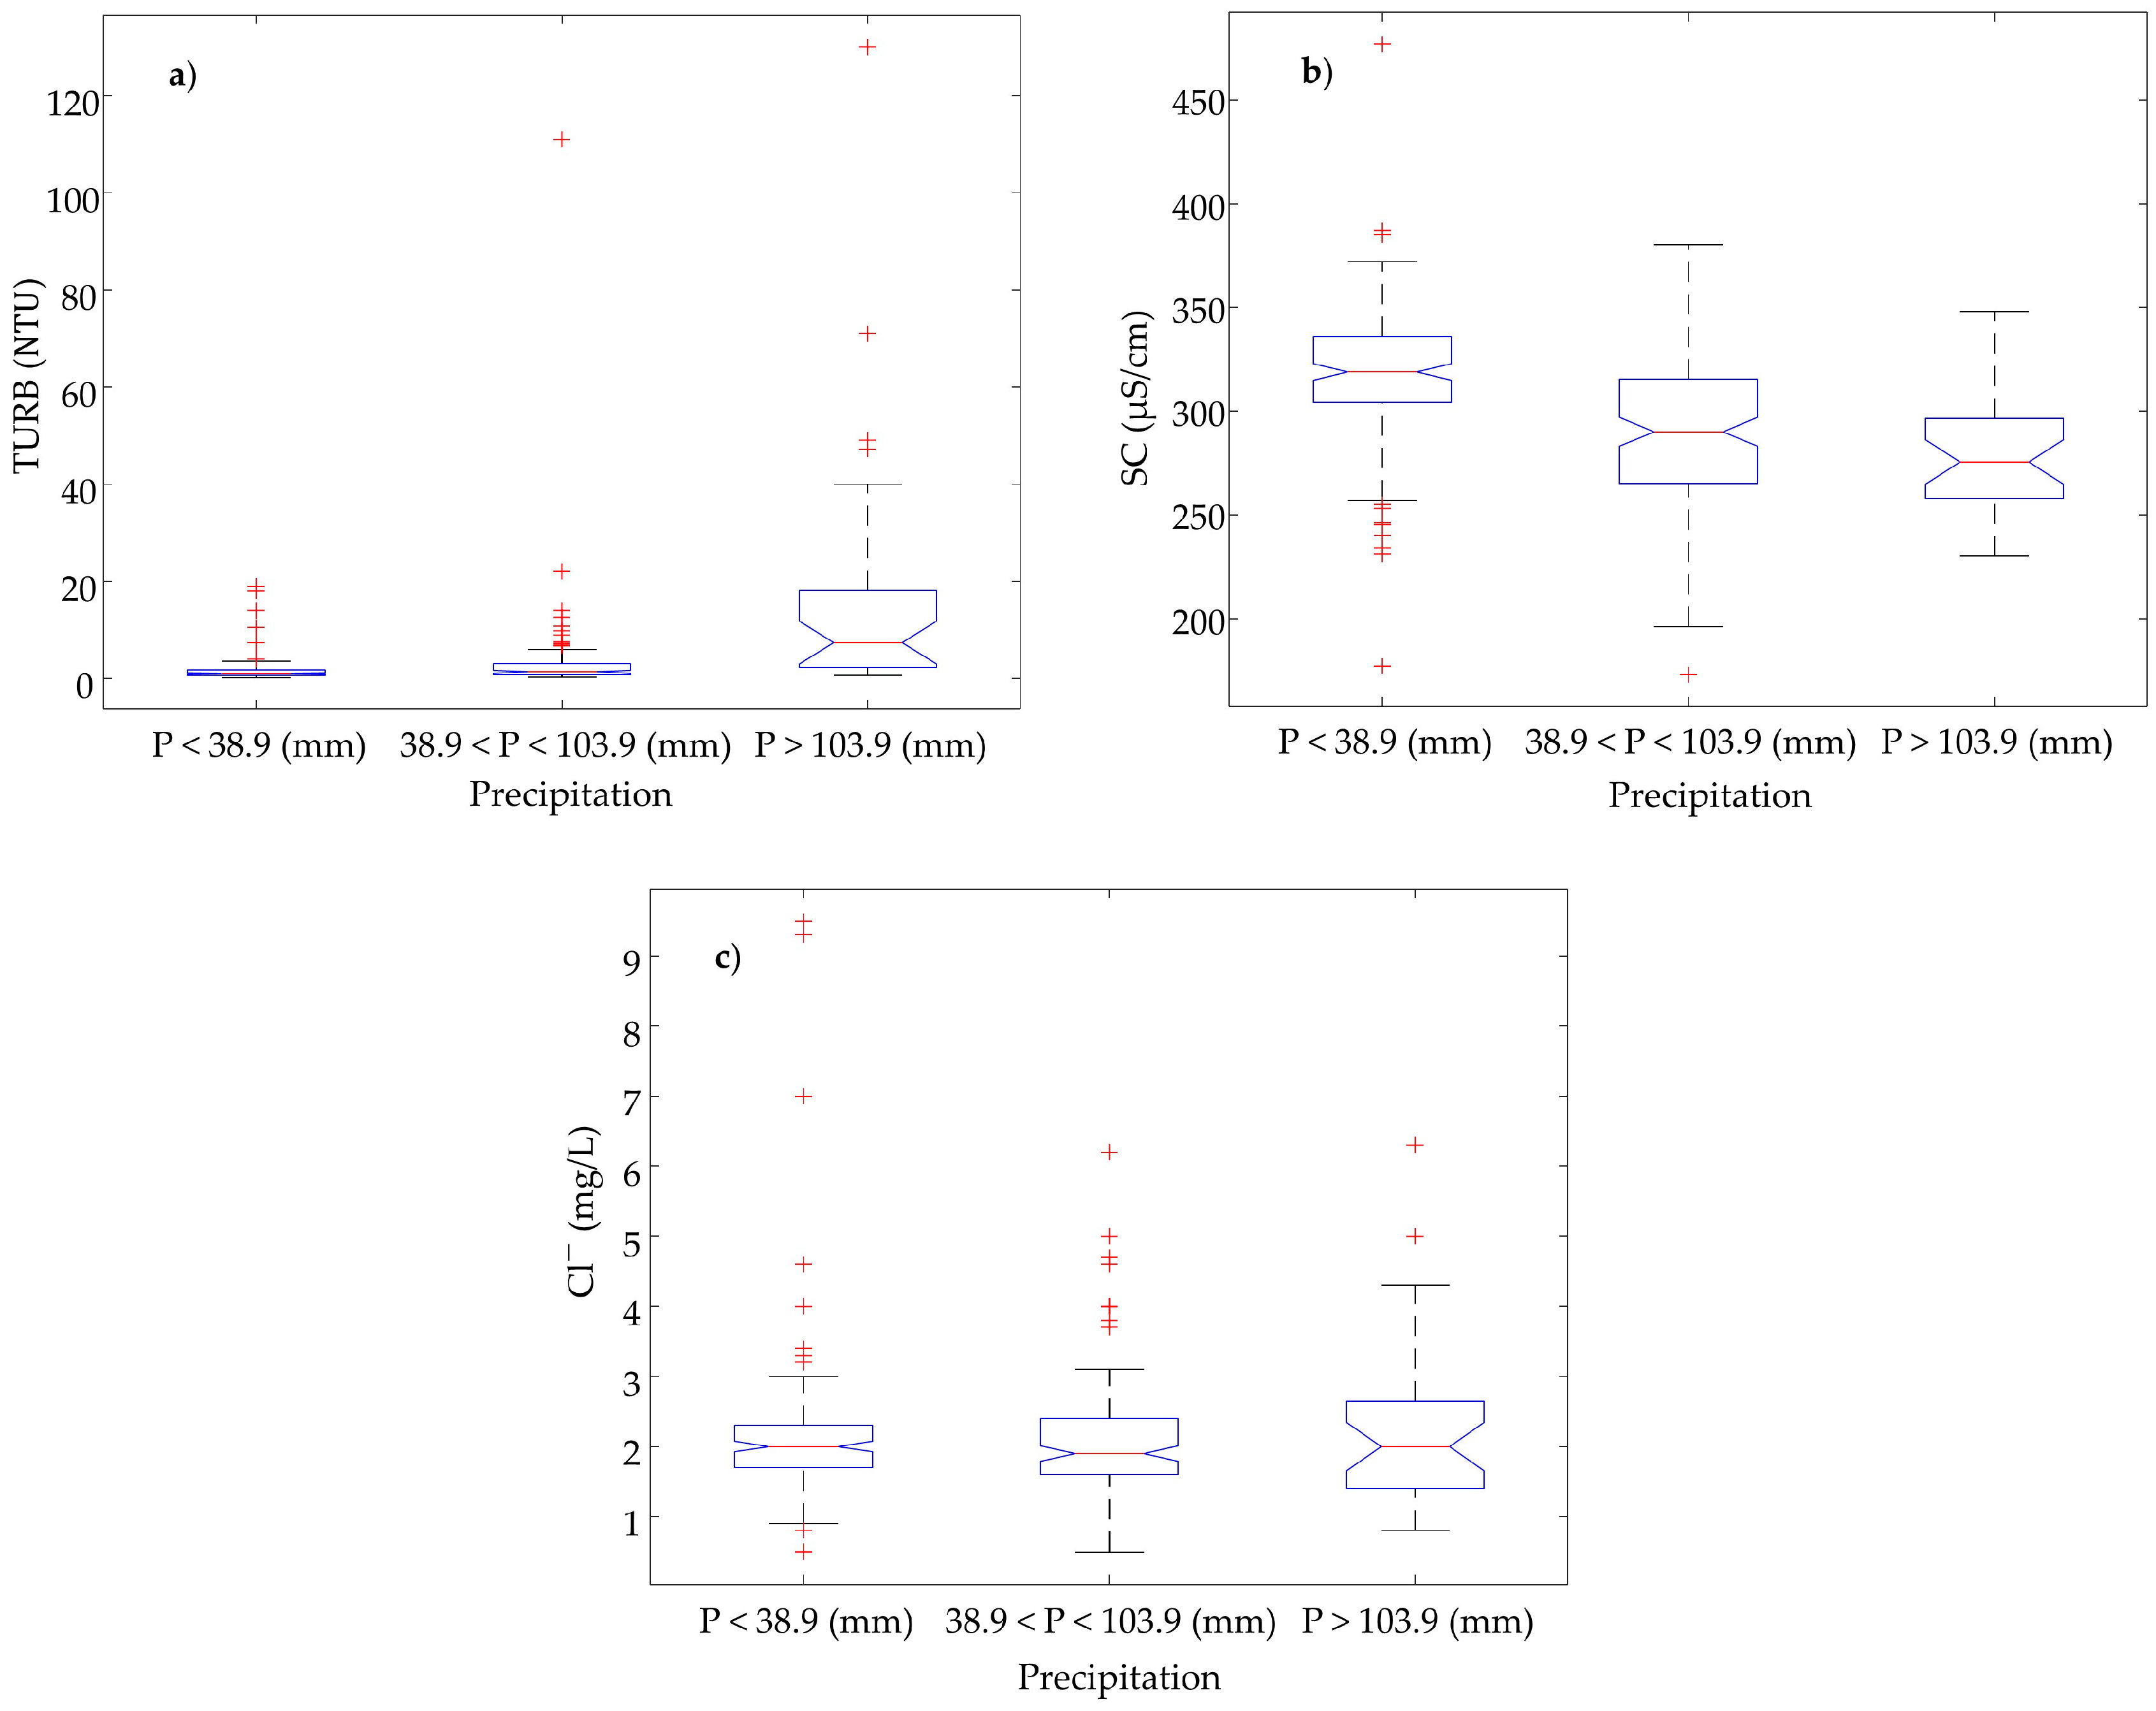
The optimal cumulative AAP was classified into three different groups, namely low, medium and high categories according to its magnitude. The 50th and 90th percentiles of the optimal cumulative antecedent AAP were used in the classification at each station. Note that due to the spatial nature of precipitation and thus the optimal cumulative AAP, the 50th and 90th percentiles are different from station to station. The box and whisker plots shown in Figure 3 demonstrate the variations of TURB, SC, and within the three groups of precipitation at the upstream station (AB05BH0010) on the Bow River as examples. It can be seen that different water quality parameters display different responses to the varying magnitude of the optimal cumulative AAP. As expected, the median of TURB increases with the increase of the precipitation magnitude; in contrast, the median of SC overall tends to decrease with the increase of the optimal cumulative AAP among the three categories of precipitation. On the other hand, the median of Cl− didn’t show significant variation among the three categories. In general in the three rivers, the medians of the concentrations of water quality parameters such as TURB, TP, and DOC were elevated in high optimal cumulative AAP; the medians of the concentrations of several water quality parameters such as SC, , and (at many stations) decreased in high optimal cumulative AAP; while the medians of the concentrations of other water quality parameters did not obviously vary among the three categories.
In addition, the KW test detected the significant statistical differences in the medians of the concentrations of all or many water quality parameters among the three categories of the optimal cumulative AAP on all three rivers. At the midstream and downstream stations of the Athabasca River, significant differences in the medians of the concentrations of all water quality parameters were observed. On the Oldman River, significant differences in the medians were not found in the concentrations of Chl-a, pH, , and at the upstream station, pH and at the midstream station, and pH at the downstream station among the three categories of precipitation. On the Bow River, no significant differences in the medians among the three categories were detected in the concentrations of Chl-a and at the upstream station; Chl-a didn’t show significant differences in the medians among the three categories of precipitation at the midstream station; while all water quality parameters were found to be significantly different in the medians of their concentrations among the three categories of precipitation at the downstream station. As the results shown, different levels of water quality were observed in different precipitation magnitudes in general although several water quality parameters did not present statistical variation among the three categories of precipitation. The information is helpful when scheduling such as the release of treated wastewater effluents and application of fertilizers through considering antecedent metrological conditions, especially precipitation to avoid the detrimental effects of elevated water quality concentrations. Moreover, these results also demonstrate the spatial variation of the effect of precipitation on the water quality along a river. For instance using on the Bow River as an example, the median of at the upstream station (AB05BH0010) appeared not to respond to the increase of precipitation magnitude obviously (Figure 3c); whereas the median of showed appreciable decrease with the increase of the precipitation magnitude at both the midstream and downstream stations on the river (results not shown). The land use and/or the anthropogenic interference present variation, which could result in the variations of point and non-point source contributions along a river, might explain the spatial variation of precipitation response of water quality. The impact of land use/cover on water quality of Alberta’s rivers have been confirmed in the most recent studies [40,41].
3.4. Changes in Water Quality under a Changing Climate
The projected potential climate change impacts on the water quality parameters that were significantly correlated with the optimal cumulative AAP shown in Table 3, Table 4 and Table 5 were conducted. The regression models, which are the best candidate models selected from various functions of the optimal cumulative AAP, used to project the changes in water quality are displayed in Table 6. When using the delta change method to assess the climate change impact on water quality, the historical observed precipitation series (1988–2014) was multiplied by the change percentages (Table 1) to generate the precipitation series sets that are representative of the future climate. The estimated changes in the means of the water quality concentrations in terms of percentages relative to the means of the water quality concentrations modeled for the time period of 1988–2014 are presented in Table 7, Table 8 and Table 9. As illustrated in Table 7, Table 8 and Table 9, the projected changes in percentage of the water quality parameters are in the ranges of −1.53% to 17.20% in the 2050s and −2.45% to 29.68% in the 2080s on the Athabasca River; large increases in percentage wise (>5%) were estimated in several water quality parameters including TUBR and TP in both the 2050s and 2080s on this river. On the Bow River, above 5% changes were projected for TUBR at all stations in the 2080s and TP at the downstream station in the 2080s; while on the Oldman River, above 5% changes were projected for both TUBR and TP in the 2080s. In general on all three rivers, both TURB and TP were found to be more prone to the change of precipitation under a changing climate, therefore their management needs to take the climate change impact into consideration to avoid the further degradation of water quality in future.
Under the median projected precipitation scenarios for the three river basins, the increase of precipitation would lead to the decreases of the concentrations of some water quality parameters (e.g., Cl−, , and SC); while it would result in the increases of several other water quality parameters (e.g., TUBR and TP). These results suggest that a changing climate does not always lead to the deterioration of riverine water quality as it also can result in the decrease in levels of some water quality parameters in the absence of other changes, for instance, in land use and anthropogenic activities. The pollutant constituents, such as Cl−, , and SC, all which are primarily contributed from point sources according to their negative dependence on flow and precipitation, would not be the concern under a changing climate. Therefore more attention on the impact of climate change should be paid to the pollutant constituents that originate or primarily originate from non-point sources. For pollutants originated from non-point sources, surface stormwater runoff is their major carrier. Therefore the results imply that more efficient management of stormwater surface runoff is required to attenuate the negative impact of climate change on riverine water quality. When compared with the Bow River, it is not a surprise that overall, relatively large changes in water quality were projected on both the Athabasca and Oldman Rivers. The results might be ascribed to the reasons: projected large changes in precipitation and the relative dominant role of natural factors (e.g., precipitation) on the Athabasca and Oldman Rivers. Whereas on the Bow River, the anthropogenic interference could be more dominant due to the urbanization occurring in the middle reach of the river.
Note that precipitation (here the optimal cumulative AAP) is not the only one explanatory variable when predicting riverine water quality as many other factors (e.g., change in land use and anthropogenic activities) have been well acknowledged to play roles as well. Although the models, which were developed only using precipitation as the explanatory variable, did not capture the variations of water quality very well, they generally predicted the means of the concentration of the water quality parameters fairly well (results not shown). Therefore, the results obtained indicate the potential changes in the means of the water quality parameters under a changing climate.
4. Conclusions
The effect of precipitation on water quality in three rivers including the Athabasca, Bow, and Oldman Rivers in Alberta, Canada was studied in this paper. Compared to the antecedent precipitation, a stronger positive dependence between the cumulative antecedent AAP and flow was identified at all stations on the rivers. This result is consistent with the existing knowledge that the cumulative antecedent precipitation would be a better predictor of river flow, as it is also reflecting the antecedent soil moisture condition, which largely affects the hydrological response of a watershed. Similarly, significant correlations (positive or negative) with precipitation (both the optimal antecedent AAP and cumulative AAP) were calculated from many water quality parameters. Furthermore, significant differences in the concentrations of many water quality parameters were found among three precipitation magnitudes (low, medium and high). All these results confirmed the strong linkage between precipitation and riverine water quality and suggested the significant role of precipitation on the water quality in the three rivers. Therefore the change in precipitation under climate change, which is occurring and will continue to occur, would affect riverine water quality. The results obtained in the paper demonstrated appreciable increases in some water quality parameters (such as TUBR and TP) under a changing climate. More efficient management therefore should be developed to aim these pollutant constituents in order to mitigate the impact of a changing climate. Furthermore, the results obtained suggested the importance of managing stormwater runoff as it was demonstrated to be the primary carrier of these pollutant constituents due to their positive dependence on precipitation and flow.
The uncertainty in water quality projection originated from the uncertainty in the projected precipitation by GCMs, which is often not negligible, was not assessed in this paper. The uncertainty in water quality under a changing climate can be quantified through using the ensemble modeling approach. In the ensemble modeling approach, the projected precipitation can be resampled from its range and then used to calculate water quality under a changing climate. The quantification of the uncertainty in water quality can then be quantified from a number of model outputs. Future work to quantify the uncertainty in water quality originated from the uncertainty in projected precipitation under a changing climate, which is important for water resources management, is commended.
Acknowledgments
This work was funded by Natural Sciences and Engineering Research Council of Canada (NSERC). The authors would like to acknowledge the online sources of data of Alberta Environment and Parks, Alberta Agriculture and Forestry, and Water Survey of Canada.
Author Contributions
Sajjad Rostami conducted data collection and analysis under the supervision of Jianxun He and Quazi K. Hassan. All authors contributed significantly in writing the manuscript.
Conflicts of Interest
The authors declare no conflict of interest.
Appendix A
Figure A1.
Land use/cover map of Alberta [40].
Figure A1.
Land use/cover map of Alberta [40].
References
- Jarvie, H.P.; Neal, C.; Withers, P.J. Sewage-effluent phosphorus: A greater risk to river eutrophication than agricultural phosphorus? Sci. Total Environ. 2006, 360, 246–253. [Google Scholar] [CrossRef] [PubMed]
- Bowes, M.J.; Smith, J.T.; Neal, C.; Leach, D.V.; Scarlett, P.M.; Wickham, H.D.; Harman, S.A.; Armstrong, L.K.; Davy-Bowker, J.; Haft, M.; et al. Changes in water quality of the River Frome (UK) from 1965 to 2009: Is phosphorus mitigation finally working? Sci. Total Environ. 2011, 409, 3418–3430. [Google Scholar] [CrossRef] [PubMed]
- Bowes, M.J.; Jarvie, H.P.; Naden, P.S.; Old, G.H.; Scarlett, P.M.; Roberts, C.; Armstrong, L.K.; Harman, S.A.; Wickham, H.D.; Collins, A.L. Identifying priorities for nutrient mitigation using river concentration–flow relationships: The Thames basin, UK. J. Hydrol. 2014, 517, 1–12. [Google Scholar] [CrossRef] [Green Version]
- Xia, X.H.; Wu, Q.; Mou, X.L.; Lai, Y.J. Potential Impacts of Climate Change on the Water Quality of Different Water Bodies. J. Environ. Inform. 2015, 25, 85–98. [Google Scholar] [CrossRef]
- Tu, J. Combined impact of climate and land use changes on streamflow and water quality in eastern Massachusetts, USA. J. Hydrol. 2009, 379, 268–283. [Google Scholar] [CrossRef]
- Fan, M.; Shibata, H. Simulation of watershed hydrology and stream water quality under land use and climate change scenarios in Teshio River watershed, northern Japan. Ecol. Indic. 2015, 50, 79–89. [Google Scholar] [CrossRef]
- Whitehead, P.G.; Wilby, R.L.; Battarbee, R.W.; Kernan, M.; Wade, A.J. A review of the potential impacts of climate change on surface water quality. Hydrol. Sci. J. 2009, 54, 101–123. [Google Scholar] [CrossRef]
- Benítez-Gilabert, M.; Alvarez-Cobelas, M.; Angeler, D.G. Effects of climatic change on stream water quality in Spain. Clim. Chang. 2010, 103, 339–352. [Google Scholar] [CrossRef]
- Fukushima, T.; Ozaki, N.; Kaminishi, H.; Harasawa, H.; Matsushige, K. Forecasting the changes in lake water quality in response to climate changes, using past relationships between meteorological conditions and water quality. Hydrol. Process. 2000, 14, 593–604. [Google Scholar] [CrossRef]
- Zheng, Y.; Wang, X.J. Advances and prospects for nonpoint source pollution studies. Adv. Water Sci. 2002, 13, 105–110. [Google Scholar]
- Kalkhoff, S.J.; Hubbard, L.E.; Tomer, M.D.; James, D. Effect of variable annual precipitation and nutrient input on nitrogen and phosphorus transport from two Midwestern agricultural watersheds. Sci. Total Environ. 2016, 559, 53–62. [Google Scholar] [CrossRef] [PubMed]
- Göransson, G.; Larson, M.; Bendz, D. Variation in turbidity with precipitation and flow in a regulated river system. Hydrol. Earth Syst. Sci. 2013, 17, 2529–2542. [Google Scholar] [CrossRef]
- McCarthy, D.; Hathaway, J.; Hunt, W.; Deletic, A. Intra-event variability of Escherichia coli and total suspended solids in urban stormwater runoff. Water Res. 2012, 46, 6661–6670. [Google Scholar] [CrossRef] [PubMed]
- Chen, H.; Chang, H. Response of discharge, TSS, and E. coli to rainfall events in urban, suburban, and rural watersheds. Environ. Sci. 2014, 16, 2313–2324. [Google Scholar] [CrossRef] [PubMed]
- Bae, H.-K. Changes of River’s Water Quality Responded to Rainfall Events. Environ. Ecol. Res. 2013, 1, 21–25. [Google Scholar]
- Hamilton, J.L.; Luffman, I. Precipitation, pathogens, and turbidity trends in the Little River, Tennessee. Phys. Geogr. 2009, 30, 236–248. [Google Scholar] [CrossRef]
- Rueda, F.J.; Fleenor, W.E.; De Vicente, I. Pathways of river nutrients towards the euphotic zone in a deep-reservoir of small size: Uncertainty analysis. Ecol. Model. 2007, 202, 345–361. [Google Scholar] [CrossRef]
- Chorus, I.; Bartram, J. Toxic Cyanobacteria in Water: A Guide to Their Public Health Consequences, Monitoring and Management; Chorus, I., Bertram, J., Eds.; World Health Organization: Geneva, Switzerland, 1999. [Google Scholar]
- Clark, J.M.; Lane, S.N.; Chapman, P.J.; Adamson, J.K. Export of dissolved organic carbon from an upland peatland during storm events: Implications for flux estimates. J. Hydrol. 2007, 347, 438–447. [Google Scholar] [CrossRef]
- Kundzewicz, Z.W.; Krysanova, V. Climate change and stream water quality in the multi-factor context. Clim. Chang. 2010, 103, 353–362. [Google Scholar] [CrossRef]
- Eghball, B.; Gilley, J.E.; Baltensperger, D.D.; Blumenthal, J. Long-term manure and fertilizer application effects on phosphorus and nitrogen in runoff. Trans. ASAE 2002, 45, 687–694. [Google Scholar] [CrossRef]
- Dyer, F.; ElSawah, S.; Croke, B.; Griffiths, R.; Harrison, E.; Lucena-Moya, P.; Jakeman, A. The effects of climate change on ecologically-relevant flow regime and water quality attributes. Stoch. Environ. Res. Risk Assess. 2014, 28, 67–82. [Google Scholar] [CrossRef]
- Kienzle, S.W.; Nemeth, M.W.; Byrne, J.M.; McDonald, R.J. Simulating the hydrological impacts of climate change in the upper North Saskatchewan River basin, Alberta, Canada. J. Hydrol. 2012, 412–413, 76–89. [Google Scholar] [CrossRef]
- Forbes, K.A.; Kienzle, S.W.; Coburn, C.A.; Byrne, J.M.; Rasmussen, J. Simulating the hydrological response to predicted climate change on a watershed in southern Alberta, Canada. Clim. Chang. 2011, 105, 555–576. [Google Scholar] [CrossRef]
- Tanzeeba, S.; Gan, T.Y. Potential impact of climate change on the water availability of South Saskatchewan River Basin. Clim. Chang. 2012, 112, 355–386. [Google Scholar] [CrossRef]
- MacDonald, R.J.; Byrne, J.M.; Boon, S.; Kienzle, S.W. Modelling the Potential Impacts of Climate Change on Snowpack in the North Saskatchewan River Watershed, Alberta. Water Resour. Manag. 2012, 26, 3053–3076. [Google Scholar] [CrossRef]
- Delpla, I.; Baurres, E.; Jung, A.V.; Thomas, O. Impacts of rainfall events on runoff water quality in an agricultural environment in temperate areas. Sci. Total Environ. 2011, 409, 1683–1688. [Google Scholar] [CrossRef] [PubMed]
- St Laurent, J.; Mazumder, A. Influence of seasonal and inter-annual hydro-meteorological variability on surface water fecal coliform concentration under varying land-use composition. Water Res. 2014, 48, 170–178. [Google Scholar] [CrossRef] [PubMed]
- Hongve, D.; Riise, G.; Kristiansen, J.F. Increased colour and organic acid concentrations in Norwegian forest lakes and drinking water—A result of increased precipitation? Aquat. Sci. 2004, 66, 231–238. [Google Scholar] [CrossRef]
- Downing, D.J.; Pettapiece, W.W. Natural Regions and Subregions of Alberta; Natural Region Committee: Edmonton, Alberta, Canada, 2006. [Google Scholar]
- Barrow, E.; Yu, G. Climate Scenarios for Alberta, Prairie Adaptation. Available online: http://www.parc.ca/pdf/research_publications/summary_docs/SD2006-02.pdf (accessed on 24 November 2017).
- Hay, L.E.; Wilby, R.L.; Leavesketm, G.H. A comparison of delta change and downscaled GCM scenarios for three mountainous basins in the United States. J. Am. Water Resour. Assoc. 2000, 36, 387–397. [Google Scholar] [CrossRef]
- Diaz-Nieto, J.; Wilby, R.L. A comparison of statistical downscaling and climate change factor methods: Impacts on low flows in the River Thames, United Kingdom. Clim. Chang. 2005, 69, 245–268. [Google Scholar] [CrossRef]
- Nilsson, C.; Renöfält, B. Linking flow regime and water quality in rivers: A challenge to adaptive catchment management. Ecol. Soc. 2008, 13, 18. [Google Scholar] [CrossRef]
- Tabari, H.; Marofi, S.; Ahmadi, M. Long-term variations of water quality parameters in the Maroon River, Iran. Environ. Monit. Assess. 2011, 177, 273–287. [Google Scholar] [CrossRef] [PubMed]
- Prathumratana, L.; Sthiannopkao, S.; Kim, K.W. The relationship of climatic and hydrological parameters to surface water quality in the lower Mekong River. Environ. Int. 2008, 34, 860–866. [Google Scholar] [CrossRef] [PubMed]
- Jiang, T.; Su, B.; Hartmann, H. Temporal and spatial trends of precipitation and river flow in the Yangtze River Basin 1961–2000. Geomorphology 2007, 45, 143–154. [Google Scholar] [CrossRef]
- Interlandi, S.J.; Crockett, C.S. Recent water quality trends in the Schuylkill River, Pennsylvania, USA: A preliminary assessment of the relative influences of climate, river discharge and suburban development. Water Res. 2003, 37, 1737–1748. [Google Scholar] [CrossRef]
- Budai, P.; Clement, A. Estimation of nutrient load from urban diffuse sources: Experiments with runoff sampling at pilot catchments of Lake Balaton, Hungary. Water Sci. Technol. 2007, 56, 295–302. [Google Scholar] [CrossRef] [PubMed]
- Akbar, T.A.; Hassan, Q.K.; Achari, G. Clusterization of surface water quality and its relation to climate and land use/cover. J. Environ. Prot. 2013, 4, 333–343. [Google Scholar] [CrossRef]
- Akbar, T.A.; Hassan, Q.K.; Achari, G. Development of remote sensing based models for surface water quality. CLEAN–Soil Air Water 2014, 42, 1044–1051. [Google Scholar] [CrossRef]
Figure 1.
The study area, water quality and flow monitoring stations on the three studied rivers in Alberta.
Figure 1.
The study area, water quality and flow monitoring stations on the three studied rivers in Alberta.

Figure 2.
Correlation coefficients between daily flow and (a) lagged day of the antecedent AAP and (b) cumulative day of the cumulative antecedent AAP at the midstream station (07BE001) of the Athabasca River. The red line in the left plot indicates the identified optimal cumulative day for the cumulative antecedent AAP.

Figure 3.
Box and whisker plots of the concentrations of selected water quality parameters: (a) TUBR; (b) SC; and (c) , in the three categories of the optimal cumulative AAP at the upstream station (AB05BH0010) on the Bow River.
Figure 3.
Box and whisker plots of the concentrations of selected water quality parameters: (a) TUBR; (b) SC; and (c) , in the three categories of the optimal cumulative AAP at the upstream station (AB05BH0010) on the Bow River.


Table 1.
Change percentages of precipitation relative to the baseline time periods (1961–1990 and 1988–2014) obtained from the future climate scenario projected by the HadCM3 model under the B2 emission scenario.
Table 1.
Change percentages of precipitation relative to the baseline time periods (1961–1990 and 1988–2014) obtained from the future climate scenario projected by the HadCM3 model under the B2 emission scenario.
| Watershed | Baseline (1961–1990) | Baseline (1988–2014) | ||
|---|---|---|---|---|
| 2050s | 2080s | 2050s | 2080s | |
| Athabasca River | +7.2% | +10.2% | +4.7% | +7.6% |
| Bow River | +3.3% | +9.8% | +2.2% | +7.3% |
| Oldman River | +4.7% | +15.7% | +3.1% | +11.7% |
Table 2.
Identified the optimal lagged day of the antecedent AAP and the optimal cumulative day of the cumulative antecedent AAP at all stations on the three rivers. All the calculated correlation coefficients are statistically significant at the significance level of 5%.
Table 2.
Identified the optimal lagged day of the antecedent AAP and the optimal cumulative day of the cumulative antecedent AAP at all stations on the three rivers. All the calculated correlation coefficients are statistically significant at the significance level of 5%.
| River | Flow Station | Flow and Antecedent AAP | Flow and Cumulative Antecedent AAP | ||
|---|---|---|---|---|---|
| Optimal Lagged Day (Day) | Correlation Coefficient (r) | Optimal Cumulative Day (Day) | Correlation Coefficient (r) | ||
| Athabasca River | 07BE001 (midstream) | 5 | 0.456 | 14 | 0.762 |
| 07DA001 (downstream) | 6 | 0.441 | 15 | 0.746 | |
| Bow River | 05BH008 (upstream) | 2 | 0.278 | 28 | 0.692 |
| 05BM002 (midstream) | 2 | 0.464 | 13 | 0.681 | |
| 05BN012 (downstream) | 4 | 0.413 | 15 | 0.639 | |
| Oldman River | 05AA024 (upstream) | 2 | 0.302 | 12 | 0.532 |
| 05AD007 (midstream) | 2 | 0.388 | 12 | 0.604 | |
| 05AG006 (downstream) | 3 | 0.395 | 13 | 0.612 | |
Table 3.
Correlation coefficients (r) of water quality concentrations with the optimal antecedent AAP and the optimal cumulative AAP at the stations on the Athabasca River. Correlation coefficients in boldface are statistically significant at the significance level of 5%.
Table 3.
Correlation coefficients (r) of water quality concentrations with the optimal antecedent AAP and the optimal cumulative AAP at the stations on the Athabasca River. Correlation coefficients in boldface are statistically significant at the significance level of 5%.
| Station | Midstream Station (AB07BE0010) | Downstream Station (AB07CC0030) | ||
|---|---|---|---|---|
| Optimal Antecedent AAP | Optimal Cumulative AAP | Optimal Antecedent AAP | Optimal Cumulative AAP | |
| Chl-a | 0.220 | 0.325 | 0.238 | 0.454 |
| WT | 0.257 | 0.597 | 0.367 | 0.589 |
| DO | −0.164 | −0.441 | −0.258 | −0.577 |
| TURB | 0.285 | 0.526 | 0.272 | 0.528 |
| DOC | 0.020 | 0.014 | 0.099 | 0.214 |
| TP | 0.218 | 0.403 | 0.220 | 0.462 |
| TN | 0.103 | 0.044 | 0.027 | 0.125 |
| pH | 0.027 | 0.119 | 0.207 | 0.278 |
| Cl− | −0.199 | −0.511 | −0.337 | −0.570 |
| −0.251 | −0.573 | −0.302 | −0.580 | |
| SC | −0.313 | −0.603 | −0.340 | −0.586 |
Table 4.
Correlation coefficients (r) of water quality concentrations with the optimal antecedent AAP and the optimal cumulative AAP at the stations on the Bow River. Correlation coefficients in boldface are statistically significant at the significance level of 5%.
Table 4.
Correlation coefficients (r) of water quality concentrations with the optimal antecedent AAP and the optimal cumulative AAP at the stations on the Bow River. Correlation coefficients in boldface are statistically significant at the significance level of 5%.
| Station | Upstream Station (AB05BH0010) | Midstream Station (AB05BM0010) | Downstream Station (AB05BN0010) | |||
|---|---|---|---|---|---|---|
| Optimal Antecedent AAP | Optimal Cumulative AAP | Optimal Antecedent AAP | Optimal Cumulative AAP | Optimal Antecedent AAP | Optimal Cumulative AAP | |
| Chl-a | 0.038 | −0.073 | 0.083 | 0.078 | 0.163 | 0.320 |
| WT | 0.126 | 0.579 | 0.098 | 0.434 | 0.142 | 0.519 |
| DO | −0.128 | −0.544 | −0.093 | −0.386 | −0.128 | −0.530 |
| TURB | 0.224 | 0.389 | 0.231 | 0.316 | 0.151 | 0.402 |
| DOC | 0.124 | 0.332 | 0.129 | 0.362 | 0.115 | 0.388 |
| TP | 0.069 | 0.169 | 0.059 | 0.044 | 0.065 | 0.331 |
| TN | 0.108 | 0.136 | −0.151 | −0.358 | −0.095 | −0.341 |
| pH | −0.008 | 0.144 | 0.069 | 0.202 | 0.105 | 0.276 |
| Cl− | 0.022 | −0.027 | −0.070 | −0.310 | −0.144 | −0.370 |
| −0.122 | −0.575 | −0.136 | −0.377 | −0.012 | −0.197 | |
| SC | −0.096 | −0.423 | −0.056 | −0.307 | −0.050 | −0.291 |
Table 5.
Correlation coefficients (r) of water quality concentrations with the optimal antecedent AAP and the optimal cumulative AAP at the stations on the Oldman River. Correlation coefficients in boldface are statistically significant at the significance level of 5%.
Table 5.
Correlation coefficients (r) of water quality concentrations with the optimal antecedent AAP and the optimal cumulative AAP at the stations on the Oldman River. Correlation coefficients in boldface are statistically significant at the significance level of 5%.
| Station | Upstream Station (AB05AB0070) | Midstream Station (AB05AD0010) | Downstream Station (AB05AG0010) | |||
|---|---|---|---|---|---|---|
| Optimal Antecedent AAP | Optimal Cumulative AAP | Optimal Antecedent AAP | Optimal Cumulative AAP | Optimal Antecedent AAP | Optimal Cumulative AAP | |
| Chl-a | 0.032 | 0.077 | 0.100 | 0.338 | 0.164 | 0.302 |
| WT | −0.098 | −0.010 | −0.077 | 0.138 | 0.047 | 0.223 |
| DO | 0.107 | 0.022 | 0.061 | −0.221 | −0.097 | −0.310 |
| TURB | 0.042 | 0.227 | 0.196 | 0.385 | 0.269 | 0.386 |
| DOC | 0.048 | 0.167 | 0.063 | 0.290 | 0.121 | 0.233 |
| TP | 0.134 | 0.234 | 0.189 | 0.388 | 0.138 | 0.279 |
| TN | 0.077 | 0.160 | 0.173 | 0.165 | 0.141 | 0.069 |
| pH | 0.049 | 0.105 | −0.111 | 0.019 | −0.085 | 0.050 |
| Cl− | 0.031 | 0.062 | 0.034 | 0.073 | −0.160 | −0.278 |
| 0.100 | −0.003 | −0.009 | −0.054 | −0.080 | −0.133 | |
| SC | 0.005 | −0.039 | −0.021 | −0.021 | −0.096 | −0.147 |
Table 6.
The selected best candidate models used to project the changes in water quality on the Athabasca, Bow, and Oldman Rivers, respectively. The variables y and x denote water quality concentrations and the optimal cumulative AAP, respectively.
Table 6.
The selected best candidate models used to project the changes in water quality on the Athabasca, Bow, and Oldman Rivers, respectively. The variables y and x denote water quality concentrations and the optimal cumulative AAP, respectively.
| Quality | Upstream Station | Midstream Station | Downstream Station |
|---|---|---|---|
| Athabasca River | |||
| Chl-a | -- | y = 0.68x0.33 | y = 0.35x0.57 |
| WT | -- | y = −0.0041x2 + 0.55x − 0.41 | y = −0.003x2 + 0.51x − 1.44 |
| DO | -- | y = 0.0005x2 − 0.076x + 11.48 | y = 12.84e−0.006x |
| TURB | -- | y = 3.54e0.054x | y = 3.56e0.054x |
| DOC | -- | -- | y = 0.0007x2 + 0.0061x + 7.60 |
| TP | -- | y = 0.017e0.031x | y = 0.00002x2 + 0.0011x + 0.024 |
| TN | -- | -- | -- |
| pH | -- | y = −0.0001x2 + 0.01x + 7.77 | y = −0.0002x2 + 0.016x + 7.69 |
| Cl− | -- | y = 4.97x−0.30 | y = 5.4679e−0.02x |
| -- | y = 42.70e−0.016x | y = 49.78e−0.016x | |
| SC | -- | y = 0.039x2 − 5.53x + 393.25 | y = 0.035x2 − 5.57x + 430.83 |
| Bow River | |||
| Chl-a | -- | -- | y = 1.34x0.24 |
| WT | y = −0.0004x2 + 0.15x + 0.60 | y = −0.0011x2 + 0.22x + 3.20 | y = −0.0028x2 + 0.41x + 2.36 |
| DO | y = 0.001x2 − 0.038x + 13.11 | y = 0.0002x2 − 0.046x + 12.09 | y = 0.0006x2 − 0.099x + 13.01 |
| TURB | y = 0.74e0.014x | y = 0.0217x2 − 0.66x + 10.28 | y = 0.024x2 − 0.58x + 15.45 |
| DOC | y = 0.61e0.0054x | y = 0.00004x2 + 0.019x + 1.59 | y = 1.96e0.0083x |
| TP | y = 0.0037e0.0051x | -- | y = 0.00002x2 − 0.0003x + 0.032 |
| TN | y = 0.16e0.0031x | y =0.00008x2 − 0.014x + 1.56 | y = 1.44x−0.16 |
| pH | y = −0.00001x2 + 0.003x + 8.03 | y = −0.00003x2 + 0.0056x + 7.85 | y = −0.0002x2 + 0.017x + 7.90 |
| Cl− | -- | y = 11.06e−0.008x | y = 11.68e−0.01x |
| y = 0.0004x2 − 0.16x + 43.09 | y = 48.71e−0.004x | y = 64.09e−0.003x | |
| SC | y = 0.0019x2 − 0.68x + 326.88 | y = 386.62e−0.002x | y = 420.93e−0.002x |
| Oldman River | |||
| Chl-a | -- | y = 1.00e0.011x | y = 1.76e0.011x |
| WT | -- | y = −0.0005x2 + 0.11x + 7.02 | y = −0.0009x2 + 0.19x + 6.54 |
| DO | -- | y = 0.0001x2 − 0.033x + 11.57 | y = 0.0002x2 − 0.053x + 12.20 |
| TURB | y = 0.0022x2 + 0.11x + 2.96 | y = 0.048x2 − 1.26x + 28.24 | y = 0.036x2 + 0.18x + 7.97 |
| DOC | y = 1.83e0.0024x | y = 0.00005x2 + 0.019x + 2.05 | y = 0.00008x2 + 0.011x + 2.56 |
| TP | y = 0.000001x2 + 0.0001x + 0.0048 | y = 0.00005x2 − 0.0002x + 0.017 | y = 0.00006x2 − 0.0012x + 0.054 |
| TN | y = 0.19e0.0041x | y = 0.0001x2 − 0.0039x + 0.42 | -- |
| pH | -- | -- | -- |
| Cl− | -- | -- | y = 4.77e−0.008x |
| -- | -- | y = 51.88e−0.003x | |
| SC | -- | -- | y = 0.0013x2 − 0.85x + 398.74 |
Table 7.
Projected changes of the means of water quality concentrations in percentages relative to the baseline time period of 1988–2014 under a changing climate on the Athabasca River.
Table 7.
Projected changes of the means of water quality concentrations in percentages relative to the baseline time period of 1988–2014 under a changing climate on the Athabasca River.
| Station | Midstream Station (AB07BE0010) | Downstream Station (AB07CC0030) | ||
|---|---|---|---|---|
| 2050s | 2080s | 2050s | 2080s | |
| Chl-a | 1.51% | 2.42% | 2.65% | 4.26% |
| WT | 3.03% | 4.81% | 3.98% | 6.35% |
| DO | −0.32% | −0.52% | −0.56% | −0.90% |
| TURB | 17.20% | 29.68% | 16.51% | 28.42% |
| DOC | - | - | 0.73% | 1.20% |
| TP | 5.55% | 9.23% | 4.19% | 6.84% |
| TN | - | - | - | - |
| pH | 0.04% | 0.07% | 0.01% | 0.02% |
| Cl− | −1.37% | −2.17% | −1.53% | −2.45% |
| −1.11% | −1.78% | −1.23% | −2.07% | |
| SC | −0.74% | −1.17% | −0.87% | −1.39% |
Table 8.
Projected changes of the means of water quality concentrations in percentages relative to the baseline time period of 1988–2014 under a changing climate on the Bow River.
Table 8.
Projected changes of the means of water quality concentrations in percentages relative to the baseline time period of 1988–2014 under a changing climate on the Bow River.
| Station | Upstream Station (AB05BH0010) | Midstream Station (AB05BM0010) | Downstream Station (AB05BN0010) | |||
|---|---|---|---|---|---|---|
| 2050s | 2080s | 2050s | 2080s | 2050s | 2080s | |
| Chl-a | - | - | - | - | 0.53% | 1.71% |
| WT | 1.41% | 4.57% | 0.83% | 2.71% | 0.95% | 3.06% |
| DO | −0.19% | −0.63% | −0.12% | −0.39% | −0.20% | −0.65% |
| TURB | 3.99% | 14.40% | 3.81% | 13.10% | 2.73% | 9.40% |
| DOC | 0.74% | 2.51% | 0.55% | 1.84% | 0.47% | 1.57% |
| TP | 0.69% | 2.33% | - | - | 1.49% | 5.11% |
| TN | 0.38% | 1.28% | −0.25% | −0.82% | −0.34% | −1.10% |
| pH | 0.02% | 0.06% | 0.02% | 0.06% | 0.00% | 0.01% |
| Cl− | - | - | −0.34% | −1.11% | −0.39% | −1.28% |
| −0.28% | −0.93% | −0.18% | −0.61% | −0.13% | −0.44% | |
| SC | −0.13% | −0.42% | −0.10% | −0.32% | −0.09% | −0.30% |
Table 9.
Projected changes of the means of water quality concentrations in percentages relative to the baseline time period of 1988–2014 under a changing climate on the Oldman River.
Table 9.
Projected changes of the means of water quality concentrations in percentages relative to the baseline time period of 1988–2014 under a changing climate on the Oldman River.
| Station | Upstream Station (AB05AB0070) | Midstream Station (AB05AD0010) | Downstream Station (AB05AG0010) | |||
|---|---|---|---|---|---|---|
| 2050s | 2080s | 2050s | 2080s | 2050s | 2080s | |
| Chl-a | - | - | 1.19% | 4.71% | 0.96% | 3.74% |
| WT | - | - | 0.42% | 1.51% | 0.68% | 2.50% |
| DO | - | - | −0.13% | −0.49% | −0.19% | 0.70% |
| TURB | 3.15% | 12.24% | 4.51% | 17.98% | 4.93% | 19.37% |
| DOC | 0.20% | 0.77% | 0.62% | 2.38% | 0.40% | 1.53% |
| TP | 1.89% | 7.29% | 4.83% | 19.03% | 3.25% | 12.93% |
| TN | 0.37% | 1.41% | 0.92% | 3.70% | - | - |
| pH | - | - | - | - | - | - |
| Cl− | - | - | - | - | −0.42% | −1.55% |
| - | - | - | - | −0.17% | −0.65% | |
| SC | - | -- | - | - | −0.09% | −0.32% |
© 2018 by the authors. Licensee MDPI, Basel, Switzerland. This article is an open access article distributed under the terms and conditions of the Creative Commons Attribution (CC BY) license (http://creativecommons.org/licenses/by/4.0/).
Share and Cite
MDPI and ACS Style
Rostami, S.; He, J.; Hassan, Q.K. Riverine Water Quality Response to Precipitation and Its Change. Environments 2018, 5, 8. https://doi.org/10.3390/environments5010008
AMA Style
Rostami S, He J, Hassan QK. Riverine Water Quality Response to Precipitation and Its Change. Environments. 2018; 5(1):8. https://doi.org/10.3390/environments5010008
Chicago/Turabian StyleRostami, Sajjad, Jianxun He, and Quazi K. Hassan. 2018. "Riverine Water Quality Response to Precipitation and Its Change" Environments 5, no. 1: 8. https://doi.org/10.3390/environments5010008
Note that from the first issue of 2016, this journal uses article numbers instead of page numbers. See further details here.