1. Introduction
Heavy soils are characterized by a high content of clay particles which, due to moisture changes, cause volume changes in soil. When moisture increases, soil swells, and on drying, soil shrinks. Volumetric changes occur in a three-dimensional process, that in the vertical direction reflects the vertical movement of the soil surface, and in the horizontal plane the formation of cracks. The degree of distribution of soil volume changes to horizontal and vertical components depends on the isotropic properties of the soil environment [
1,
2,
3,
4]. The presence of cracks in conditions of heavy soils creates a two-domain soil environment, which significantly affects hydrological processes, especially in extreme meteorological conditions, highlighting the importance of studying this three-dimensional process [
5,
6,
7,
8,
9]. Due to expected climatic changes, it is assumed that an increased frequency of extreme meteorological events will occur.
The aim of the paper is to characterize the distribution of volume changes to horizontal and vertical components in selected soil profiles in the East Slovakian Lowland (ESL) using a geometric factor. Based on the obtained results, the next goal is to verify the hypothesis concerning any effect of texture on the value of the geometric factor and thus, on the degree of distribution of volume changes to vertical and horizontal components. Within the hypothesis, it is assumed that the clay soil component has the greatest influence on the geometric factor value [
10,
11]. Results will be used as inputs for numerical simulation of water regimes of heavy soils in the ESL [
12,
13,
14,
15,
16,
17].
2. Materials and Methods
The procedure for determining isotropic soil volume expansion is based on laboratory determination of volume changes in clay-loam soil, for a precisely defined geometry of soil sample volume at the initial state of the experiment, and in the drying process under controlled conditions. Drying of isotropic soil samples is accompanied by volumes changes caused by horizontal and vertical shrinkage. Horizontal shrinking under natural conditions causes crack formations and vertical changes followed by decrease of soil surface area. From this point of view, laboratory results of studied volume changes should be interpreted for natural conditions. Previous studies [
18,
19,
20] have mentioned one possible approach.
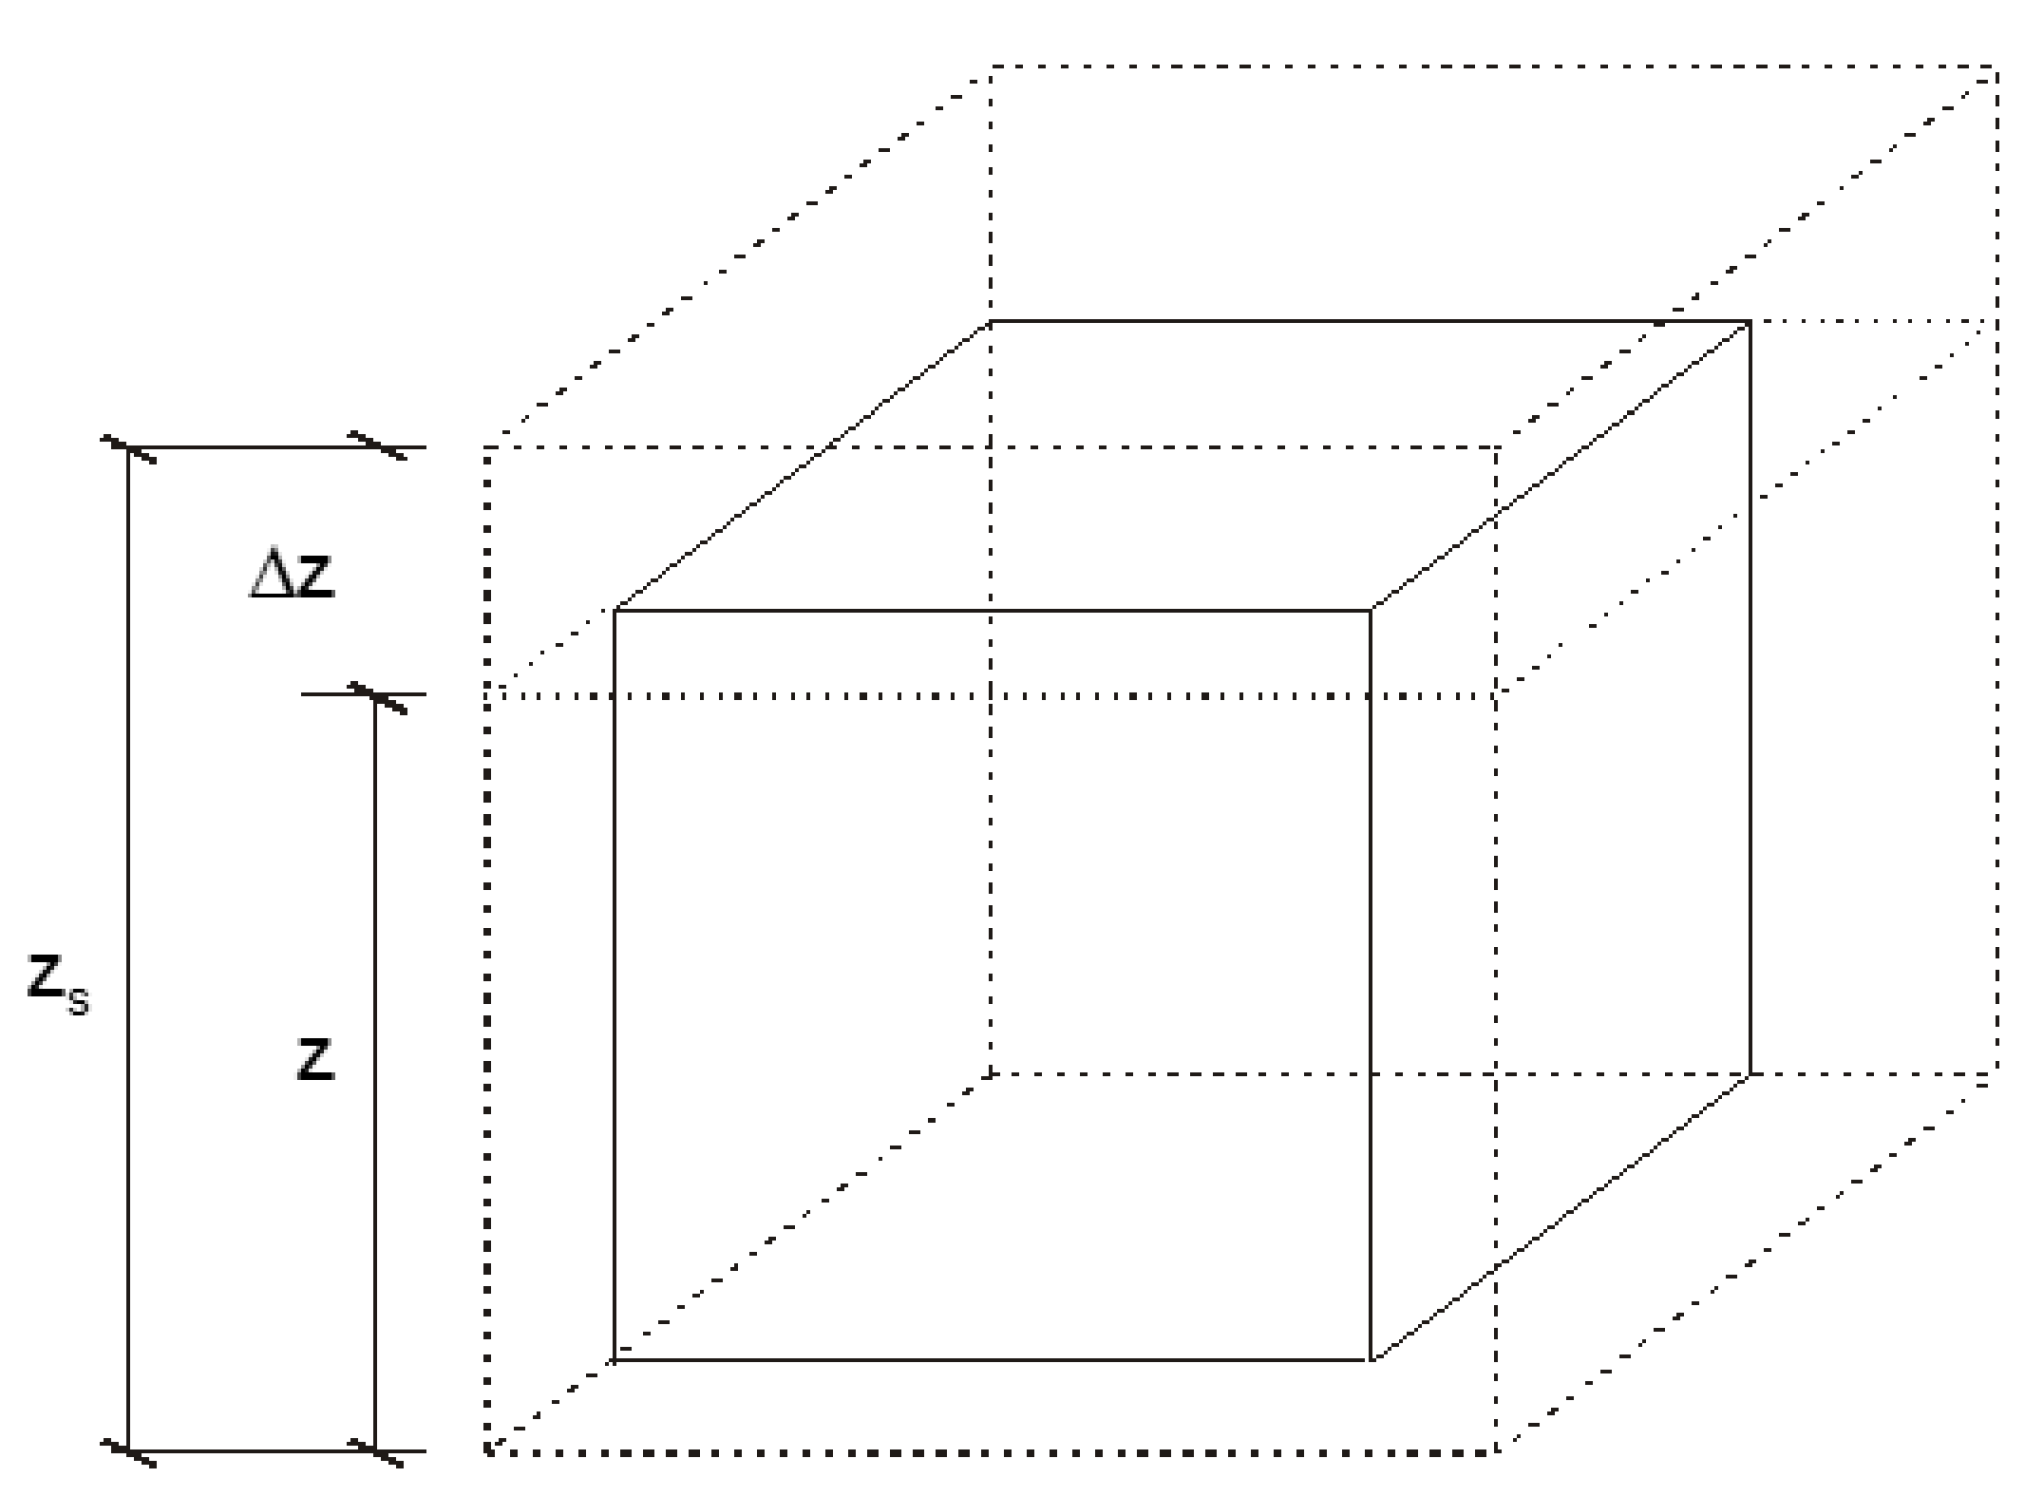
Figure 1 is a plot of soil sample saturation in the form of a cube with an edge length,
zs. Soil sample saturation is represented by a broken line. Its volume is
. After isotropic shake, the saturated sample is reduced by volume
per cube, as per
for edge length and volume
. Based on the above, it is possible to formulate a relationship
On the basis of Equation (1) and
Figure 1, it is possible to deduce the relationship between volume change of sample and change in sample height, i.e., by changing the volume in the vertical direction and in the horizontal plane.
For most soils in natural conditions, according to Equation (2), it is possible to consider isotropic shrinkage. Therefore, it is possible to substitute a the geometric factor
rs for 3 without greater loss of accuracy. We can then present a generalized version of the equation in the form
Mathematical expression of the relationship between volume change of sample and its vertical decrease can then be expressed in the form
Total change in soil volume is represented by Δ
V = Δ
Vv + Δ
Vh, while Δ
Vv =
Δ
z. From the above and from Equation (4), the relation follows
In accordance with Equation (1), Equation (2) can be interpreted as follows. In the case of shrinking without cracks, rs = 1. In the case of crack formation and without decrease, rs → ∞. For all other cases, for formation of drained cracks and a surface decrease, occurring simultaneously, the following values are distinguished: rs = 3 for isotropic shrinking; 1 < rs < 3, while vertical movement is more prevalent than horizontal shrinking. If rs > 3, then the formation of cracks is more prevalent than vertical movement.
Considering that during the drying, the change of sample height in the direction of the vertical axis of sampling is measured, and volume of soil sample saturated by water, and volume of dried soil sample is measured also, it is possible to calculate the geometric factor
rs from Equation (4). By adjusting the equation, we get a relationship for calculating the geometric factor in the following shape.
From Equation (5), based on these theoretical considerations and experimental field and laboratory measurements, the geometric factor of volume expansion was determined as a quantifier of the distribution of total volume changes to horizontal and vertical components.
Another part of this research consists of two stages. In the first stage, rs values were quantified for characteristic profiles on the ESL. In the second stage, the correlation between values of the geometric factor and content of clay (rs < 0.002 mm), dust (rs = 0.002–0.050 mm) and sandy particles (rs = 0.050–2.000 mm) in soil were investigated. Investigated soil layers were classified in terms of isotropic volume changes.
To assess this correlation, models that best describe the tightness of correlation relationships were selected. As a criterion for selecting a model, the correlation coefficient value was used.
In addition, the relationship between has been shown, based on measurements of and Equation (6).
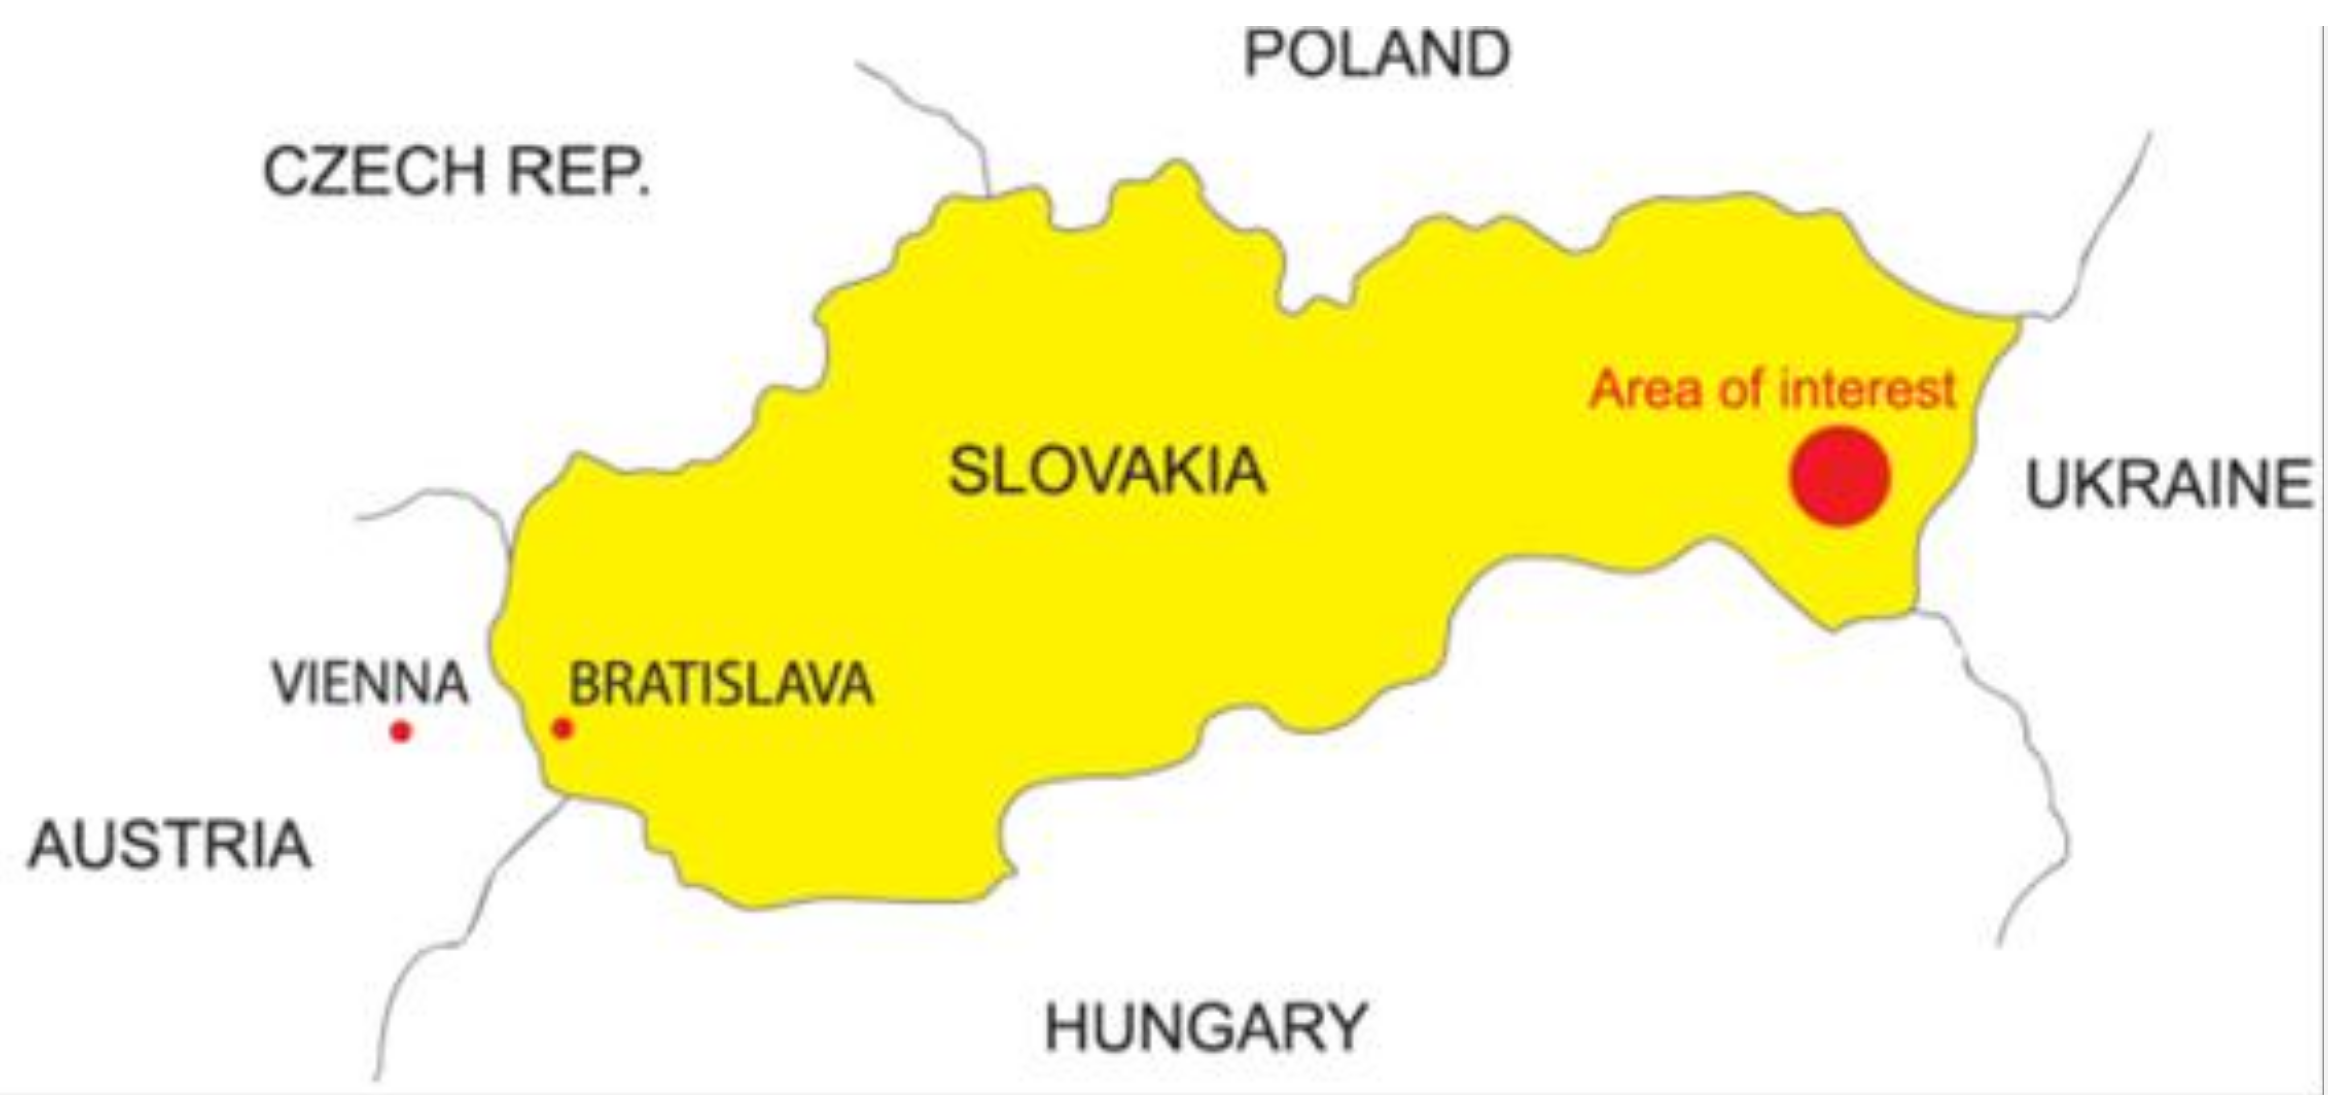
Measurements were made on the ESL in 11 sampling profiles from 10 different locations, the location of which is shown in
Figure 2. Sampling points were selected to characterize the soil environment of the ESL. As part of the fieldwork, intact soil samples were taken by the swab probe method and placed into collecting rollers. The volume of withdrawal rollers was 100 cm
3 with a diameter of 5.6 cm. The geometric dimensions of soil samples during shaking were measured by a micrometer. The size of shrinking versus percentage saturation for Michalovce is shown in
Table 1, in the last column on the right. The largest measured volume changes were around 40%. Soil samples were saturated under laboratory conditions to full water capacity, and after measuring their geometric dimensions, were dried at 30 °C gradually until the weight changes were approaching the measurement error. The last drying was carried out at 105 °C. All necessary data for calculating the variables of Equation (7) were obtained by measuring the geometric dimensions of the soil samples after drying. Soil samples were taken at depths of 0.10 m to 0.80 m at all locations except the Milhostov site. At the Milhostov site, samples were taken from depths of soil up to 1.60 m.
3. Results
The results of the measurements and calculations were divided into two parts in accordance with the methodological procedure. In the first part, geometric factor values were quantified. In the Michalovce profile in
Table 1, the values of the soil sample volume changes, and values of the geometric factor
rs, are shown. In
Table 1, for three successive layers of 0.1 m intervals, the height of the water-saturated rollers, their saturated volumes and these values after drying, are given. For each measurement, a calculated value of
rs and then an average value of the geometric factor for each layer are calculated, according to Equation (7). From
Table 1, percentage volume change, and change in vertical dimension (Δ
z) of individual samples, as well as their average values in each layer, are obvious. In
Table 2, each layer of each collection site is characterized by texture composition. All eleven sites were processed analogously.
Table 3 summarizes values of the geometric factor in all eleven investigated soil profiles. The table also shows coordinates of individual field profiles. Results indicate that, in the examined profiles, volume change predominantly results in the formation of cracks (
rs > 3.0). Only in Senné was an isotropic shrinkage identified (
rs = 3.0). In two profiles, the predominance of vertical movements over crack formation was identified (Kamenec (2.8), Somotor 2 (2.3)). The highest value (
rs = 13.0) was identified in the locality of Vysoká [
21]. Vysoká also had the highest variation range. The lowest value (
rs = 1.7) was found in Somotor 2.
The second part of this research focused on a correlation analysis between the values of the geometric factor and the components of the texture of the soil samples. In addition, the shape of dependence between rs and Vh is shown based on volumetric measurements.
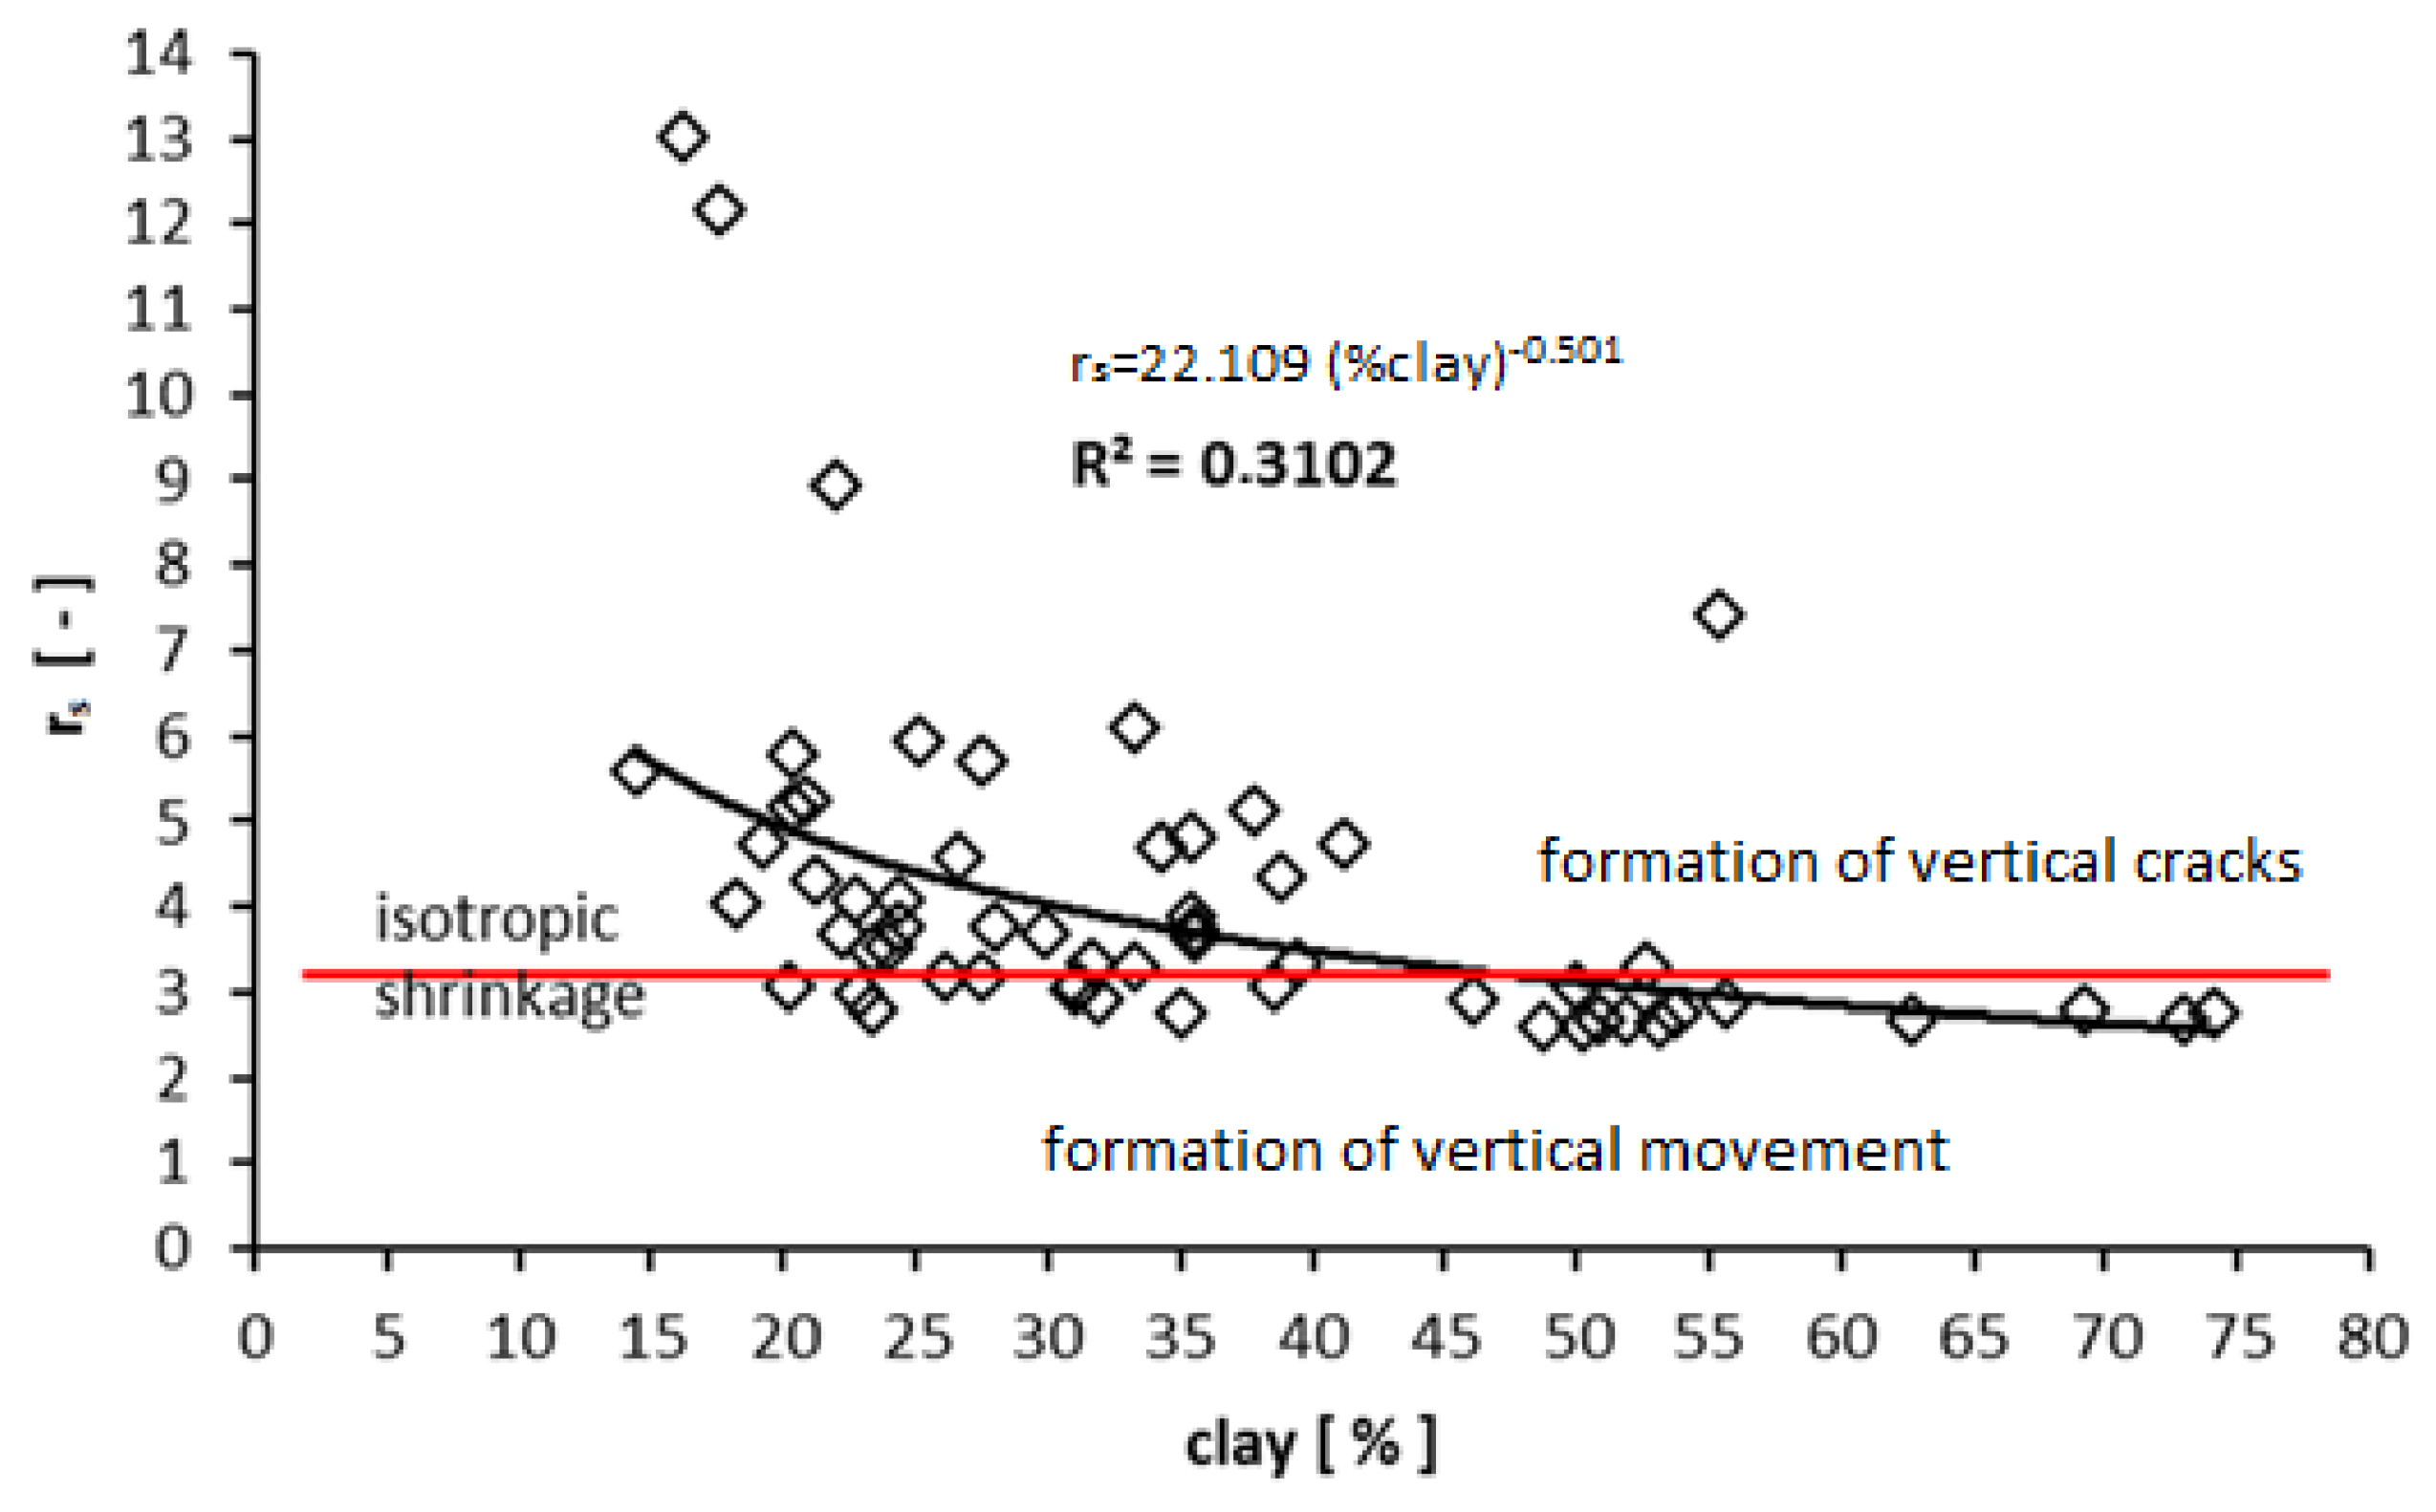
Figure 3 represents an analysis of the effect of the clay particle fraction, which is represented by a particle fraction of <0.002 mm for the geometric factor values. The geometric factor in this case is the average value of soil layers from which soil samples were taken for grain analysis. The effect of the content of clay particles on
rs is obvious from this picture. In this case a correlation was identified
R = 0.56. The result can be interpreted as a significant influence of clay content in soil on the geometric factor, and on the distribution of total volume change to vertical and horizontal components. The figure shows that clay, and clay soil (45% to 55% clay content), are isotropic in terms of volume change. In addition, vertical movement slightly outweighs horizontal plane movement with an increase in the clay content of soils, and the variability of this movement decreases. The geometric factor oscillates slightly below the isotropic boundary. As the proportion of clay in soils decreases, the variability of
rs is significantly increased.
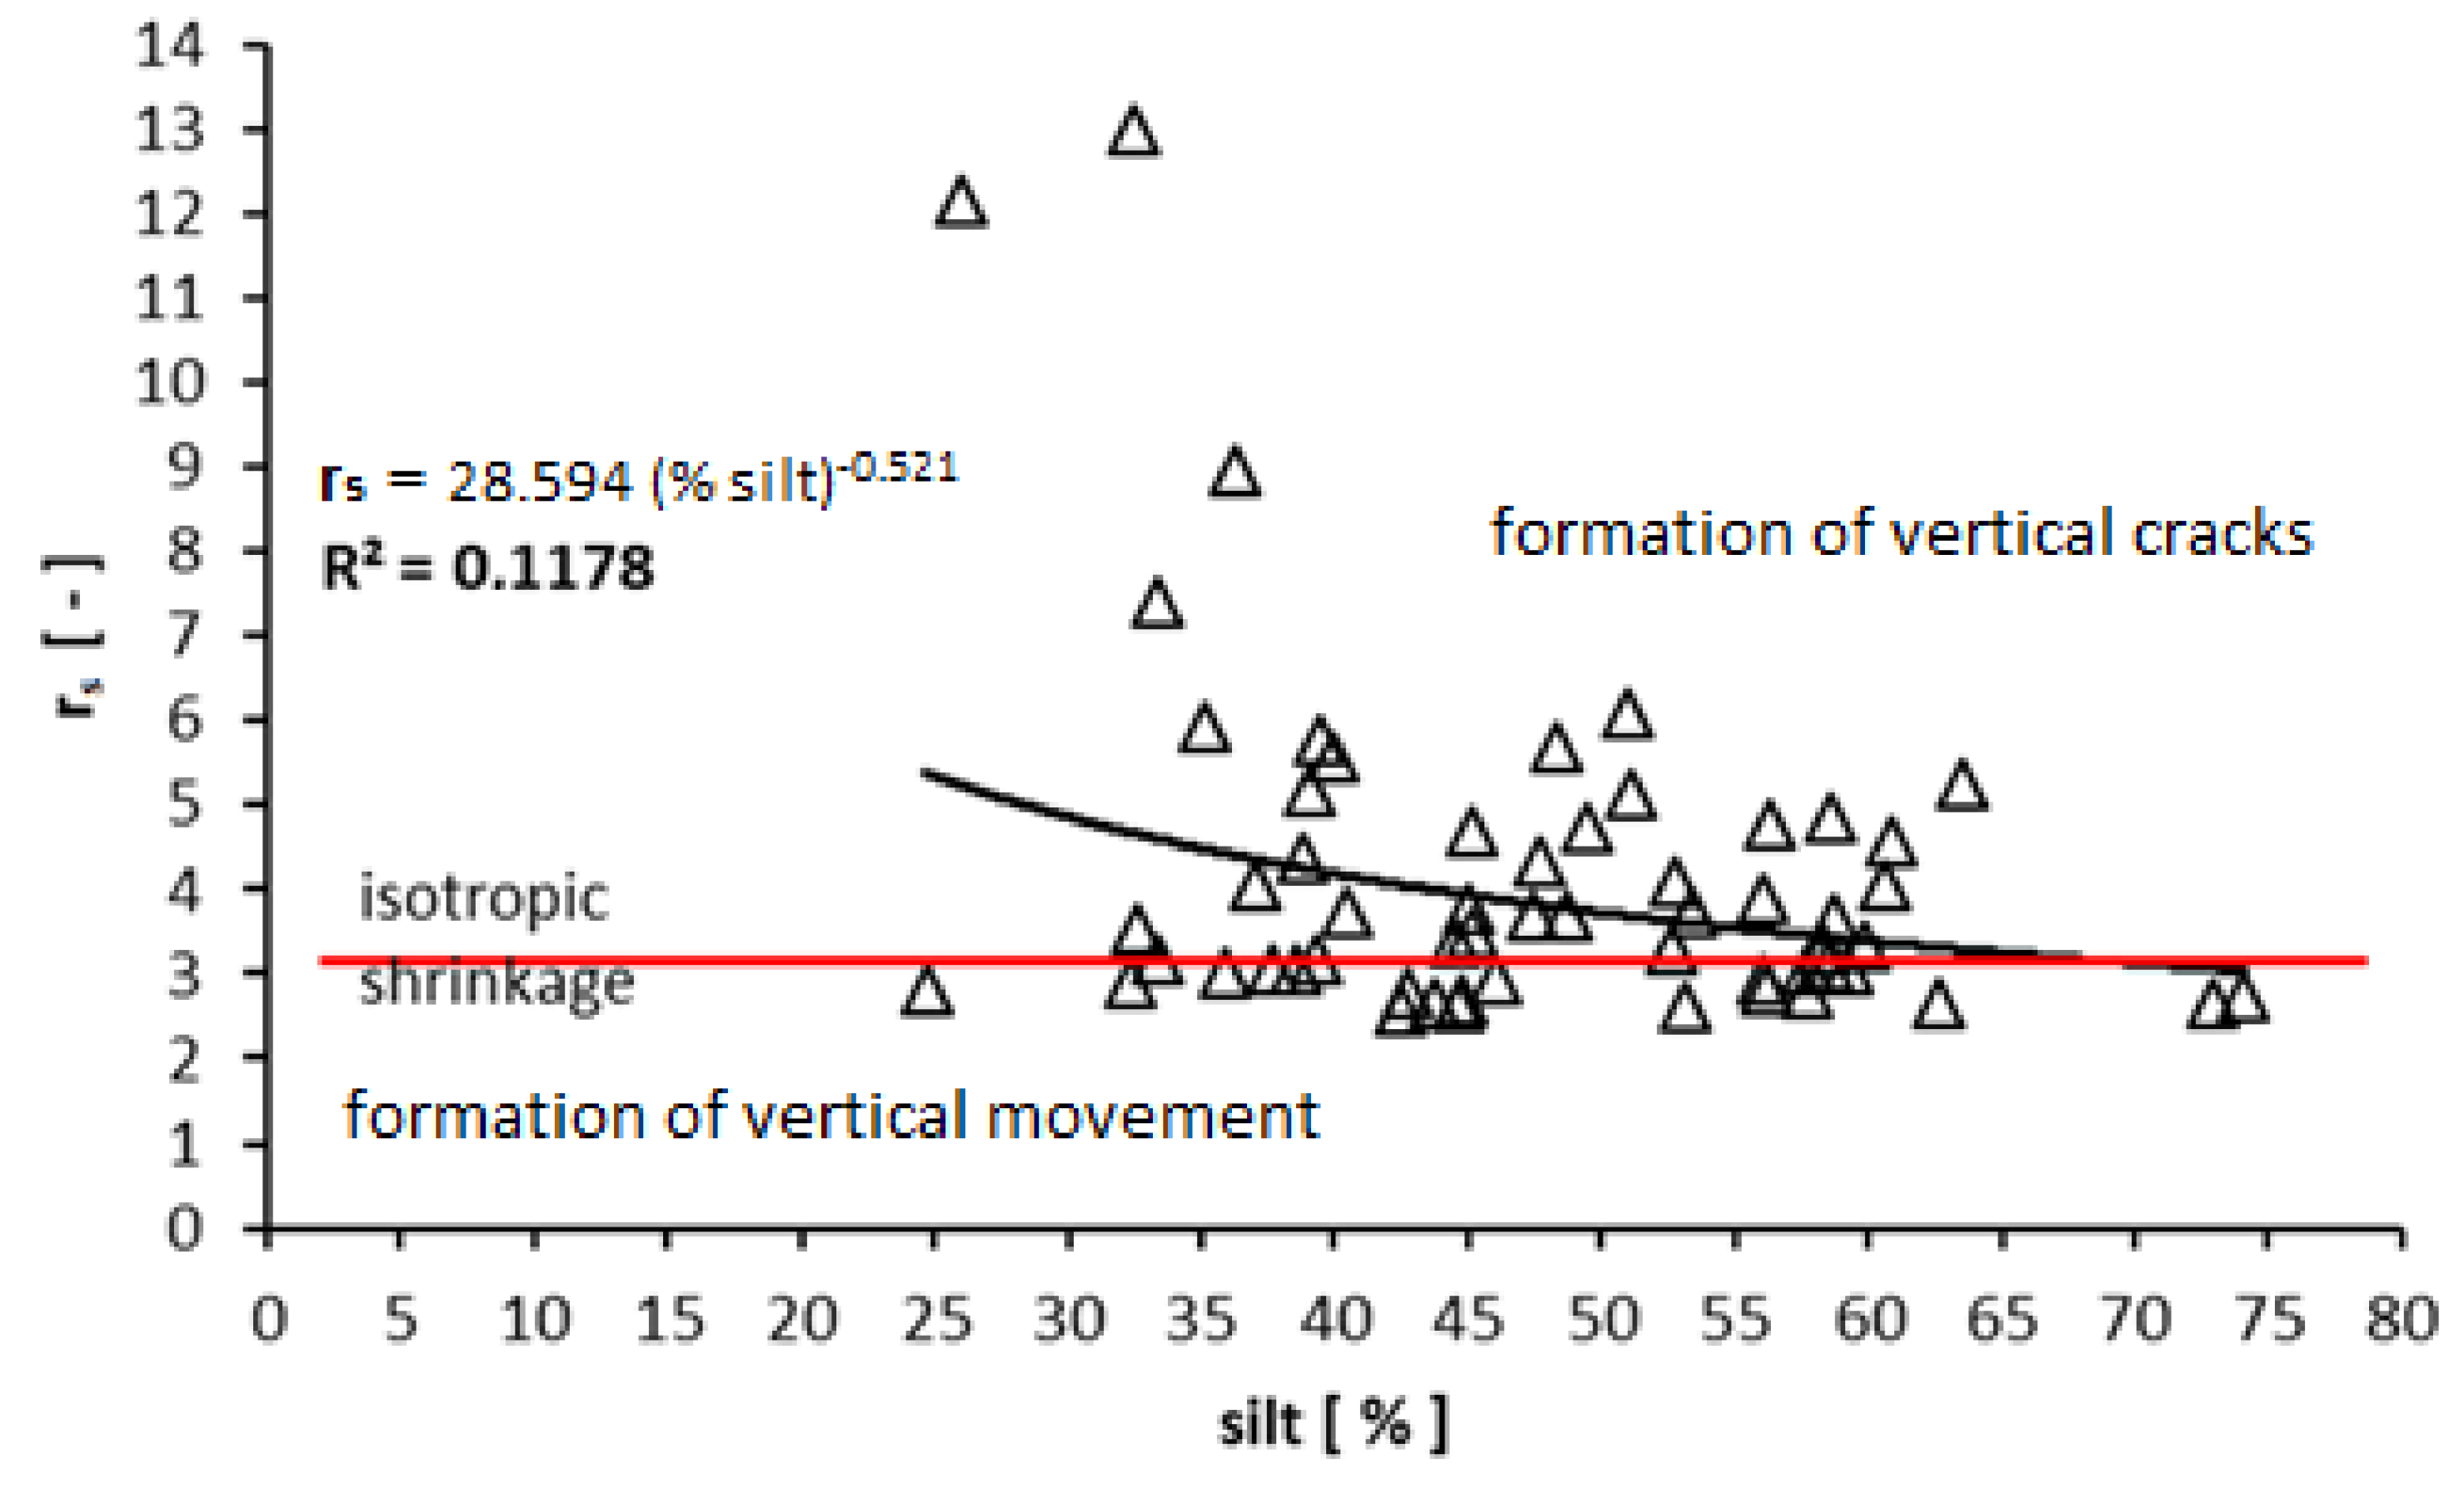
Figure 4 shows the relationship between
rs and silt particles in the soil samples. The Correlation coefficient,
R = 0.34, is insignificant. The greatest variability of
rs was found to be between 30 and 40% for silt particles. Increasing the particle ratio caused the variability of
rs to decrease, and
rs values tended to approach the value of “3” from above, i.e., to the value of isotropic volume change.
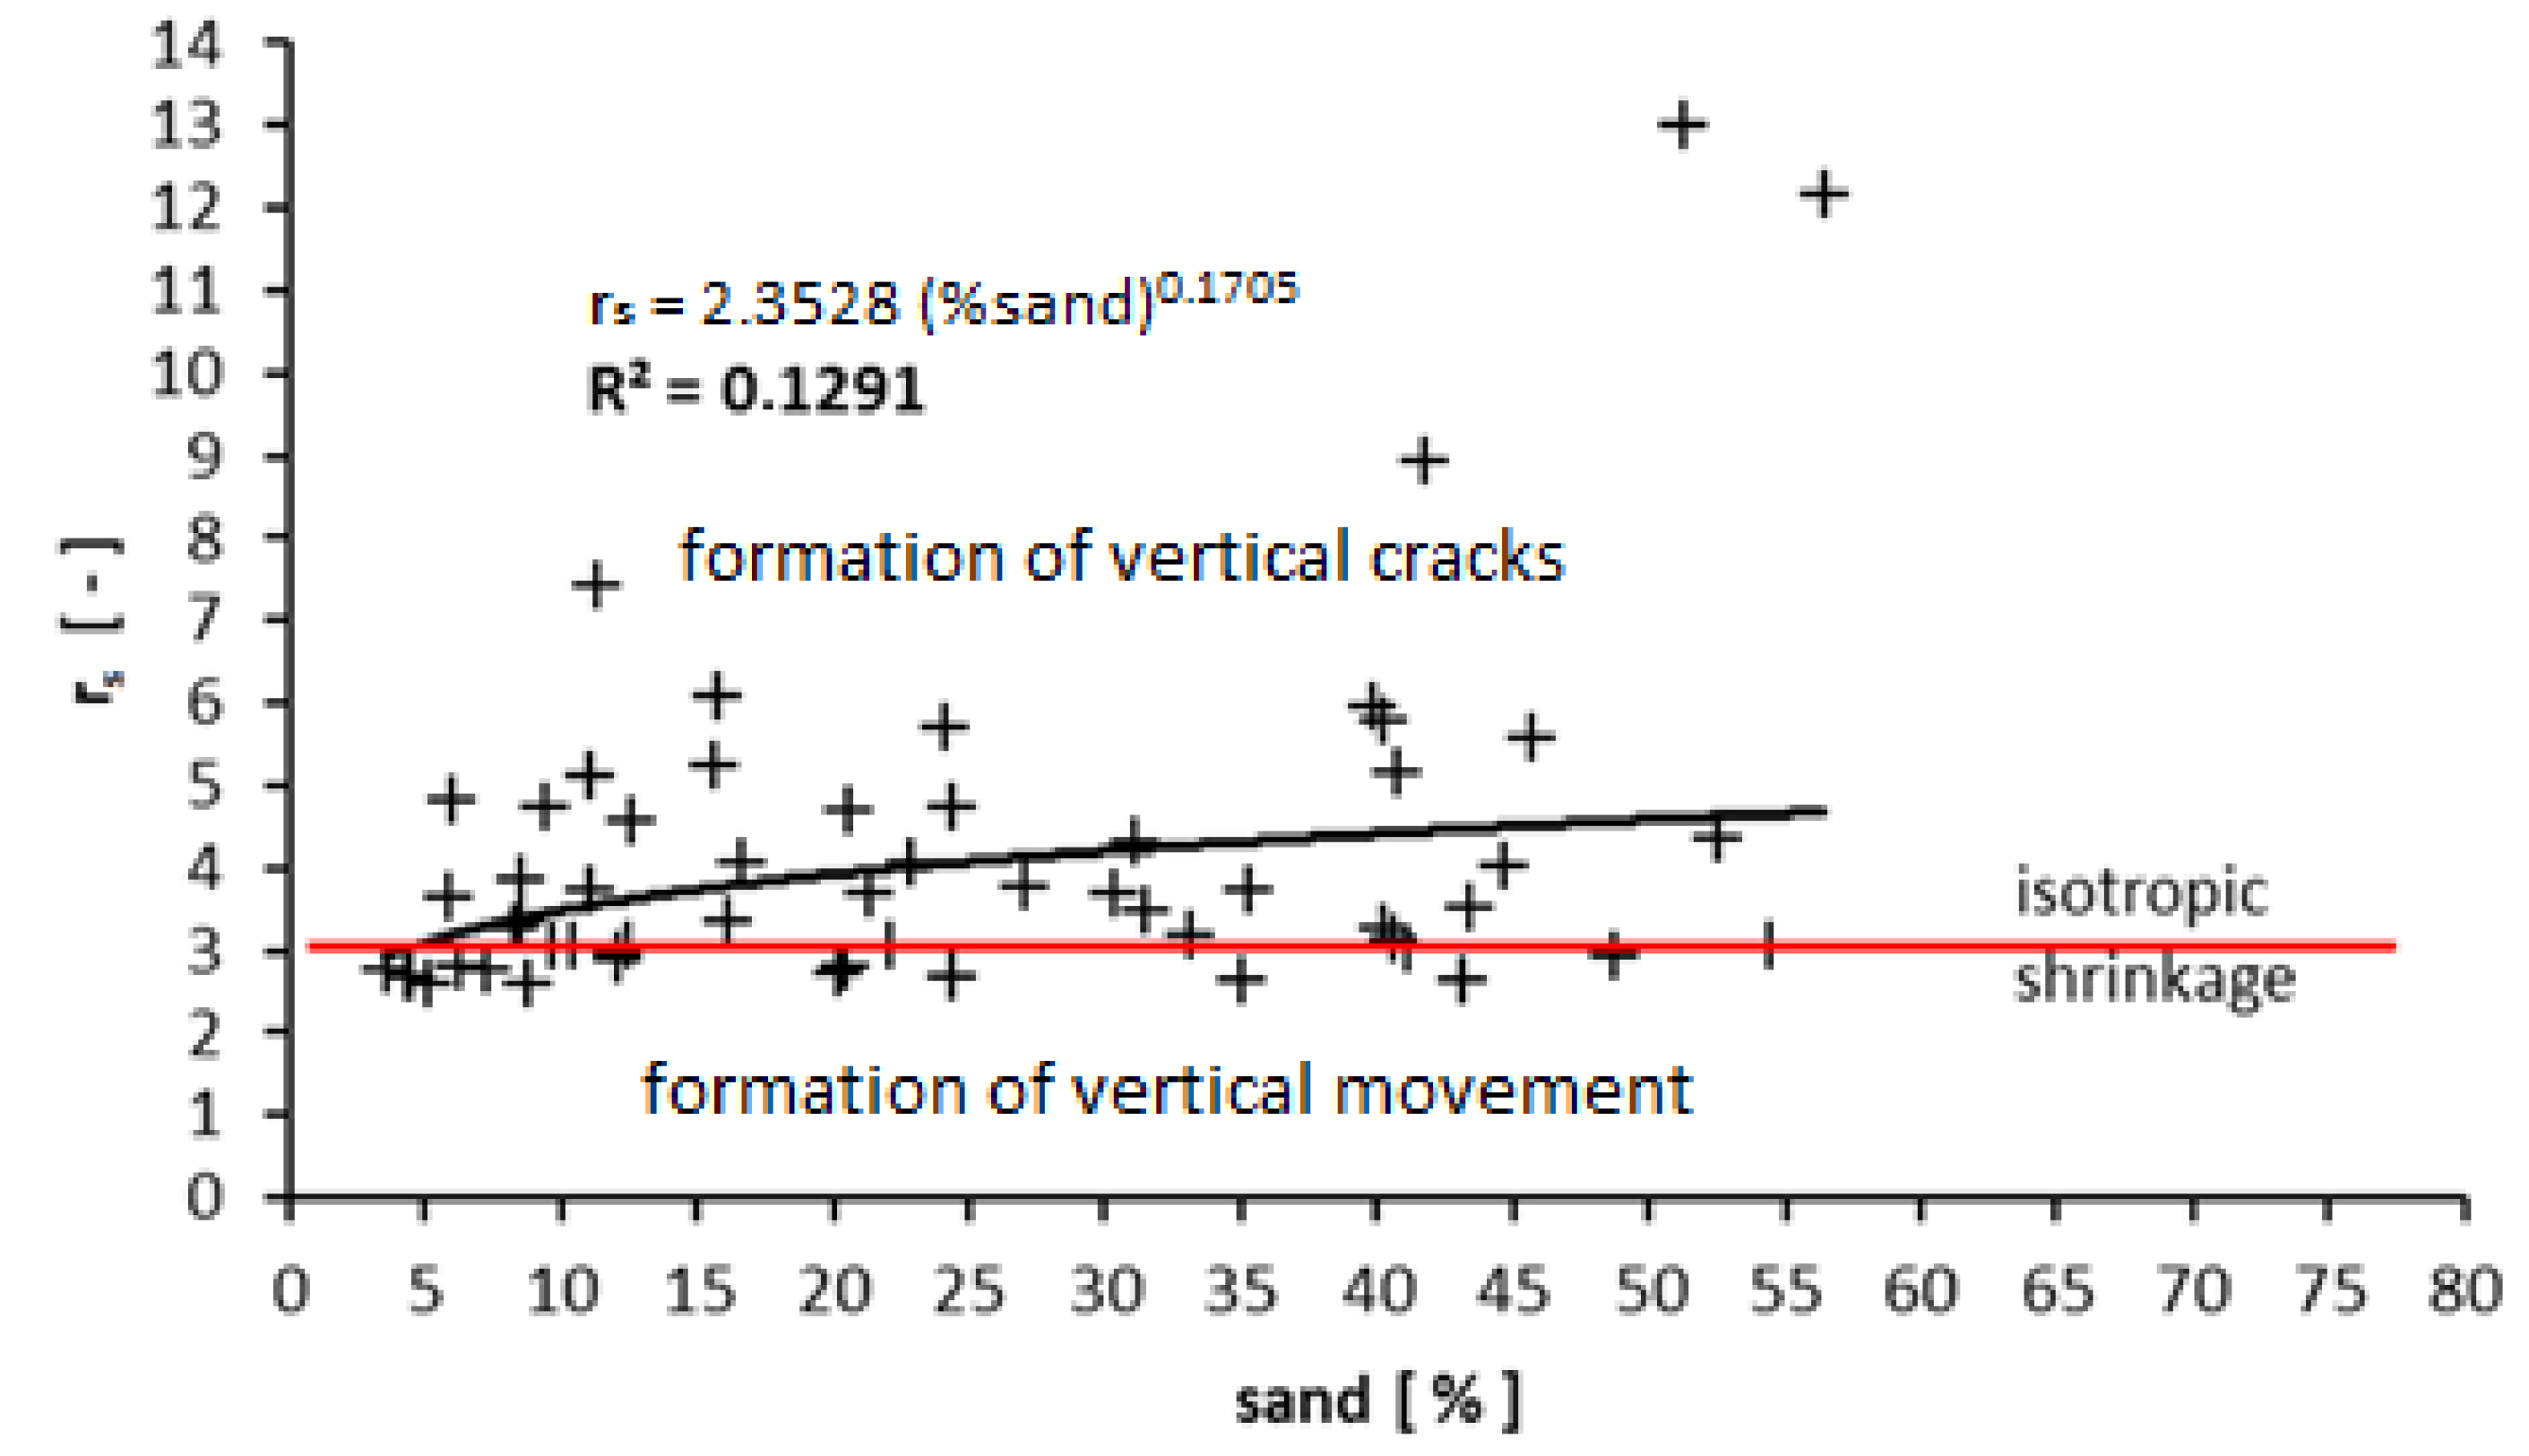
Similar results are documented in
Figure 5. Here, the relationship between
rs and the sand content in soil can be seen. The correlation coefficient of
R = 0.36 is insignificant. The difference between the sand content in soil and silt content in soil, is the evenly distribution of sand content variability. The sand content trend in soil, increasing with the geometric factor, is opposite to that of the silt content in soil, which decreases with an increase in the geometric factor. In both cases, the
rs values oscillate around the isotropic shrinkage value, or are higher than the isotropic shrinkage value.
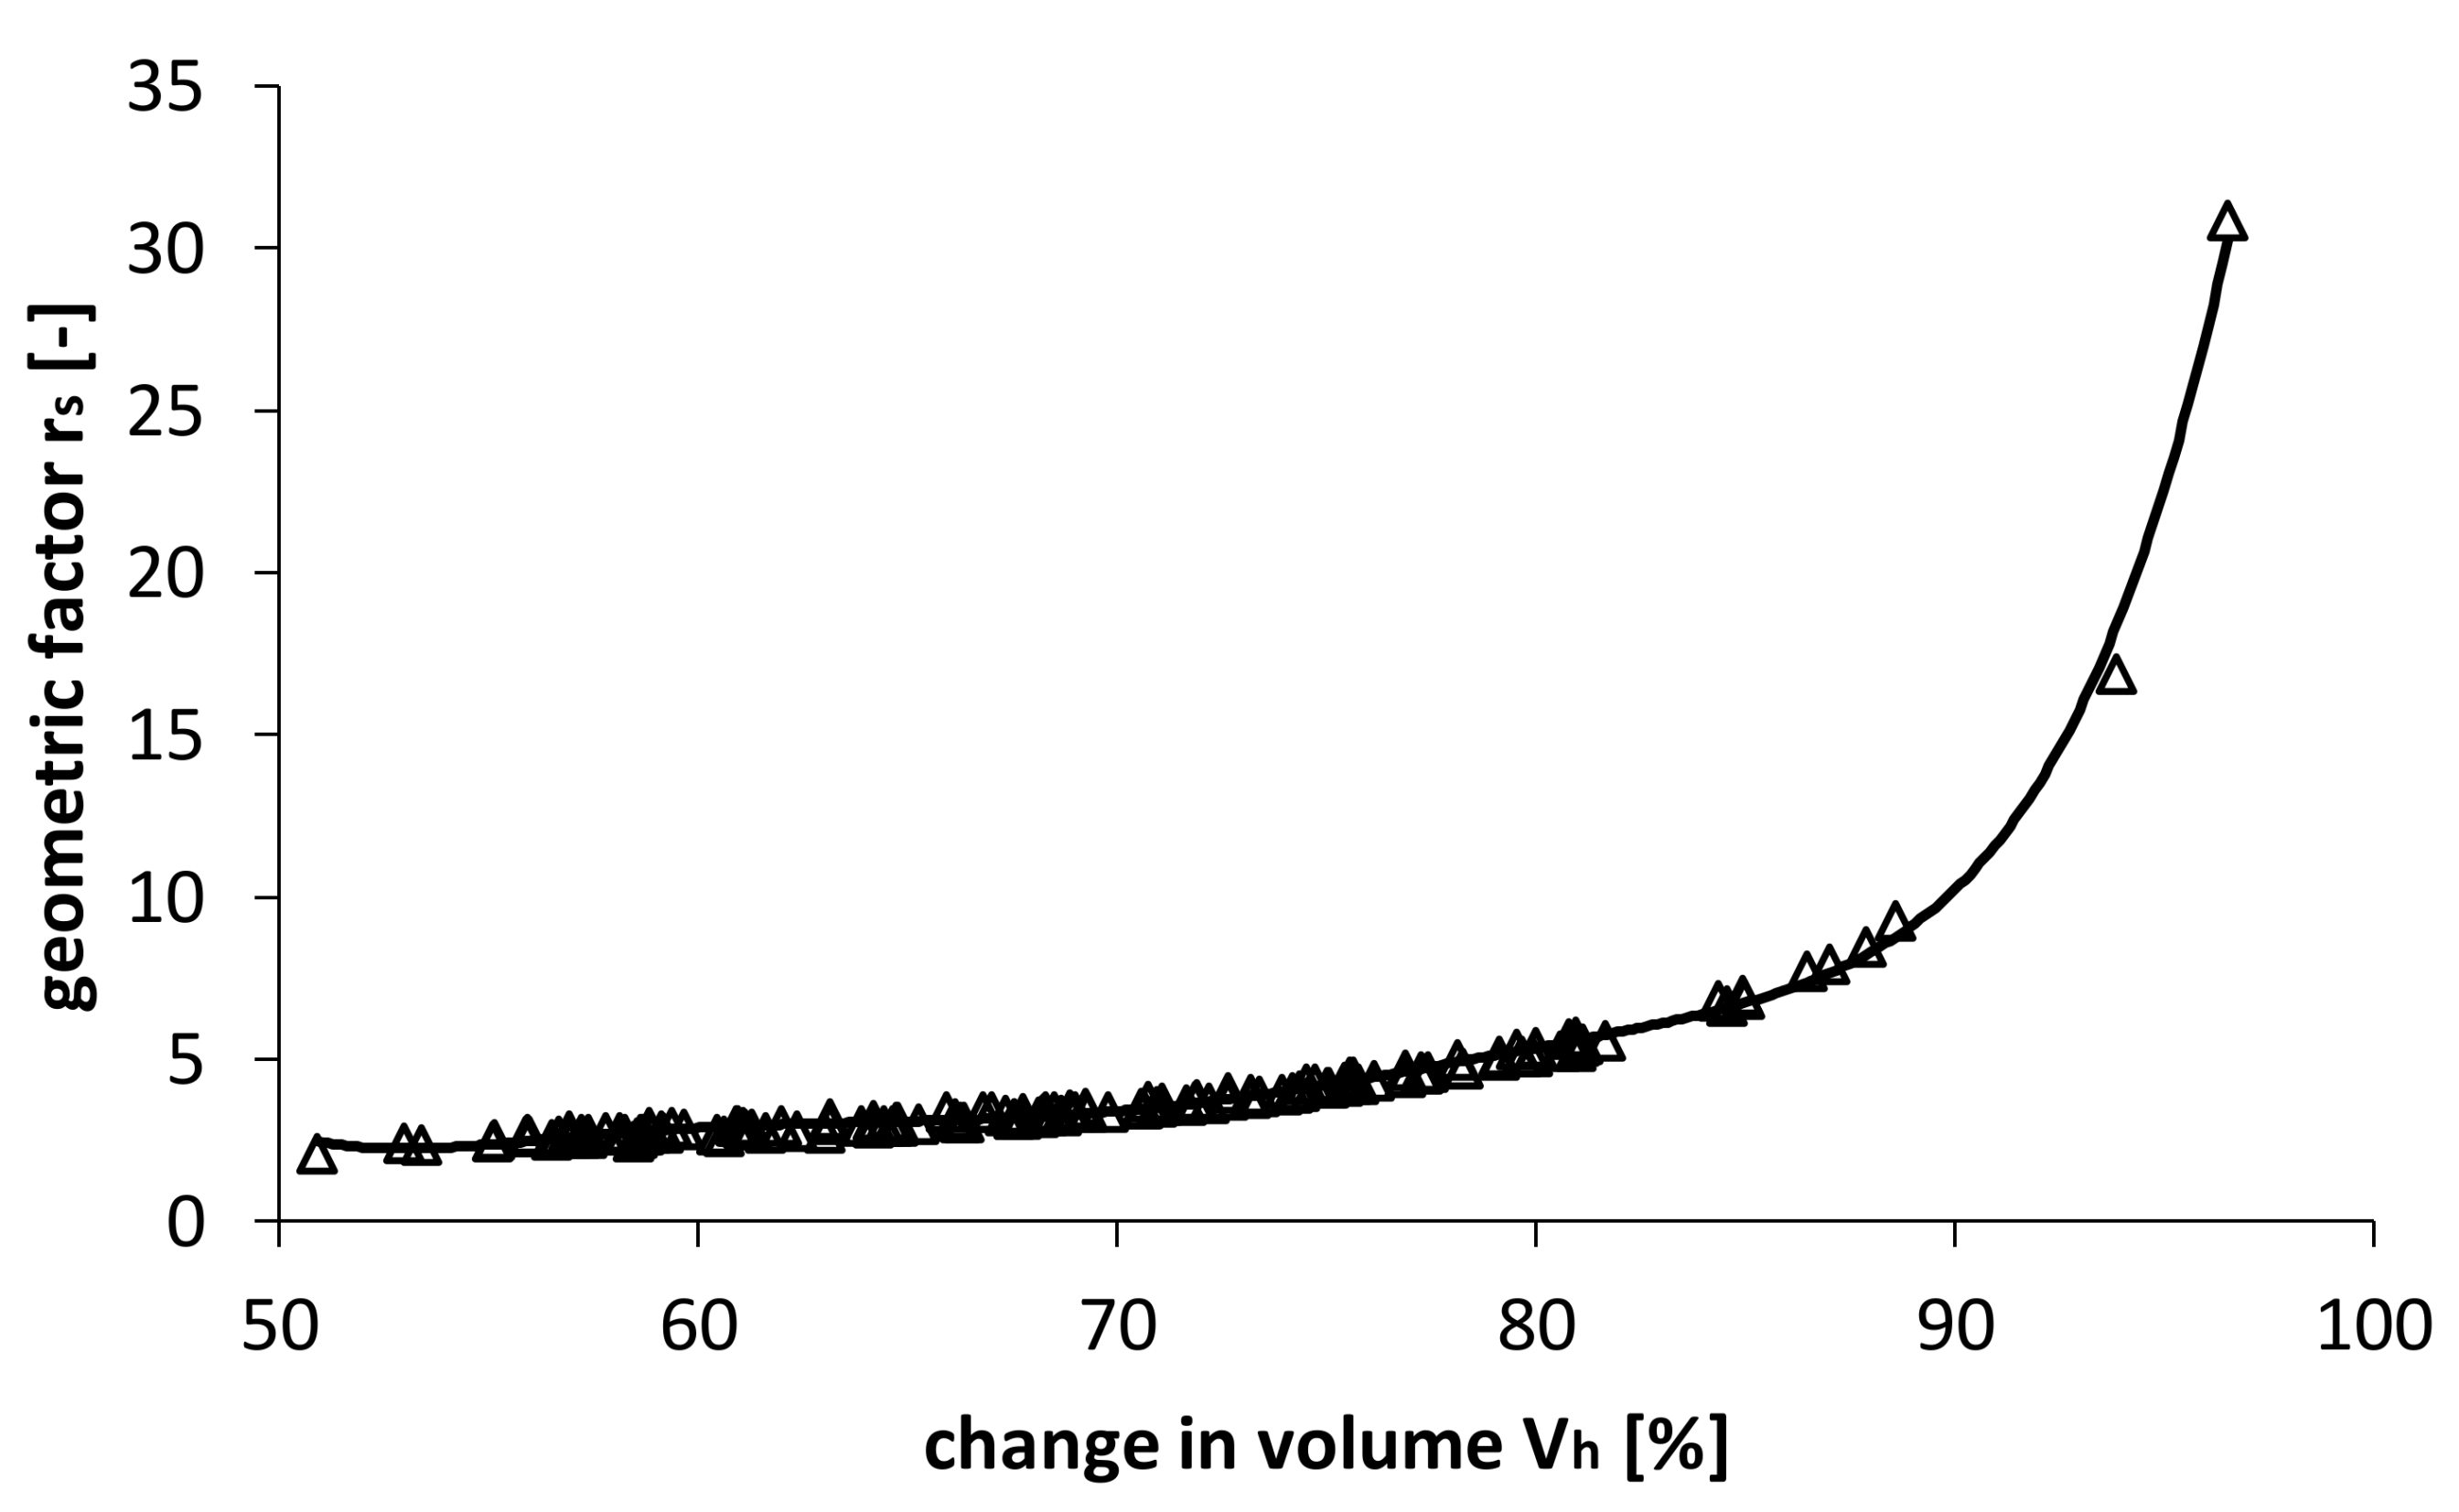
Figure 6 shows the relationship between the volume change in the horizontal direction
Vh, and the geometric factor,
rs, with the volume change
Vh being expressed as a percentage of the total measured volume change. The graph shows the effect of the geometric factor on the behavior of volumetric changes and their distribution to horizontal and vertical components. With an increase in
rs, more of the total volume change is due to the horizontal component.
4. Discussion
There may be several causes of the observed anisotropy of soil, when its volume was changed. It can be assumed that this is due to inequalities that occur in sedimentation processes, and the inhomogeneity of clay minerals that are sources of volume changes in soils. The primary condition causing volume change, is the presence of clay minerals and water. Crystals of clay mineral are composed of platelet formations (consisting of silicon tetrahedra and aluminum octahedra) ranging from 1 (montmorillonite) to a theoretically unlimited number (kaolinite). Individual plates have a very small valency (0.5–1.0 nm) and a high specific surface area (15 m2·g−1—kaolinite, 80 m2·g−1—illite; 800 m2·g−1—montmorillonite). The size of the specific surface of these plates is closely related to the size of the volume changes. The larger the specific surface, the greater the ability to swell. The surface of the clay mineral plates carries a negative electrical charge that can attract water molecules. Consequently, with the increasing the surface area of clay mineral crystals, the more water molecules can bind. With an increasing water content, swelling of such a clay occurs. Drying will return the clay to its original volume. The abilities of individual minerals to assimilate water into their structure, and thus increase their volume, are different. Kaolinite clays are relatively inactive (they have low ability to bind water), illite clays have low to moderate swelling ability, and montmorillonite clays are highly expansive, and in their pure form (under laboratory conditions), can change volume by 1400–2000% (Na-montmorillonite). Pore size and pore distribution in soil is another factor influencing volume change. Presence of organic components in soil may also have a significant effect on volume changes.
Under natural conditions, clay minerals do not occur in pure form but in mixed structures. Therefore, it is necessary to know the species composition of clay minerals for a detailed assessment of these processes. Their determination is difficult. Information on the species composition of clay minerals is insufficient for the ESL.
For these reasons, further research on the ESL should aim to determine the species composition of clay minerals in characteristic soil species. These findings will help to avoid possible mistakes in determining cracked porosity based on physical clay content. This is the reason for paying increased attention to identifying the species composition of clay minerals in the soils of the ESL.
In this context, it is necessary to be aware that the amount and distribution of volumetric changes to horizontal and vertical components also have an indirect influence on the presence of silt and sand in soil. The representation of any of the textural components of clay, silt and sand, is a linear combination of the remaining two, provided that the granularity is accurately determined. If one of them is increased in soil, the remaining two are reduced. Silt and sand do not cause volume changes, but the increased soil content reduces clay content and volume change. This creates an inhomogeneous environment in terms of volume change and the associated geometric factors. The anisotropy of volume changes increases followed by the increased variability of the geometric factor. If there are large amounts of silt and sand or a reduction in clay, then soil is lighter and volume changes disappear, respectively. These changes are not measurable. With an increase in clay content and a decrease in silt and sand content, volume changes begin to display characteristics of isotropic shrinkage, i.e., rs = 3. With isotropic shrinkage, the impacts of silt and sand gradually disappear. Changes in rs across the vertical soil profile may be related to an increase or decrease in soil clay content. This is common under the ESL conditions. This may be associated with the impact of superficial soil layers. Sedimentation processes can have a significant impact on the anisotropy of volumetric changes and changes in the geometric factor, rs, across vertical soil profiles in lowland conditions. This is especially true when platelet clay particles are predominately oriented in one direction.
The degree of influence of individual grain fractions on the geometric factor is related to the size of the grains and the pore size. The smaller the particles in the porous material, the more homogeneous it is, and the value rs approximates or oscillates around the value “3”. The upper limit of clay particle size (2 μm) is 25 times smaller than the upper limit of dust particle size (50 μm) and 1000 times less than the upper limit of sand particle size (2000 μm). These variation ranges cause rs to deviate from the value “3”, i.e., to deviate from isotropic shrinkage and thus increases the variability of rs.
5. Conclusions
In this paper, values of the geometric factor,
rs, were quantified in characteristic soil profiles. Based on this, soil profiles were evaluated for the distribution of volume changes to horizontal and vertical components. In one case, isotropic volume changes were identified in Senné. This was the locality with the highest content of clay minerals of all investigated localities. Vertical volume changes dominated in two locations. In the remaining eight locations, horizontal volume changes dominated, i.e., crack formation and thus the formation of a two-domain soil system (crack and soil matrix) [
22,
23,
24,
25]. Summaries of the results are shown in
Table 3.
The effect of texture on the geometric factor was analyzed. A high correlation between measured horizontal volume changes and the geometric factor has been demonstrated. The results are graphically shown in
Figure 3,
Figure 4,
Figure 5 and
Figure 6. All results were obtained from experimental measurements in the field and in the laboratory.
To focus further research on this subject area, we recommend paying increased attention to identifying the species composition of clay minerals in the soils of the ESL.
The results of this analysis will be used for numerical simulation of the water regime and its prognosis under heavy soil conditions in the ESL.


