Use of Water Balance and Tracer-Based Approaches to Monitor Groundwater Recharge in the Hyper-Arid Gobi Desert of Northwestern China

 , , and
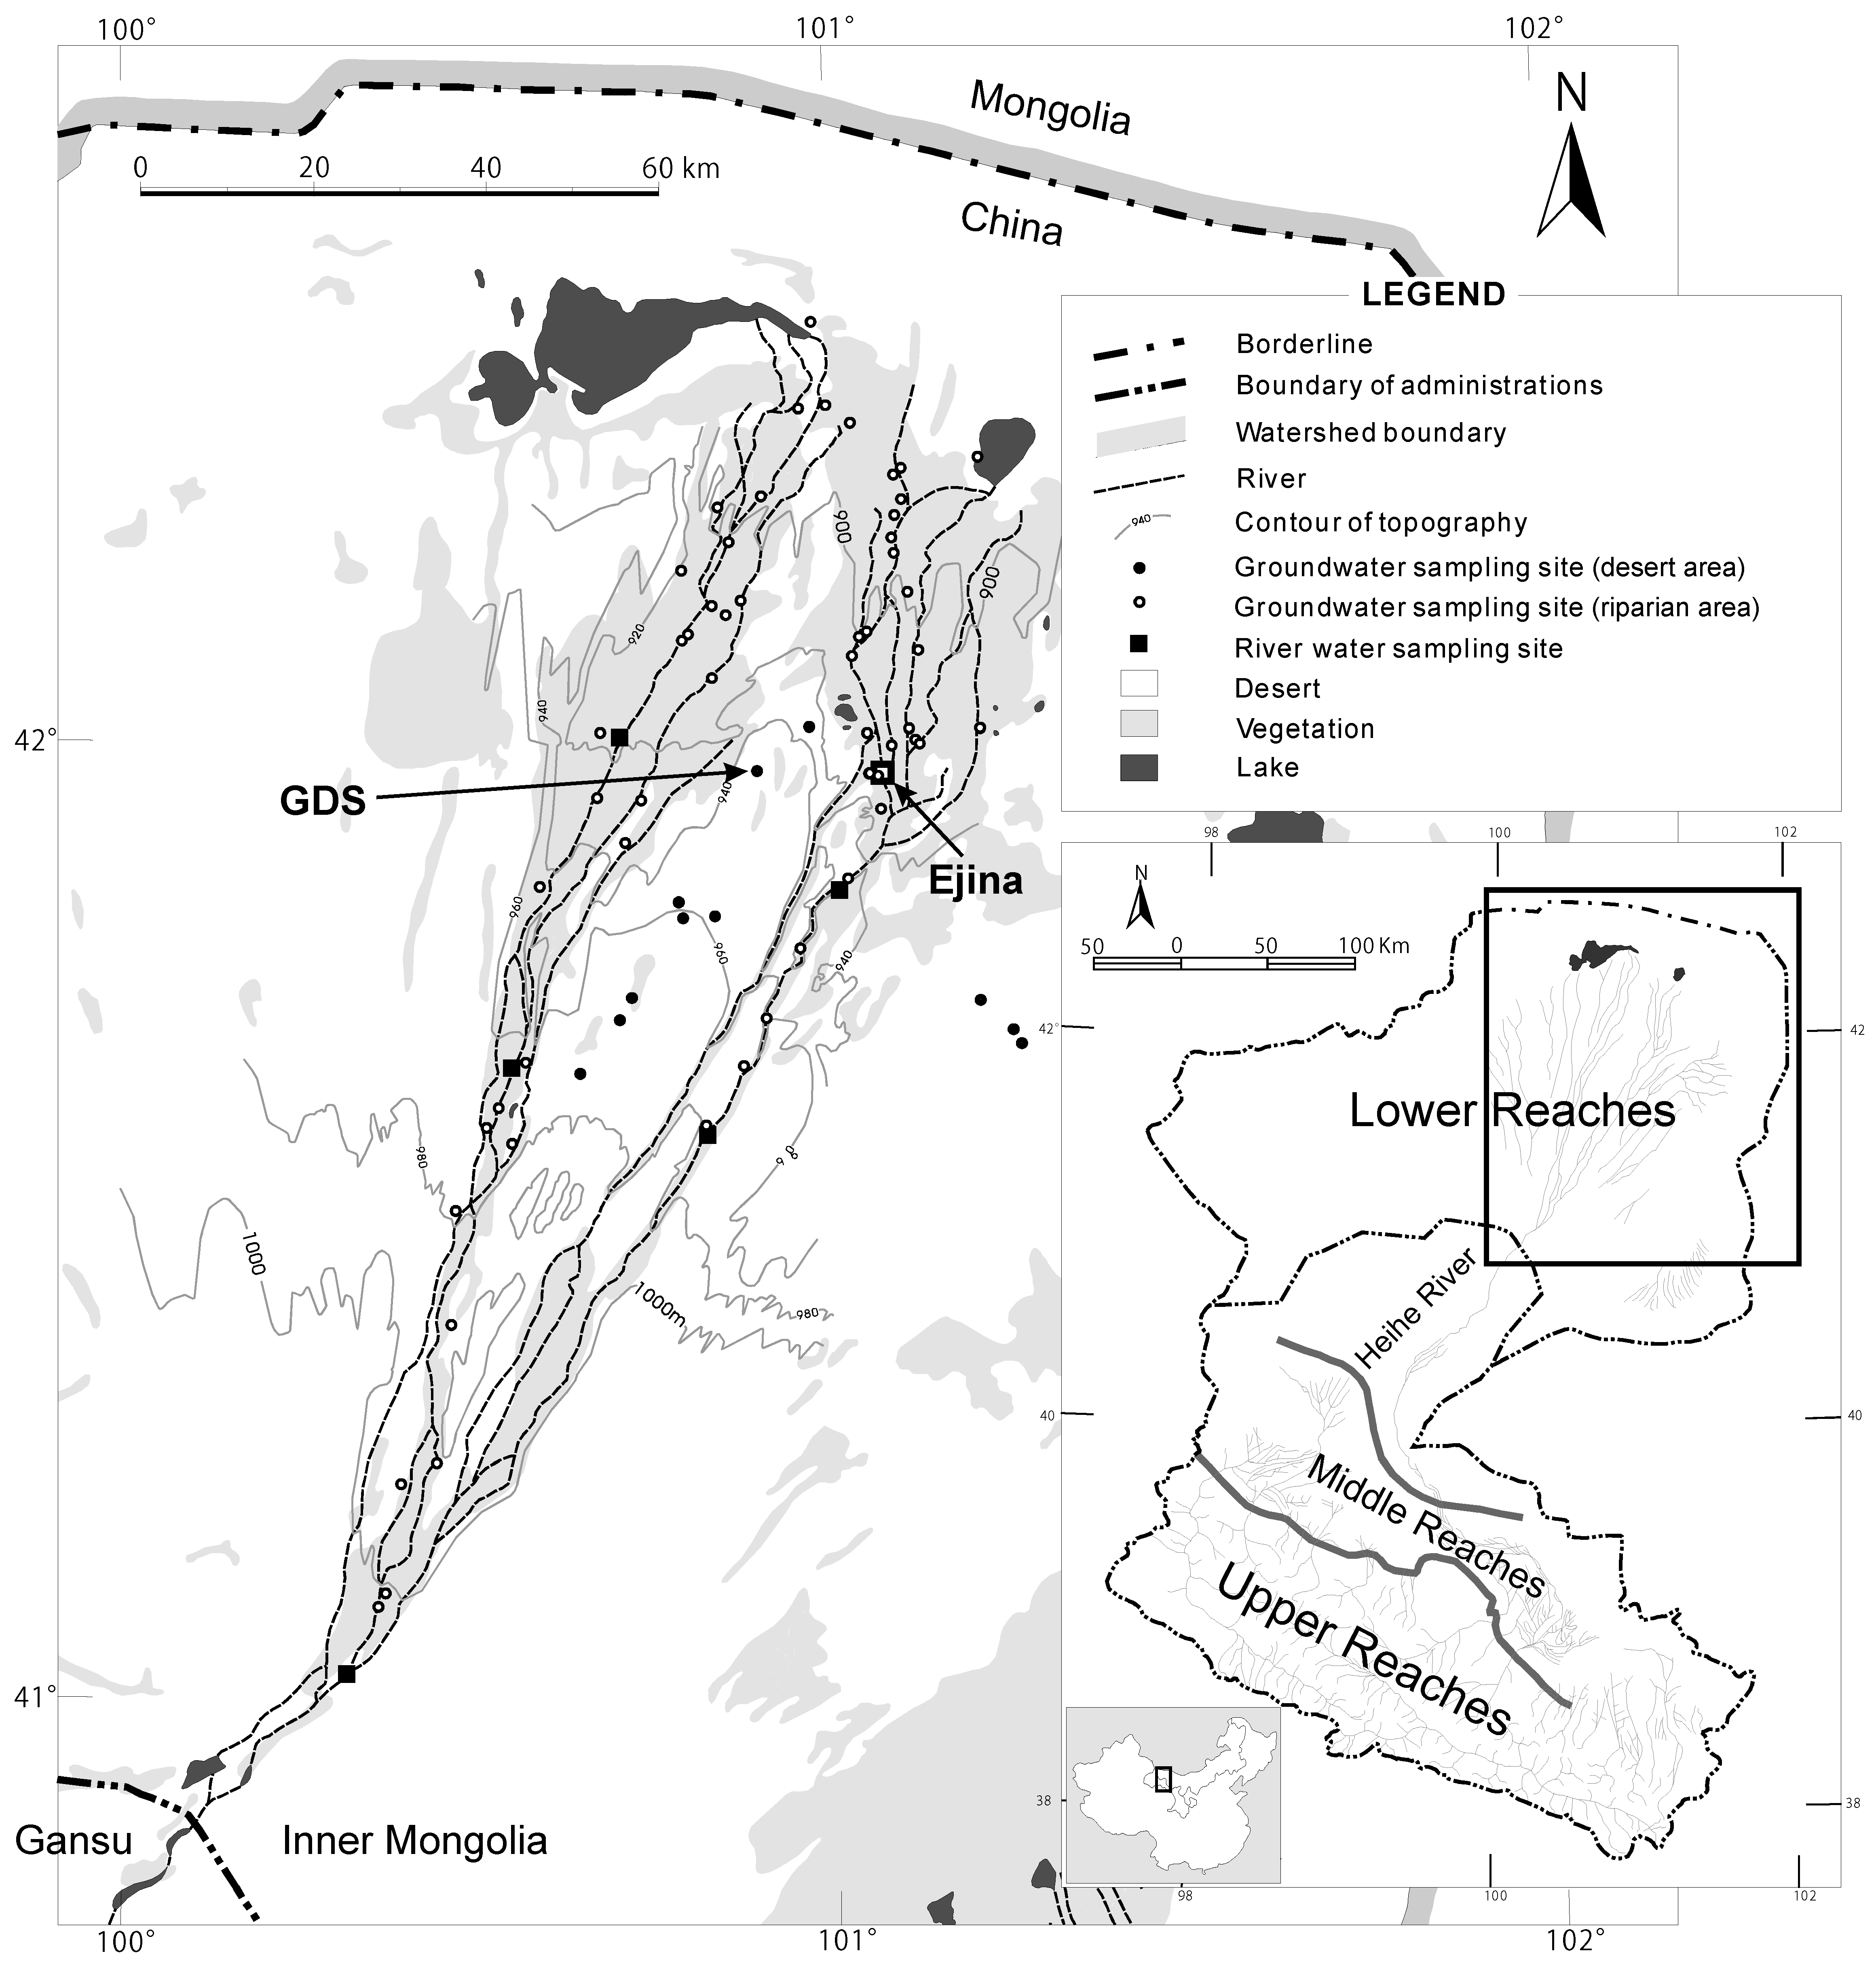
Abstract
:1. Introduction
2. Study Area
2.1. Hydrogeological and Lithological Settings
2.2. Groundwater Recharge Sources in the Heihe River Basin
3. Methods
3.1. Water Balance Approach
3.1.1. Hydrological and Meteorological Observations
3.1.2. Penman-Monteith Equation
3.2. Tracer-Based Approach
4. Data
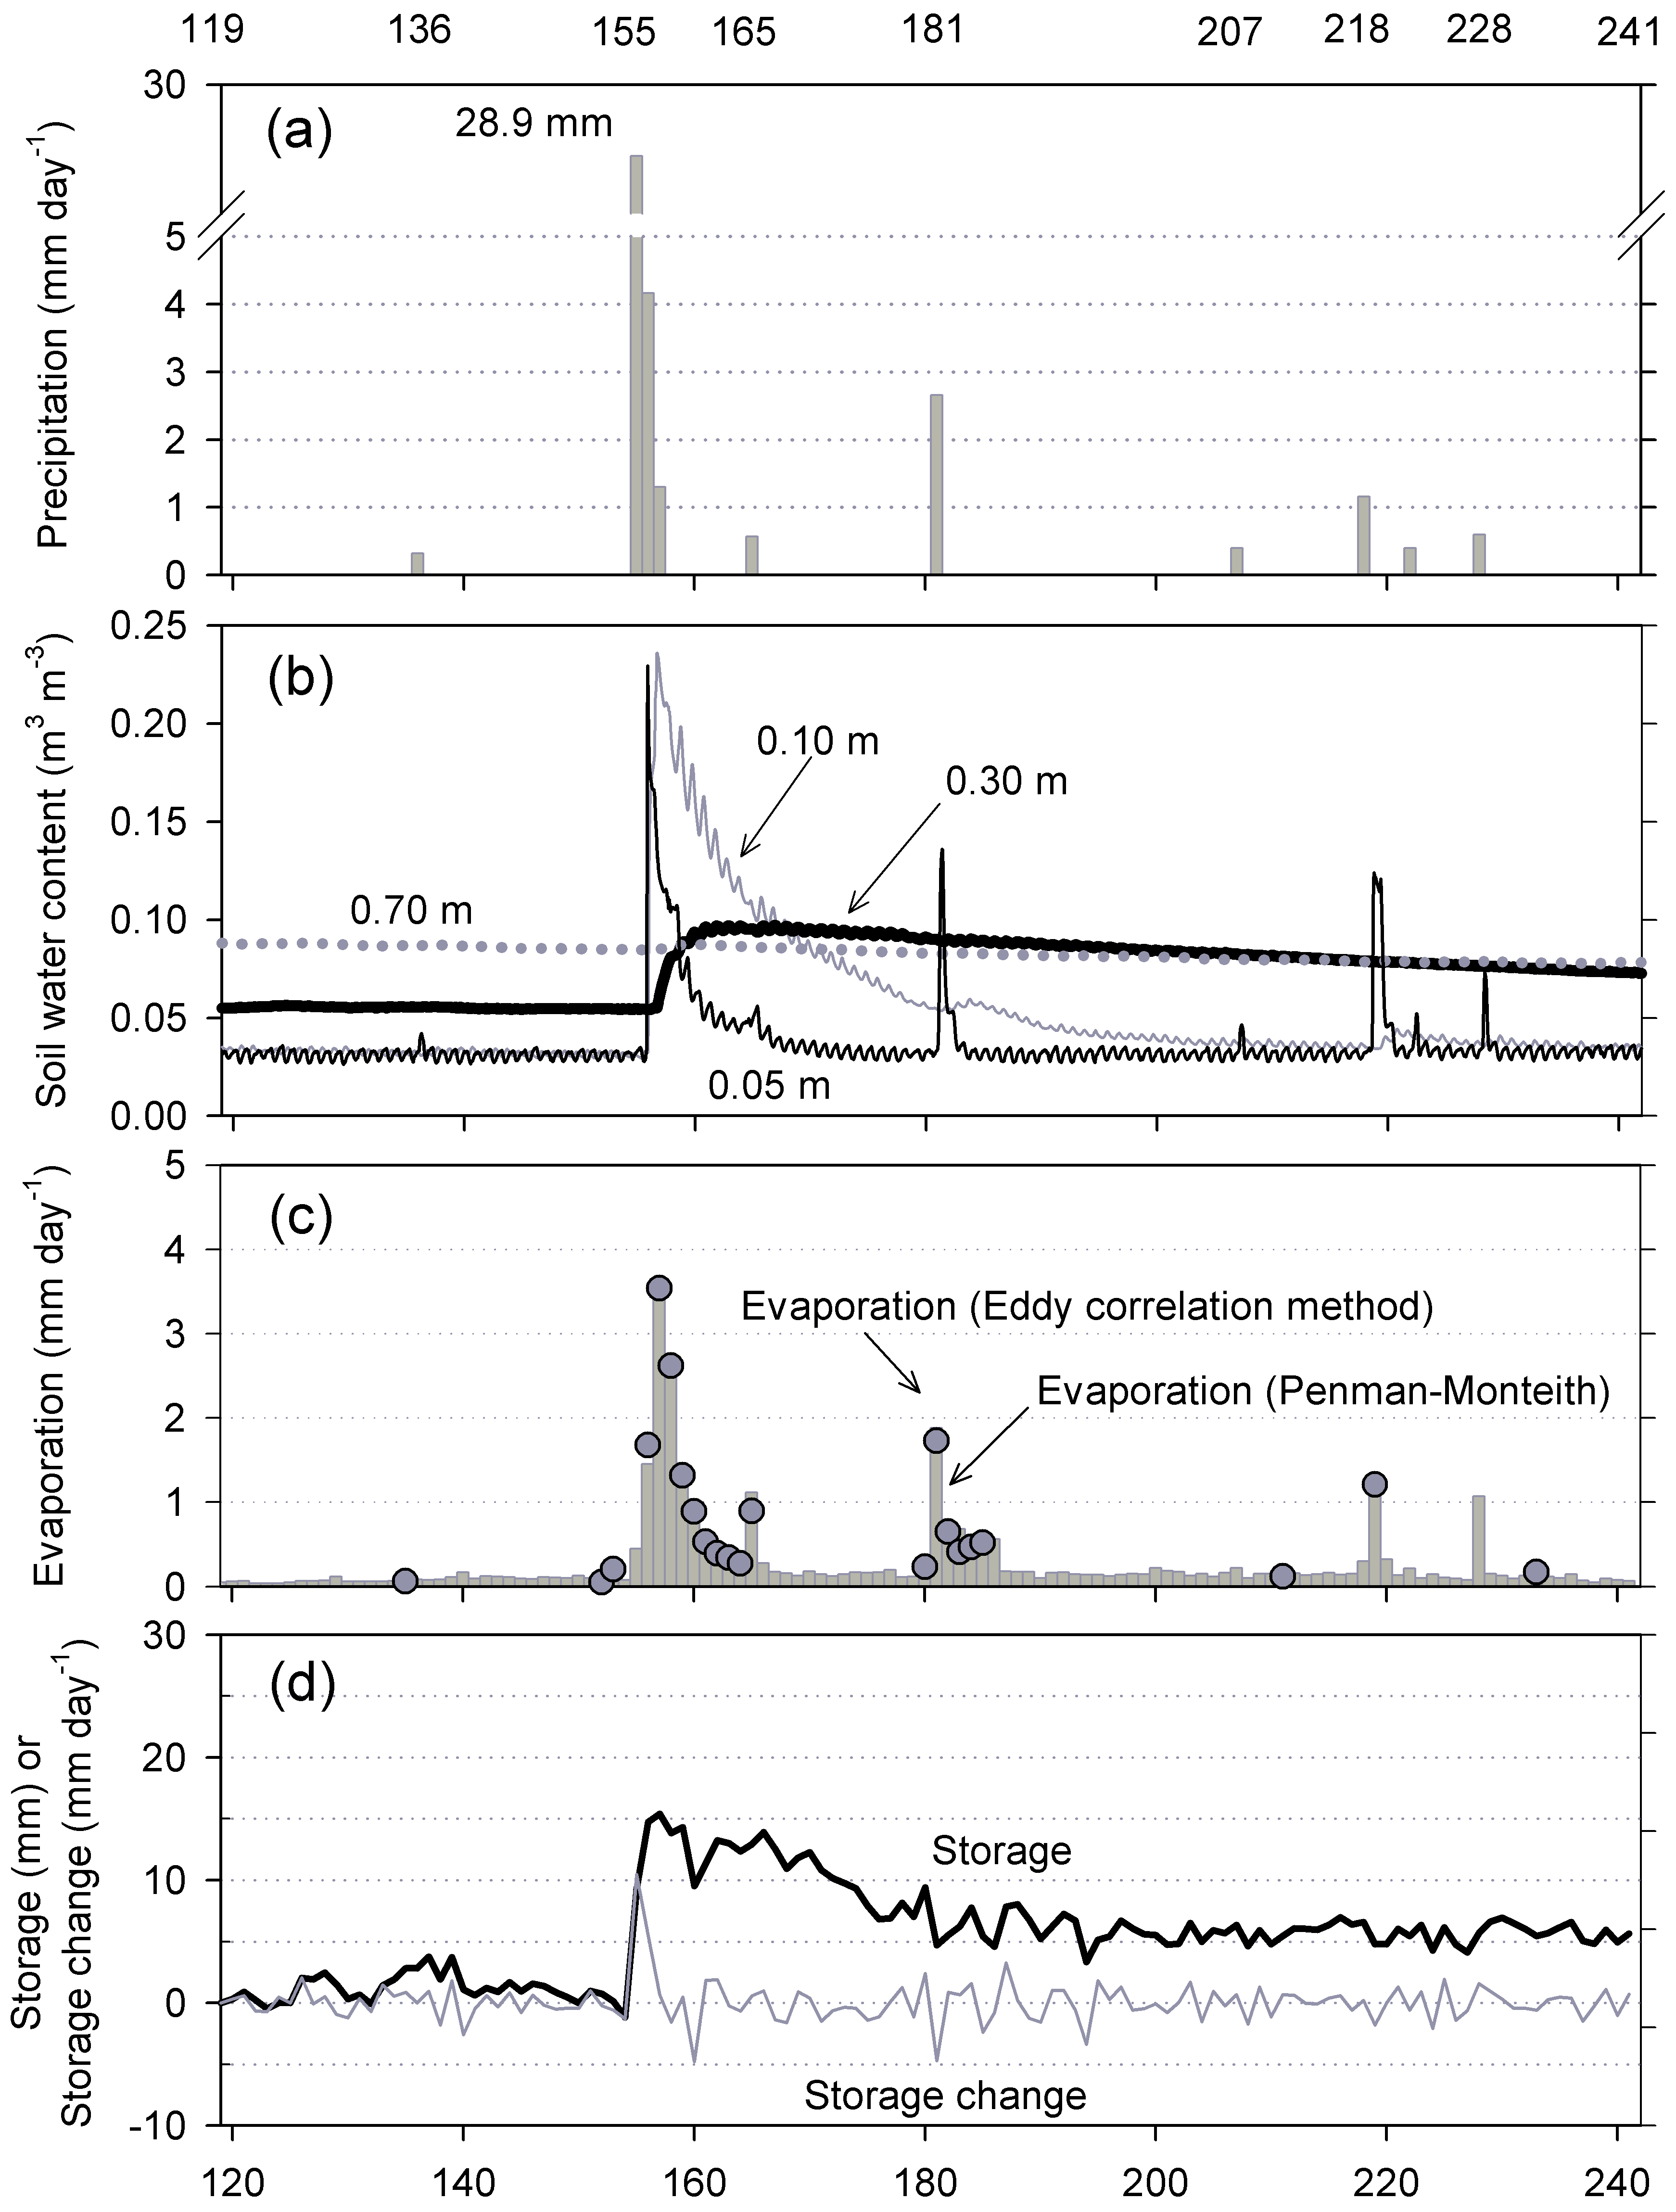
4.1. Precipitation
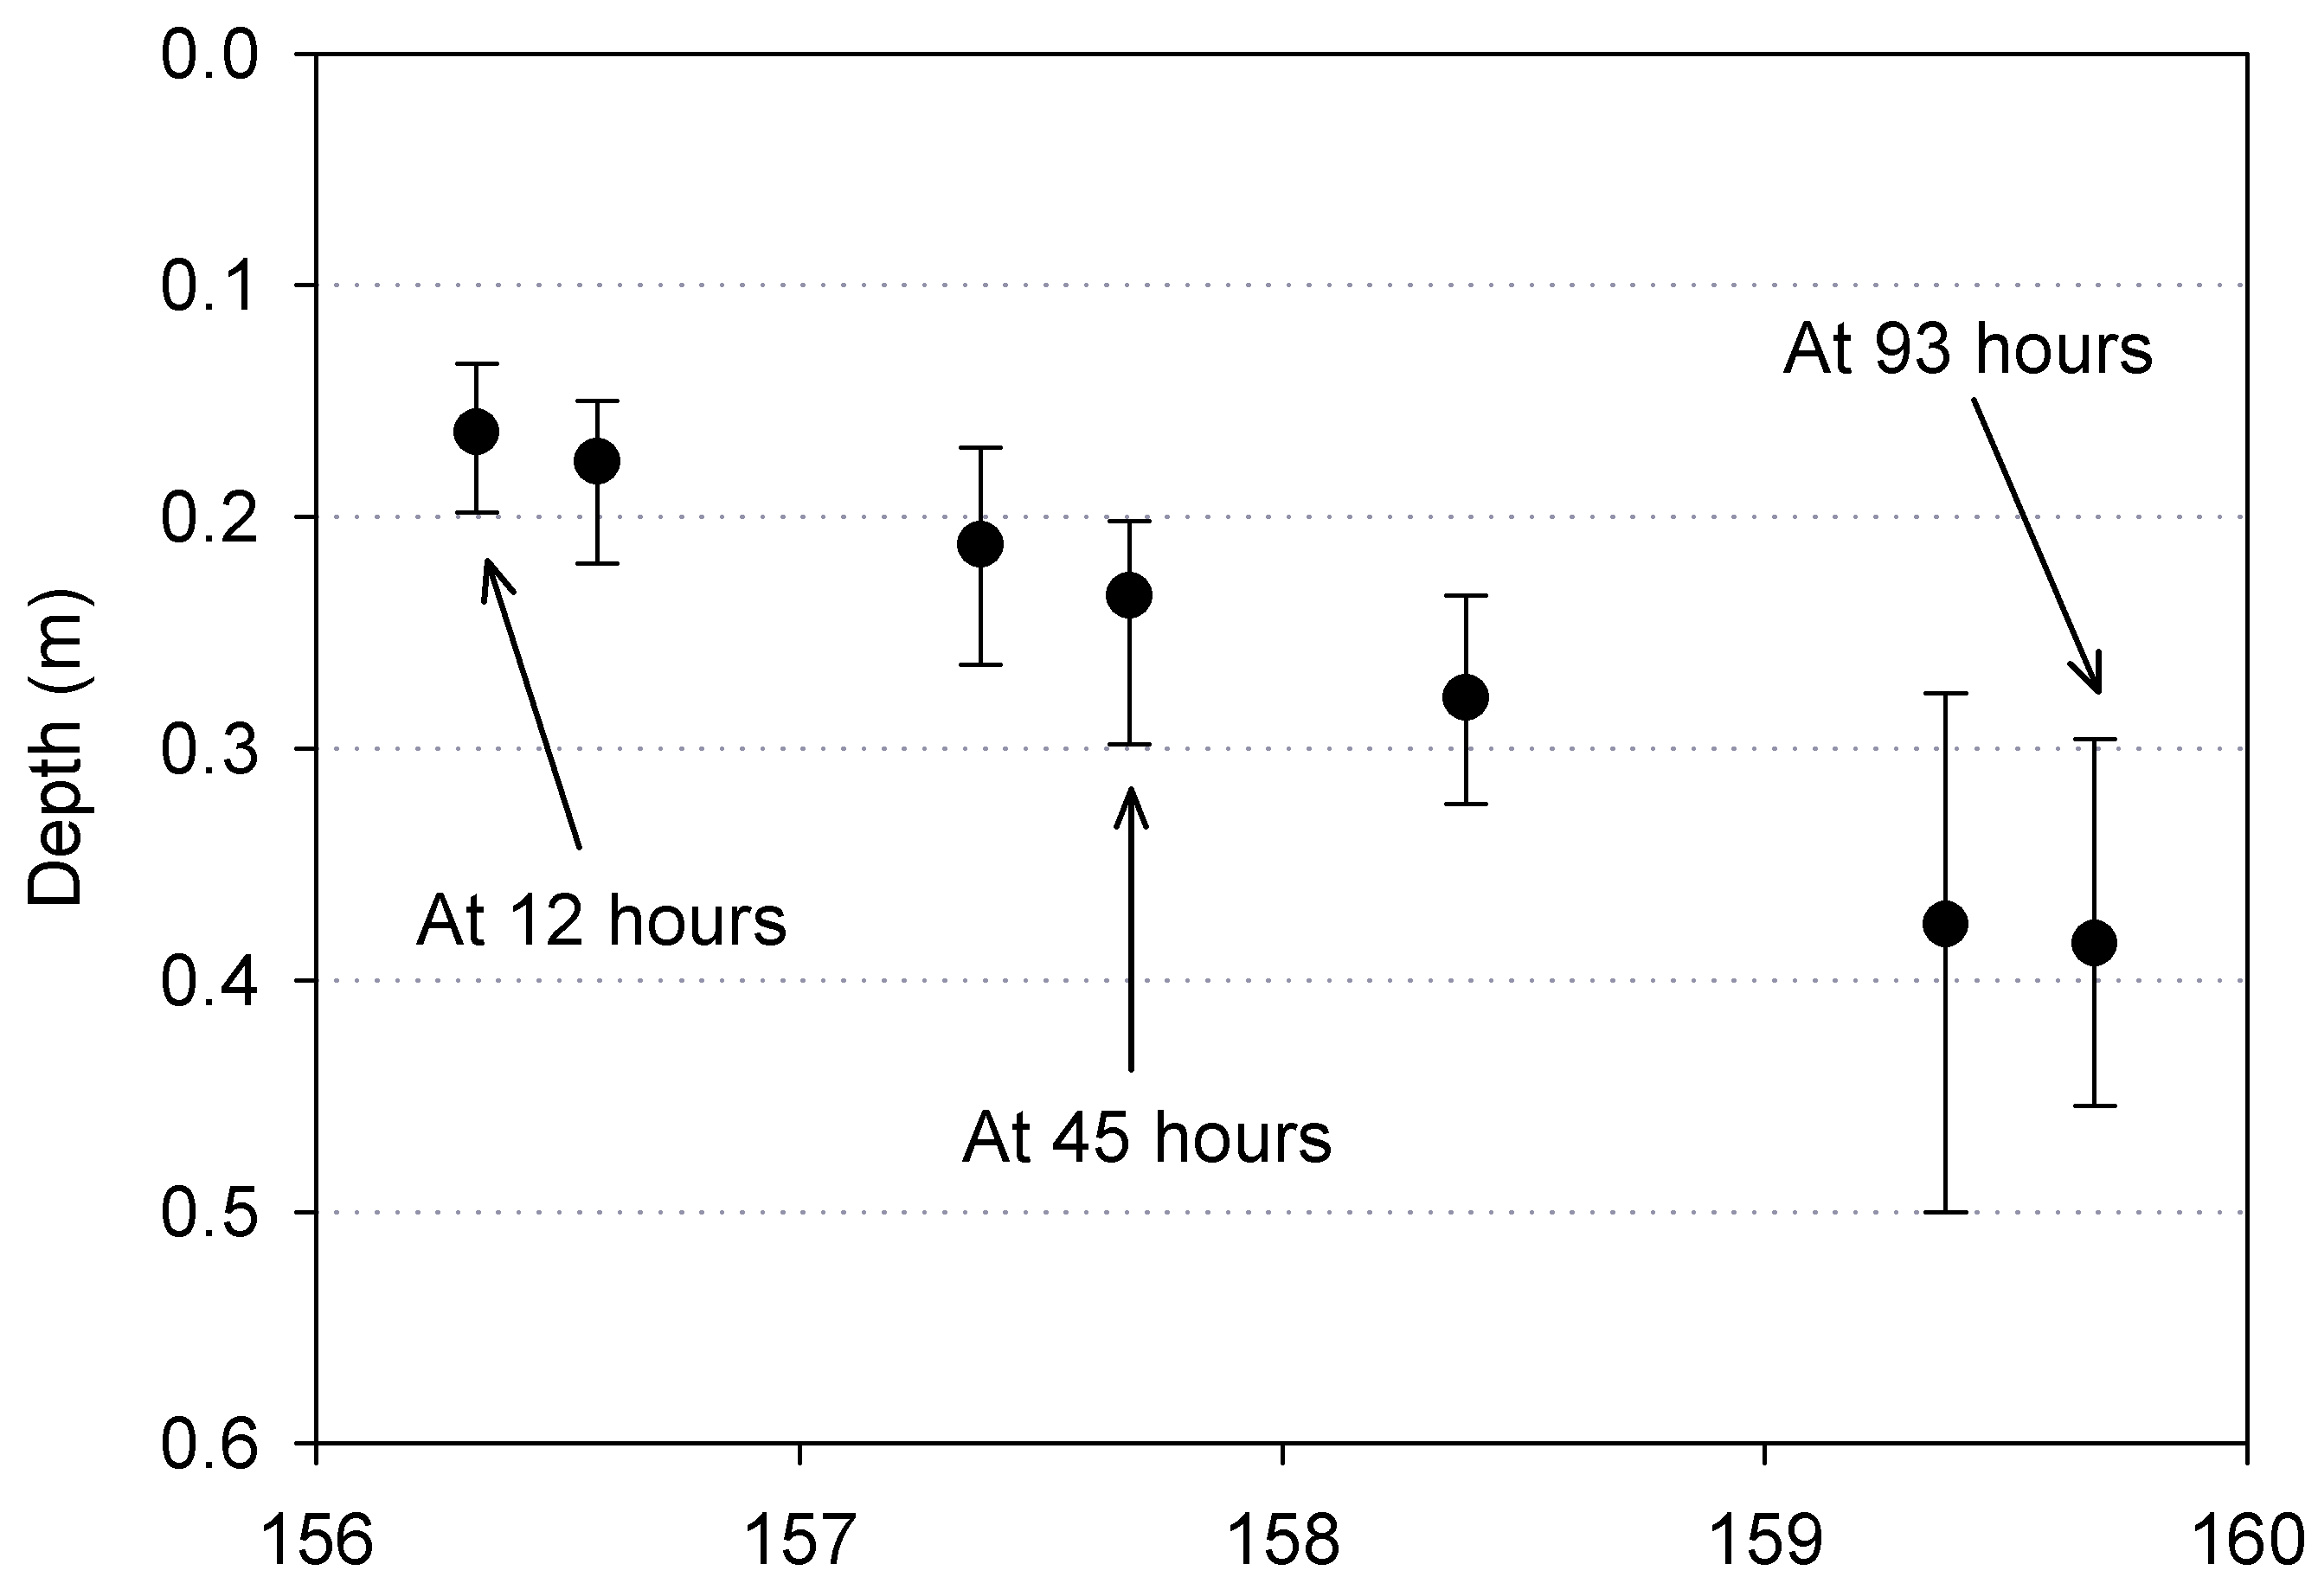
4.2. Soil Water Content and Wetting Front and Their Responses to Precipitation
5. Results
5.1. Results of Water Balance Approach
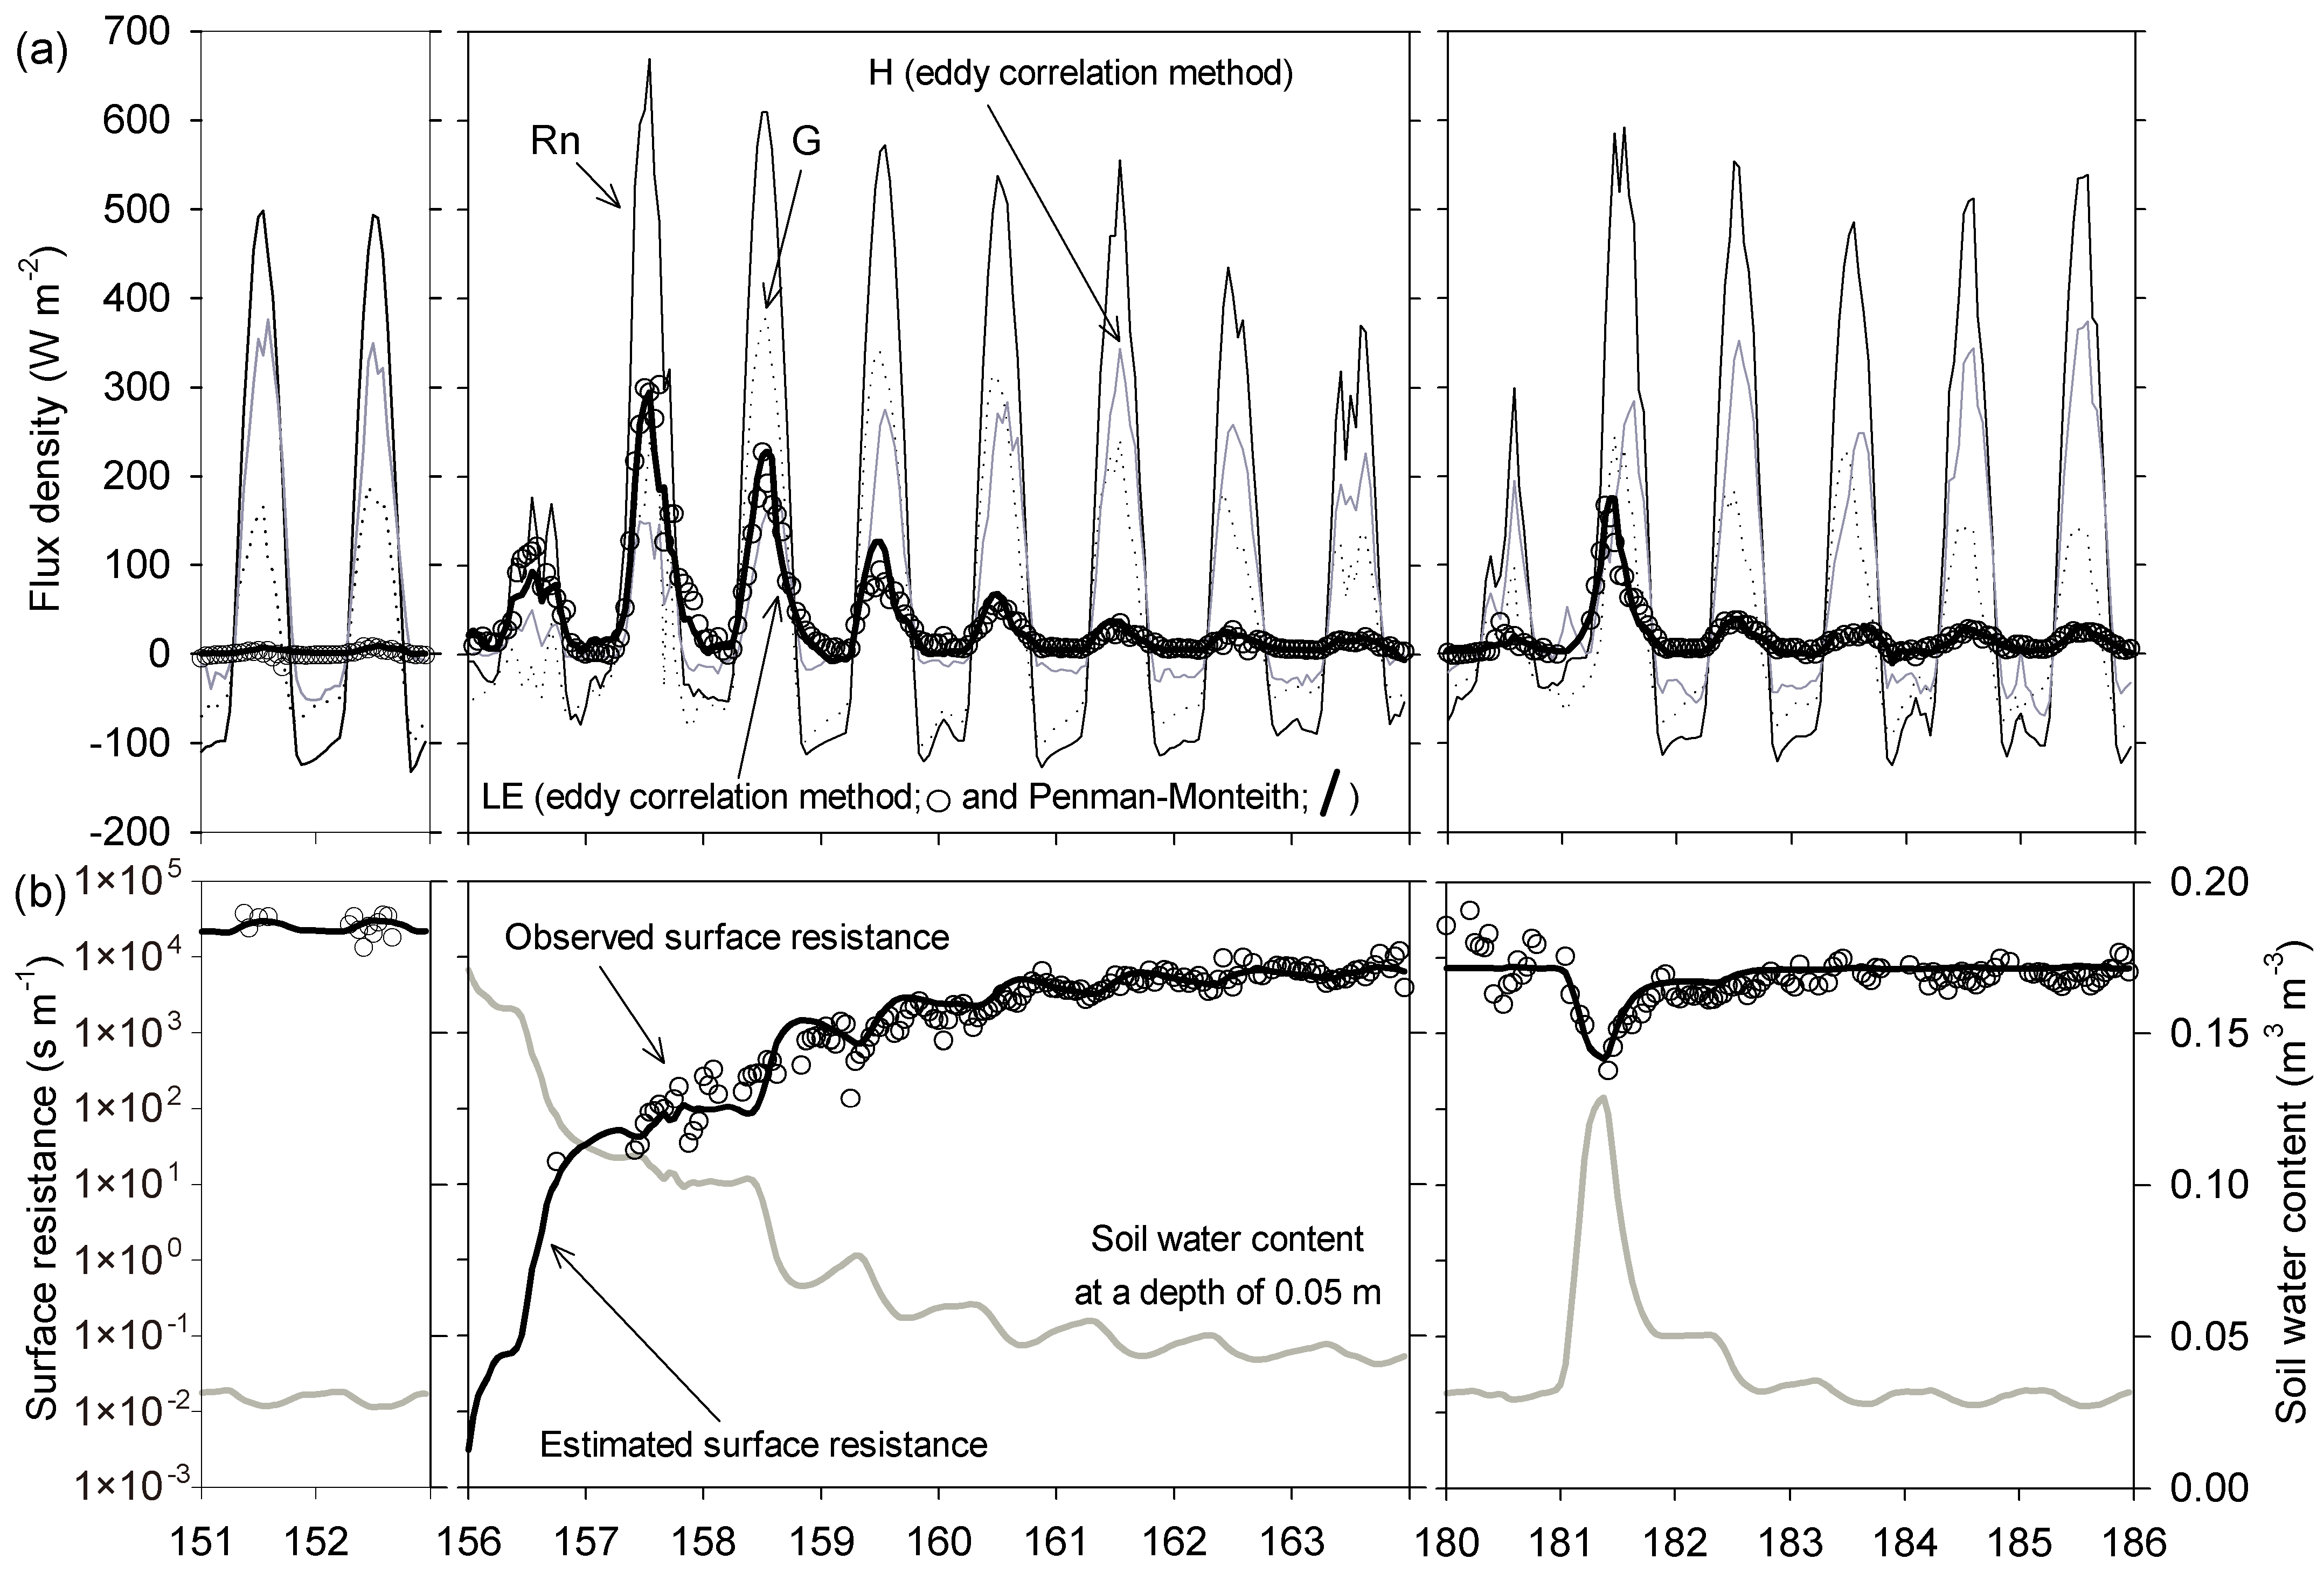
5.1.1. Energy Balance and Its Relation to Soil Water Content near the Surface
5.1.2. Water Balance
5.2. Results of Tracer-Based Approach
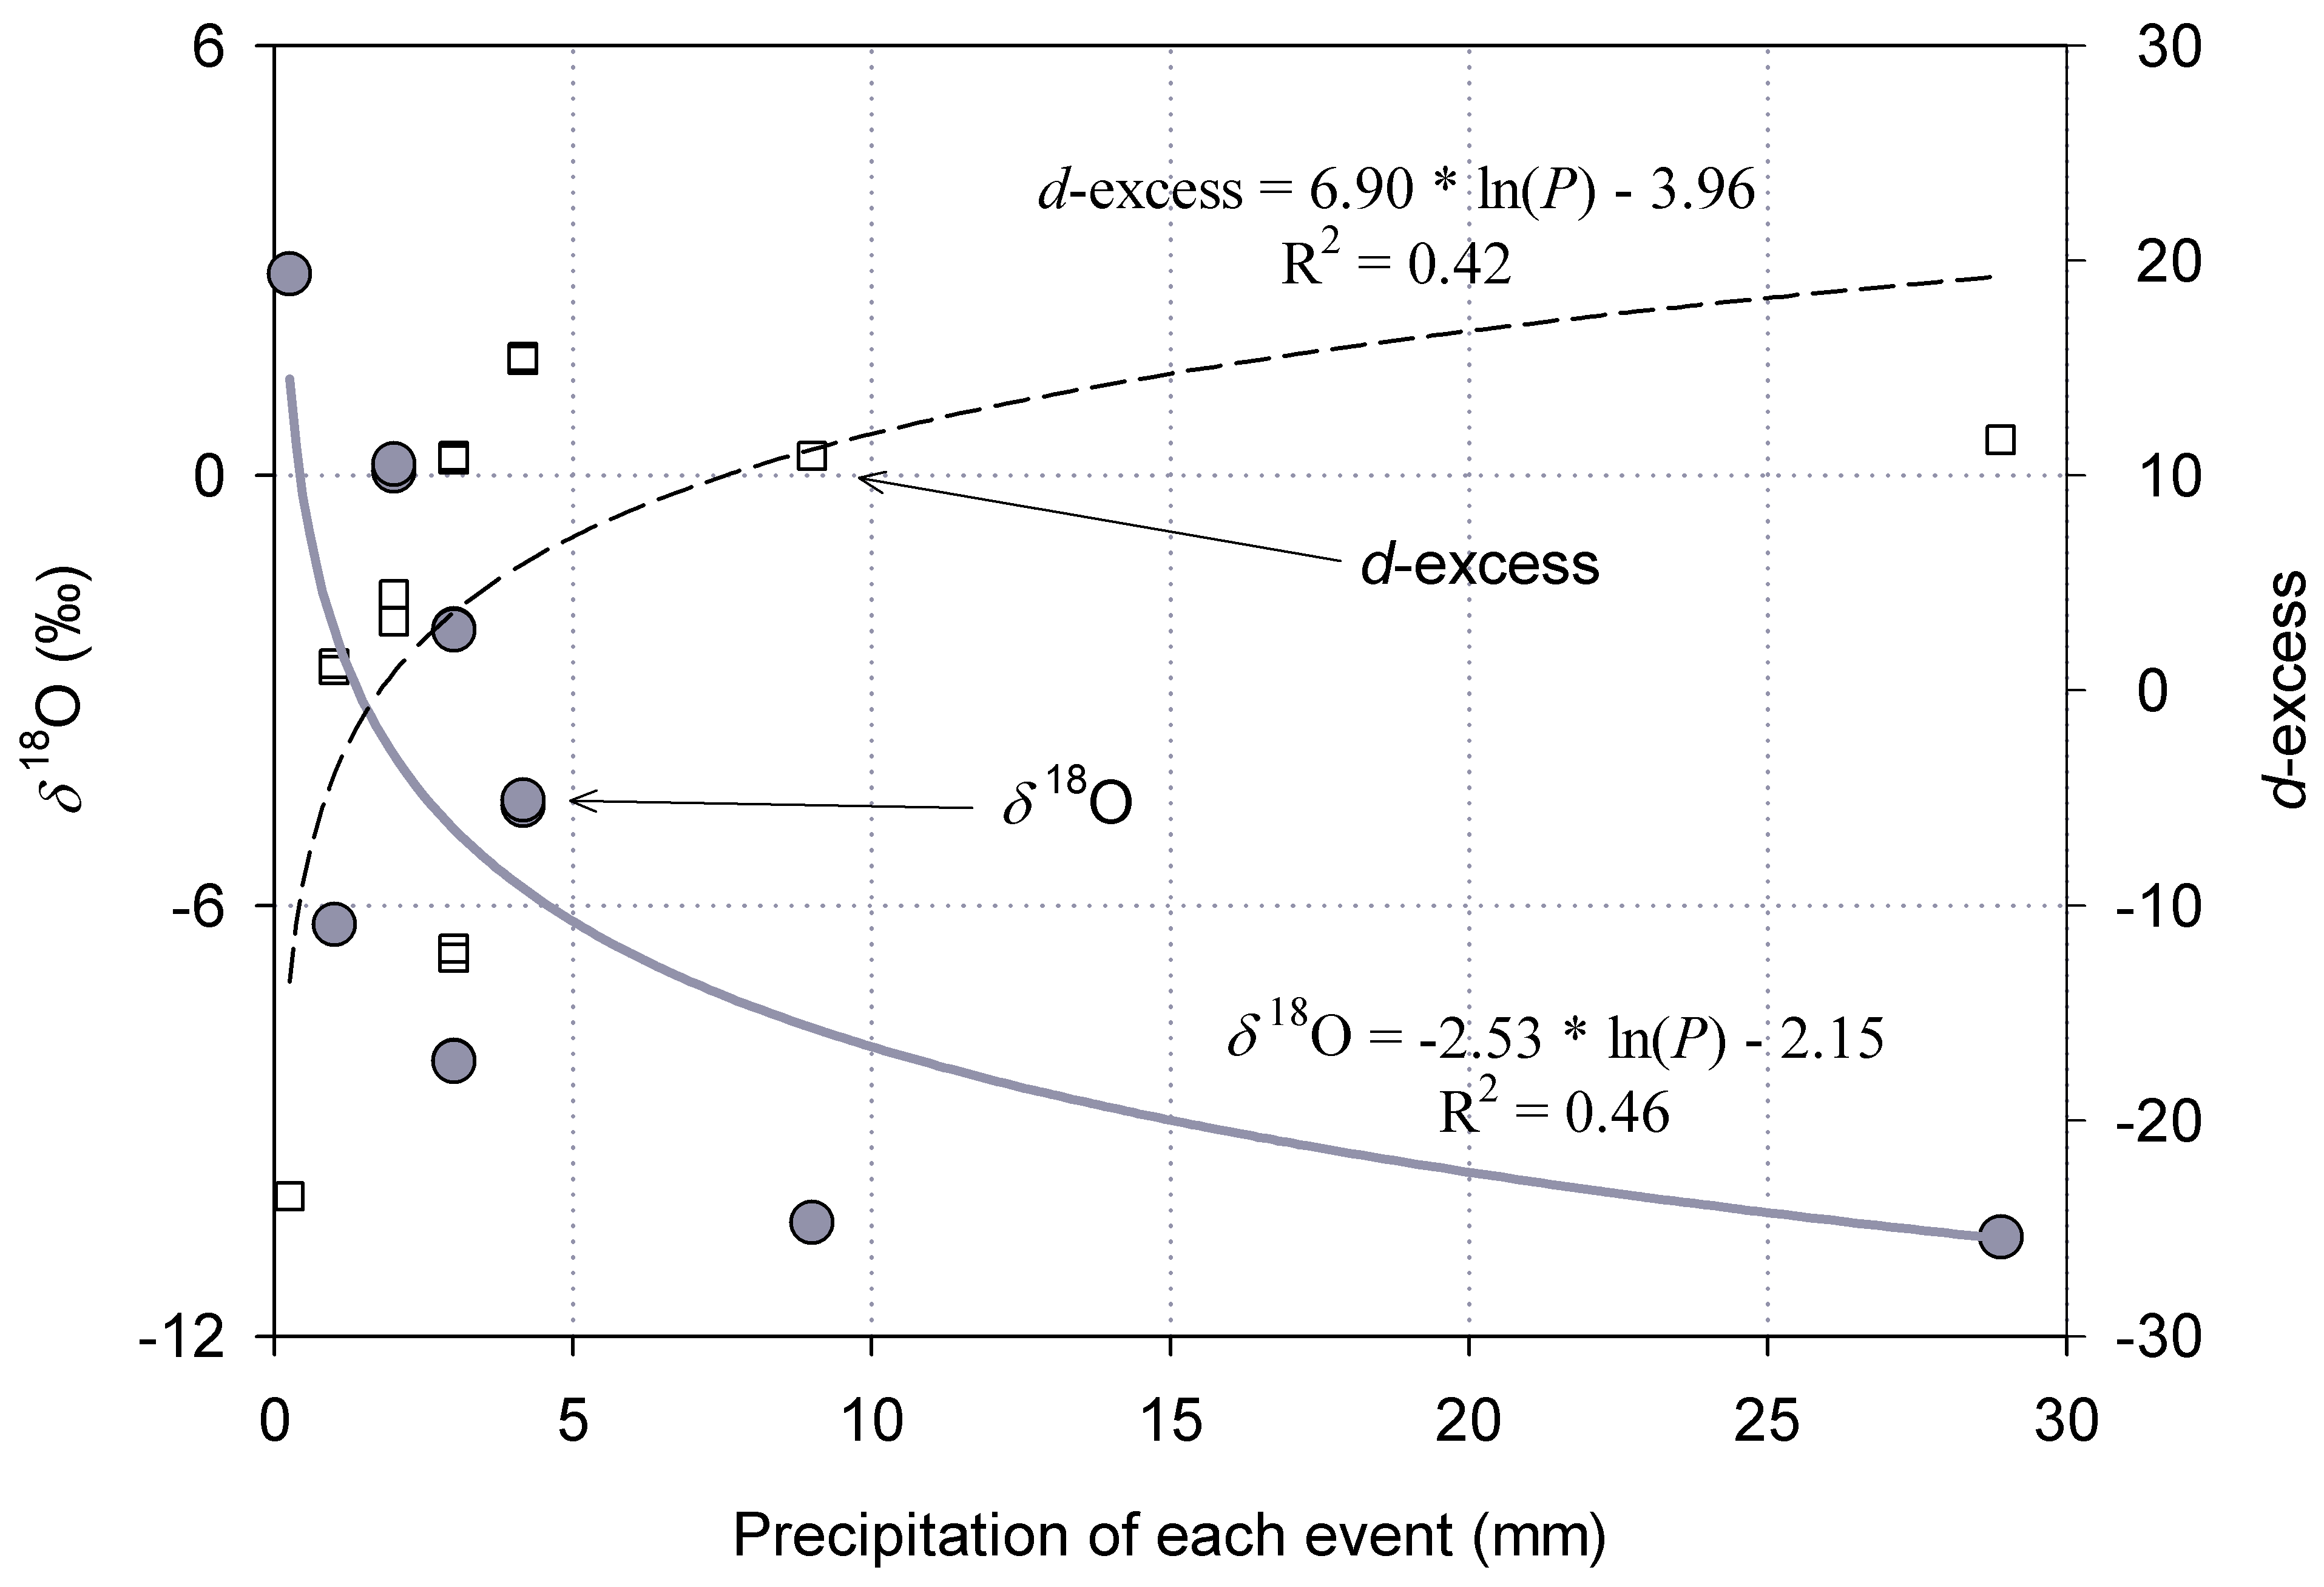
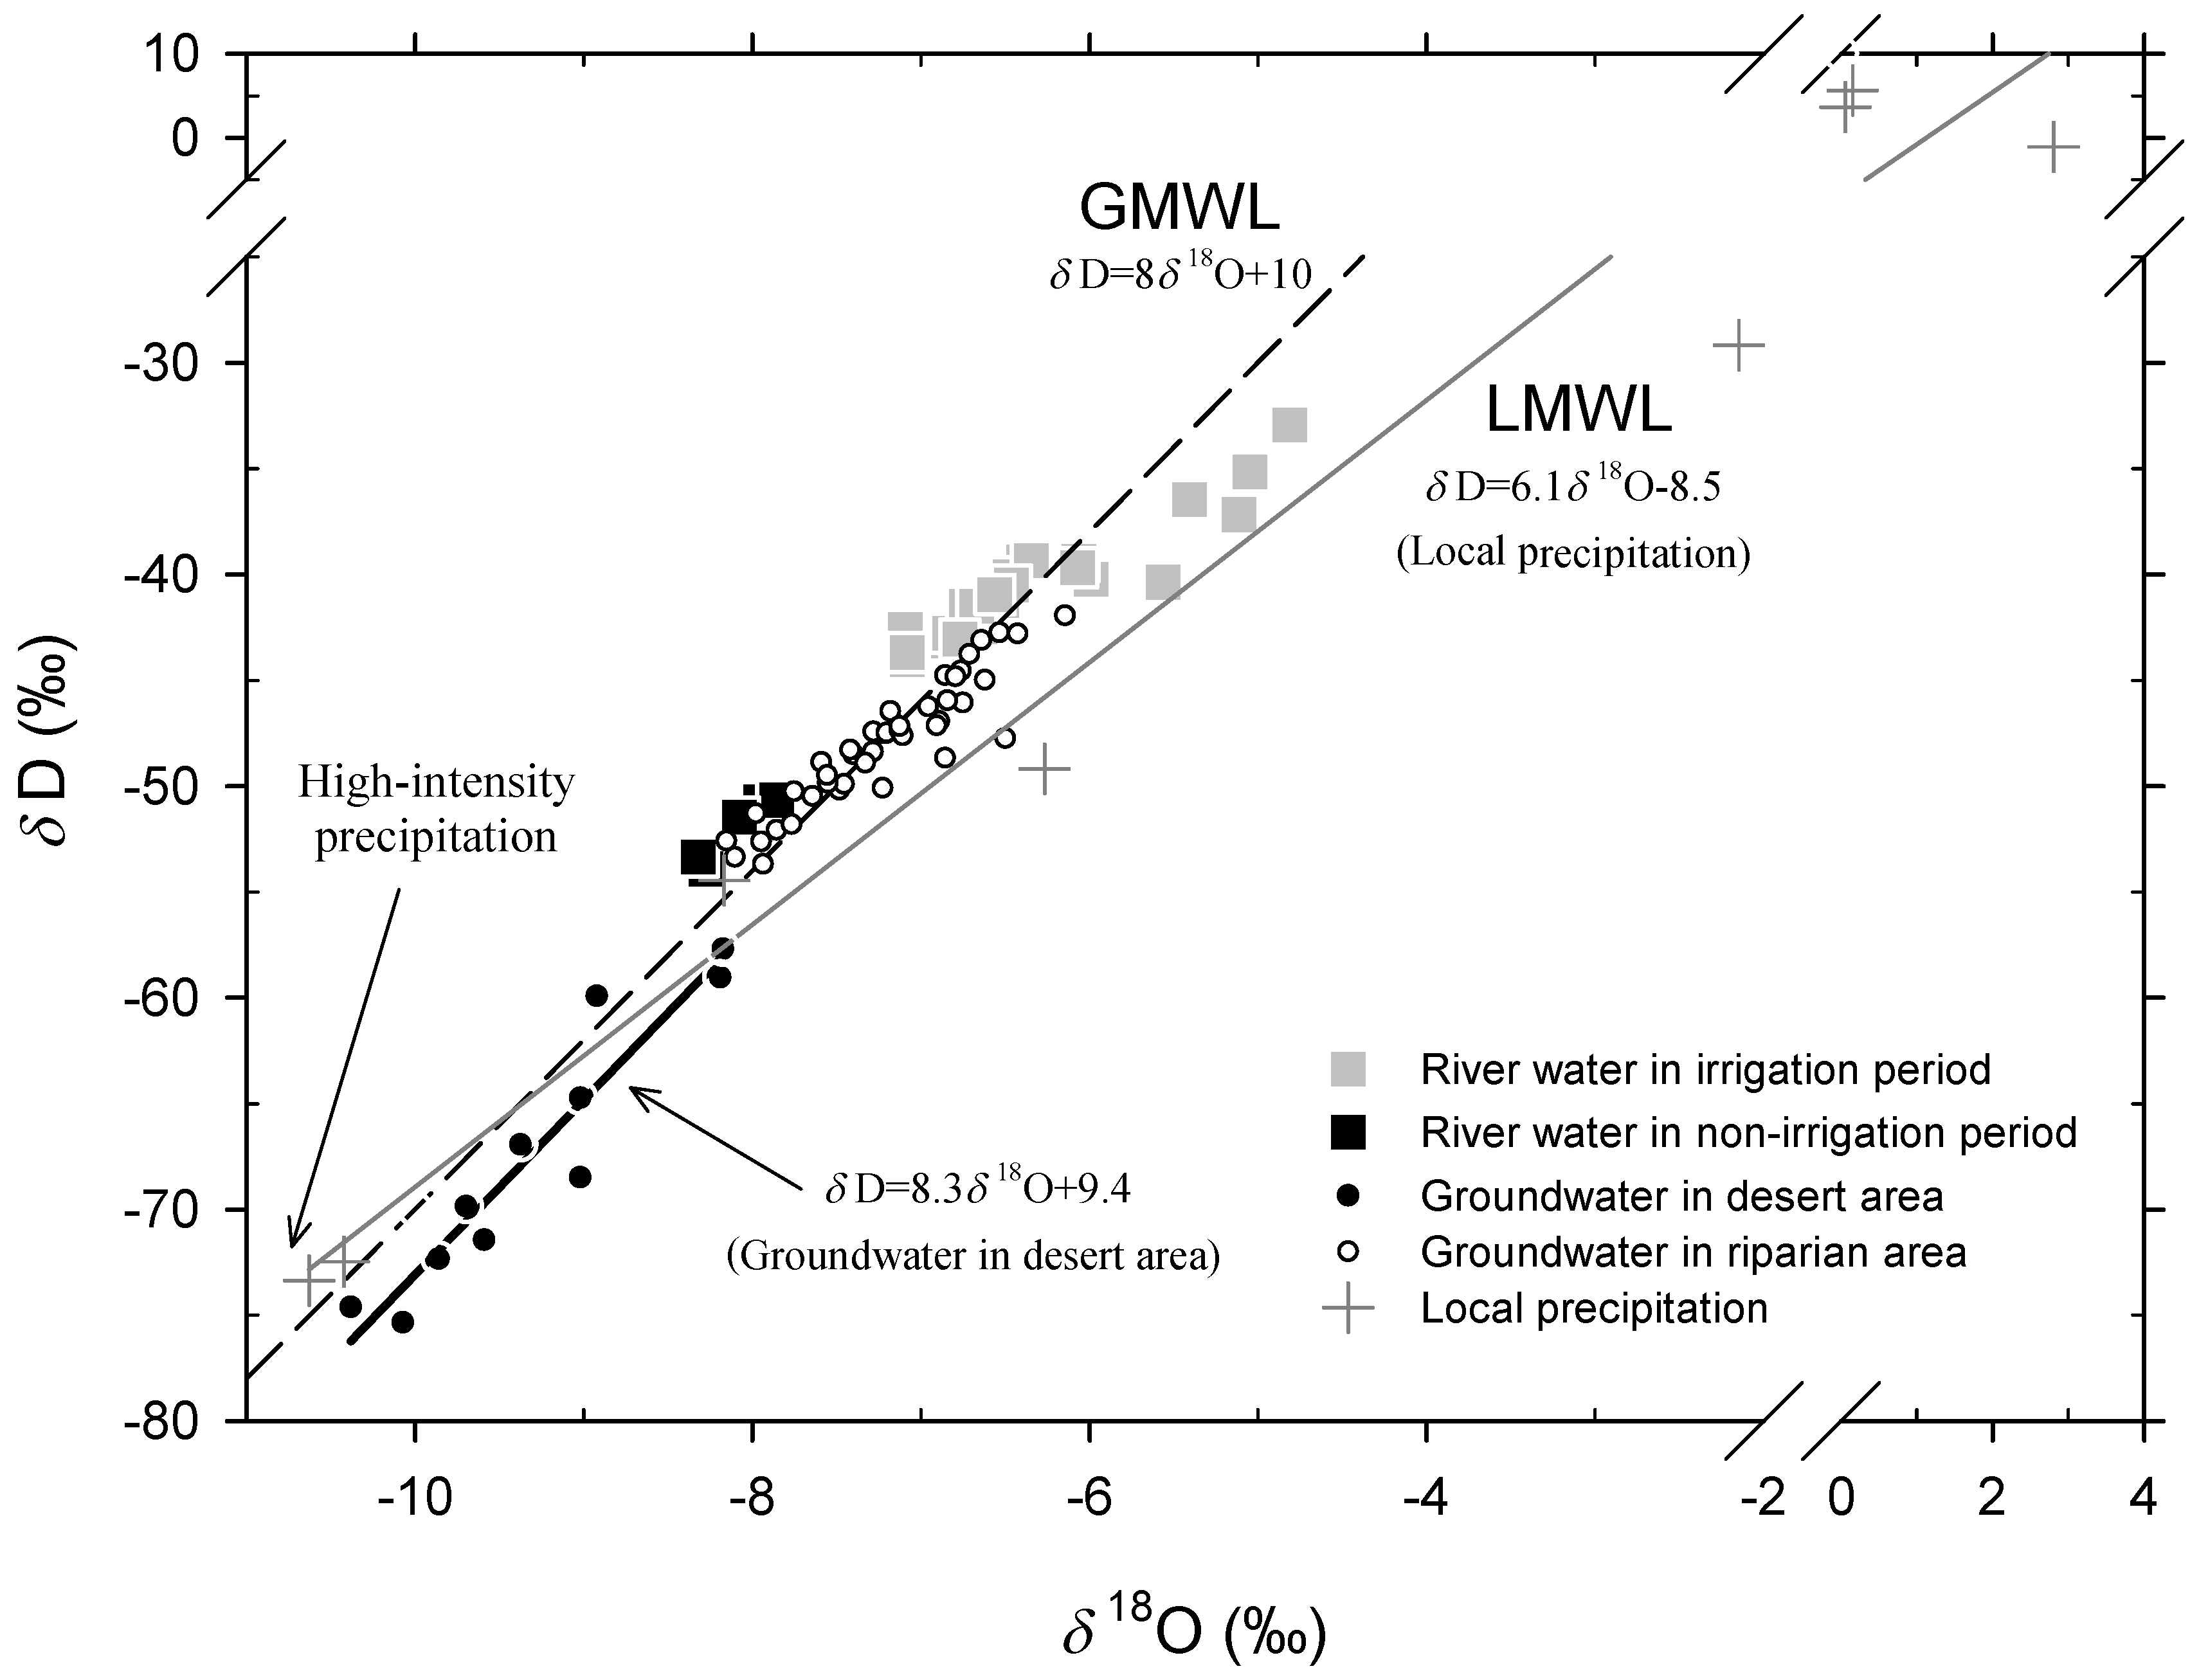
5.2.1. Stable Isotopes in Precipitation and Its Relation to Precipitation Amount
5.2.2. Stable Isotopes in Shallow Groundwater
6. Discussion
7. Conclusions
Author Contributions
Funding
Acknowledgments
Conflicts of Interest
References
- United Nations Environment Program (UNEP). World Atlas of Desertification, 2nd ed.; Middleton, N., Thoma, D., Eds.; UNEP: London, UK, 1997. [Google Scholar]
- Gee, G.W.; Wierenga, P.J.; Andraski, B.J.; Young, M.H.; Fayer, M.J.; Rockhold, M.L. Variations in water balance and recharge potential at three western desert sites. Soil Sci. Soc. Am. J. 1994, 58, 63–72. [Google Scholar] [CrossRef]
- Wu, J.; Zhang, R. Analysis of rainfall-infiltration recharge to groundwater. Proceedings of Fourteenth Annual American Geophysical Union, Hydrology Days, Fort Collins, CO, USA, 5–8 April 1994; pp. 420–430. [Google Scholar]
- Onodera, S. The mechanism of concentrated groundwater recharge in a tropical semiarid region. J. Jpn. Assoc. Hydrol. Sci. 1996, 26, 87–98. [Google Scholar]
- Tsujimura, M.; Abe, Y.; Tanaka, T.; Shimada, J.; Higuchi, S.; Yamanaka, T.; Davaa, G.; Oyunbaatar, D. Stable isotopic and geochemical characteristics of groundwater in Kherlen River basin, a semi-arid region in eastern Mongolia. J. Hydrol. 2007, 333, 47–57. [Google Scholar] [CrossRef] [Green Version]
- Carter, R.; Morgulis, E.; Dottridge, J. Groundwater modeling with limited data: A case study in a semi-arid dune field of northeast Nigeria. Q. J. Eng. Geol. 1994, 27, 85–94. [Google Scholar] [CrossRef]
- Gao, Z.; Zhang, L.; Cheng, L.; Zhang, X.; Cowan, T.; Cai, W.; Brutsaert, W. Groundwater storage trends in the Loess Plateau of China estimated from streamflow records. J. Hydrol. 2015, 530, 281–290. [Google Scholar] [CrossRef]
- Allison, G.B.; Hughes, M.W. The use of natural tracers as indicators of soil-water movement in a temperate semi-arid region. J. Hydrol. 1983, 60, 157–173. [Google Scholar] [CrossRef]
- Barnes, C.J.; Allison, G.B. Tracing of water movement in the unsaturated zone using stable isotopes of hydrogen and oxygen. J. Hydrol. 1988, 100, 143–176. [Google Scholar] [CrossRef]
- Magaritz, M.; Aravena, R.; Peña, H.; Suzuki, O.; Grilli, A. Water chemistry and isotope study of streams and springs in northern Chile. J. Hydrol. 1989, 108, 323–341. [Google Scholar] [CrossRef]
- Sami, K. Recharge mechanisms and geochemical processes in a semi-arid sedimentary basin, Eastern Cape, South Africa. J. Hydrol. 1992, 139, 27–48. [Google Scholar] [CrossRef]
- Navada, S.V.; Nair, A.R.; Rao, S.M.; Paliwall, B.L.; Doshi, C.S. Groundwater recharge studies in arid region of Jalore, Rajasthan using isotope techniques. J. Arid Environ. 1993, 24, 125–133. [Google Scholar] [CrossRef]
- Huang, T.; Pang, Z. Estimating groundwater recharge following land-use change using chloride mass balance of soil profiles: A case study at Guyuan and Xifeng in the Loess Plateau of China. Hydrogeol. J. 2011, 19, 177–186. [Google Scholar] [CrossRef]
- Edmunds, W.M.; Fellman, E.; Goni, I.B.; Prudhomme, C. Spatial and temporal distribution of groundwater recharge in northern Nigeria. Hydrogeol. J. 2002, 10, 205–215. [Google Scholar] [CrossRef]
- Flint, A.; Flint, L.; Kwicklis, E.; Bodvarsson, G. Estimating recharge at Yucca Mountain, Nevada, USA: Comparison of methods. Hydrogeol. J. 2002, 10, 180–204. [Google Scholar] [CrossRef]
- Foster, S. Quantification of groundwater recharge in arid regions: A practical view for resource development and management. In Estimation of Natural Ground Water Recharge; Simmers, I., Ed.; Reidel: Dordrecht, The Netherlands, 1988; pp. 323–338. ISBN 9027726329. [Google Scholar]
- Lerner, D.N.; Issar, A.S.; Simmers, I. Groundwater Recharge: A Guide to Understanding and Estimating Natural Recharge. In International Contributions to Hydrogeology IAH; Verlag Heinz Heise: Hannover, Germany, 1990; Volume 8. [Google Scholar]
- Li, Z.; Lin, X.; Coles, A.E.; Chen, X. Catchment-scale surface water-groundwater connectivity on China’s Loess Plateau. Catena 2017, 152, 268–276. [Google Scholar] [CrossRef]
- De Vries, J.J.; Simmers, I. Groundwater recharge: An overview of processes and challenges. Hydrogeol. J. 2002, 10, 5–17. [Google Scholar] [CrossRef]
- Scanlon, B.R.; Healy, R.W.; Cook, P.G. Choosing appropriate techniques for quantifying groundwater recharge. Hydrogeol. J. 2002, 10, 18–39. [Google Scholar] [CrossRef]
- Zhu, G.; Su, Y.; Huang, C.; Qi, F.; Liu, Z. Hydrogeochemical processes in the groundwater environment of Heihe River Basin, Northwest China. Environ. Earth Sci. 2010, 60, 139–153. [Google Scholar] [CrossRef]
- Sakai, A.; Fujita, K.; Nakawo, M.; Yao, T. Role of Glacier Runoff in the Heihe Basin; Research Institute for Humanity and Nature: Kamigamo, Japan, 2005. [Google Scholar]
- Akiyama, T.; Kharrazi, A.; Li, J.; Avtar, R. Agricultural water policy reforms in China: A representative look at Zhangye City, Gansu Province, China. Environ. Monit. Assess. 2018, 190. [Google Scholar] [CrossRef] [PubMed]
- Ding, Y.; Li, Z. Tectonic characteristics of Yinen-Ejina Banner Basin reflected by aeromagnetic survey. Geophys. Geochem. Explor. 1999, 23, 191–194. [Google Scholar]
- Wu, Y.; Chen, C.; Shi, S.; Li, Z. Three dimensional numerical simulation of groundwater system in Ejina Basin, Heihe River, Northwestern China. J. China Univ. Geosci. 2003, 28, 527–532. [Google Scholar]
- Chao, B.; Gao, Q. Grassland Type Map of the Heihe River Basin, China; Institute of Desert Research Academia Sinica: Lanzhou, China, 1988. [Google Scholar]
- Wang, G.; Cheng, G. Water resource development and its influence on the environment in arid areas of China—The case of the Hei River basin. J. Arid Environ. 1999, 43, 121–131. [Google Scholar]
- Zha, J. A study of water resources evaluation in the north and northwest China. Adv. Water Sci. 1997, 8, 44–47. [Google Scholar]
- Zhu, Y.; Wu, Y.; Drake, S. A survey: Obstacles and strategies for the development of ground-water resources in arid inland river basins of Western China. J. Arid Environ. 2004, 59, 351–367. [Google Scholar] [CrossRef]
- Wen, X.; Wu, Y.; Su, J.; Zhang, Y.; Liu, F. Hydrochemical characteristics and salinity of groundwater in the Ejina Basin, Northwestern China. Environ. Geol. 2005, 48, 665–675. [Google Scholar] [CrossRef]
- Akiyama, A.; Sakai, A.; Yamazaki, Y.; Wang, G.; Fujita, K.; Nakawo, M.; Kubota, J.; Konagaya, Y.T. Surfacewater-groundwater interaction in the Heihe River basin, Northwestern China. Bull. Glaciol. Res. 2007, 24, 87–94. [Google Scholar]
- Webb, E.; Pearman, G.; Leuning, R. Correction of Flux Measurements for Density Effects due to Heat and Water Vapour Transfer. Q. J. R. Meteorol. Soc. 1980, 106, 85–100. [Google Scholar] [CrossRef]
- Western, A.W.; Seyfried, M.S. A calibration and temperature correction procedure for the water-content reflectometer. Hydrol. Process. 2005, 19, 3785–3793. [Google Scholar] [CrossRef]
- Monteith, J.L. Evaporation and surface temperature. Q. J. R. Meteorol. Soc. 1981, 107, 1–27. [Google Scholar] [CrossRef]
- Kondo, J.; Saigusa, N.; Sato, T. A Parameterization of Evaporation from Bare Soil Surfaces. J. Appl. Meteorol. 1990, 29, 385–389. [Google Scholar] [CrossRef]
- Saigusa, N. Heat balance at soil surfaces. In Meteorology for Water Environment: Heat and Water Balances at Surfaces; Kondo, J., Ed.; Asakura Publishing: Tokyo, Japan, 1994; pp. 185–205. [Google Scholar]
- Ohta, T.; Hiyama, T.; Tanaka, H.; Kuwada, T.; Trofim, M.; Ohata, T.; Fukushima, Y. Seasonal variation in the energy and water exchanges above and below a larch forest in eastern Siberia. Hydrol. Process. 2001, 15, 1459–1476. [Google Scholar] [CrossRef]
- Tamagawa, I. Turbulent characteristics and bulk transfer coefficients over the desert in the HEIFE area. Bound. Layer Meteorol. 1996, 77, 1–20. [Google Scholar] [CrossRef]
- Peng, H.; Mayer, B.; Harris, S.; Roy Krouse, H. A 10-year record of stable isotope ratios of hydrogen and oxygen in precipitation at Calgary, Alberta, Canada. Tellus B 2004, 56, 147–159. [Google Scholar] [CrossRef]
- Dansgaard, W. Stable isotopes in precipitation. Tellus 1964, 16, 436–468. [Google Scholar] [CrossRef]
- Gibson, J.J.; Price, J.S.; Aravena, R.; Fitzgerald, D.F.; Maloney, D. Runoff generation in a hypermaritime bog-forest upland. Hydrol. Process. 2000, 14, 2711–2730. [Google Scholar] [CrossRef]
- Ingraham, N.L. Isotopic variation in precipitation. In Isotope Tracers in Catchment Hydrology; Kendall, C., McDonnell, J., Eds.; Elsevier: New York, NY, USA, 1998; pp. 87–118. [Google Scholar]
- Moreira, M.; Sternberg, L.; Martinelli, L.; Victoria, R.; Barbosa, E.; Bonates, L.; Nepstad, D. Contribution of transpiration to forest ambient vapour based on isotopic measurements. Glob. Chang. Biol. 1997, 3, 439–450. [Google Scholar] [CrossRef]
- Craig, H.; Gordon, L. Deuterium and oxygen-18 variations in the ocean and the marine atmosphere. Proceedings of a Conference on Stable Isotopes in Oceanographic Studies and Paleotemperatures, Spoleto, Italy, 26–27 July 1965; Tongiorgi, E., Ed.; Lischi & Figli: Pisa, Italy, 1965; pp. 9–130. [Google Scholar]
- Majoube, M. Fractionnement en Oxygène 18 et en Deutérium entre l’eau et sa vapeur. J. Chim. Phys. 1971, 68, 1423–1436. [Google Scholar] [CrossRef]
- Sofer, Z.; Gat, J. The isotopic composition of evaporating brines: Effects of the isotopic ratio in saline solutions. Earth Planet. Sci. Lett. 1975, 26, 179–186. [Google Scholar] [CrossRef]
- Merlivat, L. Molecular diffusivities of H216O, HD16O, and H218O in gases. J. Chem. Phys. 1978, 69, 2864. [Google Scholar] [CrossRef]
- Flanagan, L.B.; Ehleringer, J.R. Stable isotope composition of stem and leaf water: Applications to the study of plant water use. Funct. Ecol. 1991, 5, 270–277. [Google Scholar] [CrossRef]
- Wang, X.F.; Yakir, D. Using stable isotopes of water in evapotranspiration studies. Hydrol. Process. 2000, 14, 1407–1421. [Google Scholar] [CrossRef]
- Craig, H. Isotopic Variations in Meteoric Waters. Science 1961, 133, 1702–1703. [Google Scholar] [CrossRef] [PubMed]
- Kobayashi, T.; He, W.J.; Nagai, H. Mechanisms of evaporation from soil with a dry surface. Hydrol. Process. 1998, 12, 2185–2191. [Google Scholar] [CrossRef]
- Scanlon, B.R.; Keese, K.E.; Flint, A.L.; Flint, L.E.; Gaye, C.B.; Edmunds, W.M.; Simmers, I. Global synthesis of groundwater recharge in semiarid and arid regions. Hydrol. Process. 2006, 20, 3335–3370. [Google Scholar] [CrossRef]
- Huang, T.; Pang, Z.; Liu, J.; Ma, J.; Gates, J. Groundwater recharge mechanism in an integrated tableland of the Loess Plateau, northern China: Insights from environmental tracers. Hydrogeol. J. 2017, 25, 2049–2065. [Google Scholar] [CrossRef]
- Tsujimura, M.; Tanaka, T. Evaluation of evaporation rate from forested soil surface using stable isotopic composition of soil water in a headwater basin. Hydrol. Process. 1998, 12, 2093–2103. [Google Scholar] [CrossRef]
- Gat, J.R. Oxygen and hydrogen isotopes in the hydrologic cycle. Annu. Rev. Earth Planet. Sci. 1996, 24, 225–262. [Google Scholar] [CrossRef]


© 2018 by the authors. Licensee MDPI, Basel, Switzerland. This article is an open access article distributed under the terms and conditions of the Creative Commons Attribution (CC BY) license (http://creativecommons.org/licenses/by/4.0/).
Share and Cite
Akiyama, T.; Kubota, J.; Fujita, K.; Tsujimura, M.; Nakawo, M.; Avtar, R.; Kharrazi, A. Use of Water Balance and Tracer-Based Approaches to Monitor Groundwater Recharge in the Hyper-Arid Gobi Desert of Northwestern China. Environments 2018, 5, 55. https://doi.org/10.3390/environments5050055
Akiyama T, Kubota J, Fujita K, Tsujimura M, Nakawo M, Avtar R, Kharrazi A. Use of Water Balance and Tracer-Based Approaches to Monitor Groundwater Recharge in the Hyper-Arid Gobi Desert of Northwestern China. Environments. 2018; 5(5):55. https://doi.org/10.3390/environments5050055
Chicago/Turabian StyleAkiyama, Tomohiro, Jumpei Kubota, Koji Fujita, Maki Tsujimura, Masayoshi Nakawo, Ram Avtar, and Ali Kharrazi. 2018. "Use of Water Balance and Tracer-Based Approaches to Monitor Groundwater Recharge in the Hyper-Arid Gobi Desert of Northwestern China" Environments 5, no. 5: 55. https://doi.org/10.3390/environments5050055