Article

Physicochemical and Bacteriological Analysis of Water Quality in Drought Prone Areas of Pune and Satara Districts of Maharashtra, India

1
The Foundation for Medical Research, 84A, R.G. Thadani Marg, Worli, Mumbai 400018, India
2
St. Johns Research Institute, 100 Feet Rd, John Nagar, Koramangala, Bangalore 560034, India
3
Norwegian Institute for Water Research, Gaustadalleen 21, 0349 Oslo, Norway
4
The Foundation for Research in Community Health, 3-4, Trimiti-B Apartments, 85, Anand Park, Aundh, Pune 411007, India
*
Author to whom correspondence should be addressed.
Environments 2018, 5(5), 61; https://doi.org/10.3390/environments5050061
Submission received: 19 April 2018 / Revised: 8 May 2018 / Accepted: 15 May 2018 / Published: 18 May 2018
(This article belongs to the Special Issue Soil and Water Contamination, Remediation and Conservation)

Abstract

:
Drinking water quality is determined by the water’s biological, chemical, and physical features. Water sampling was carried out in 20 villages in the Pune and Satara districts of Maharashtra, with 15 falling in a low rainfall zone. Samples were collected from rivers, open wells, and bore wells, four times in a period of a year covering all seasons. A total of 206 water samples were analyzed for their physical, chemical, and bacteriological properties. Physical and chemical properties were expressed in the form of a modified Water Quality Index (WQI). Additionally, the modified WQI was compared to an Overall Pollution Index (OIP) for rivers. The present investigation is an attempt to analyze the impact of seasonal changes on water quality of different water bodies using two different WQIs. To understand the degree to which water quality is affected by faecal bacteria, modified WQI with exclusion of faecal coliforms (FC) and OIP with inclusion of FC were compared with each other in river water bodies. Modified WQI values and bacterial counts were at a maximum during the onset of the monsoon. In terms of bacteriological contamination, the number of FC and intestinal enterococci (IE) in the water bodies was of major concern since it would impact human health.

1. Introduction

The impact of seasonal change on water quality has been extensively documented and has attracted widespread attention in recent years [1,2]. Seasonal changes like rising temperatures reduce dissolved oxygen levels in surface water. Scanty rainfall leads to less dilution of pollutants whereas frequent heavy spells of rainfall produces more pollution and sedimentation in river due to surface runoff. Additionally, anthropogenic and animal activities affect water quality [1,2,3]. Furthermore, the geology of the area, the soil condition, and contamination through seepage also contribute to alterations in the quality and availability of water [1,4].
The Indian climate is strongly influenced by the monsoon and is accordingly divided into four seasons, namely, summer or pre-monsoon (March to May), south west monsoon (June to September) post-monsoon (October and November), and winter (December to February). The rainfall over India has both large spatial and temporal variability. Rainfall during the south west monsoon ranges from 500 mm to 3200 mm [5,6]. The temperature also varies significantly in different seasons ranging from a mean of 10 °C to 32 °C [6]. India, in particular, is very vulnerable to extreme events, as is evident from recent occurrences of droughts and floods in the country, and its impact on water resources islikely to be more pronounced in the near future [2].
The Indian riverine system is strongly influenced by seasonal variations which directly affect its water quality due to fluctuations in its physicochemical properties like total dissolved solids, total suspended solids, salinity, and dissolved oxygen [7,8,9]. A lean river flow especially during summer results in alterations in the ecological niche of aquatic organisms, flora and fauna, and self-purification capacity of the river [10].
In India, rivers are sources of raw water for industries and irrigation as well as drinking water for urban and rural areas. Ground water is another source of drinking water [11]. However, many Indian states are water stressed regions [11]. The major reasons for this are water pollution and over exploitation of ground water which ultimately affects water quality.
Anthropogenic activities, namely, discharges of domestic waste, untreated waste from sewage treatment plants, plastic materials, disposal of personal care products and household chemicals, improper disposal of car batteries, construction activities, mining activities, and pilgrim activities are deteriorating the water quality of rivers [12]. Various agricultural, industrial, and mining activities contaminate ground water [13]. These activities alter pH of water, increases turbidity of water, and raise the content of total dissolved solids and metals [13,14].
Maharashtra is one of the industrialized states of India which contributes towards social and economic growth of the country. Large parts of the state fall in the rain shadow and hence face water supply and quality challenges [15]. Over 85% of drinking water supply in the state is dependent on ground water [3]. Shallow ground water sources like open wells are prone to bacterial contamination [16]. In order to reduce bacterial contamination of open wells, a well-established chlorination regime with availability of bleaching powder at Gram Panchayat (GP) level and regular treatment of water sources is essential. A local authority GP and Village Water Man are responsible for regular chlorination of open wells [16].
Pune, with a geographical area of 15,642 sq·km, is the second largest district in the state and accounts for 5.08% of the total area. A large part of Pune district falls in the rain shadow zone and nearly 50% of the area is classified as drought areas [15]. Like Pune district, drought prone areas are also present in many parts of Satara district.
The poor drinking water quality is a major cause of water borne diseases especially diarrhoea which results in a large health burden for India [11]. To address drinking water quality issues the National Water Policy (NWP) 1987 was updated in 2002 and later in 2012 by the Government of India [17]. Adaptation to climate change has been considered in NWP 2012 through which planning and management of water resources and structures is being undertaken to cope with future climate change [18].
Water quality can be assessed by measuring different physical, chemical, and bacteriological parameters. To be able to compare multiple parameters between water samples/sources a mathematical model is used to express the water quality in a single value as Water Quality Index (WQI). Seasonal analysis for water quality using different types of WQIs has been undertaken worldwide [13]. However, selection of parameters for the WQIs varies in different studies [13,19,20]. Thus, there is no single global standardized system for calculating and using WQIs.
WQI can be separated into Drinking Water Quality Index (DWQI), Health Water Quality Index (HWQI), and Acceptability Water Quality Index (AWQI) [21]. All parameters from the WHO guideline including microbiological parameters constitute DWQI. HWQI includes acceptability measurements related to health issues and microbial measurements, whereas AWQI incorporates acceptability measurements [21]. To check the health status of Indian rivers, Salgaonkar& Deshpande (2003) proposed Overall Index Pollution (OIP). Yadav et al. (2014) compared 3 indices, namely, Ecological Quality Index (EQI), The River Pollution Index, and Overall Index Pollution (OIP) for water quality study of Chambal river [22].
Some WQIs include bacteriological parameters as they can influence quality [14,17,18]. To assess the risk for water borne diseases, faecal coliforms and intestinal enterococci are traditionally used as indicators of faecal contamination and are used for monitoring drinking water quality [23].
This study was aimed at assessing the seasonal physical, chemical, and bacteriological water quality of natural water bodies and drinking water sources in twenty selected villages from Pune and Satara districts in different seasons. Physical and chemical quality of water was studied through Modified WQI. It was calculated for all water sources with exclusion of bacteriology and was estimated seasonally. Additionally, for rivers water quality was studied by inclusion of bacteriology in OIP. Additionally, different water quality indices were compared. Faecal coliforms and intestinal enterococci were used for bacteriological assessment. Since FC havethe capacity to survive in water for long periods of time without multiplication they are the accepted indicator organisms for faecal contamination by WHO and BIS [24,25,26,27]. The study focused on monitoringofseasonal water quality at village level since institutional and regulatory capacities to assess water bodies are limited in rural Maharashtra. The seasonal water quality findings can be used to propose local water monitoring programs and water management strategies when resources are under pressure due to drought conditions. Additionally, the seasonal water quality findings can be used develop water quality models for climate change scenarios at the local scale.

2. Materials and Methods

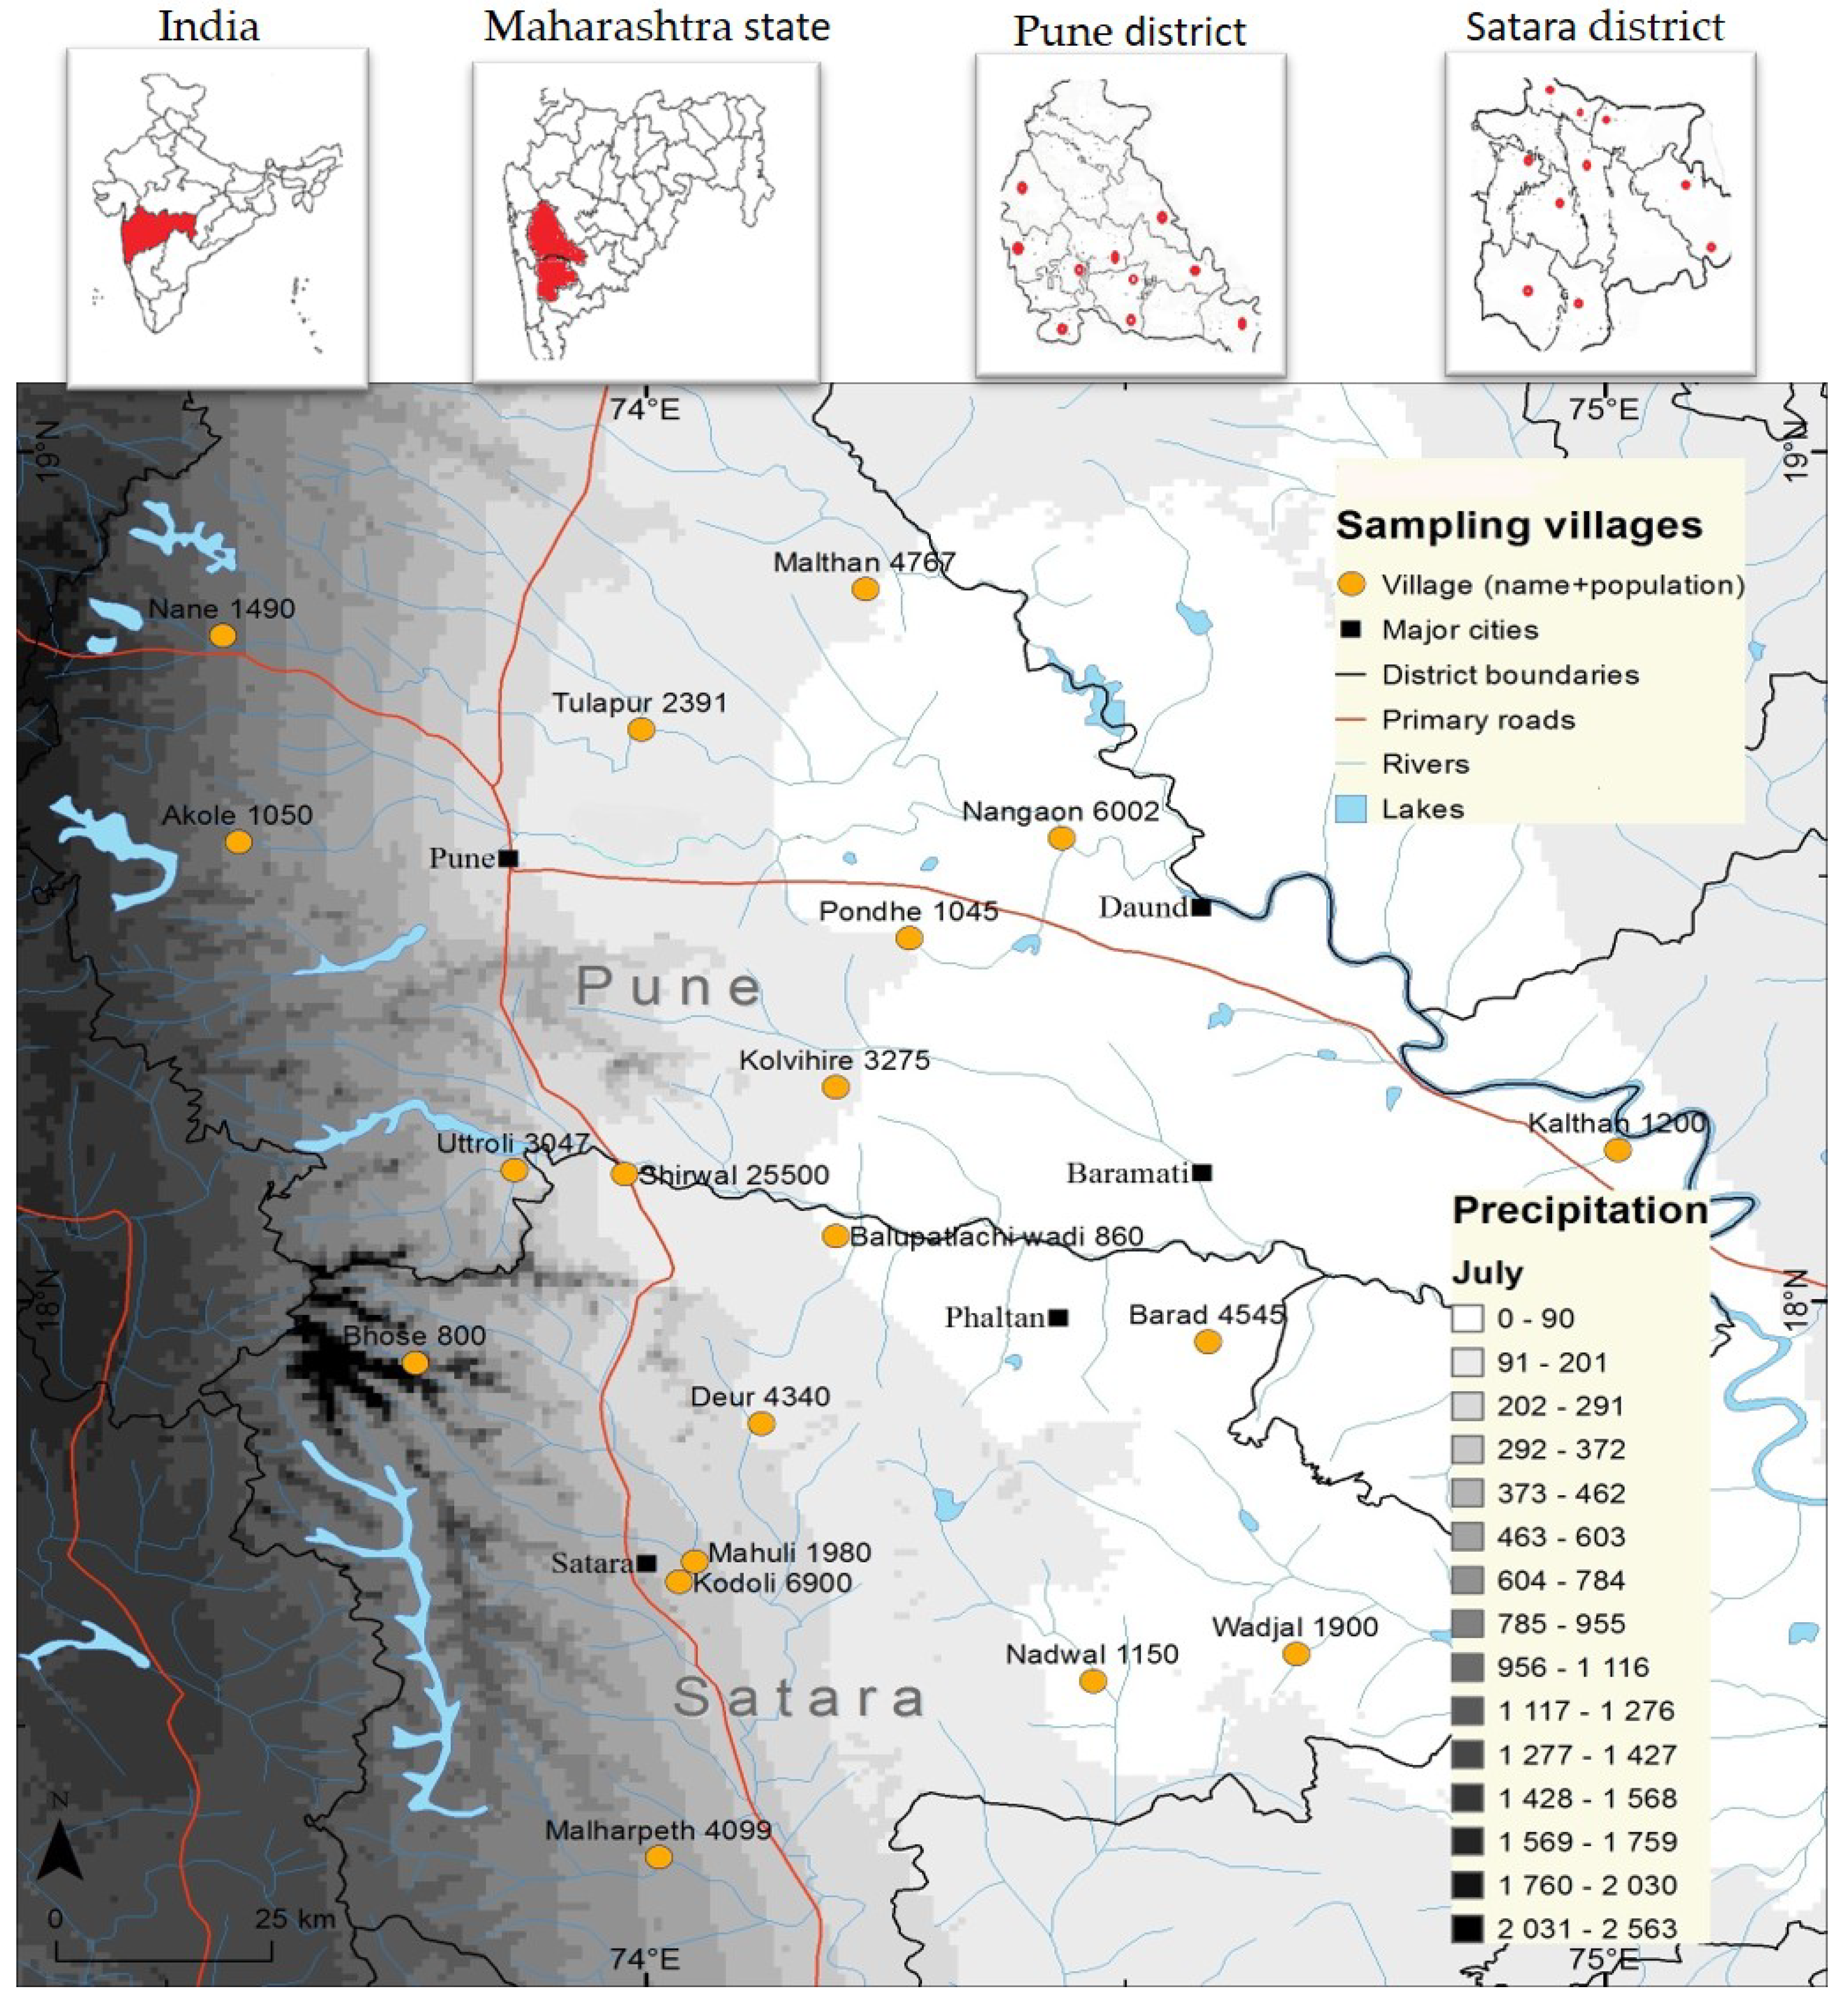
2.1. Study Area and Sampling Sites

The study area encompassed the adjacent districts of Pune and Satara in western Maharashtra, India. A total of twenty villages were chosen based on historic mean rainfall obtained from the Indian Meteorological Data center (IMD) located in Pune for years 1946 to 2006 and grouped into low and high rainfall zones based on the amount of rain received annually in millimeters (mm). Rainfall zones are classified as heavy (2000 mm and above), moderate (1000–2000 mm), and low (500–1000 mm) rainfall regions by IMD [5]. In the present study, moderate rainfall region was split into two parts, namely, above and below 1250 mm. Villages which received annual rainfall below 1250 mm were considered to be in the as low rainfall zones and above 1250 mm in the high rainfall zones. Additionally, annual rainfall data for different blocks in Pune and Satara was collected from the IMD for 2013, the year of actual water sampling. Since rainfall influences on water availability and quality, 2013 rainfall data wasalso given importance whenclassifying villages in different rainfall zones. Since emphasis was on dry land, 15 villages were selected in the low rainfall zone and 5 in the high rainfall zone.
A survey of the area was undertaken to map factors which could affect the water quality such as recent droughts or floods, type of industries along the river bank, and anthropogenic activities near water sources such as bathing, washing clothes, and bathing of animals. Based on these observations, villages and the sampling sites within them were selected (Figure 1 and Table 1).

2.2. Classification of Sampling Sites

The sampling sites were divided into: (1) Rivers which comprise of rivers, lakes, backwaters from dams and; (2) Ground water was divided into two subgroups, namely, Open wells and Bore wells. Open wells comprised of open-wells, underground seasonal and annual springs which have a small opening above the surface from which water is collected, storage tanks into which water from open wells is pumped. Bore wells included those with and without hand pumps fitted on top. Information about selected water sources is included in Table 1.

2.3. Sampling

The samples were collected four times in a twelve-month period. Monsoon sampling was done twice, during onset (June–July 2013) and end of monsoon (August, September 2013). Sampling was also undertaken during December 2013 to January 2014 and April and May 2014.
A total of 3700 mL of water was collected at each sampling in autoclavable polypropylene bottles. Two bottles containing 125 mL each were used for physical and chemical analysis and dissolved oxygen, 1000 mL for analysis of Total Suspended Solids (TSS) and 2000 mL for analysis of ammonia, total phosphorus, calcium, and nitrate. Approximately 400 mL was collected in previously autoclaved 500 mL bottles for bacteriology and the bottles were immediately kept on ice and transported to the laboratory on the same day, stored at 4 °C, and bacteriological analysis was undertaken on the following day. To collect water from previously chlorinated sources, 300 µl of 3% Sodium thiosulphate was added to the bottles before sterilization [28].

2.4. Physical and Chemical Analysis of Water

Basic physical and chemical analysis was performed in the field. The parameters measured were temperature, pH, conductivity, total dissolved solids, and salinity. Previously calibrated probes for soil and water analysis (kit from Zennith Engineers, India) were used as per manufacturer’s instructions. To check residual chlorine, strips (HiMedia, Mumbai, India) were used. Turbidity was determined by the Nephelometric method (IS3025: part 10).
Dissolved Oxygen (DO) was fixed on site using Winkler reagents and the values were later titrated on the same day [29].
For the analysis of the remaining parameters the water samples were transported to Mumbai. Total Suspended Solids (TSS) was determined by filtration and expressed as mg/L [30]. Ammonia estimation was carried out using the phenol-hypochlorite method [31]. Estimation for nitrate, total phosphorous, calcium, fluoride, and 2,4-Dichlorophenoxyacetic acid (2,4-D) contents was outsourced to Microchem Silliker Laboratories. They used IS: 3025 methods for nitrate, calcium, and fluoride estimation whereas for ammonia, total phosphorus, and 2,4-Dinhouse methods were used.

2.5. Water Analysis for Bacteriology

Faecal coliforms (FC) and intestinal enterococci (IE) were enumerated by membrane filtration of 100 mL, 10 mL, and 1 mL aliquots through cellulose acetate 0.22 µ filters. The filter papers were placed face upward on (1) faecal coliforms (m-FC) agar and incubated at 44.5 °C for 24 h in case of FC and observed for blue coloured colonies; (2) in the case of IE, the filter paper was placed on m-Enterococcus agar and incubated at 37 °C for 24 h. The filter paper with countable and isolated pink colonies was then transferred on to Bile Esculin Azide agar with the colony side facing up and further incubated at 44.5 °C for 18 h. The filter paper was then checked for blackening around the colonies. The m-FC or Bile Esculin Azide agar plate in which countable isolated colonies were observed was used for enumeration and results expressed as Colony Forming Units (CFU) per 100 mL [32].

2.6. Bacteriological Data Analysis

The characterization of major drinking water sources like open wells and bore wells was done with respect to FC based on previous WHO guidelines for drinking water where FC counts of 0, 1–10, 10–100, 100–1000, >1000 per 100 mL were correlated with no risk, low risk, intermediate risk, high risk, and very high risk respectively [27]. Though intestinal enterococci are faecal indicator bacteria, they are not used as indicator organisms for faecal contamination since they can multiply in water. However, they were included in screening of water samples since various species of IE are naturally resistant to the environmental stressors and chemicals to which FC are sensitive [33].

2.7. Calculation of Modified Water Quality Index (WQI)

Two different indices, namely, ‘modified WQI’ and ‘OIP’ were used. Modified WQI was used to assess water quality of all types of water sources, and Overall Index of Pollution (OIP) was used for rivers. To determine the degree to which water quality is affected by faecal bacteria, modified WQI without FC and OIP with inclusion of FC were compared with each other in river water bodies.
Water Quality Index (WQI) used in the present study was modified from the WQI used by Marale et al. 2012 [1] and Akkaraboyina & Raju 2012 [19]. An index value was given for nine physical and chemical parameters, where the lowest index value indicated good quality and the highest indicated poor quality (Table 2). While assigning weights, the Bureau of Indian Standards [24] permissible limits and the annual data set were considered. Some parameters have a greater influence on water quality and this influence varies from type of source and geographical location. Bacteriology was omitted from modified WQI and analyzed separately to check its impact on water quality.
The calculation of modified Water Quality Index (WQI) is as follows:
Physical and chemical parameters with standard values: The recommended drinking water values from BIS were used to create the index values. The maximum concentration permissible for drinking water as stated by BIS was given the index value 5, thus index values below 5 were interpreted as acceptable and above 5 as unacceptable. The interval size was calculated by dividing this standard value by 5 [34].
Analysis of physical and chemical parameters where standard values are not available: Parameters which did not have optimum or recommended drinking water values according to BIS (conductivity, salinity, total suspended solids) were split into 10 equal intervals between 0 and the highest measured value. Where the data was not uniformly distributed and contained outliers with high values, the average of the observed values including the outliers was calculated, doubled, and then divided by 10 for calculation of interval.
Dissolved oxygen (DO): A low index value represented good quality for all physical and chemical parameters except DO wherein the reverse was true. Air and plant byproducts are the sources of dissolved oxygen. These sources are directly linked to the open water bodies [29]. Hence dissolved oxygen is considered only for rivers and open wells. The standard value for DO was 6ppm as per Indian limit for class A sources, which are drinking water sources without conventional treatment [10]. An Index value 5 was assigned to 6ppm with intervals of 1.2. This was calculated by dividing the standard value of 6 into 5 intervals.
pH: The optimal pH for drinking water ranges between 6.5 to 8.5 (BIS 10500 Desirable limit). The value 7.5 which is average of 6.5 and 8.5 was considered as the best and given an index value of 1. The pH range was split into two classes where acidic range was generated from 7.5 and below and basic range was developed from 7.5 and above. The BIS drinking water range (6.5–8.5) differs from 7.5 by 1 pH unit, therefore the size of each interval in both groups was considered as 0.2 which was obtained by dividing 1 pH unit by 5.
Assigning weights: Assigning weights to different parameters varied from place to place and it is often defined by local water experts [30]. In the present study, a particular parameter which had a greater impact on water quality was given a higher weightage based on the seasonal data set [35,36,37]. Additionally, seasonal data set and type of source, namely, rivers, open wells and borewells were also considered while assigning weights (Table 3).
The Water Quality Index (WQI) for each sampling site was calculated by multiplying index value (Table 2) with assigned weight (Table 3) and dividing by 9 (sum of weights as per Table 3).
Thus, a WQI was generated between 1 and 10 for each sampling site where WQI of 10 indicated bad water quality, 5 indicated average or barely fulfilling the drinking water criteria, while values below 5 indicated good water quality for the parameters included in the index.

2.8. Calculation of Overall Index of Pollution (OIP)

Overall Index of Pollution (OIP): for rivers was calculated using turbidity, pH, TDS, oxygen saturation, nitrate, and FC. Oxygen saturation was derived from dissolved oxygen, temperature, and salinity. OPI used by Sargaonkar& Deshpande (2003) considered E coli count for calculation of OIP. The Class index values were calculated using numerical equations [38]. The numerical estimate of OIP corresponded to different levels of pollution, namely, 0–1, 1–2, 2–4, 4–8, 8–16 stand for excellent, acceptable, slightly polluted, polluted, and heavily polluted water respectively [22].

3. Results and Discussion

3.1. Annual Rainfall and Classification of Sampling Sites

Table 1 summarizes the details of the 20 villages selected from Pune and Satara districts along with the rainfall data for 2013 and the historic mean. In the absence of 2013 data, the recorded historic mean rainfall was used as the criterion for classification. Whilst in most of the villages rainfall data for 2013 was concordant with the historic mean, in Uttroli a discrepancy was observed wherein the historic data classified it as low rainfall, though 2013 data indicated high rainfall. For the purpose of this study Uttroli was placed in high rainfall zone based on the rainfall recorded in 2013 (1611 mm).

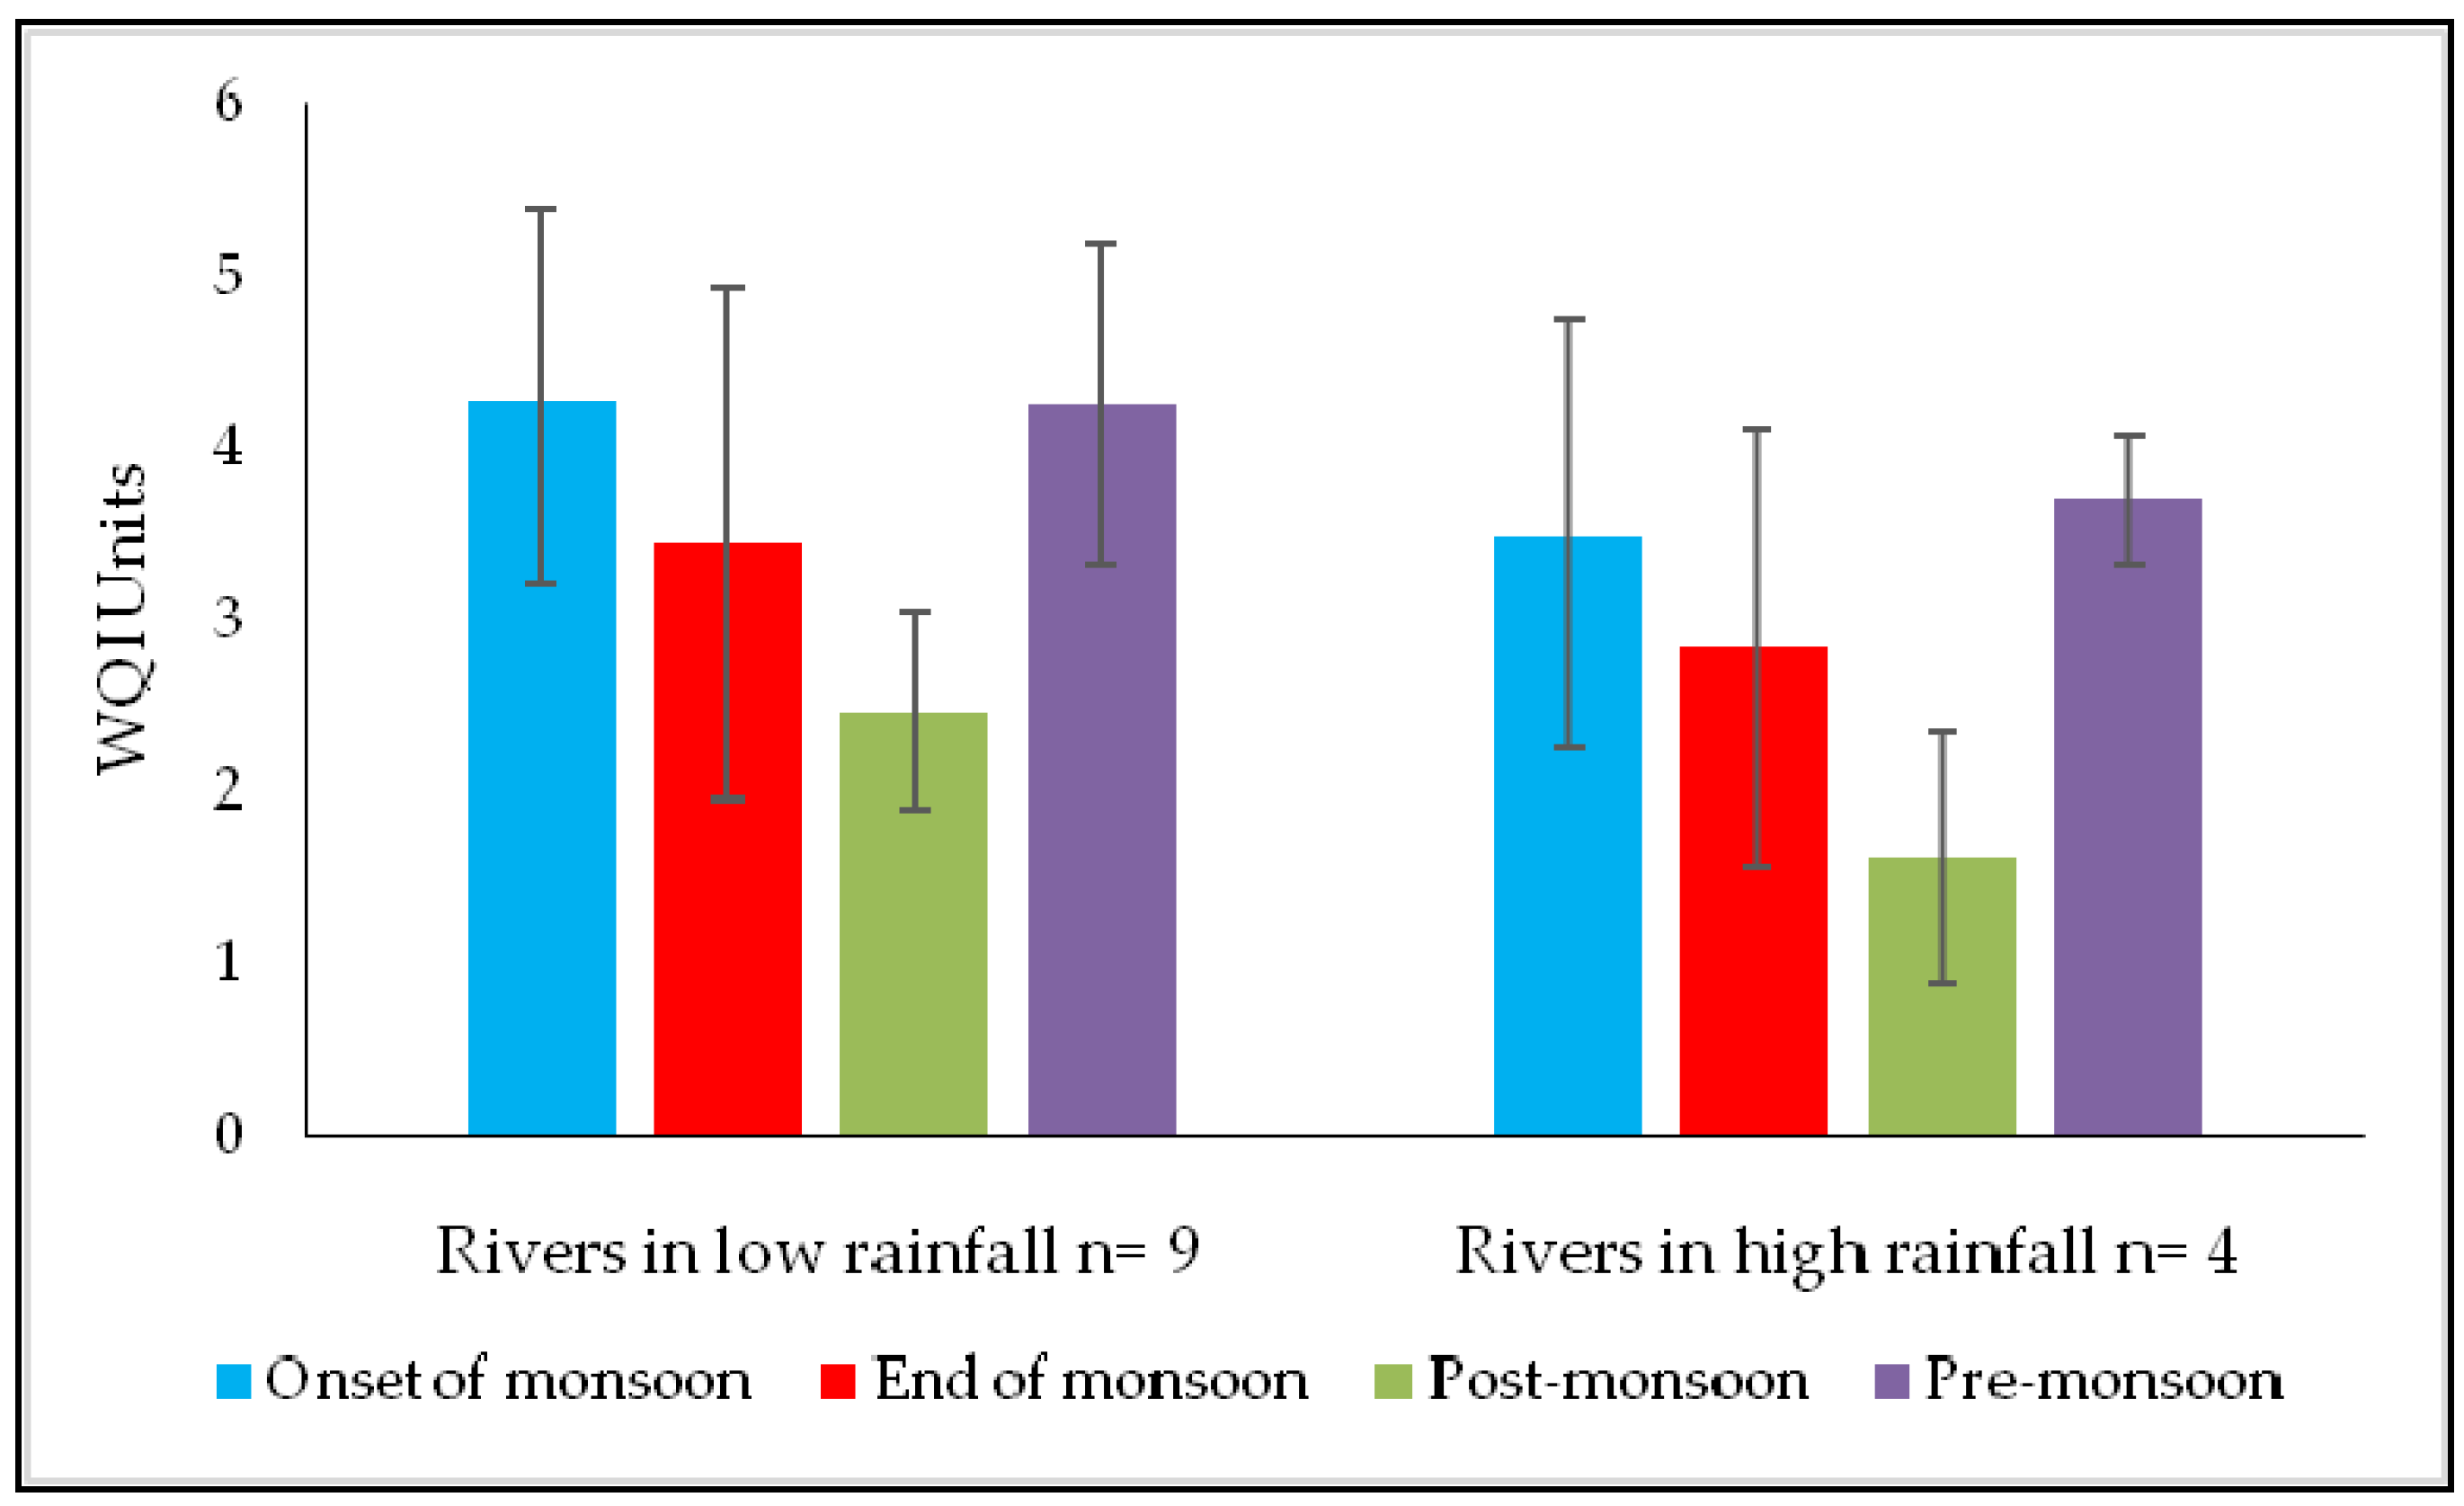
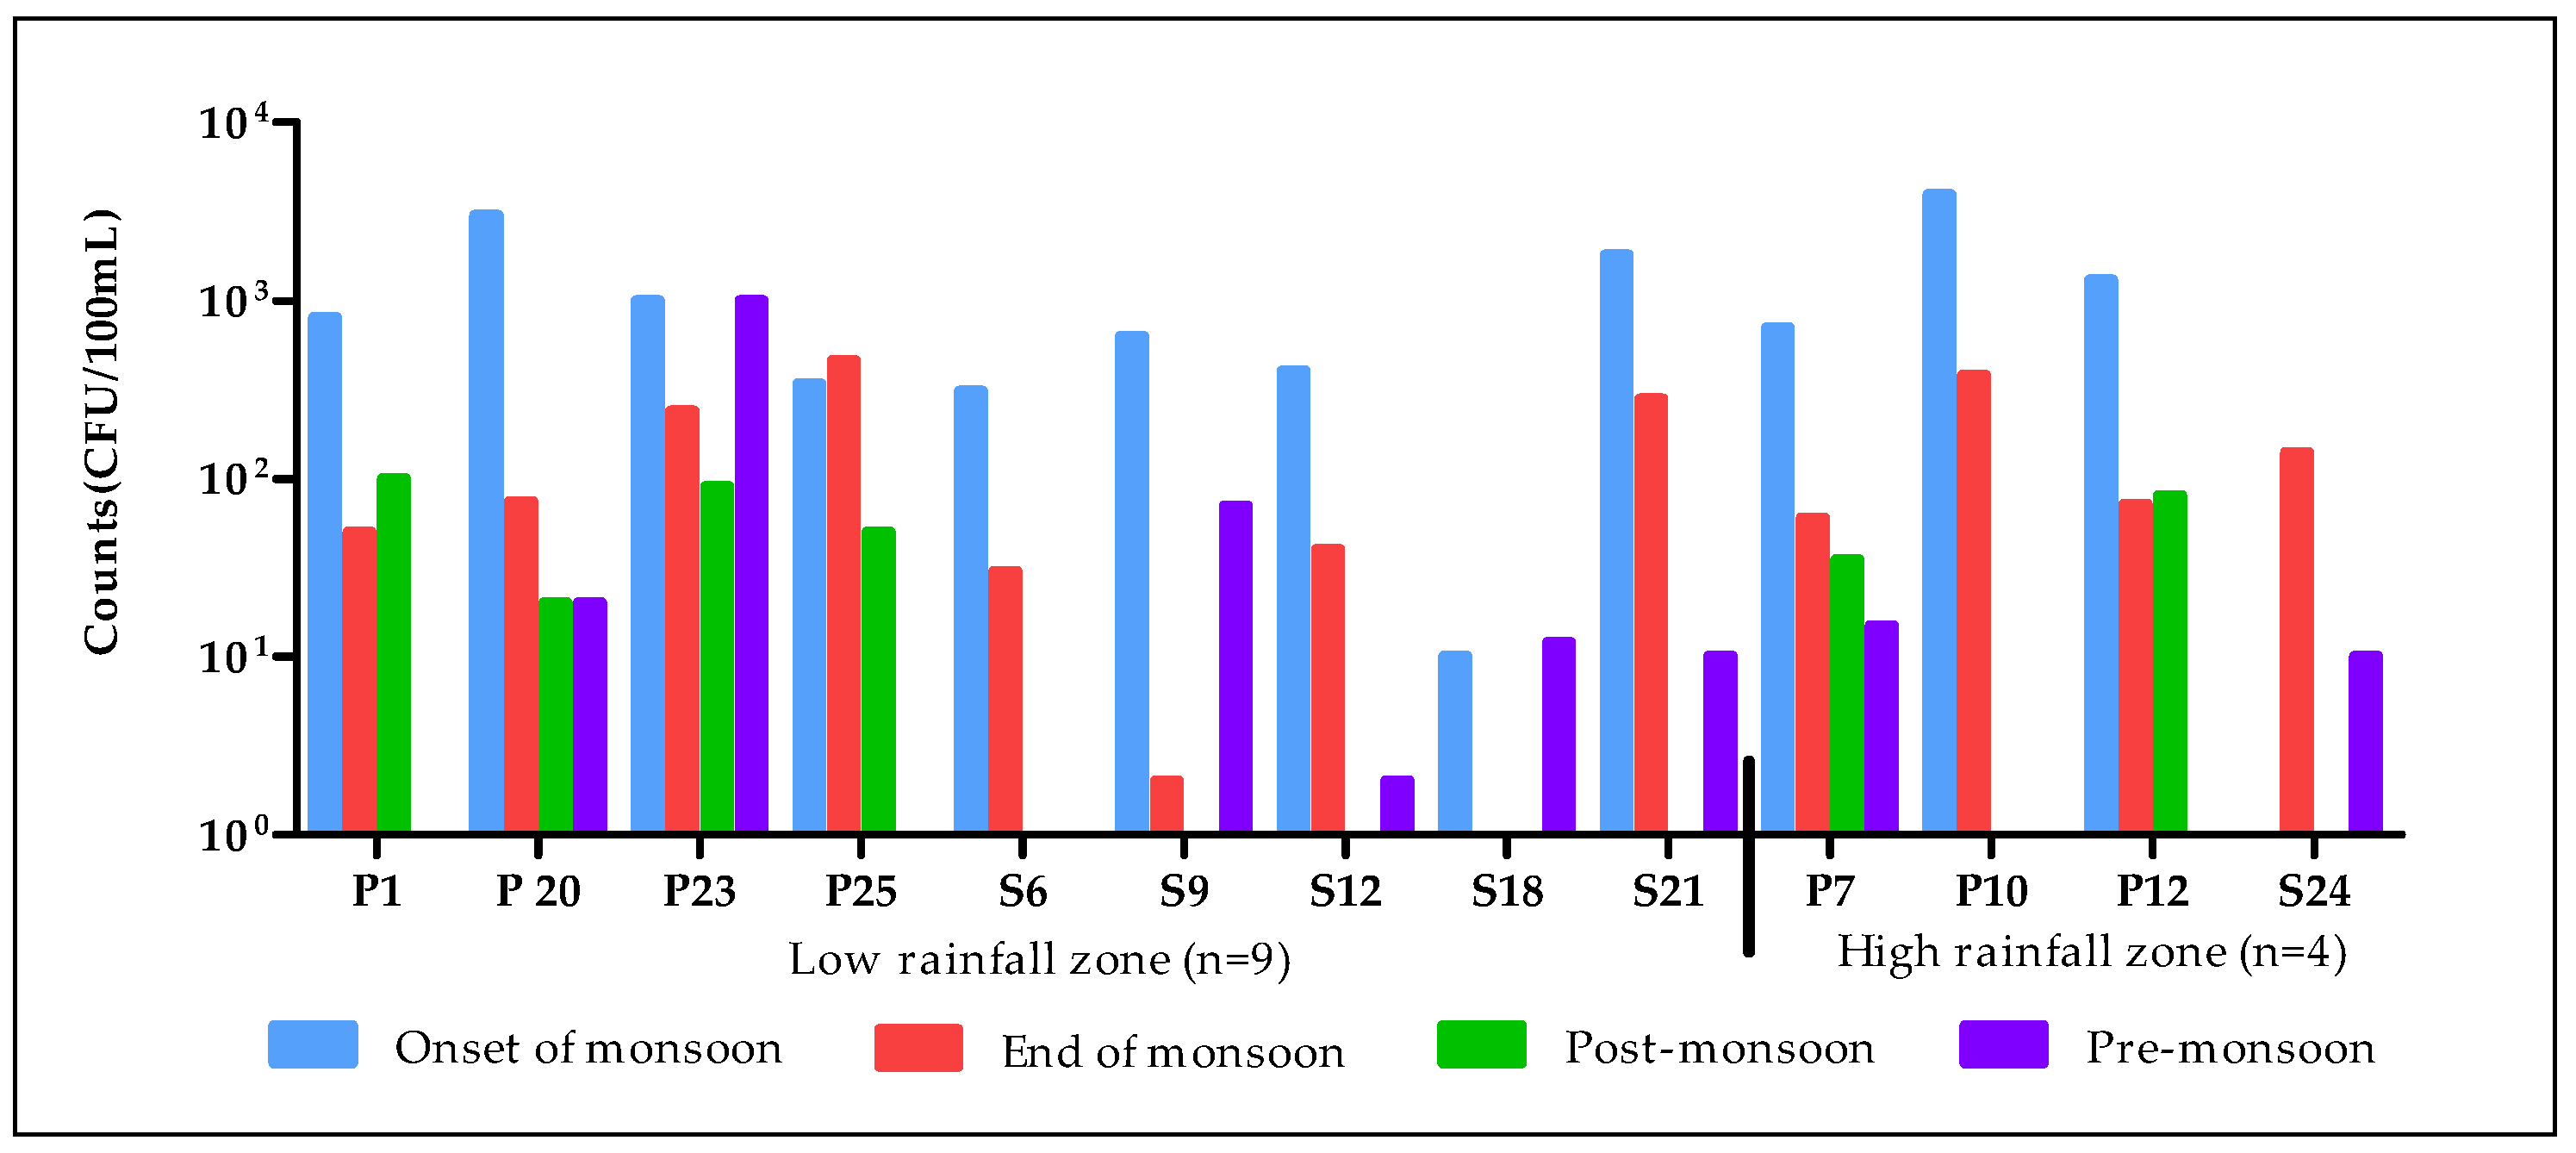
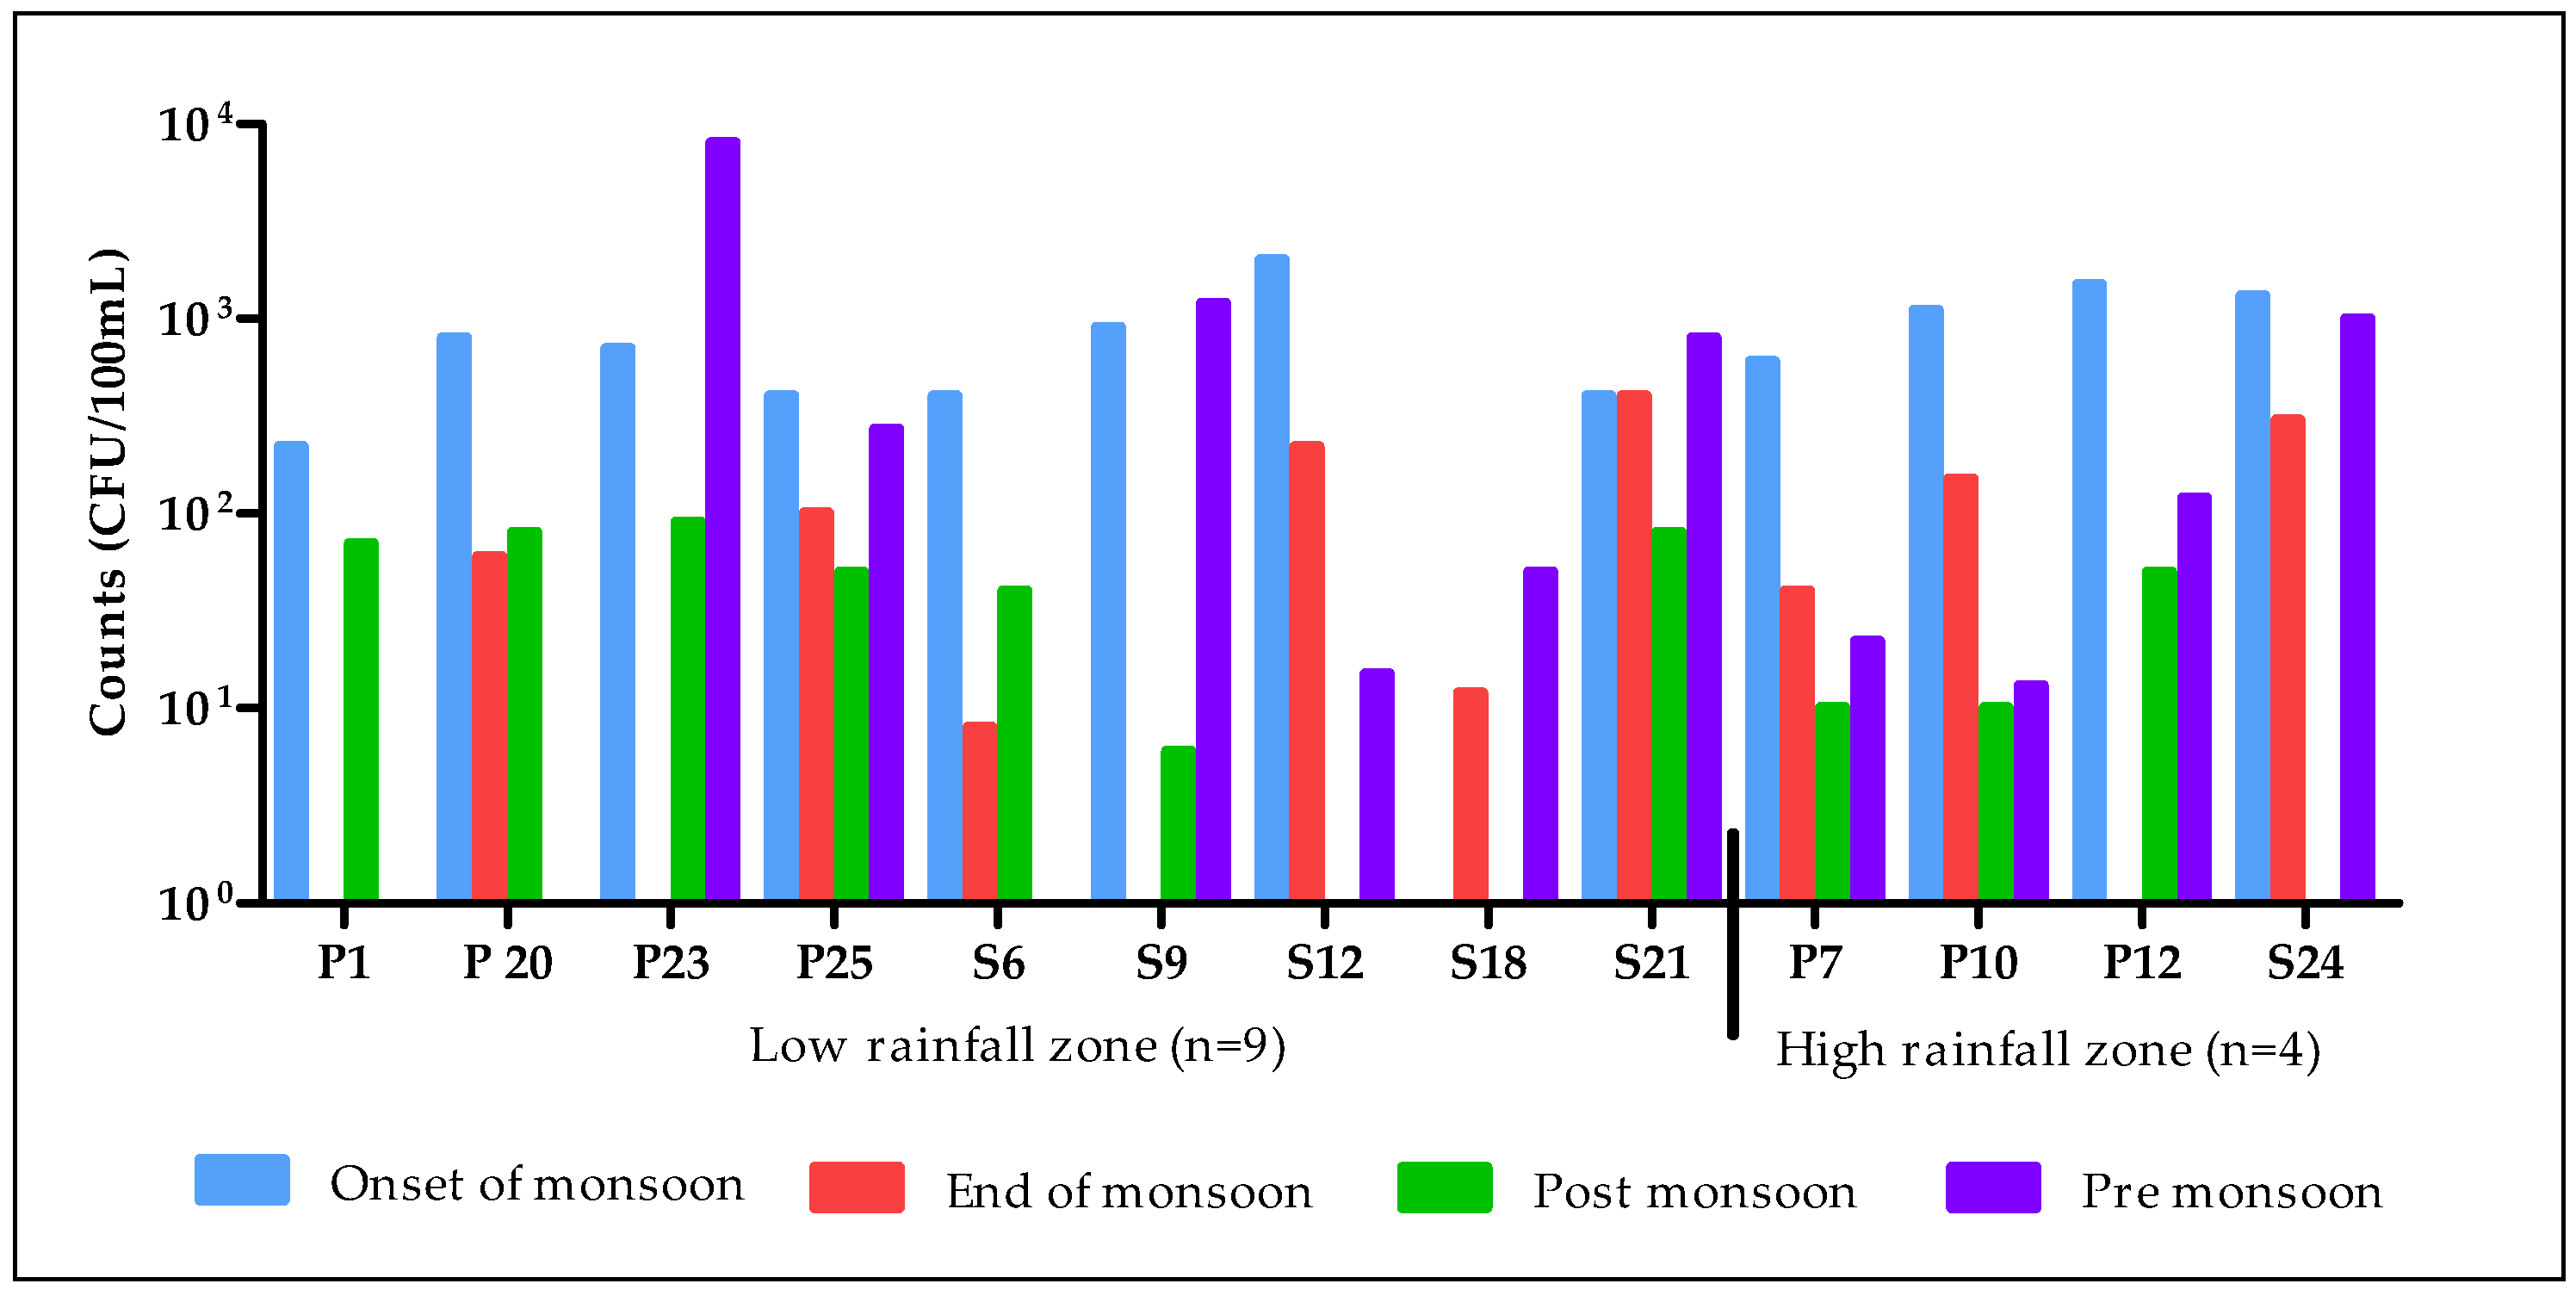
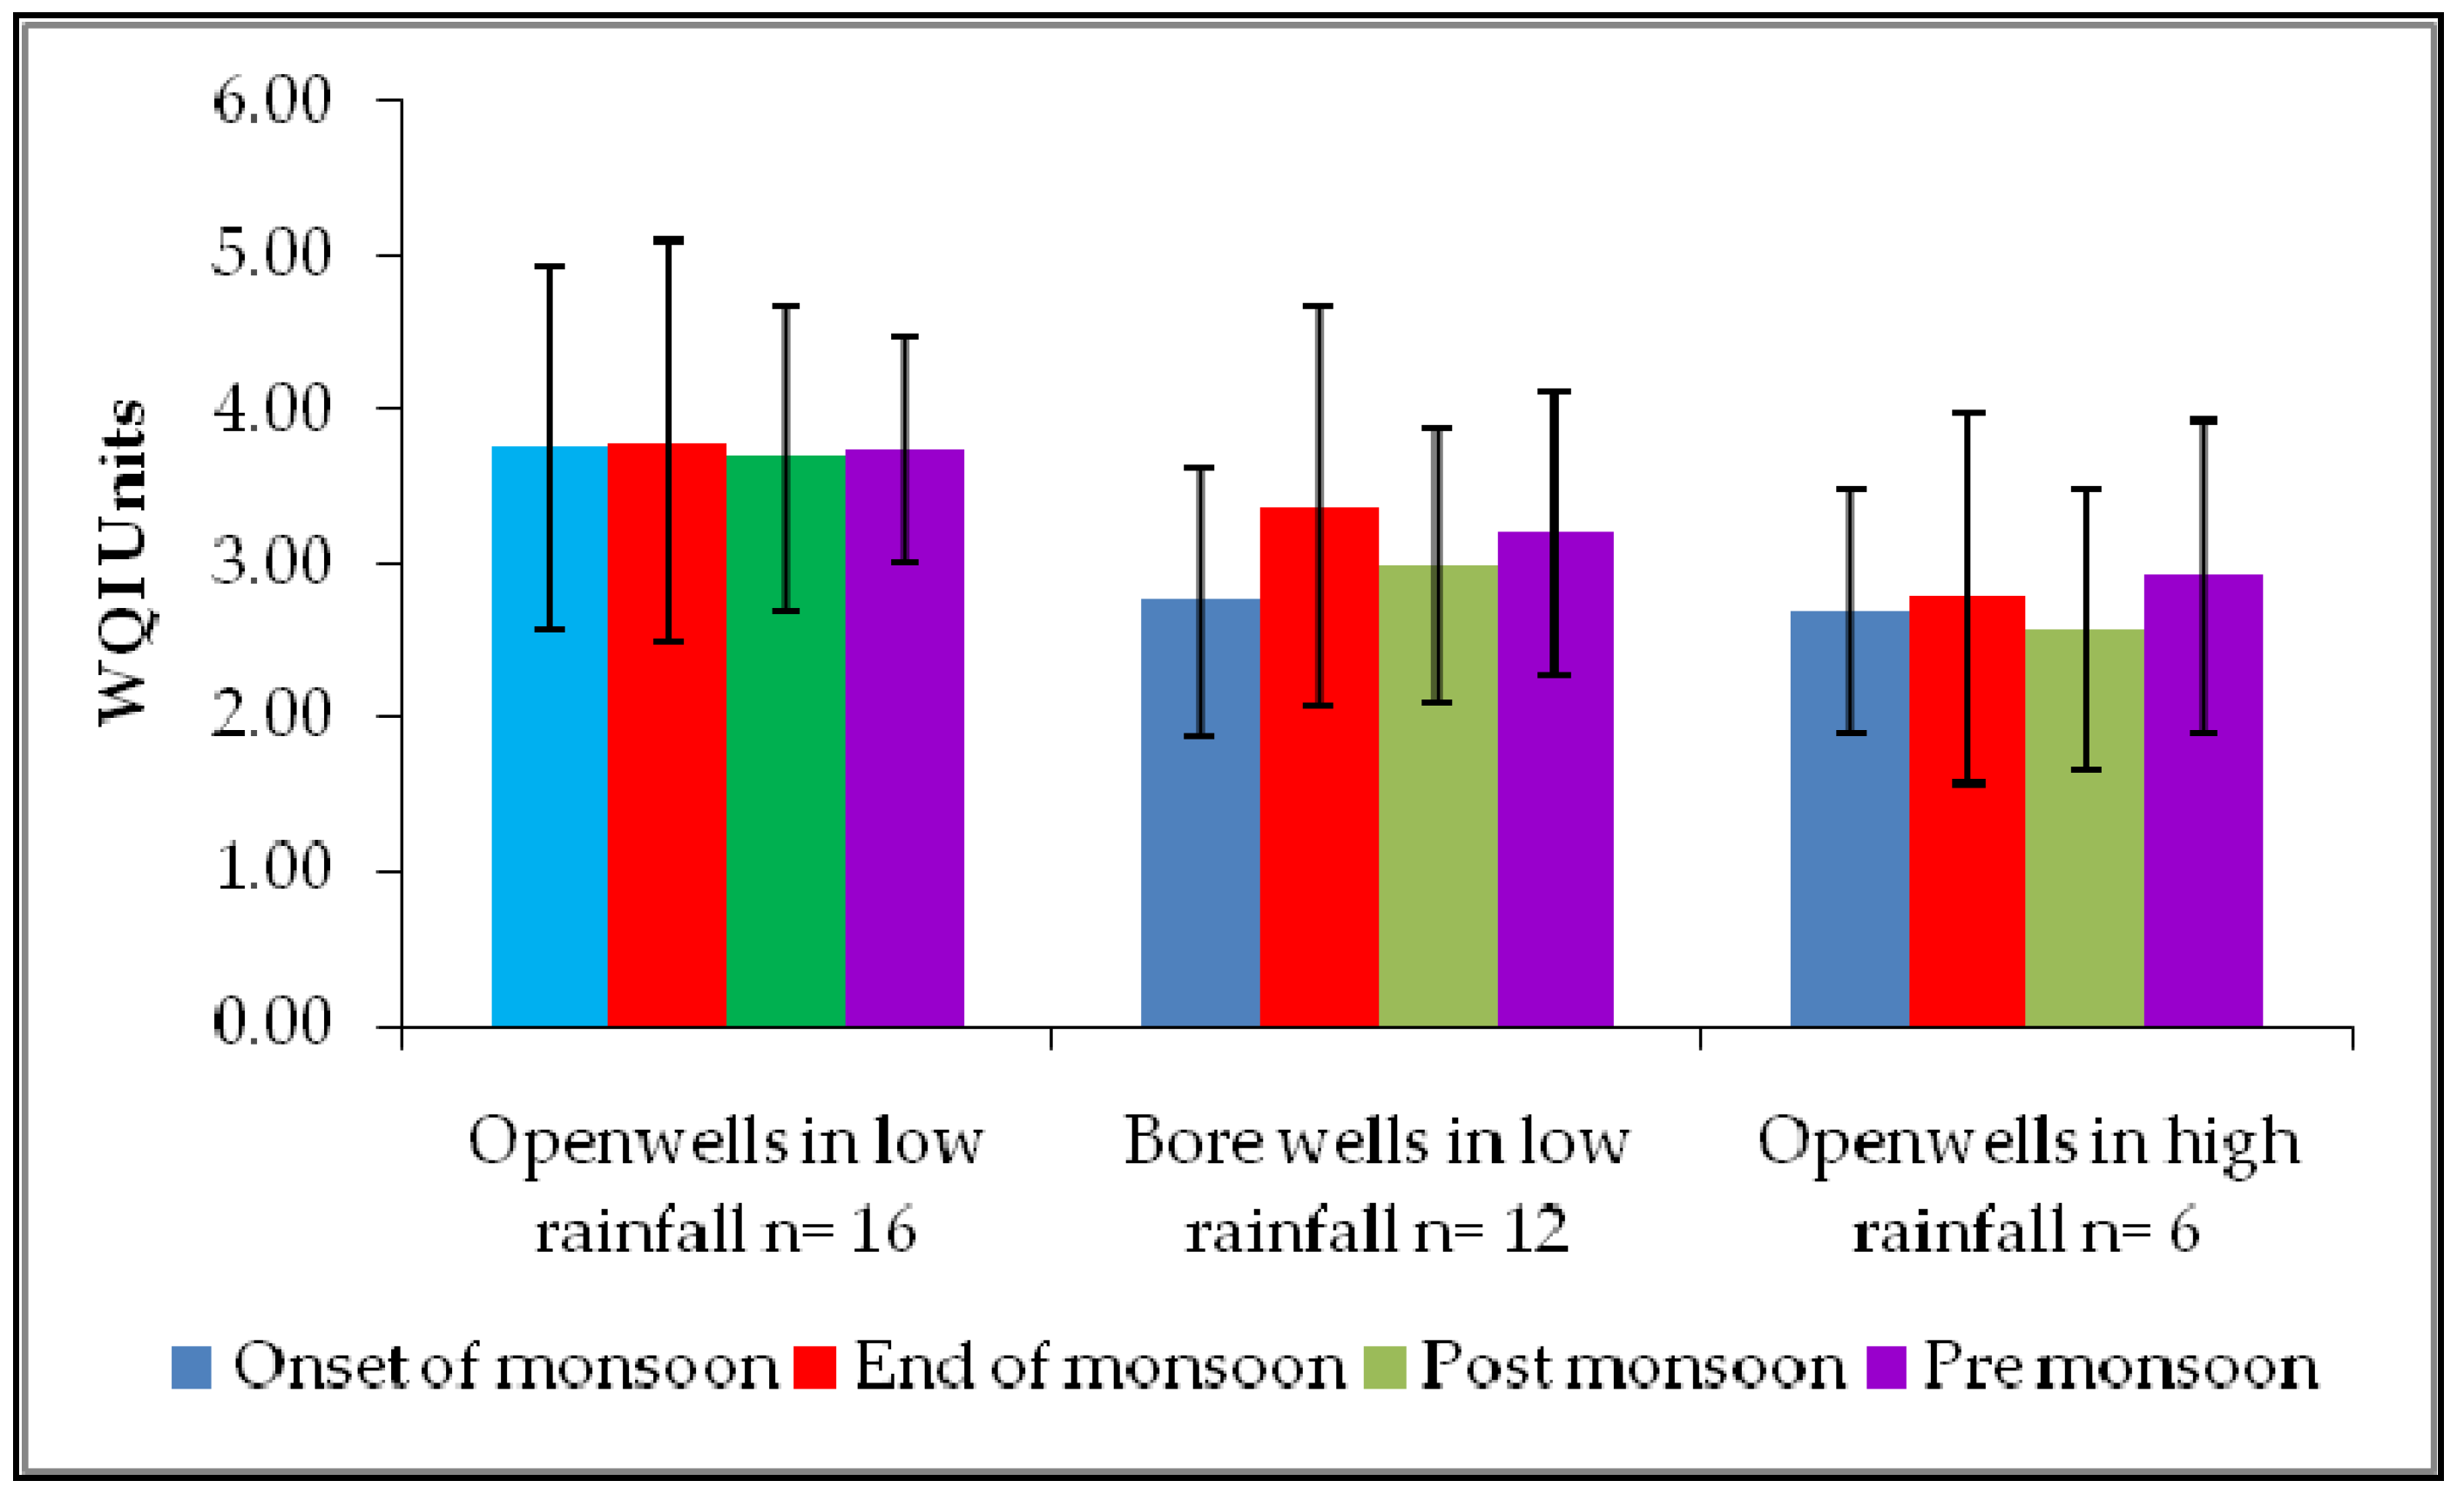
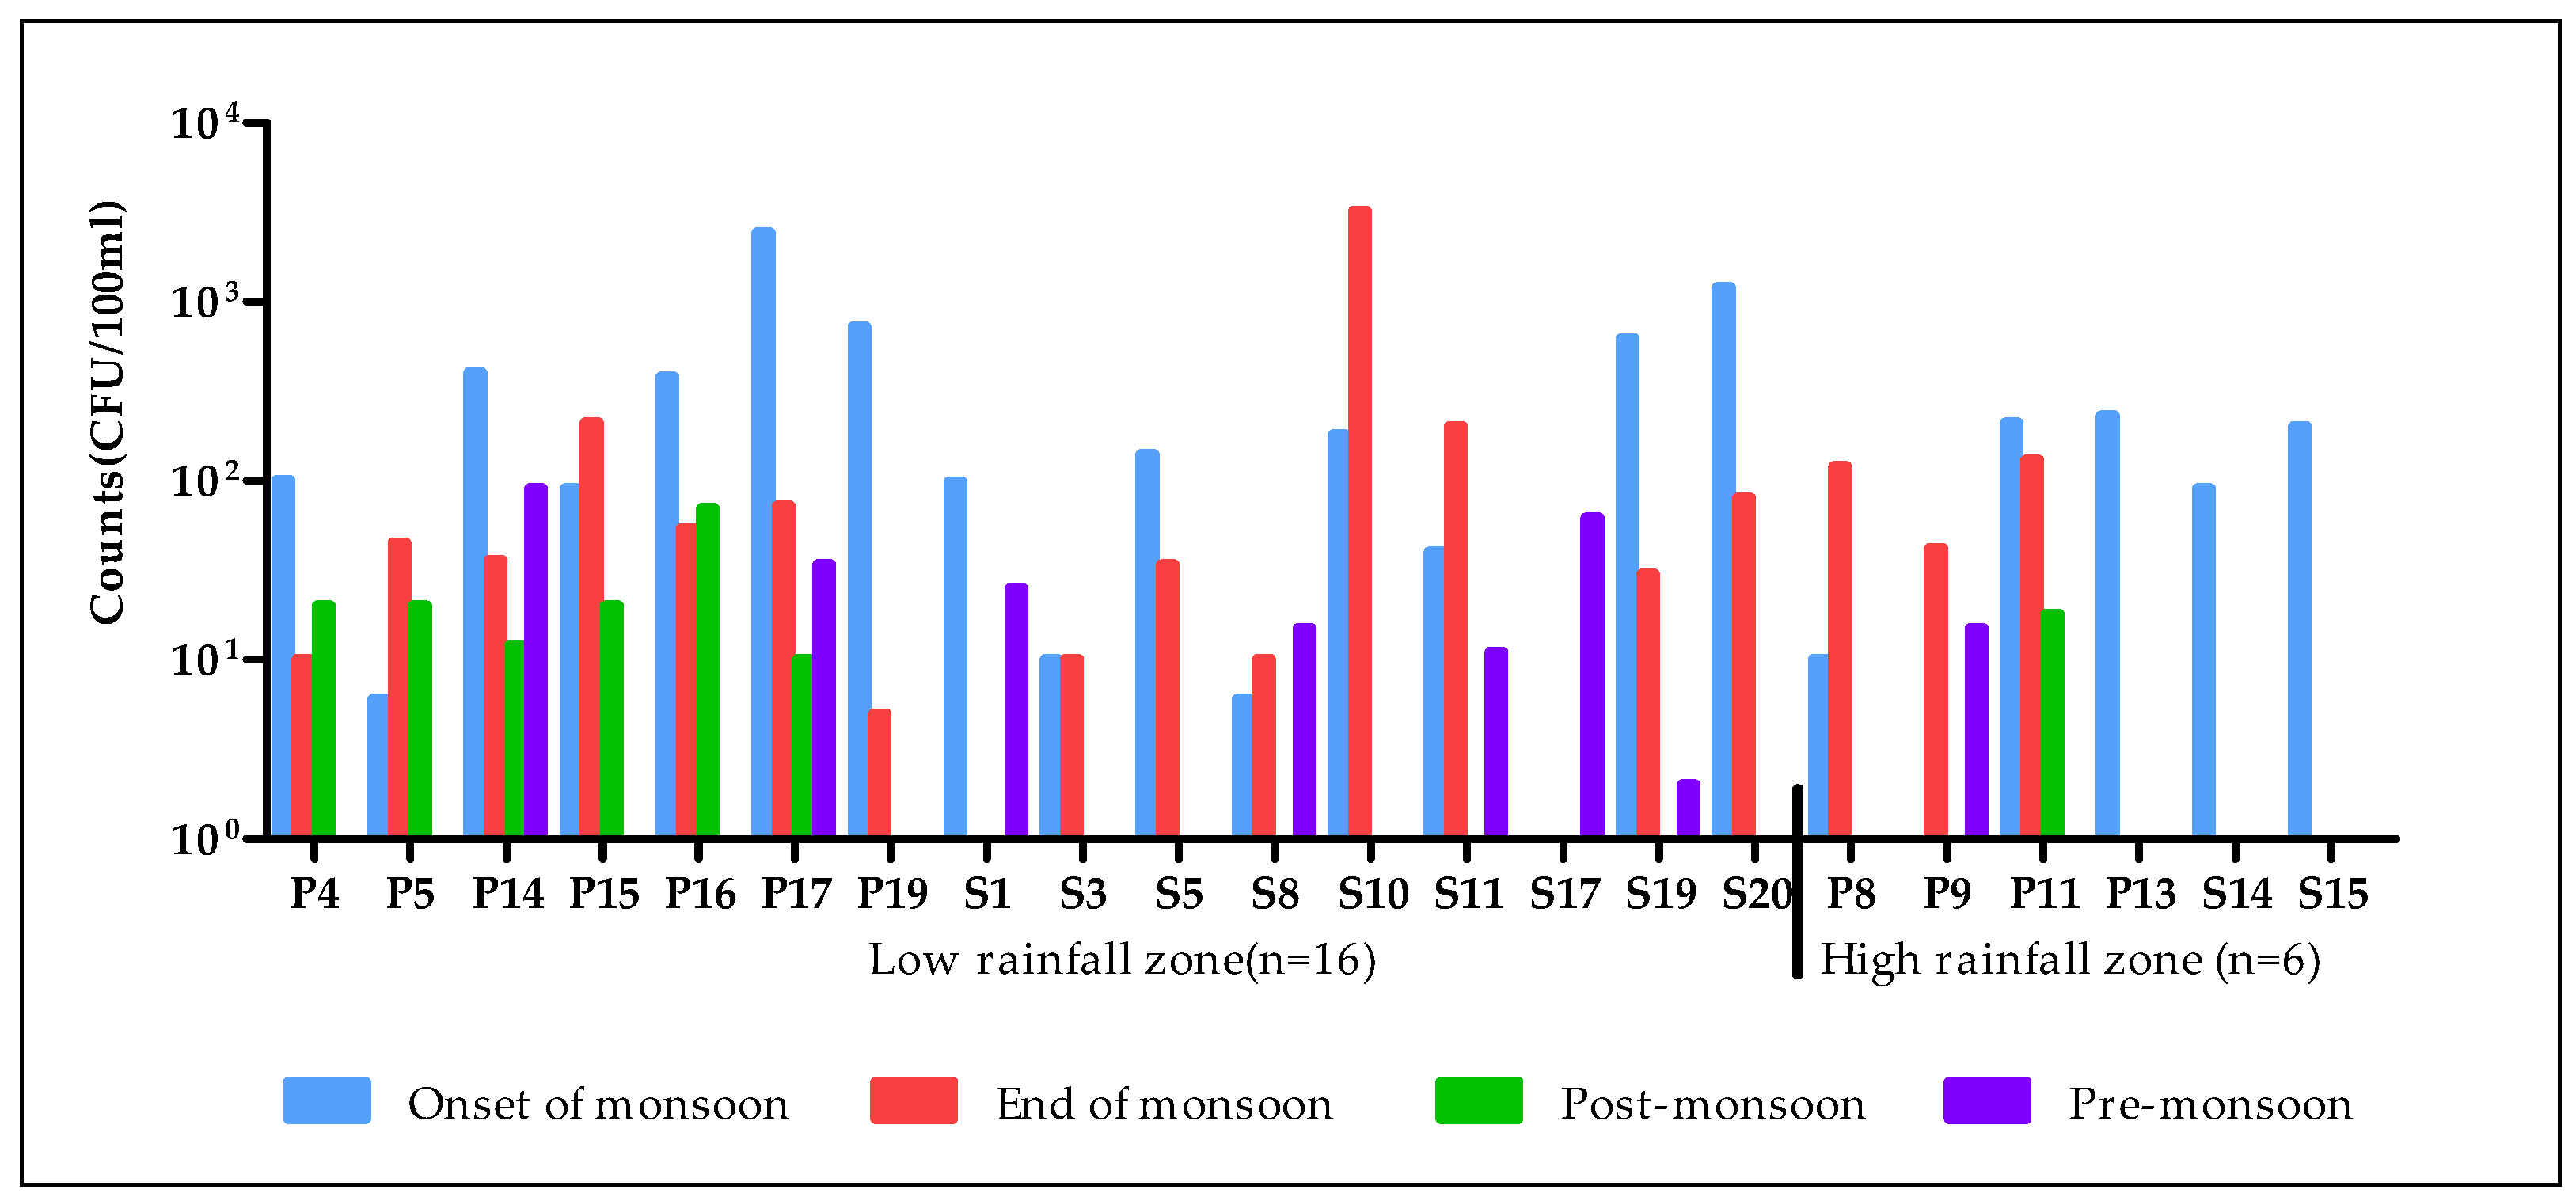
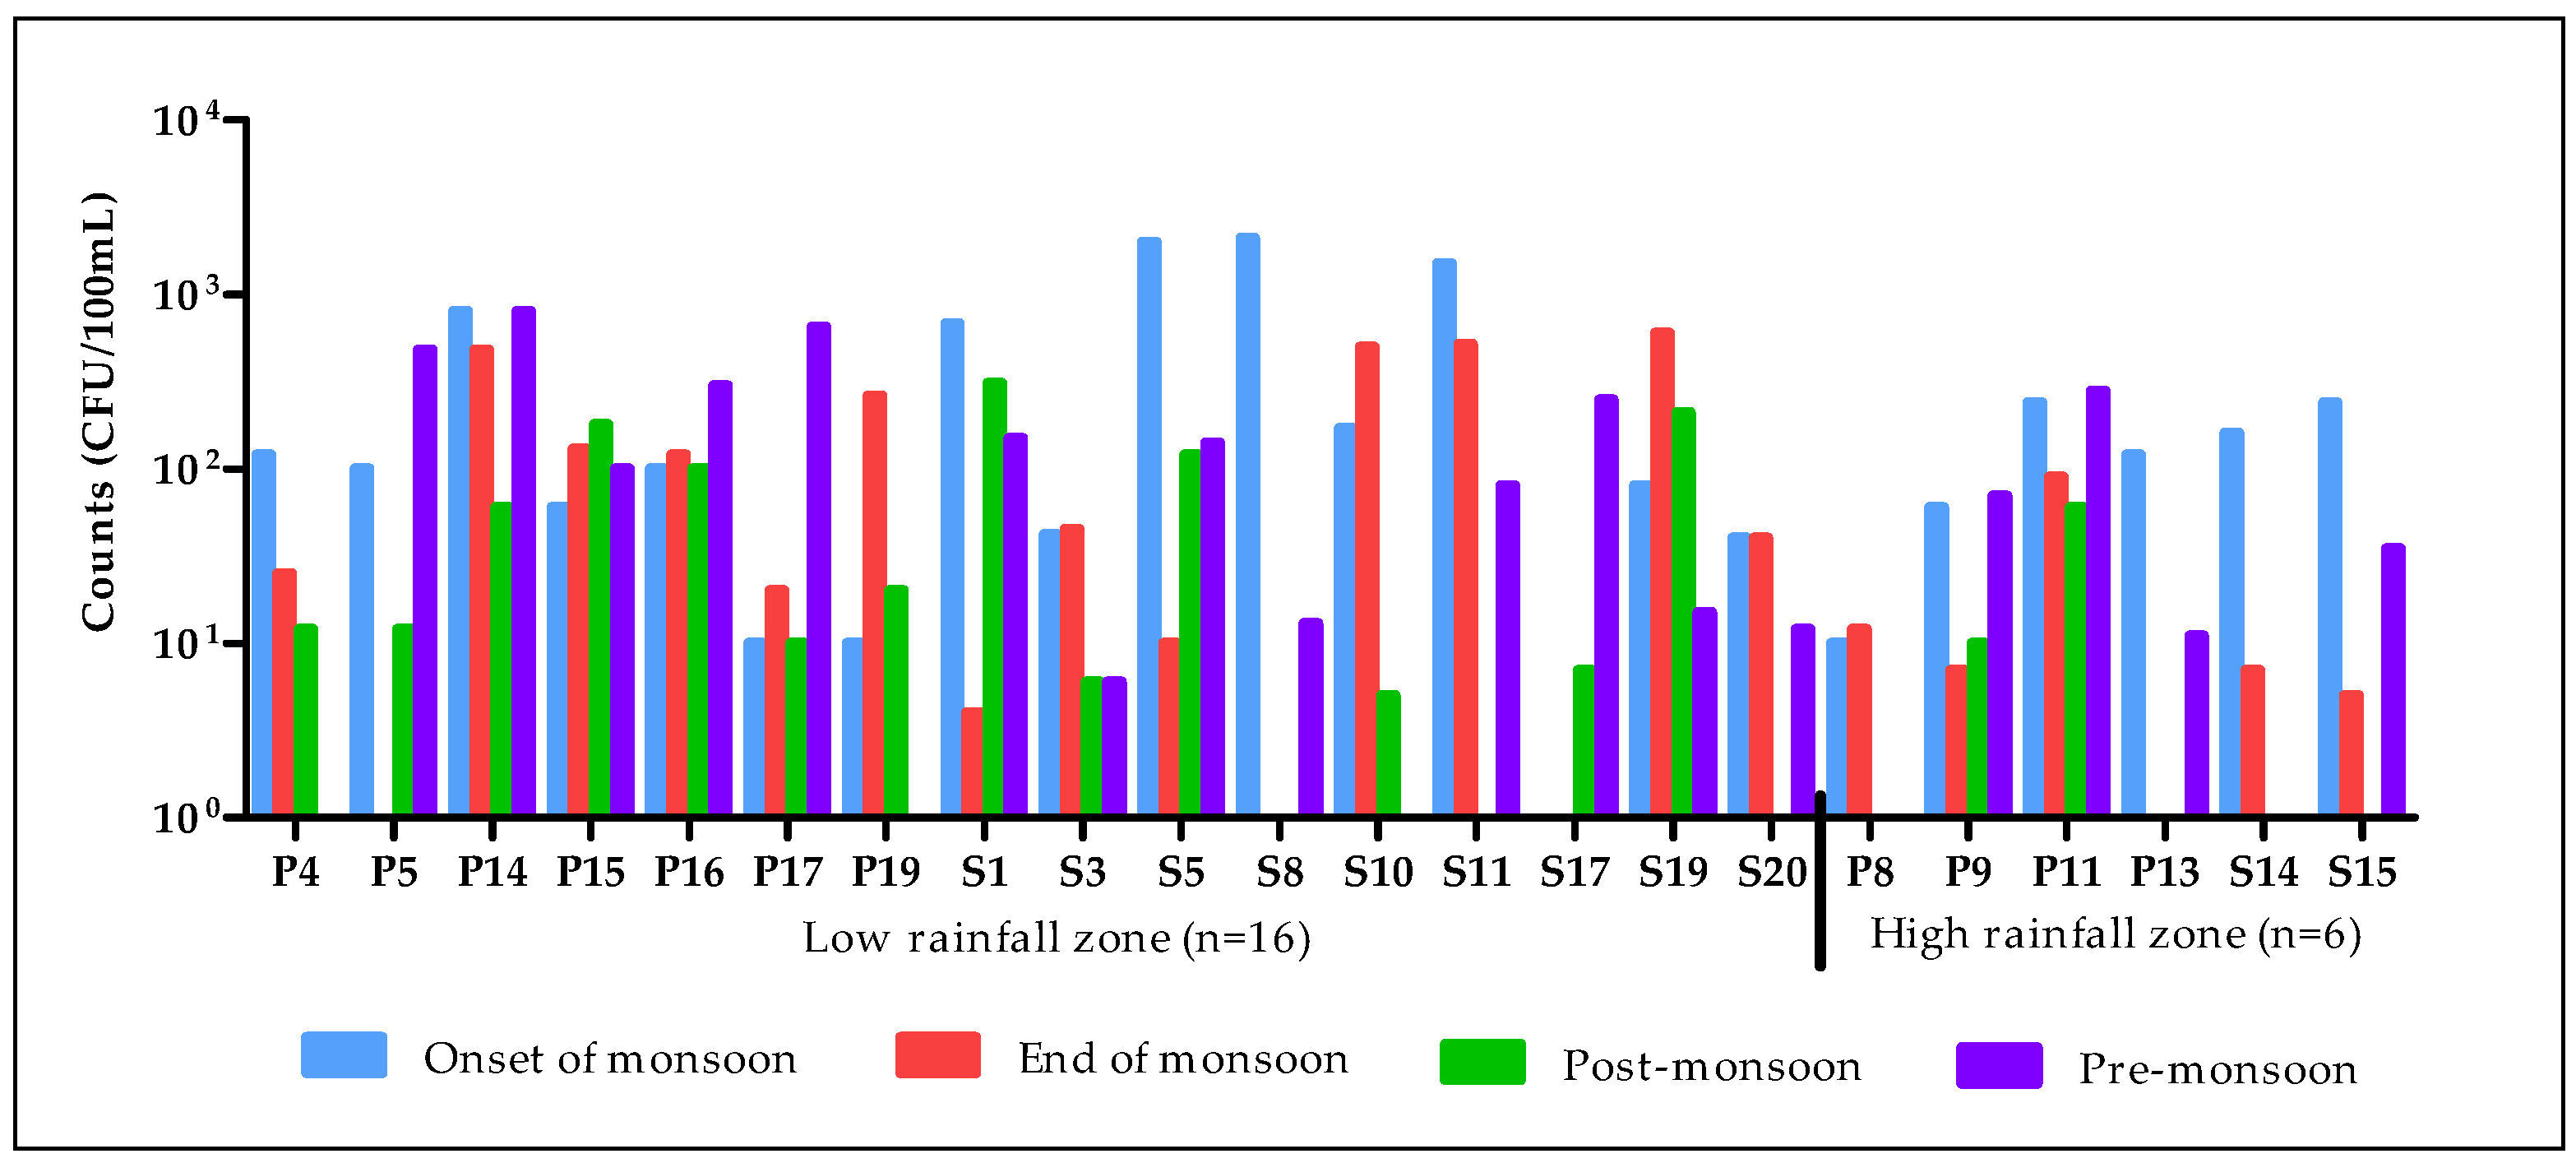
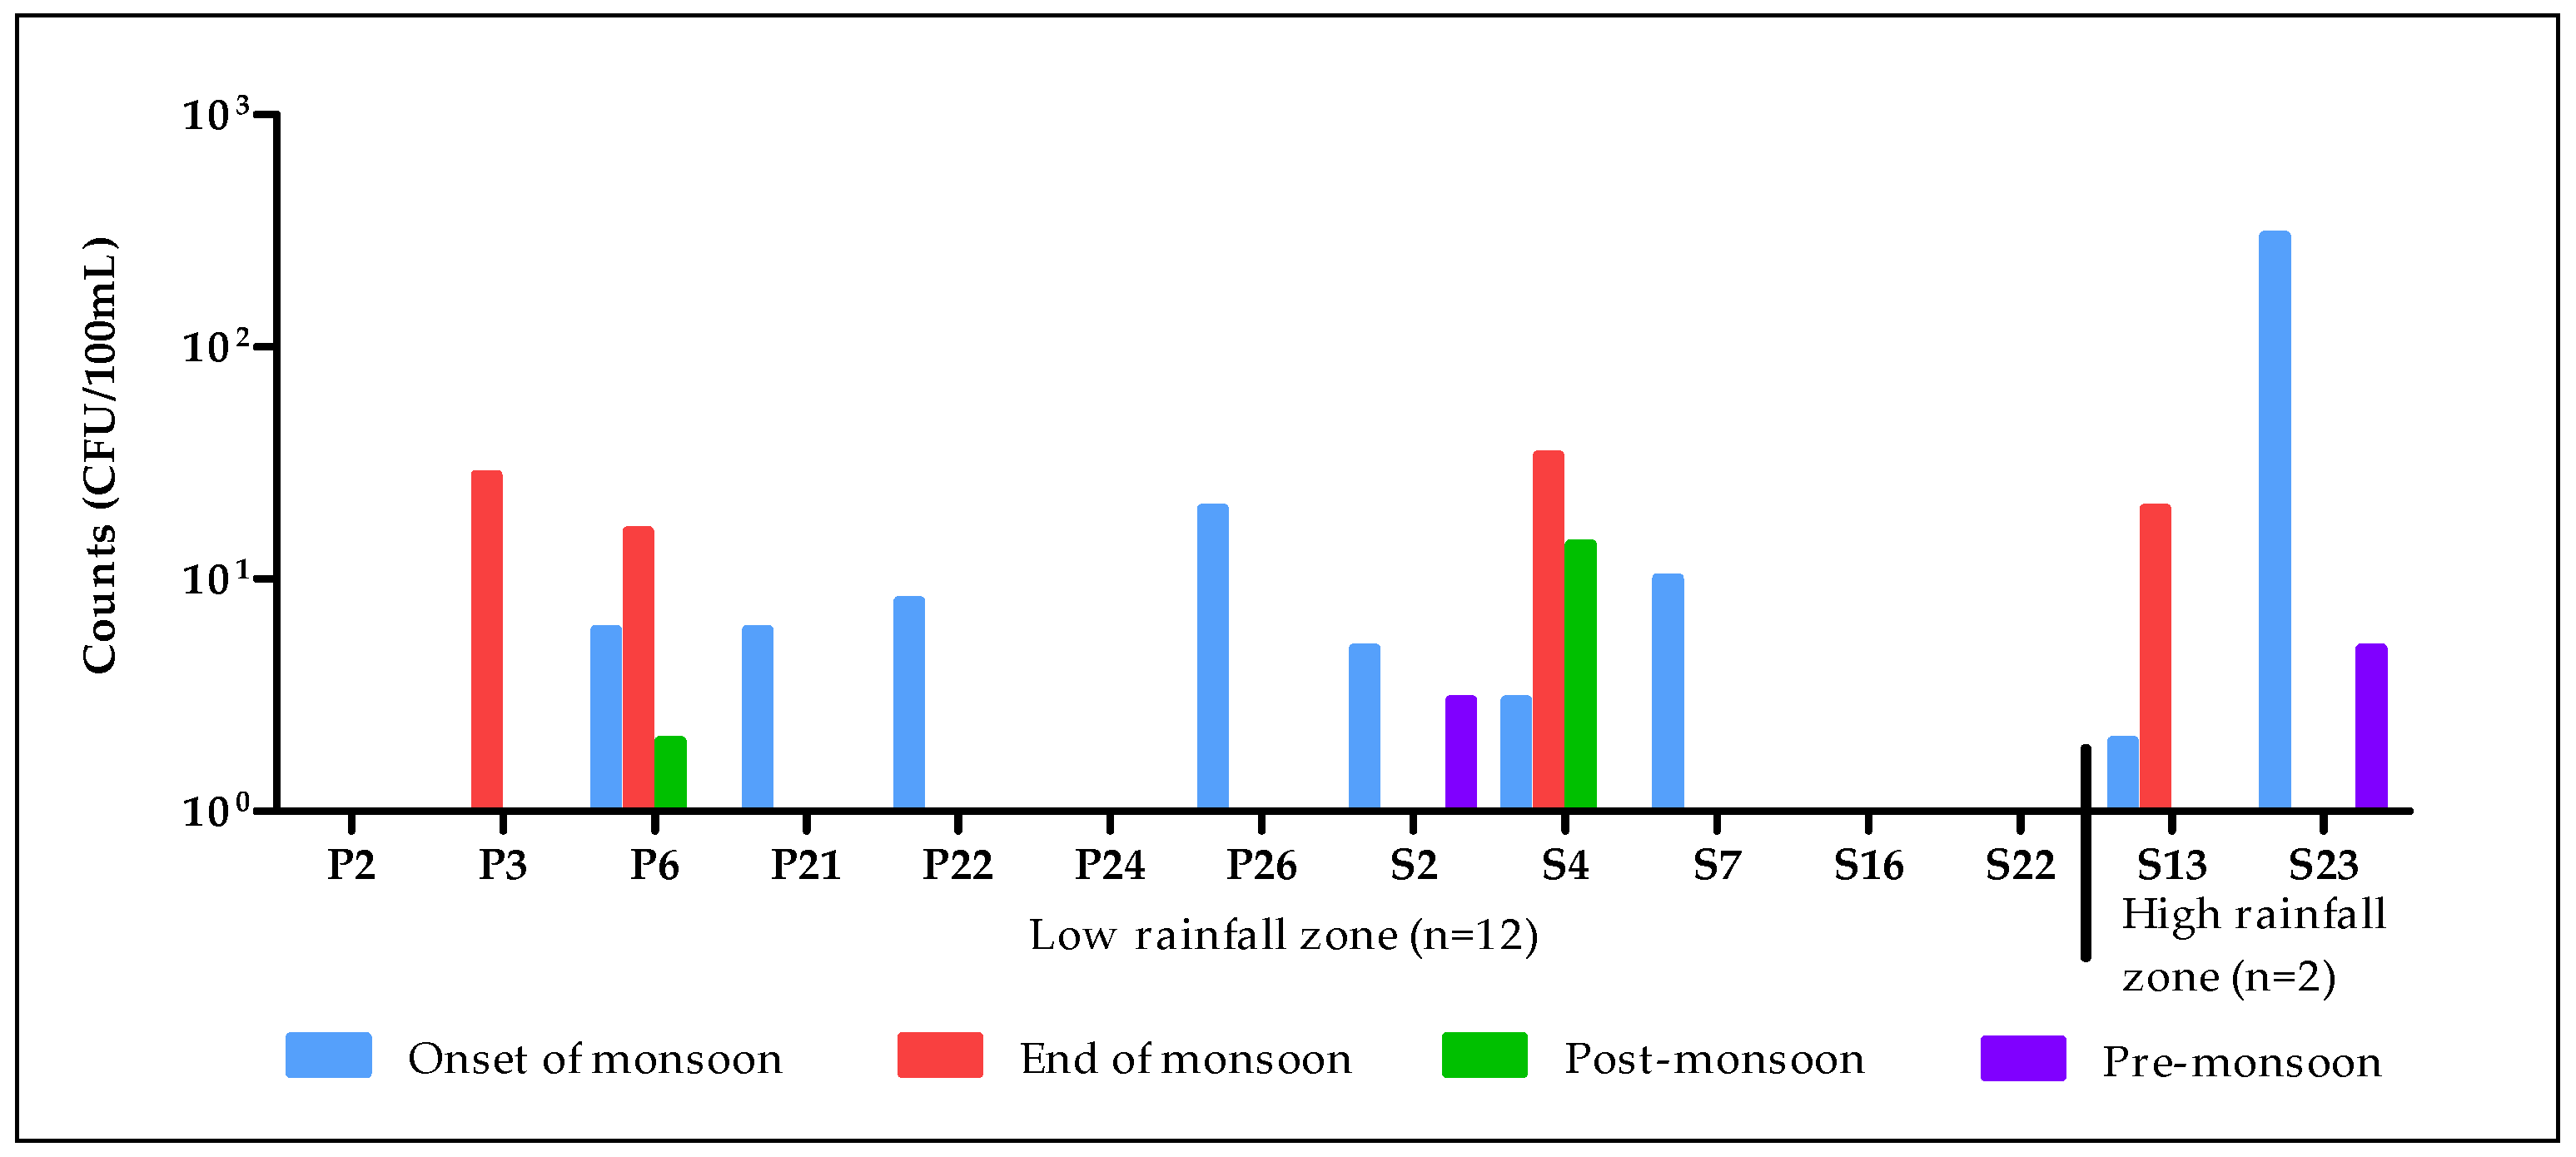
3.2. Assessment of Water Quality Based on Modified WQI and Bacteriology

While calculating the modified WQI, the2,4-D, fluoride levels, and total phosphorous were not considered for calculation and are dealt with separately.
2,4-D: Herbicide 2,4-D is a carcinogenic chemical which poses health risks to humans if detected above permissible levels [39]. It was not detected in any of the water samples though it is commonly used by Indian farmers to control weeds. Permissible level for 2,4-D is <30 µg per litre of water sample [39].
Fluoride: Fluoride levels were analyzed only in ground water sources in a single season. Only two of the samples had values exceeding the permissible limit of 1.5 mg/L. The bore well P3 at Nangaon and the open well P16 at Kolvihire showed fluoride levels of 1.6 mg/L and 1.8 mg/L respectively.
Total Phosphorous: There is no permissible level for total phosphorus in BIS, WHO, and EU standards. Combined organic and inorganic phosphorus together give total phosphorus. The values for most sources were below detectable level (<0.05 mg/L). However, there were three exceptions. In Malharpeth during the monsoon, 80 mg/mL and 11.2 mg/mL were detected in S23 (bore well) and S24 (river Koyna) respectively. A similar scenario was observed in Uttroli during the monsoon where values of 29mg/mL and 64mg/mL were obtained in river Nira P12 and the annual stream P13, respectively, due to release of agricultural runoff from the surrounding fields. High values ranging between 6.8–43 mg/mL was obtained in Khamgaontek throughout the year.
Though fluoride and total phosphorus were exempted from modified WQI they are nevertheless important since regular consumption of the contaminated water is associated with health risks like bone damage and teeth discoloration. This information was communicated to the affected communities and possible solutions for alternative drinking water sources were discussed.
Total phosphorus can result in toxic algae blooms in surface water. Agricultural runoff, industrial or domestic waste containing detergents, and livestock operations contribute towards phosphorus contamination of water [25]. The probable reasons for high phosphorus content in the bore well (S23) at Malharpeth could be percolation of phosphorus contaminated water from the river Koyna (S24), which is in close proximity to the bore well, and from agricultural activity nearby. The use of fertilizers such as urea and super phosphate in the large fields of sugarcane, rice, and wheat was common in Malharpeth and the agricultural runoff from the fields would mix with river Koyna. Similarly, in Uttroli the use of Di Ammonium Phosphate and Potassium phosphate was common, which was reflected in higher concentration of phosphorus in the open well (P11). The discharge of Pune city waste throughout the year into the river was probably responsible for higher concentrations of total phosphorus in the river Mula-Mutha (P24) at Khamgaontek located downstream of Pune city.
Since chlorine was analyzed only for open wells it was not taken into consideration while calculating WQI. Chlorination of wells was irregular and levels detected were as low as <5 ppm due to the lag between chlorination and checking.
Rivers:
Rivers are prone to pollution, and tributaries carry contaminants to the major rivers. Various water quality indices, namely, United States National Sanitation Foundation (USNSF) WQI, Bhargava WQI, OIP, and Oregon WQI are used worldwide to express water quality of rivers [40]. These indices are generated after weighing arithmetic average and modifying weighted sum. If there is great variability among river samples, the weighted geometrical average has been used [40]. Our method of developing modified WQI and OIP was similar to the structuring of these indices.
WQI and OIP has been used by researchers to check water quality status of rivers flowing in different parts of India [41,42]. Similarly, Tyagi et al. (2013) used NSFWQI to record spatial and temporal variations in the water quality of the river Khan and river Kshipra in Madhya Pradesh and classified rivers into medium to bad water quality [41]. Shukla et al. (2017) [42] studied the health of Upper Ganga river basin in three seasons using OIP. The water quality of river Ganga was found to be degraded, with the status changing from acceptable to polluted [42].
The modified WQI of the sampling sites from low (9 sites) and high (4 sites) rainfall zone were mainly within the acceptable limits and ranged from 0.56 to 6.26 annually. The water bodies in the low rainfall region seemed to be marginally more polluted (Figure 2). Variations in water quality expression due to inclusion or exclusion of bacteriology werestudied by comparing OIP with the modified WQI of the river (Figure 2 and Table 4 and Table 5) and separate bacteriological analysis of rivers (Figure 3 and Figure 4). In Seasonal OIP (which includes bacteriology) 4 out of 10 rivers from the low rainfall zone were classified as having acceptable water quality (Table 4), which contradicts the separate bacteriological analysis (Figure 3 and Figure 4). Additionally, during the onset of the monsoon as per OIP (Table 4), none of the rivers in the high rainfall zone fell in the polluted or heavily polluted category despite a high load of FC and IE (Figure 3 and Figure 4) being present. Twenty nine percent of samples were polluted as per OIP whereas only 10% of samples showed poor water quality as per the modified WQI (Table 5). Although modified WQI andOIP classified the majority of rivers into good or acceptablewater quality criteria (Figure 2, Table 5), bacteriological water qualitywas very poor and these sources were not fit for consumption in all seasons (Figure 3 and Figure 4). This indicates that more weightage should be given to faecal coliforms while calculating OIP so that the impact of bacteriologyis reflected in composite water quality.
Recently Maharashtra Pollution Control Board has monitored water quality of Tapi, Godavari and Krishna rivers in Maharashtra using WQI [43]. Maharashtra Pollution Control Board included FC while calculating WQI and gave higher weightage to FC than to physicochemical parameters. Maharashtra Pollution Control Board’s WQI was computed using the formula developed by NSF and relative weights assigned by Central Pollution Control Board. According to Maharashtra Pollution Control Board’s WQI, values above fifty indicated medium to good water quality whereas below 50 indicated bad to very bad water quality. The basins of the Tapi and Godavari rivers have recorded a declining trend in their annual average WQI, while the Krishna basin showed an increasing trend for its WQI [43].
The seasonal trends in both low and high rainfall zones for FC and IE (Figure 3 and Figure 4) counts varied though both were highest during the onset of the monsoon and least during pre-monsoon. Veer dam back waters (S12) at Shirwal showed increased FC and IE counts mainly during the monsoon and not during other seasons (Figure 3 and Figure 4). Shirval is a newly developed urban area in Satara and during the monsoon urban surface runoff could be mixing with dam back waters.
Visual observations suggested that the major causes for contamination was anthropogenic activities (washing, bathing) and the dumping of industrial and/or village waste into the rivers. The high counts of FC and IE in rivers during the onset of the monsoon was probably due to the initial flushing of sewage/faecal material into rivers from the surrounding villages. However, by the end of the monsoon there was a dilution effect which reduced the FC and IE counts. Sampling sites P23, S21, and P7 showed heavy FC and IE levels in all seasons (Figure 3 and Figure 4). P23 in Khamgaontek and S21 in Kodoli were immediately downstream of major cities Pune and Karad respectively and hence constantly received city waste which was reflected in high bacterial counts. Though P7 in Aakole is situated upstream, extensive agriculture, human, and animal activity was found nearby—possibly contributing to the high bacterial load observed (Figure 3 and Figure 4).
In the present study, water quality of the river Krishna and the river Bhima were categorized as ‘polluted’ during monsoon and ‘acceptable’ during post-monsoon and pre-monsoon as per OIP (Table 4 and Table 5). The load of faecal coliforms in the river Bhima at Nangaon ranged from 0 to 800 CFU/100 mL, whereas in the river Krishna at Kodoliit ranged from 0 to 1800 CFU/100 mL over a period of one year. Similar observations were also recorded by Maharashtra Pollution Control Boardin 2015–16. During analysis, MPCBdivided Krishna river basin into 2 sub-basins: (a) Bhima upper and (b) Krishna Upper. Faecal coliforms in the Bhima upper basin ranged from 0–500 CFU/100 mL, whereas in the Krishna upper basin it ranged from 0 to 550 CFU/100 mL [43]. The loads of FC recorded by Maharashtra Pollution Control Board in the Bhima and Krishna basins were found to be lower than the load obtained in the present study. This may be due to different sampling stations selected for water sampling in both the studies.
(1) Major drinking water sources
Open wells: The WQI values did not vary significantly with season in either low or high rainfall zones. Overall, open wells had WQI values less than 5 indicating good water quality in terms of physical and chemical analysis (Figure 5).
Open wells from low rainfall zones were found to be contaminated throughout the year (Figure 6 and Figure 7). Heavy FC and IE load was observed in high rainfall zones during monsoon. The field observations suggested that there were mainly three routes for contamination: (1) mixing of runoff with well water during monsoon; (2) the water from the area around the wells seeps into the well water; and (3) the lack of hygienic practices while collecting water. The traditional and old construction style of open wells, namely, the rim of open wells being at ground level, absence of cement concrete parapet around the well, no proper covering of the well were responsible for the mixing of run-off and seepage into the well water. In Kolvihire, P15 was the only source of drinking water but this well had an opening at ground level and it was dug in an area surrounded by human dwellings, the gram panchayat office, and a school. In Mahuli, though S10 had a surrounding wall 2–3 m above the ground, bacterial contamination was observed during end of monsoon. S10 is located close to the river Venna (S9) and during end of monsoon due to the flood like situation the well was submerged which explains the heavy load of FC and IE counts. A peak in bacterial counts was obtained during end of monsoon in S10 of Mahuli village. S14 of village Bhose from high rainfall zone was found to be a good drinking water quality source most of the year except onset of monsoon (Figure 6 and Figure 7). In Bhose the well (S14) was covered with iron net and water was pumped into a storage tank before further supply to households which explained the good quality of water except during the monsoon when the absence of a surrounding wall which resulted in the runoff mixing with well water during the monsoon.
According to WHO standards, the drinking water quality of open wells from low rainfall zone were in the ‘intermediate risk’ (10–100 CFU/100 mL) category during post-monsoon and pre-monsoon. In comparison open well situated in high rainfall zone were in the ‘low risk’ (1–10 CFU/100 m) category in all seasons except end of monsoon (Figure 6).
Bore wells: The seasonal water quality in bore wells was generally good as reflected in the WQI values of <5 (Figure 5). WQI value ranged from 0.8 to 2.3 in high and 2.28 to 5.48 in low rainfall zones.
Bacteriologically the bore wells were categorized as ‘low risk’ as per WHO standards (Figure 8). Overall, IE was higher than the FC load (Figure 8 and Figure 9) during pre-monsoon. The pre-monsoon is a dry and hot period. Water puddles form in the area surrounding water sources so domestic animals normally visit these sites and may defecate around the sources leading to higher bacterial counts especially IE during pre-monsoon in ground water sources.
Our findings revealed that the low values of modified WQI indicate less chemical contamination of ground water and surrounding soil table due to agricultural and man-made activities was low. However, it needs to be reiterated that the modified WQI as calculated in the present study does not measure faecal contamination. Calculation of OIP with inclusion of bacteriology is not suitable for the water quality study in rural Pune and Satara districts because bacteriology has great impact on water quality and OIP has reduced its impact.
Overall, it was observed that the bacteriological load was highest during the onset of monsoon since faecal matter around the water sources is flushed into the water sources. At the end of the monsoon there is a dilution effect, so the concentration as expected was lower. During post-monsoon and pre-monsoon, the load of FC was lower than during the monsoon since less faecal matter seeped into the water sources. Compared to post-monsoon, the IE load was marginally higher during the pre-monsoon, possibly due to the greater ability of IE to tolerate heterothermic environment. Various species in IE groups are naturally resistant to environmental stressors, namely, temperature and antibiotic such as vancomycin [37]. Water samples mainly from low rainfall zones had unacceptable levels of FC and IE, thereby heightening the risk of gastrointestinal disorders, namely, diarrhoea.
High IE count was observed in S22 Kodoli mainly during the monsoon (Figure 9). The possible reason behind this could be the cattle shed in the vicinity of S22. However, S23 in Malharpeth, showed IE counts in all seasons and FC count during the onset of the monsoon and pre-monsoon. Visual observations suggested that the open conduit for sewage could be responsible for the seepage of FC and IE into the bore well S23 in Malharpeth (Figure 8 and Figure 9). Seasonal analysis of WQI for major drinking water sources classified in low and high rainfall zones.
WQI has been used as a tool to express water quality of major drinking water sources worldwide [44,45]. In the present study WQI showed good water quality of major drinking water sources based on physico-chemical properties whilst presence of FC made those sources unsuitable for consumption. Similar findings were observed in the study carried out by Adetunde et al. (2011) andRao et al. (2013) [44,45]. Adetunde et al. (2011) investigated water quality of open wells in two local government areas of Oyo State, Nigeria [44]. The physical and chemical parameters were within the permissible limits as per WHO guidelines, whereas the bacteriological quality of the samples in both areas was poor rendering them unsuitable for drinking without treatment due to the presence of faecal coliforms [44]. Rao et al. (2013) used WQI for the assessment of ground water quality in Meghadrigedda watershed, Andhra Pradesh, India [45]. The study incorporated 48 ground water sources with 34 bore wells and 14 open wells. Forty three percent of the sources showed good water quality in terms of physical and chemical properties [45].
Recently, ground water sources in Maharashtra were monitored by MPCB [43]. MPCB incorporated physical, chemical, and bacteriological properties to express WQI. According to MPCB findings, groundwater was mostly found to be polluted near the urbanized and industrialized areas of Pune, Mumbai, Thane, Chandrapur, and Solapur which were lying in low rainfall area [43]. This corroborated our findings of more polluted ground water bodies from Pune and Satara districts falling in drought prone area.

4. Conclusions

Aforementioned analysis highlights that the load of faecal bacteria was high during the monsoon in low rainfall zones, especially in rivers. Gradation in water quality was represented through modified WQI and OIP. In the current study, modified WQI and OIP were designed to measure water quality in a simple, reproducible way and communicate it with policy makers and concerned villagers. The findings of the study highlighted that water quality indices like OIP and WQI are not sufficient to draw conclusionsbased on which a plan to improve rural water quality of different water bodiescan be made. However, WQI or OIP can give relative information about the impact of seasonal change, anthropogenic, industrial, and agricultural activities on water quality.
Although modified WQI and OIP claimed the majority of rivers had good water quality, the presence of FC and IE made it unacceptable for consumption. In the present study, OIP minimized the impact of FC though it is incorporated in the calculation of the index value. Therefore, it is critical to assign appropriate weightage to FC in OIP and different WQIs to reflectthe role of bacteriology in water quality.
Based on the investigation of seasonal water quality of different water sources from Pune and Satara districts, it was concluded that drinking water sources need to be routinely treated and monitored to eliminate the possible threats to both human and animal health.
Since open wells are prone to contamination, preventive measures to control pollution should be undertaken such as construction of proper fencing, use of a common protected bucket for fetching water, regular chlorination, and periodic desilting. Movement of animals and children should be restricted around any drinking water source. Above all, educating communities on hygiene and sanitation practices must be initiated by local Gram Panchayats or other authorities.
To protect the rivers, various measures need to be undertaken, such as proper treatment of urban and rural sewage before discharging it into them. Additionally, untreated effluent should not be released into those stretches of river where water level has already dropped in summer. The anthropogenic contribution can be minimized by creating awareness of consequences of depleting water sources and deteriorating water quality. People should be encouraged to participate in activities related to maintenance of water bodies.

Author Contributions

R.D., N.S., T.B. and A.C.W. defined the sampling and analysis framework. A.G. collected information about water sources and potential pollution sources from selected villages. Along with A.G., R.D. and N.S. carried out water sampling on the field. R.D. and N.S. did the bacteriological analysis. R.D., N.S. and A.C.W. analyzed the data. R.D. wrote the paper with major contributions from R.M., T.B., I.S.-D and A.C.W.

Acknowledgments

The authors acknowledged the financial support of Research Council of Norway (Project No. 216064/E10), Norway. The authors thank Amanda Poste, Norwegian Institute of Water Research and Nerges Mistry, Foundation for Medical Research who helped to initiate sampling strategy and gave valuable suggestions. The project was registered with the Norwegian Centre for Research Data (NSD) to ensure proper data handling and did not require ethical approval. Permission was requested through letters submitted to the gram panchayat (local authority) of the selected villages before water sampling.

Conflicts of Interest

Authors declare that there is no conflict of interest.

References

  1. Marale, M.; Gavali, R.S.; Rao, K.R. Evaluation of water quality with waterborne diseases for assessing pilgrimage impact along river indrayani, pune (India). Int. J. Environ. Prot. 2012, 2, 1–14. [Google Scholar] [CrossRef]
  2. Chakrabarty, S.; Sarma, H.P. Climatic variables and its implications in ground water potability in Kamrup district, Assam, India. Arch. Appl. Sci. Res. 2011, 3, 265–272. [Google Scholar]
  3. GSDA; CGWB. Report on the Dynamic Ground Water Resources of Maharashtra (2011–2012); Groundwater Surveys and Development Agency, Government of Maharashtra; Central Ground Water Board, Central Region, Nagpur, Government of India: Maharashtra, India, 2014.
  4. Das, K. Drinking Water and Sanitation in Rural Maharashtra: A Review of Policy Initiatives; Gujarat Institute of Development Research: Ahmedabad, India, 2006. [Google Scholar]
  5. Basak, B. Rainfall Distribution in India. 2013. Available online: https://www.importantindia.com/8667/rainfall-distribution-of-india/ (accessed on 7 July 2014).
  6. Guhathakurta, P.; Saji, E. Trends and Variability of Monthly, Seasonal and Annual Rainfall for the Districts of Maharashtra and Spatial Analysis of Seasonality Index in Identifying the Changes in Rainfall Regime; Research Report 1; National Climate Centre: Pune, India, 2012.
  7. Panda, U.C.; Sundaray, S.K.; Rath, P.; Nayak, B.B.; Bhatta, D. Application of factor and cluster analysis for characterization of river and estuarine water systems—A case study: Mahanadi river (India). J. Hydrol. 2006, 331, 434–445. [Google Scholar] [CrossRef]
  8. Sundaray, S.K.; Panda, U.C.; Nayak, B.B.; Bhatta, D. Multivariate statistical techniques for the evaluation of spatial and temporal variations in water quality of the mahanadi river—Estuarine system (India)—A case study. Environ. Geochem. Health 2006, 28, 317–330. [Google Scholar] [CrossRef] [PubMed]
  9. Giridharan, L.; Venugopal, T.; Jayaprakash, M. Evaluation of the seasonal variation on the geochemical parameters and quality assessment of the groundwater in the proximity of river cooum, Chennai, India. Environ. Monit. Assess. 2008, 143, 161–178. [Google Scholar] [CrossRef] [PubMed]
  10. Steward, A.L. When the River Runs Dry: The Ecology of Dry River Beds; Griffith University: Queensland, Australia, 2012. [Google Scholar]
  11. Das, K. Drinking Water and Sanitation in Rural Maharashtra: A Review of Policy Initiatives. Forum for Watershed Research and Policy Dialogue; Gujarat Institute of Development Research Ahmedabad: Gujrat, India, 2009. [Google Scholar]
  12. Environmental Pollution Centers. Water Pollution Causes. Available online: https://www.environmentalpollutioncenters.org/water/causes/ (accessed on 19 April 2018).
  13. Shaji, C.; Nimi, H.; Bindu, L. Water quality assessment of open wells in and around Chavara industrial area, Quilon, Kerala. J. Environ. Biol. 2009, 30, 701–704. [Google Scholar] [PubMed]
  14. Ananthakrishnan, S.; Loganathan, K.; Ahamed, A.J. Study on ground water quality and its suitability or drinking purpose in alathur block—Perambalur district. Arch. Appl. Sci. Res. 2012, 4, 1332–1338. [Google Scholar]
  15. Mishra, S.S.P. Ground Water Information Pune District Maharashtra; Govt of India Ministry of Water Resources Central Ground Water Board: Nagpur, India, 2013; pp. 1–22.
  16. Tata Institute of Social Sciences. Status of Rural Water Supply in Maharashtra; Tata Institute of Social Sciences: Mumbai, India, 2015. [Google Scholar]
  17. Khurana, I.; Sen, R. Drinking Water Quality in Rural India: Issues and Approaches. 2008. Available online: http://www.ctara.iitb.ac.in/en/system/files/drinking-water-quality-rural-india.pdf (accessed on 7 July 2017).
  18. Government of India (GoI). New National Water Policy; GoI: New Delhi, India, 2012.
  19. Akkaraboyina, M.K.; Raju, B. A comparative study of water quality indices of river godavari. Int. J. Eng. Res. Dev. 2012, 2, 29–34. [Google Scholar]
  20. Basavaraddi, S.; Kousar, H.; Puttaiah, E. Seasonal variation of groundwater quality and its suitability for drinking in and around Tiptur town, Tumkur district, Karnataka, India: A WQI approach. Int. J. Comput. Eng. Res. 2012, 2, 562–567. [Google Scholar]
  21. Rickwood, C.; Carr, G. Global Drinking Water Quality Index Development and Sensitivity Analysis Report. United Nations Environment Programme & Global Environment Monitoring System (GEMS)/Water Programme. 2007. Available online: http://www.un.org/waterforlifedecade/pdf/global_drinking_water_quality_index.pdf (accessed on 19 April 2018).
  22. Yadav, N.S.; Kumar, A.; Sharma, M. Ecological health assessment of chambal river using water quality parameters. J. Int. Sci. Technol. 2014, 2, 52–56. [Google Scholar]
  23. Bitton, G. Microbial Indicators of Faecal Contamination: Application to Microbial Source Tracking; Department of Environmental Engineering Sciences, University of Florida Gainesville: Gainesville, FL, USA, 2005. [Google Scholar]
  24. Bureau of Indian Standards(BIS). Drinking Water—Specification is 10500: 2012; BIS: New Delhi, India, 2012.
  25. WHO. Water Quality Monitoring—A Practical Guide to the Design and Implementation of Freshwater Quality Studies and Monitoring Programmes; UNEP/WHO: Geneva, Switzerland, 1996. [Google Scholar]
  26. WHO. Water Quality: Guidelines, Standards and Health; World Health Organisation: Geneva, Switzerland, 2001. [Google Scholar]
  27. WHO. Guidelines for Drinking-Water Quality; World Health Organization: Geneva, Switzerland, 2006. [Google Scholar]
  28. APHA. Standard Methods for the Examination of Water and Wastewater; American Public Health Association: Washington, DC, USA, 1999. [Google Scholar]
  29. Montgomery, H.; Thom, N.; Cockburn, A. Determination of dissolved oxygen by the winkler method and the solubility of oxygen in pure water and sea water. J. Chem. Technol. Biotechnol. 1964, 14, 280–296. [Google Scholar] [CrossRef]
  30. Chan, L.; Li, Y.; Stenstrom, M.K. Protocol evaluation of the total suspended solids and suspended sediment concentration methods: Solid recovery efficiency and application for stormwater analysis. Water Environ. Res. 2008, 80, 796–805. [Google Scholar] [CrossRef] [PubMed]
  31. Weatherburn, M. Phenol-hypochlorite reaction for determination of ammonia. Anal. Chem. 1967, 39, 971–974. [Google Scholar] [CrossRef]
  32. Geldreich, E.E.; Clark, H.F.; Huff, C.B.; Best, L.C. Fecal-coliform-organism medium for the membrane filter technique. J. Am. Water Works Assoc. 1965, 57, 208–214. [Google Scholar] [CrossRef]
  33. WHO. Guidelines for Drinking-Water Quality; World Health Organization: Geneva, Switzerland, 1996. [Google Scholar]
  34. Thakor, F.J.; Thakor, F.J.; Bhoi, H.R.; Dashi, S.N.; Pandya, S.; Chauhan, N.B. Water Quality Index (WQI) of pariyej lake dist. Kheda-Gujarat. Curr. World Environ. 2011, 6, 225–231. [Google Scholar] [CrossRef]
  35. USGS. Fundamentals of Enviroonmental Measurements: Turbidity. 2016. Available online: https://water.usgs.gov/edu/turbidity.html (accessed on 22 February 2017).
  36. USGS. Fundamentals of Environmental Measurements: Dissolved Oxygen. 2014. Available online: http://www.fondriest.com/environmental-measurements/parameters/water-quality/dissolved-oxygen/ (accessed on 22 February 2017).
  37. Sargaonkar, A.P.; Gupta, A.; Devotta, S. Dynamic weighting system for water quality index. Water Sci. Technol. 2008, 58, 1261–1271. [Google Scholar] [CrossRef] [PubMed]
  38. Sargaonkar, A.; Deshpande, V. Development of an overall index of pollution for surface water based on a general classification scheme in indian context. Environ. Monit. Assess. 2003, 89, 43–67. [Google Scholar] [CrossRef] [PubMed]
  39. WHO. 2,4-D in Drinking-Water Background Document for Development of Who Guidelines for Drinking-Water Quality; World Health Organization: Geneva, Switzerland, 2003. [Google Scholar]
  40. Katyal, D. Water quality indices used for surface water vulnerability assessment. Int. J. Environ. Sci. 2011, 2, 1–21. [Google Scholar]
  41. Tyagi, A.; Sharma, M.; Bhatia, K. The study of temporal and spatial trends of water qulity of RIVER Kshipra using water quality index. Indian J. Environ. Health 2003, 45, 15–20. [Google Scholar] [PubMed]
  42. Shukla, A.K.; Ojha, C.; Garg, R. Application of overall index of pollution (OIP) for the assessment of the surface water quality in the upper Ganga River Basin, India. In Development of Water Resources in India; Springer: Cham, Switzerland, 2017; pp. 135–149. [Google Scholar]
  43. MPCB; TERI. Water Quality Status of Maharashtra 2015–16 (Compilation of Water Quality Data Recorded by MPCB); Maharashtra Pollution Control Board and The Energy and Resources Institute: Maharashtra, India, 2017. [Google Scholar]
  44. Adetunde, L.A.; Glover, R.L.; Oguntola, G.O. Assessment of the ground water quality in Ogbomoso township of Oyo State of Nigeria. Int. J. Res. Rev. Appl. Sci. 2011, 8, 116–122. [Google Scholar]
  45. Srinivas, G.; Rao, G.N. Assessment of groundwater quality using water quality index. Arch. Environ. Sci. 2013, 7, 1–5. [Google Scholar]
Figure 1. Distribution of sampling villages with population across Pune and Satara districts.
Environments 05 00061 g001
Figure 2. Seasonal analysis of modified WQI for rivers classified in low and high rainfall zones; Key: >5: poor quality, <5 Good quality; Data represents mean +/− standard deviation in low and high rainfall region (n = 9 and 4 respectively).
Environments 05 00061 g002
Figure 3. Seasonal analysis of faecal coliforms (FC) in rivers.
Environments 05 00061 g003
Figure 4. Seasonal analysis of intestinal enterococci (IE) in rivers.
Environments 05 00061 g004
Figure 5. Seasonal analysis of WQI for major drinking water sources classified in low and high rainfall zones; Key: >5: poor quality, <5 Good quality; Data represents mean +/− standard deviation for open well (n = 16 (in low rainfall zone) and 6(in high rainfall zone)) and borewell (n = 12 in low rainfall zone). Note: Due to small sample size, bore wells from high rainfall zones were not considered for WQI graphical representation.
Environments 05 00061 g005
Figure 6. Seasonal analysis of FC in open wells.
Environments 05 00061 g006
Figure 7. Seasonal analysis of IE in open wells.
Environments 05 00061 g007
Figure 8. Seasonal analysis of FC in bore wells.
Environments 05 00061 g008
Figure 9. Seasonal analysis of IE in bore wells.
Environments 05 00061 g009
Table 1. Selected sampling sites and their rainfall patterns in Pune and Satara Districts.
VillageBlockHistoric Mean Rainfall in mm $Annual Rainfall 2013 in mmSampling SitesSampling Code
Low Rainfall Zone
NangaonDaund356574River BhimaP1
Bore well-1P2
Bore well-2P3
Open wellP4
MalthanShirur367XOpen wellP5
BorewellP6
KolvihirePurandar321XOpen well-1P14
Open well-2P15
Open well-3P16
PondhePurandar453XOpen wellP17
KalthanIndapur427503Open wellP19
Ujani dam BackwatersP20
Bore wellP21
Khamgaon- TekHaveli635658Bore wellP22
River MulaMuthaP23
Bore wellP24
TulapurHaveli635658River IndrayaniP25
BorewellP26
BaradPhaltan353620Open well S1
Bore wellS2
Open well S3
BalupatlachiwadiPargaon-Khandala375XBore wellS4
Open well S5
River NiraS6
DeurKoregaon575712Bore wellS7
Open wellS8
MahuliSatara782XRiver VennaS9
Open well S10
ShirwalPargaon-Khandala375654Open well S11
Veer Dam backwatersS12
NadwalDahiwadi225XYeralawadi lakeS18
Open well-1 S17
Open well-2S19
Bore wellS16
WadjalMann225XOpen wellS20
KodoliKarad557588Bore wellS22
River Krishna S21
High Rainfall Zone
AkoleMulshi15252094River MulaP7
Community tapP8
NaneMaval4364XOpen wellP9
River IndrayaniP10
UtroliBhor9881611Open wellP11
River NiraP12
Annual streamP13
BhoseMaha-baleshwar54056350Bore wellS13
Open wellS14
Annual springS15
MalharpethPatan15091714Hand pumpS23
River KoynaS24
$ Historic rainfall data from 1946to 2006 years. Data obtained from Indian Meteorological Department (IMD), Pune. Key: X—Not available, P: Pune, S: Satara.
Table 2. Range and assigned index values for physical and chemical parameters used to calculate Water Quality Index (WQI) (modified from Akkaraboyina & Raju 2012 [19].
Measured ValuesIndex Value (Q)
pH Towards Alkaline RangepH Towards Acidic RangeTurbidity (NTU)Salinity(ppt)Dissolved Oxygen (ppm)Total Suspended Solids (ppm)Total Phosphorus (ppm)Ammonia (ppm)Calcium (ppm)Nitrate (ppm)
7.50–7.707.50–7.300–20.0–0.3>10.80.0–5.10.0–8.00.0–0.30.0–15.00.0–9.01
7.70–7.907.30–7.102–40.3–0.69.6–10.85.1–10.28.0–16.00.3–0.615.0–30.09.0–18.02
7.90–8.107.10–6.904–60.6–0.88.4–9.610.2–15.316.0–24.00.6–0.930.0–45.018.0–27.03
8.10–8.306.90–6.706–80.8–1.17.2–8.415.3–20.424.0–32.00.9–1.245.0–60.027.0–36.04
8.30–8.506.70–6.508–101.1–1.46.0–7.220.4–25.532.0–40.01.2–1.560.0–75.036.0–45.05
8.50–8.706.50–6.3010–121.4–1.74.8–6.025.5–30.640.0–48.01.5–1.875.0–90.045.0–54.06
8.70–8.906.30–6.1012–141.7–2.03.6–4.830.6–35.748.0–56.01.8–2.190.0–105.054.0–63.07
8.90–9.106.10–5.9014–162.0–2.32.4–3.635.7–40.856.0–64.02.1–2.4105.0–120.063.0–72.08
9.10–9.305.90–5.7016–182.3–2.51.2–2.440.8–45.964.0–70.02.4–2.7120.0–135.072.0–81.09
9.30–9.505.70–5.5018–202.5–2.80.0–1.245.9–51.070.0–80.02.7–3.0135.0–150.081.0–90.010
Table 3. Multiplication factor for assigned index values of physical and chemical parameters to calculate WQI (modified from Akkaraboyina & Raju 2012 [19].
ParameterWeight Assigned Based on Its Influence on Quality of Water for Surface WaterWeight Assigned Based on Its Influence on Quality of Water for Open WellsWeight Assigned Based on Its Influence on Quality of Water for Bore Wells
Turbidity211
pH121
Salinity112
Dissolved Oxygen220
Total Suspended Solids110
Total Dissolved Solids012
Ammonia100
Nitrate001
Calcium122
Sum weight999
Table 4. Seasonal Overall Pollution Index (OIP) of rivers.
RangeRainfall Zone (No. of Samples)ClassificationNo. of Samples
Onset of MonsoonEnd of MonsoonPost-MonsoonPre-Monsoon
0–1Low rainfall zone (n = 9)Excellent0102
1–2 Acceptable4595
2–4 Slightly polluted1302
4–8 Polluted4000
8–16 Heavily polluted0000
0–1High rainfall zone (n = 4)Excellent0010
1–2 Acceptable2233
2–4 Slightly polluted2201
4–8 Polluted0000
8–16 Heavily polluted0000
Table 5. Comparison of WQI and OIP for rivers.
VillageSite CodeSeasonal WQI ValuesSeasonal OIP Values
ABCDABCD
Low rainfall zone
NangaonP14.616.262.765.191.731.561.101.74
KalthanP204.563.062.605.574.360.791.813.66
KhamgaontekP232.724.952.965.484.221.901.321.85
TulapurP253.753.032.033.671.712.161.251.48
BalupatlachiwadiS64.732.192.144.414.601.601.391.99
MahuliS94.601.143.413.381.233.721.050.91
ShirwalS122.532.991.693.111.631.351.220.77
NadwalS185.643.591.873.622.291.541.122.04
KodoliS215.433.812.713.855.731.621.411.43
High rainfall zone
AakoleP74.144.641.812.052.052.061.431.32
NaneP104.502.551.852.432.431.691.191.50
UttroliP121.701.640.561.651.653.670.851.49
MalharpethS243.622.482.252.782.781.671.941.94
Key: A: Onset of monsoon B: End of monsoon C: Post-monsoon D: Pre-monsoon.

