Characterization and Production of Extracellular Polysaccharides (EPS) by Bacillus Pseudomycoides U10


1
Department of Biology, Faculty of Arts & Sciences, Pamukkale University, Denizli 20700, Turkey
2
Department of Biomedical Engineering, Faculty of Technology, Pamukkale University, Denizli 20700, Turkey
3
Department of Geological Engineering, Engineering Faculty, Pamukkale University, Denizli 20070, Turkey
4
Department of Physics Engineering, Faculty of Engineering, Hacettepe University, Ankara 06800, Turkey
*
Author to whom correspondence should be addressed.
Environments 2018, 5(6), 63; https://doi.org/10.3390/environments5060063
Submission received: 13 April 2018
/
Revised: 17 May 2018
/
Accepted: 18 May 2018
/
Published: 23 May 2018
(This article belongs to the Special Issue Environmental Science and Technologies for the Management of Natural Ecosystems and the Sustainable Development of Urban Areas)
Abstract
:We aimed to determine the effect of Luria-Bertani (LB) medium, nutrient broth (NB) and tryptic soy broth (TSB), pH, temperature, and incubation time on the production of extracellular polysaccharides (EPS). The effect of glucose, whey and glycerol on bacterial EPS production by Bacillus pseudomycoides U10 was also tested. LB was better than NB and TSB for EPS production. Maximum EPS production was obtained when 1 g/L whey was added to the growth medium. The influence of incubation times (24–96 h), different pH values (6.5, 7.0, 7.5, 8.0 and 9.0) and temperature (25, 30, 37 and 45 °C) were also tested. The optimum pH level was 7.0 and the highest EPS production was observed at 37 °C after 60 h of incubation. Glycerol was not a good carbon source for cell growth and EPS production. The difference in carbohydrate and protein amount was related to the different types of EPS (dissolved and particulate). In general, the uronic acid content in particulate EPS was lower than in dissolved EPS. The maximum uronic acid was obtained from dissolved EPS (16 mg uronic acid/g EPS). According to X-ray diffraction (XRD), thermogravimetric EPS have a poorly crystalline nature and exhibit two-step degradations, corresponding to the weight loss of moisture and/or carboxyl group and the pyrolysis of EPS, without distinctive changes in different media conditions. Small-angle X-ray scattering (SAXS) data indicate the layer thickness of the bacterial EPS is from 12.04 to 14.07 Å for whey and dissolved LB conditions, respectively. It was found that EPS structures changed with whey addition, such as higher d-values, lower weight losses and more filamentous structures which seemed to be related to increasing durability and/or stability.
1. Introduction
Extracellular polysaccharides or exopolymeric substances (EPS) are secreted by microorganisms. Their synthesis is favored by environmental stresses of microorganisms and they are the major part of extracellular polymeric substances produced by microorganisms and possess potential environmental applications. It is known that they protect microorganisms against antimicrobial substances, bacteriophages, osmotic stress. Because of this, many researchers have focused on microbial EPS production. Carbohydrates and proteins are found extensively in EPS. Humic substances, uronic acids, lipids, nucleic acids, and some inorganic components are also reported by previous studies [1,2,3]. The basic functions of EPS include aggregation of bacterial cells, adherence to surfaces, formation of flocs, cell–cell recognition (e.g., cell adhesion), structural elements of biofilms, formation of a protective barrier for cells, and water retention to minimize cell desiccation, sorption of exogenous organic compounds and inorganic ions, enzymatic activities, and the interaction of polysaccharides with enzymes [4,5]. Because of their special components, EPS matrices show adsorption abilities, biodegradability, and hydrophilicity or hydrophobicity [6,7,8]. Also, EPS play an important role in mass transfer via biofilm, in adsorption of different metals and organic/inorganic compounds by the biofilm, and, most importantly, in providing structural support to the biofilm (i.e., resistance to shear) [9,10,11]. They are used in a wide variety of industrial applications, including food, textile dye removal from water, pharmaceutical, emulsifiers, stabilizers, bio-nanotechnology, metal removal and recovery, removal of toxic organic compounds and soil remediation [12,13,14,15,16,17]. It is very important to understand the structure of EPS in order to use them in these areas. Many of the physicochemical properties of EPS are closely related to their three-dimensional structure, which has been studied in different model systems and by applying different spectroscopic techniques. Important advances have been made in the study of the conformational properties of polysaccharides using nuclear magnetic resonance (NMR) spectroscopy, energy calculations [18,19], and different light-scattering techniques [20]. In particular, small-angle X-ray scattering (SAXS) is a powerful technique that reveals structural information on the 1–100 nm scale, which is typically inaccessible by other techniques. SAXS techniques have also been frequently used in studying polysaccharide structures. For example, SAXS measurements have indicated that cross-linked hyaluronan consists of randomly distributed zones of denser material [21]. In related work, Hirata et al. [22] have considered dextran solutions from several bacterial genera as networks with embedded, static, and heterogeneous domains of higher polymer concentrations. The impact of inorganic salts on carrageenan and gellan has also been studied using SAXS [23,24]. Dogsa et al. [25] have investigated the EPS of slime-producing marine bacterial isolate. According to the results of SAXS, they have modelled the structure of EPS as a network of randomly coiled polymeric chains with denser domains of polymeric chains.
The main objectives of the present investigation are as follows:
- (i)
- Although the bacterial EPS has produced by various microorganisms, to the best of our knowledge, no study has focused on EPS production by Bacillus pseudomycoides. In this study, the ability of EPS production of B. pseudomycoides U10 and the total amount of carbohydrate, protein, and uronic acid in EPS were also analyzed.
- (ii)
- One of the limiting factors in the commercial success of biopolymer production is the cost of the sugar substrate used. Therefore, cheaper substrates such as whey and glycerol were tested to detect their effect on EPS production.
- (iii)
- Moreover, SAXS, X-ray diffraction (XRD), scanning electron microscopy (SEM) and thermogravimetric (TGA) experiments were conducted in order to determine the structure of lyophilized EPS produced by B. pseudomycoides U10.
2. Methodology
2.1. Bacterial Strain and Culture Media
In the present study, Bacillus pseudomycoides U10 was used as a local isolate from our culture stocks in the Bacteriology Laboratory of the Biology Department in Pamukkale University. The composition of the Luria-Bertani (LB) included the following materials (g/L): tryptone 10.0, NaCl 10.0 and yeast extract 5.0. Tryptic soy broth (TSB, g/L) was composed of peptone from casein 17.0 g/L; peptone from soymeal 3.0, d(+) glucose 2.5, NaCl 5.0 g/L; K2HPO4 2.5. Nutrient broth (NB) was as follows (g/L): peptone from meat 5.0 and meat extract 3. Glucose and whey were added 1 g/L and glycerol (Sigma, St. Louis, MO, USA, 99%) was added in the range of %1–5 (w/v). The effect of pH and temperature on the production of EPS was also determined. In all treatments, 2% (v/v) bacteria (B. pseudomycoides U10) were inoculated into media.
2.2. Isolation of Extracellular Polysaccharides (EPS)
The cell culture was boiled at 100 °C for 10 min. After cooling, the proteins in broth were hydrolysed with proteinase (final conc. 0.5 mg/L). Also, the cell culture was stirred with glass beads and centrifuged at 10,000× g for 30 min. Then, it was treated with 17% (v/v) of 85% trichloracetic acid solution and centrifuged [26]. EPS was precipitated with ethanol. It was recovered by centrifugation at 4 °C at 14,000 rev/min for 20 min. Total EPS (expressed as mg/L) was estimated in each sample by phenol–sulphuric method [27]. Glucose was used as standard.
2.3. Purification and Analysis of EPS
Pure EPS was collected from B. pseudomycoides U10 as described by Hung et al. [28]. To remove proteins, a proteinase solution (final conc. 0.5 mg/L) was added in media, and the culture was incubated at 37 °C for 12 h at 70 rpm. The bacterial EPS obtained from supernatant and pellet was defined as ‘dissolved EPS’ and ‘particulate EPS’, respectively. The fractions were lyophilized for storage and analysis. A part of the freeze-dried EPS was used to determine total protein, uronic acid, and total carbohydrate content; another EPS portion was used for analyses (SAXS, XRD, TGA, and SEM). The total carbohydrate amount (mg/g) in feeze-dried EPS was described by the phenol sulfuric acid method [27]. The amount of total protein (mg/g) in EPS was determined using a modified Lowry method [29]. Total uronic acid (mg/g) in bacterial EPS was measured by a spectrophotometric method [30].
2.4. X-ray Diffraction (XRD)
XRD studies were performed on the Rigaku Miniflex model XRD with Ni-filtered CuKα radiation (λ = 1.54056 Å), running conditions of 40 mA, 40 kV, scan-speed 0.005°, time/scan 0.1 sec and 0.2 mm slit using LynxEye detector at Batman University, Turkey. Diffraction peaks were plotted as 2θ value and diffracted X-rays were calculated with Bragg’s law d = λ/2 Sinθ.
2.5. Thermogravimetric Analyses (TGA)
The TGA method was carried out on a Perkin Elmer SII-Diamond TG-DTA Instruments thermal analysis system in a dinitrogen atmosphere, applying a heating rate of 10 °C min−1 across a temperature range of 30–1000 °C at the Izmir Institute of Technology (Izmir, Turkey).
2.6. Small-Angle X-ray Scattering (SAXS)
A micro-line collimation Hecus SWAXS System3 was used with a conventional X-ray source (MoKα) and ISO-DEBYEFLEX 3003 generator (50 kV–50 mA) during the scattering measurements at 23 °C, with measuring time of 700 s. Small and wide angle signals were recorded in SAXS and wide-angle X-ray scattering (WAXS) with q range of 0.004–0.5 Å and 2θ range of 18–26°. A simultaneous measurement of SAXS range is possible in this system with a linear-position-sensitive detector used with 1024-channel resolution. Distances between the channels and the sample-detector were 54 μm and 31.5 cm, respectively.
2.7. Scanning Electron Microscopy (SEM)
In this study, we carried out SEM analysis to determine insight into the surface morphology of the lyophilized EPS. SEM investigations were performed on gold-coated samples using a QUANTA FEG 250 Scanning Electron Microscope at the Izmir Institute of Technology (Izmir, Turkey).
3. Results and Discussion
3.1. Effect of Different Media, Initial pH, Temperature and Incubation Time on Production of EPS
Test bacterium used in our study was 100% identical to Bacillus pseudomycoides U10 (GenBanks: KF720933.1, JQ729679.1, EF210306.1, JX994092.1 and GU171377.1) (Life Sciences Research and Application Center, Gazi University). Bacterial EPS production studies have been carried out with Bacillus species [31,32,33,34,35]. Physical and chemical growth conditions such as carbon sources, temperature, pH, incubation time and the composition of medium have been shown to affect EPS production in bacteria [31,35]. The initial experiments showed that LB medium generally resulted in higher EPS production than the use of TSB and NB. Moreover, it was observed that production of EPS was initiated at the beginning of the cultivation in LB medium and was shown to increase in all incubation times. Because of this, we used LB medium in our experiments (Table 1).
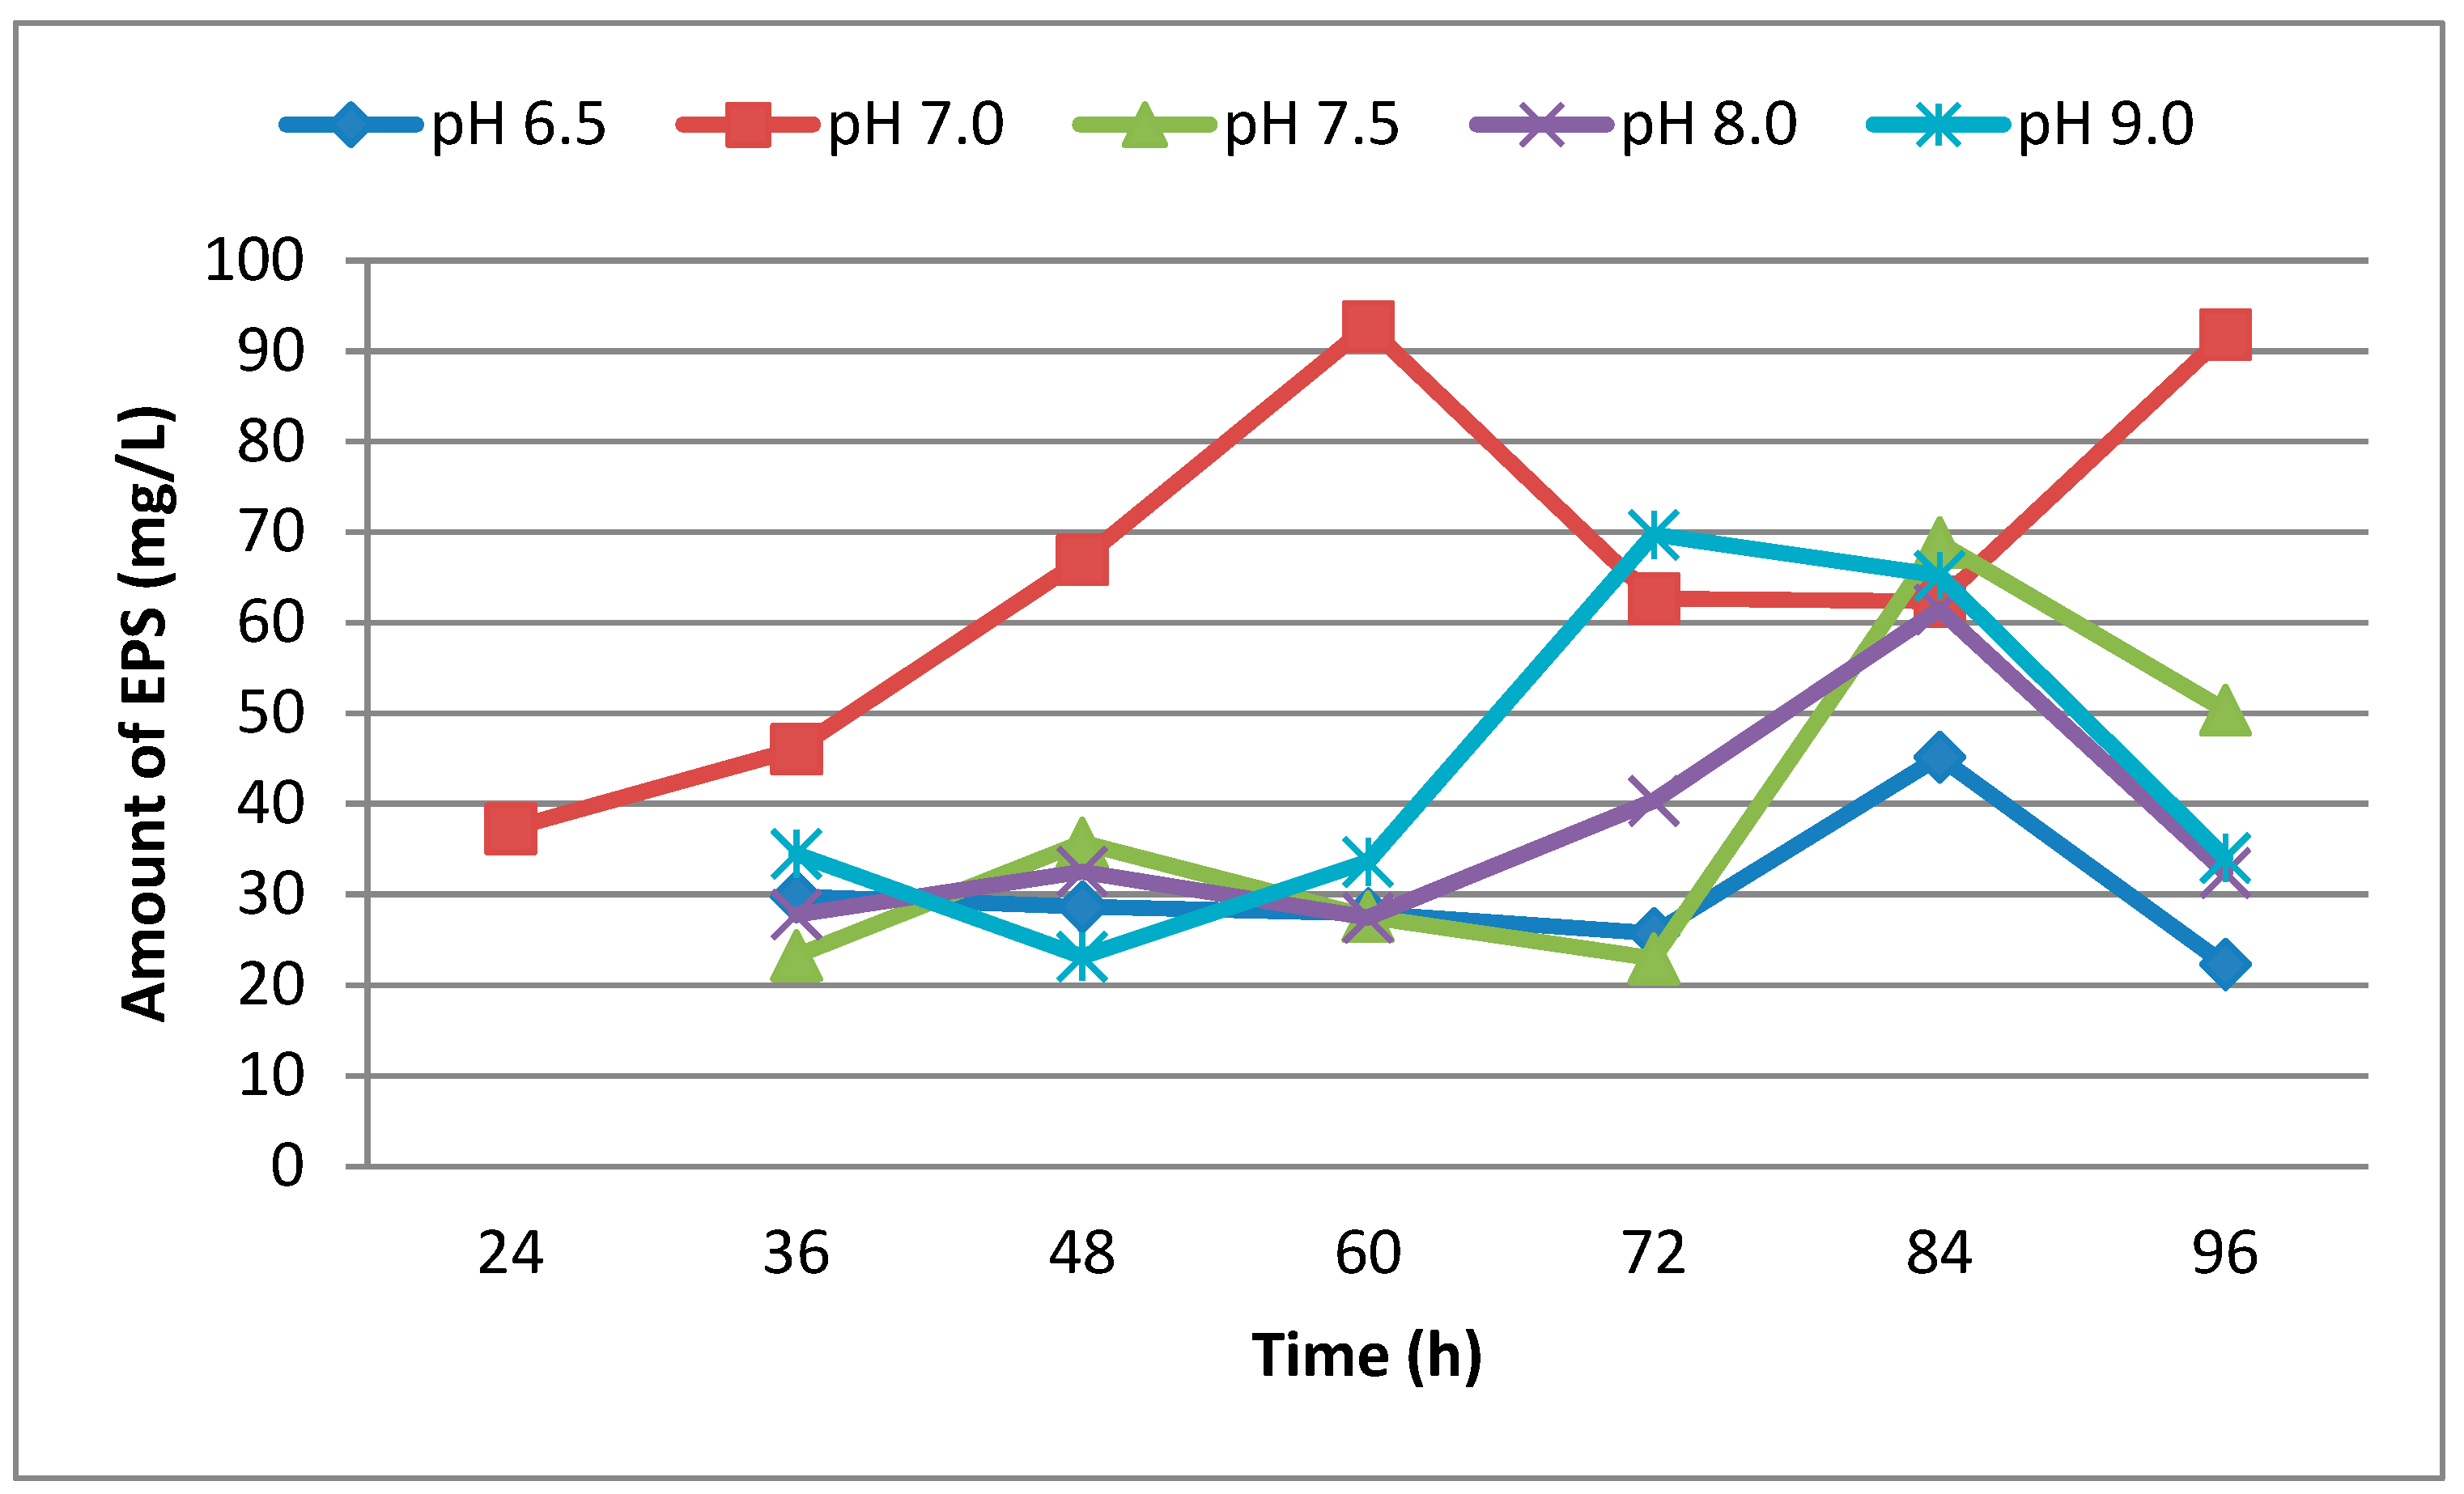
In this study, the effect of pH on the production of EPS of strain U10 was evaluated before the experiments. As is known, the pH value plays an important role in microbial activity. EPS production by U10 was evaluated at five different pH values: 6.5, 7.0, 7.5, 8.0 and 9.0. The maximum production of EPS by U10 cells occurred at pH 7.0. On the other hand, EPS production decreased with increasingly alkaline conditions in the growth medium (Figure 1). Gandhi et al. [36] reported that the optimum medium pH for EPS production was at 7.0.
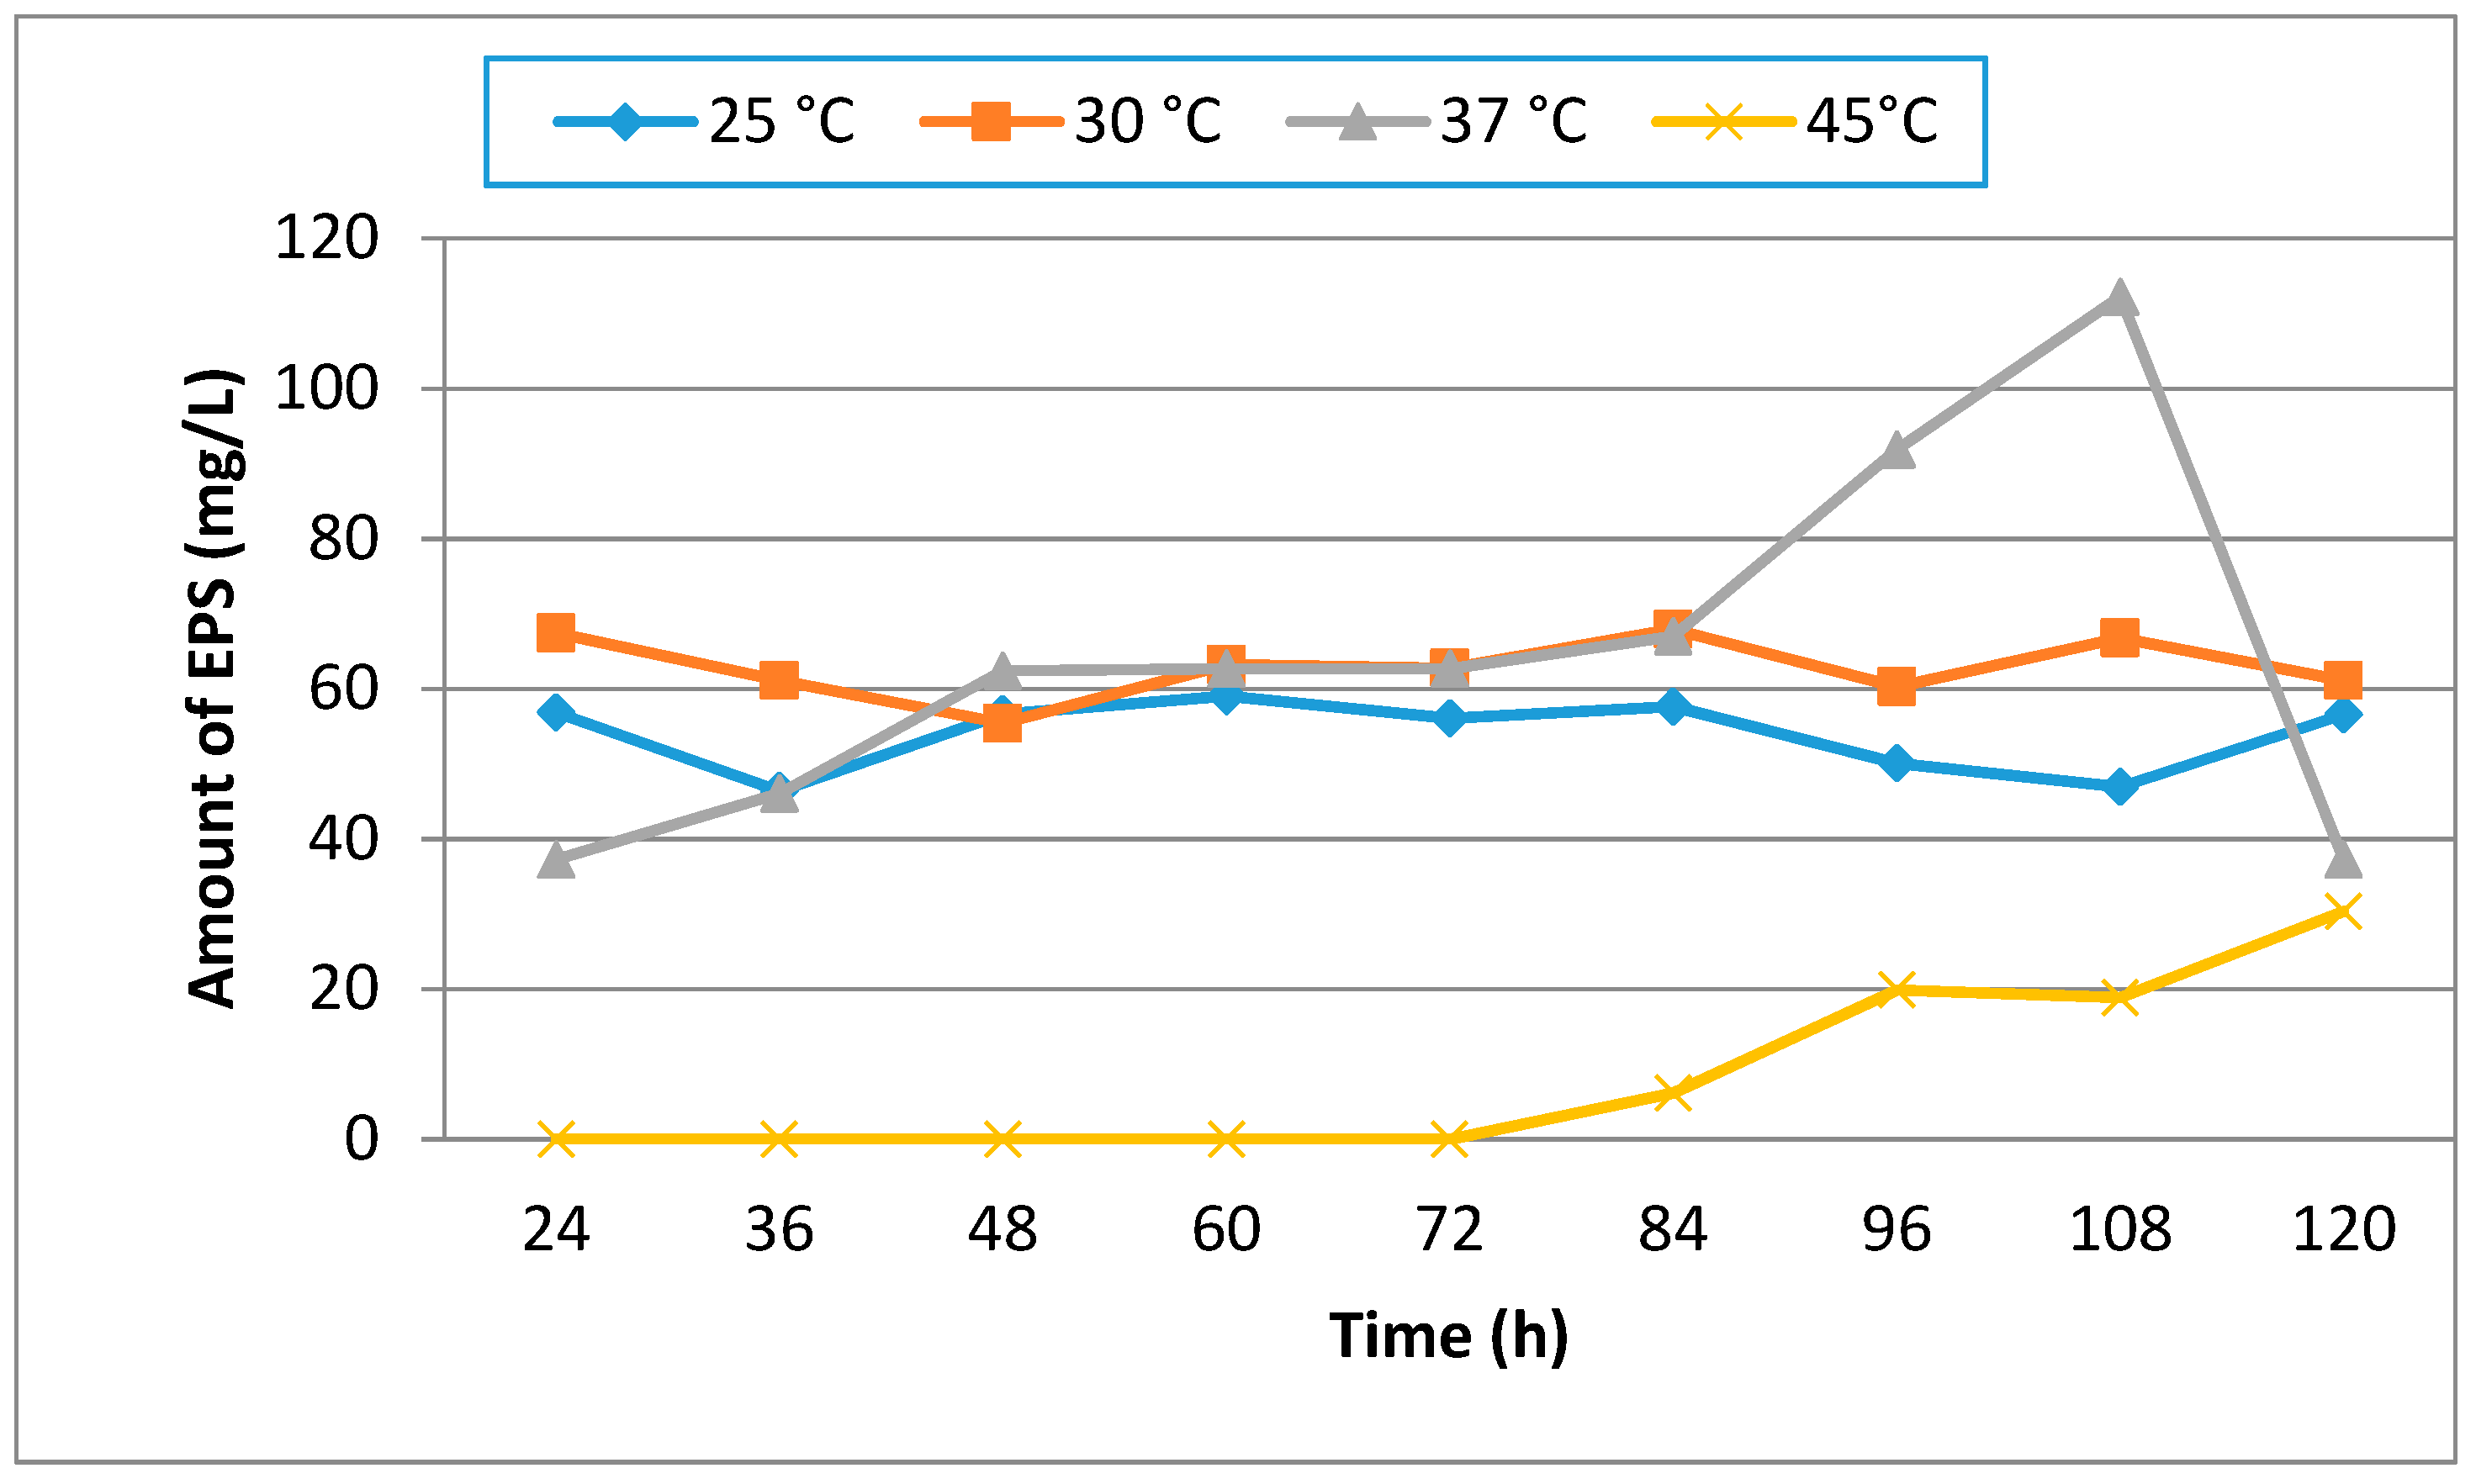
Temperature is an important factor that has an effect on microbial EPS production. Maximum EPS production was at 37 °C at the end of 108 h of incubation. In our study, we clearly observed that the growth of U10 cells at 45 °C was weaker than those of other temperatures (Figure 2). In other words, an increase in temperature caused a decrease in growth rate. As a result, it was found that EPS production was reduced effectively at 45 °C. Bacillus pseudomycoides U10 showed a significant difference in growth behavior at different temperatures. As is known, the optimum temperature for growth and EPS production may be different depending upon the enzymatic activity of the microbial strain.
The effect of the incubation time on EPS production is shown in Figure 1 and Figure 2. EPS was analyzed at the end of the incubation times. The highest production was observed after incubation of 60 h (Figure 1). But, EPS production decreased when the incubation period was increased from 72 h to 84 h. The U10 strain maybe uses EPS as carbon and energy source in nutrient limitations at 72 and 84 h. EPS production is either growth-synonymous, growth-associated or growth independent [37].
Table 1 shows the comparison of incubation times for the EPS production strain U10 in the LB, glucose and whey mediums. In the LB medium containing whey, EPS production was 316.46 mg/L after 72 h. The amount of EPS was 158.80 mg/L at 36 h in the glucose medium and then slightly decreased to 69.95 mg/L and increased 113.73 mg/L by 72 h. A similar result was seen in the LB medium. It was considered that bacterial EPS was degraded by B. pseudomycoides U10.
The bacterial growth was measured spectrophotometrically (HachLange DR5000 UV-Vis Spechtrophotometer) (Table 2 and Table 3). Obviously, live-cell measurements in culture cannot be followed by this spectrophotometer. However, it can be said that the EPS production depends on the development in this strain. Generally, the production of EPS started at the beginning of cultivation and the amount of EPS increased during the exponential phase.
3.2. The Effect of Glucose, Whey and Glycerol on the Production of EPS
The effect of glucose, glycerol or whey on EPS production was also studied at 37 °C and these experiments were performed at pH 7.0. Glucose and whey generally increased the production of the EPS of U10 when compared to the LB medium (with no glucose or whey) at 37 °C. This implied that glucose and whey significantly promoted the bacterial EPS production (Table 4). B. pseudomycoides U10 produced the highest EPS (316.46 mg/L) after incubation for 72 h on LB medium with whey. The highest production was obtained (158.80 mg/L) in LB medium with glucose at the end of 36 h of incubation. There was a decrease in the production of EPS up to 60 h; after 72 h of incubation, the strain U10 produced less EPS. Glucose is the main carbon source for the production of the polymer as it not only acts as an energy source but also as a polymer precursor. However, the concentration of substrate and the consumption of carbon sources by cells also have an influence on EPS production. The strain U10 did not produce EPS when glycerol was used as the sole carbon source. When it was grown in the range of 1–3% (w/v) glycerol, the pH of the culture medium rapidly decreased from 7.0 to 3.5 after 24 h of incubation and this may be a reason for stopping the growth of EPS production. The effect of initial concentrations of glycerol on the EPS production was also detected in the present study. However, the cell growth was inhibited with increasing glycerol concentrations up to 3% (w/v). In our previous study, it was reported that organic acids stimulated bacterial EPS production. In addition, bacterial EPS production showed differences when the bacteria were grown in the presence of various types of organic acids [25]. Even though some researchers have reported that the bacterial strains were able to synthesize EPS in glycerol [38,39], EPS production in B. pseudomycoides U10 was not determined in the medium with glycerol in our study. This result may be a result of inhibition of cell growth in the glycerol-containing medium. Because of this, the presence of carbohydrate could not be determined by the method described.
3.3. Biochemical Composition of EPS
The biochemical composition of EPS from U10 showed that carbohydrates and proteins were the major components of EPS. This result was in parallel with the findings of Doğan et al. [35] and Guibaud et al. [40]. Table 5 has shown that the content of total carbohydrate decreased from 380 to 150 mg/g when whey was applied, while in the medium with glucose the total carbohydrate amount increased to 464 mg/g for dissolved EPS. On the other hand, the amount of protein in EPS obtained from LB with whey medium was higher than LB and LB with glucose. This result may be related to the composition of the medium. A similar finding was also found for Aeromonas hydrophila [41]. According to Castro et al. [41] the key EPS components of A. hydrophila were proteins, indicating their importance for electron transfer reactions. Hung et al. [28] reported that up to 70% of total carbohydrates in EPS isolated from Pseudomonas fluorescens Biovar II were uronic acids, with carboxylic functional groups. However, the uronic acid content of EPS of B. pseudomycoides U10 was low. The present result was similar to the content of the uronic acid of EPS purified from B. licheniformis B22 obtained by our previous study [35]. We considered that the content of uronic acid of EPS of Bacillus species was low. Uronic acids are significant components of polymers found outside the cytoplasmic membrane of the cells. Polymers containing uronic acids resist acid hydrolysis because the carboxylic acid moiety stabilizes the glycosidic linkage [42,43]. Carboxylic groups in uronic acids act an important role in proton and metal ion binding. In other words, the metal complexation with EPS occurs mainly through carboxylic groups found in the EPS [44,45,46].
3.4. X-ray Diffraction (XRD) Analysis of EPS
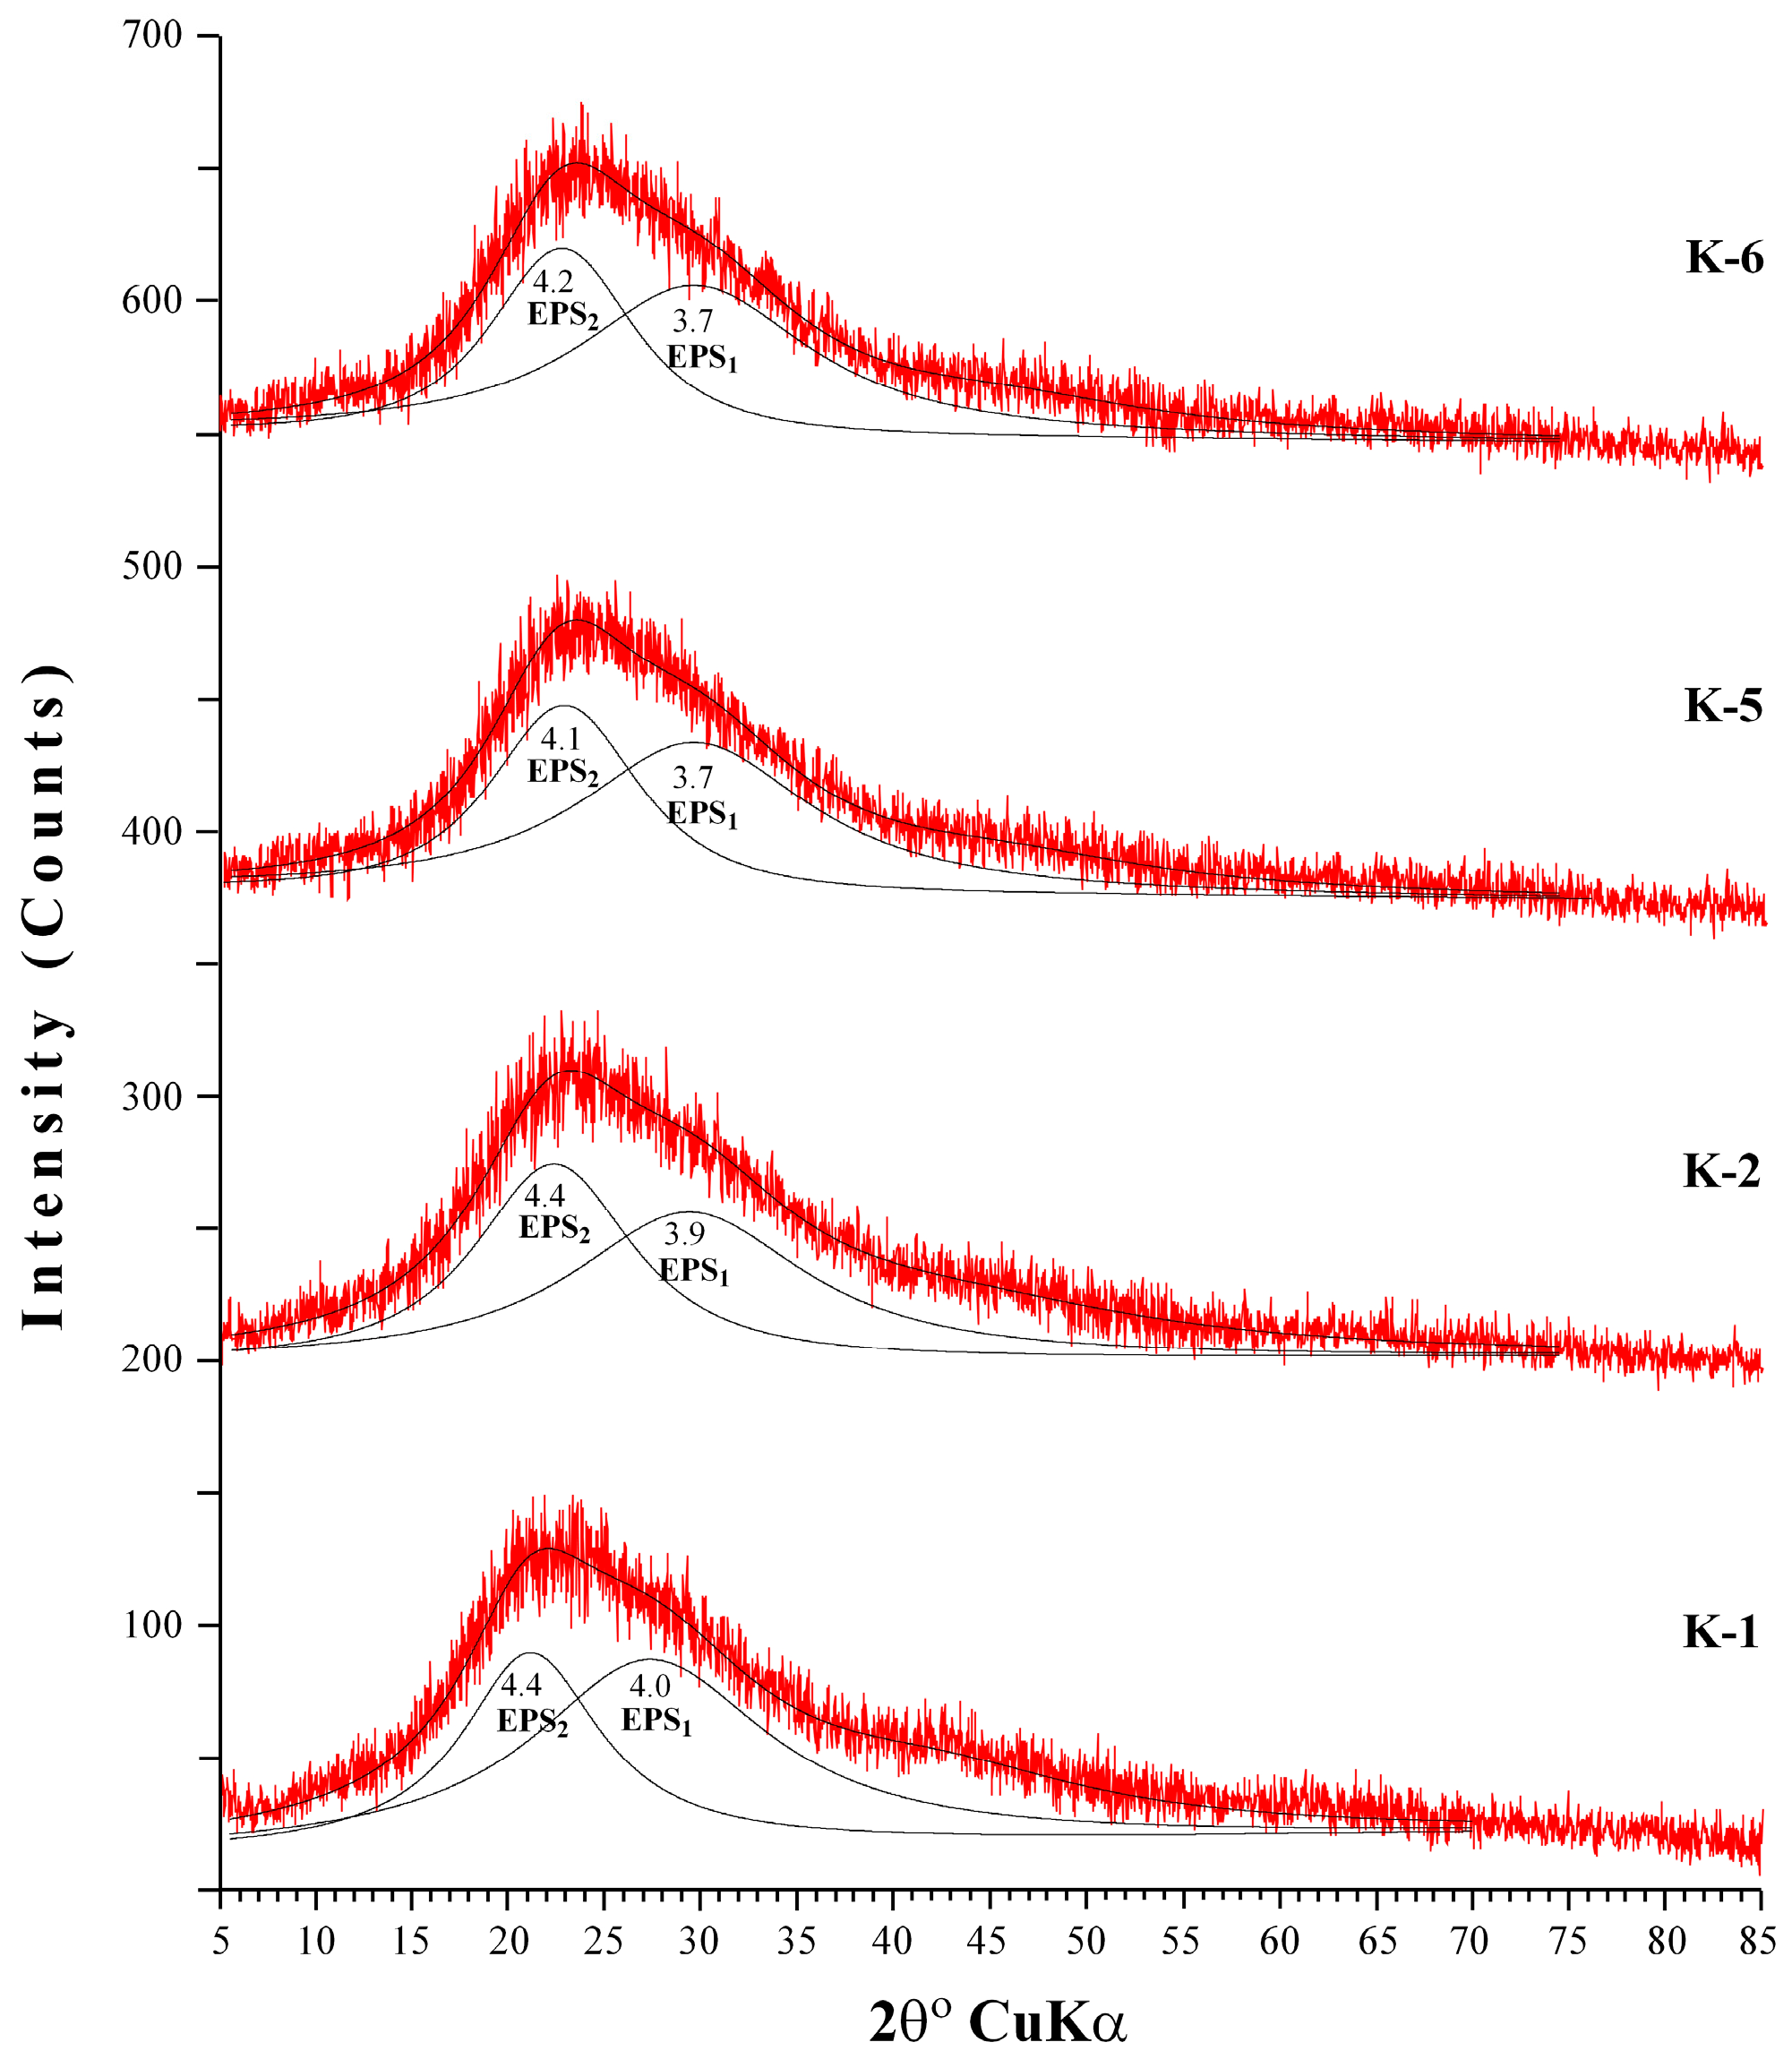
The XRD patterns of EPS produced by B. pseudomycoides U10 under different growth environments (the media of LB, whey and glucose) exhibits an extremely broad and asymmetric peak near 2θ = ~22° (dhkl = ~4 Å), which indicates mainly an amorphous-like nature, i.e., poorly developed ordering of the EPS structure (Figure 3). After decomposition of the asymmetrical peak (fitting by WINFIT program; [47]), at least two peaks were determined as EPS1 (d = 4.1 to 4.4 Å) and EPS2 (d = 3.7 to 4.0 Å). However, it is not known that these two groups of peaks belong to which material; it may be that the first peak (EPS1) associates with chitin and/or chitosan, whereas second peak (EPS2) is related to proteins (e.g., [35]). However, XRD patterns of EPSs do not show distinct differences for different media conditions, and d-values of EPSs in LB medium (K-1 and K-2) exhibit somewhat higher than media of LB with whey (K-5 and K-6). These differences should be related to increasing EPS particle structure, i.e., core radius and/or shell thicknesses caused from the whey addition.
3.5. Thermogravimetric Analysis (TGA) of EPS
TGA results of dissolved and particulate EPSs obtained in different growth media from B. pseudomycoides U10 are shown in Figure 4. There was two-stage weight loss together with increasing temperature. The first stage, about 10% of total EPS weight loss, was observed between 20 °C and 200 °C. This stage corresponds to the loss of bonding water molecules (or moisture) and the degradation of the carboxyl group related to [48]. The second stage of degradation causes maximum weight loss of 60–70%, and was observed at 200–400 °C that corresponds to the pyrolysis of EPS. Although TGA curves of four samples showed similarities, the total weight loss of EPSs in LB (K-1 and K-2) show somewhat lower than LB medium with whey added (K-5 and K-6). Relatively lower weight loss values of EPS corresponded to EPS particles with higher d-values, indicating particle size affects the thermogravimetric data.
3.6. Structural Characterization of EPS Using Small-Angle X-ray Scattering (SAXS)
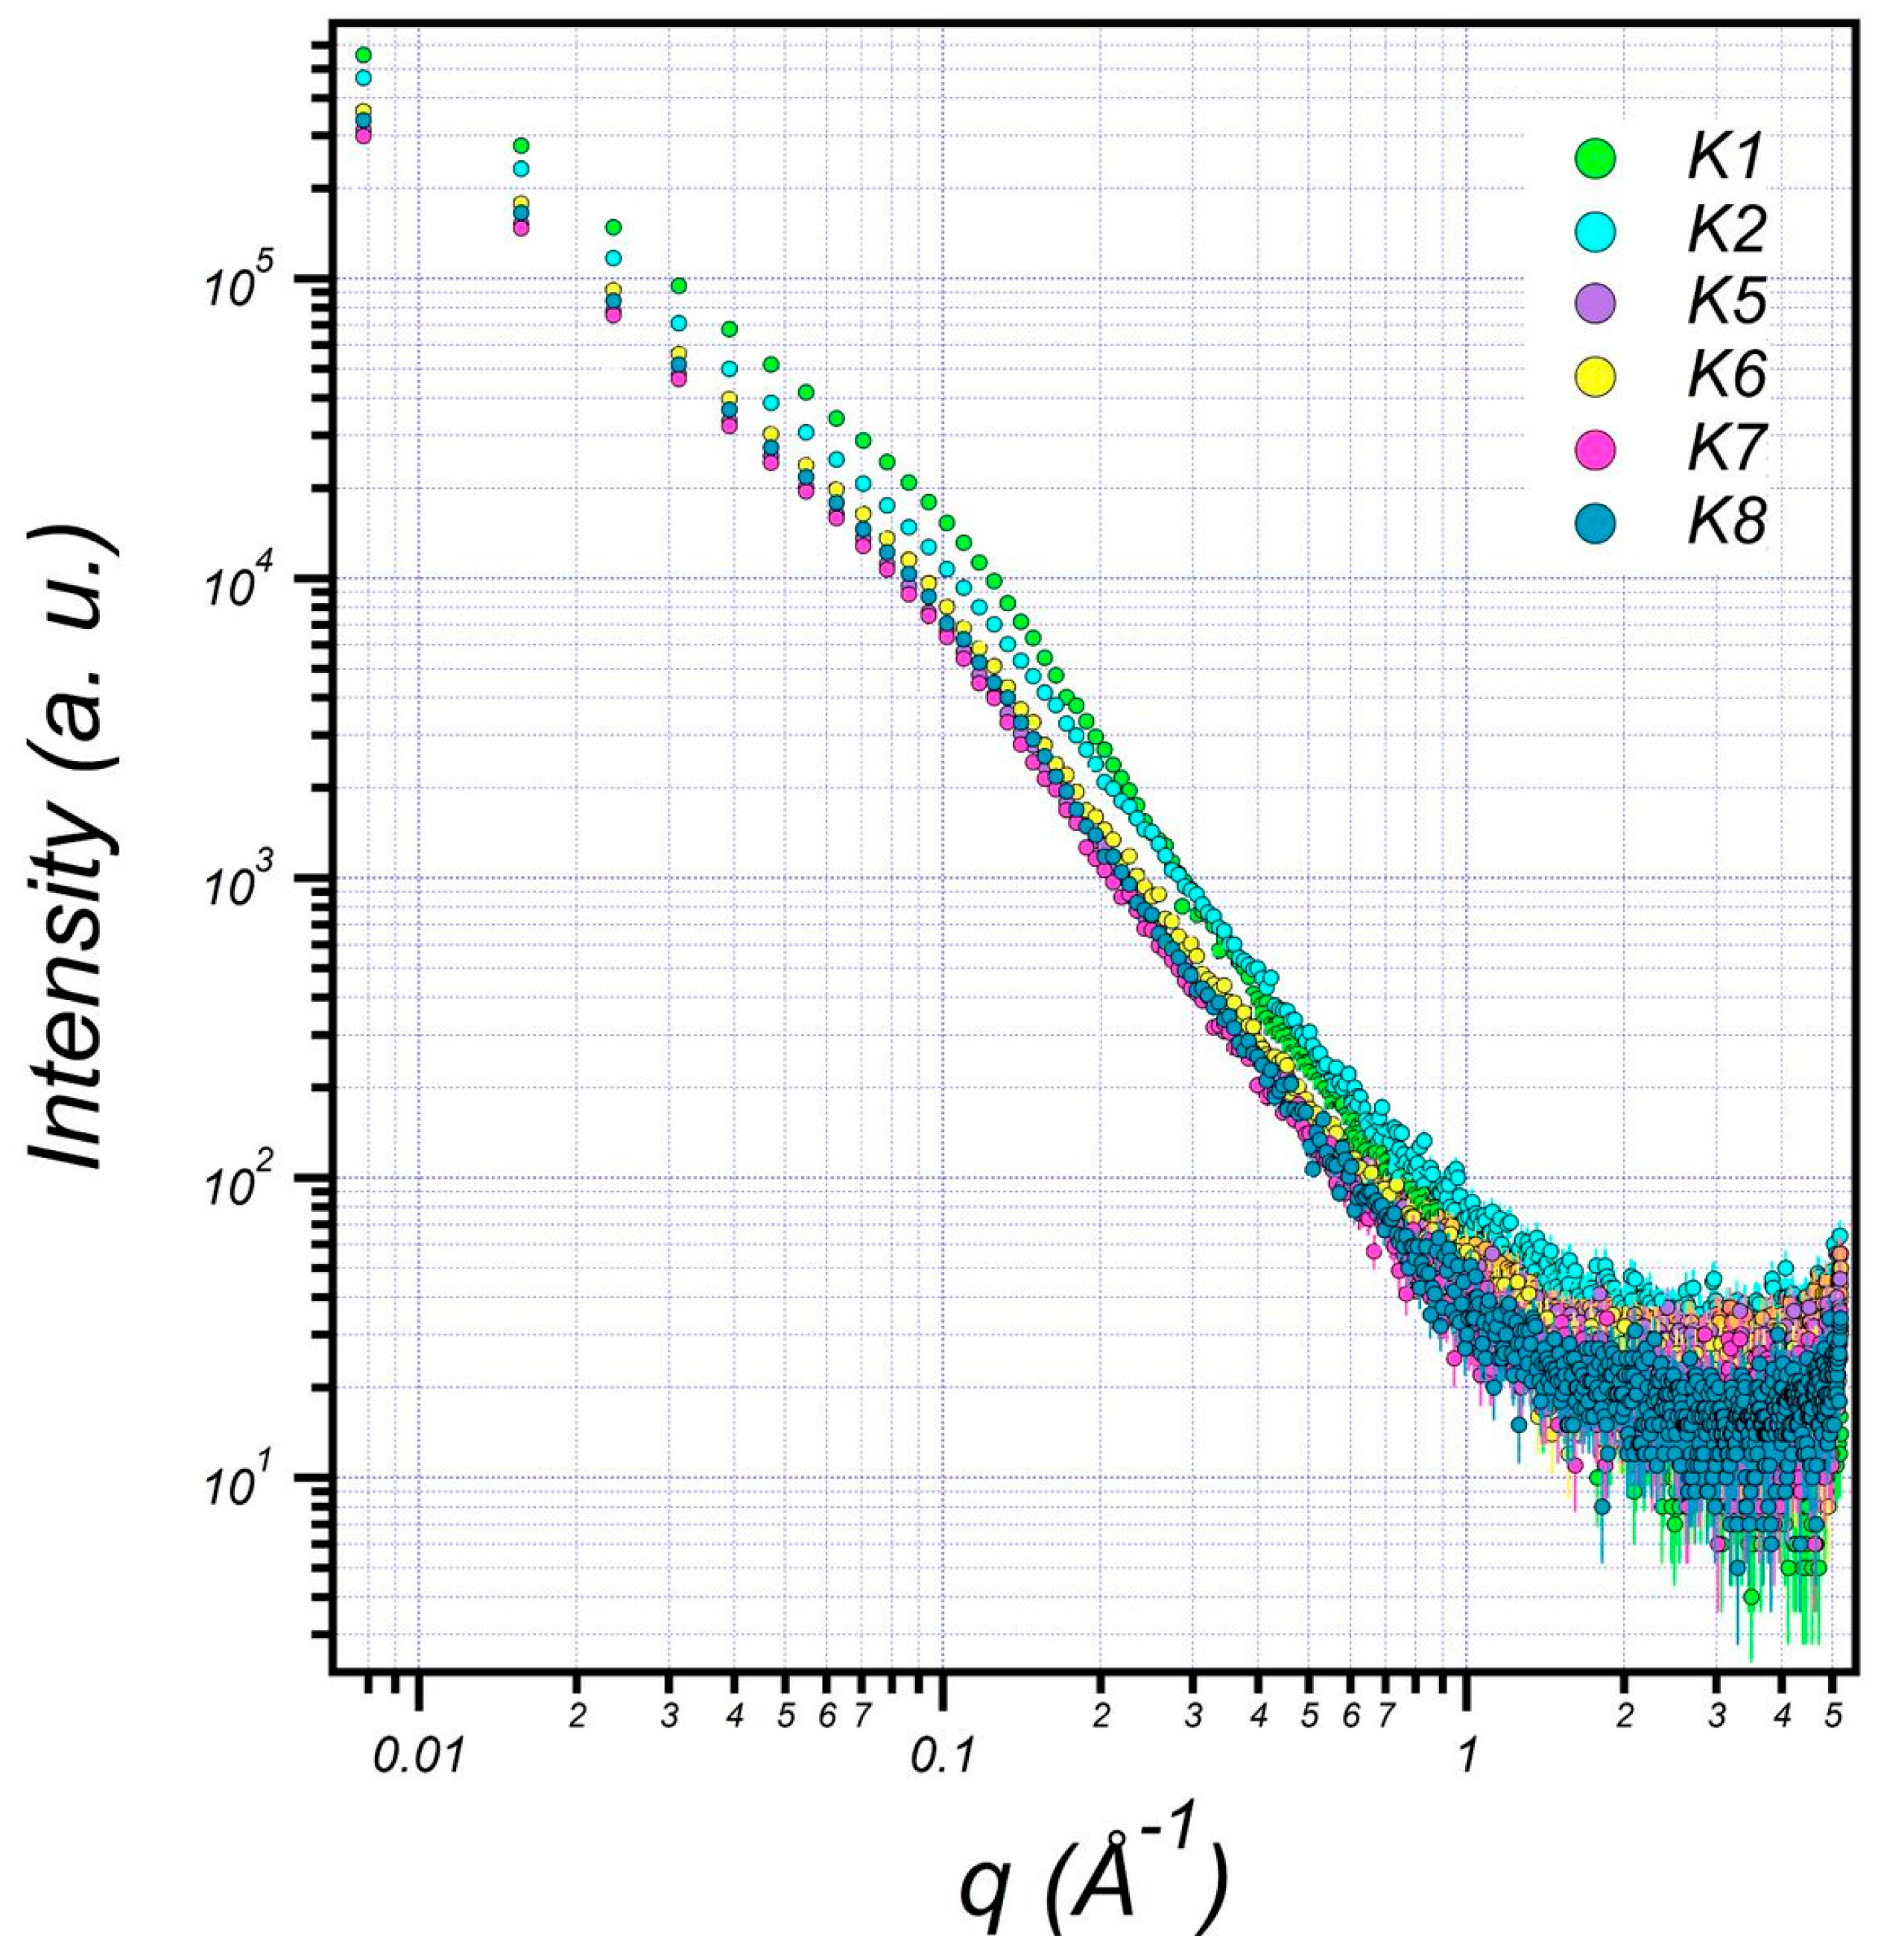
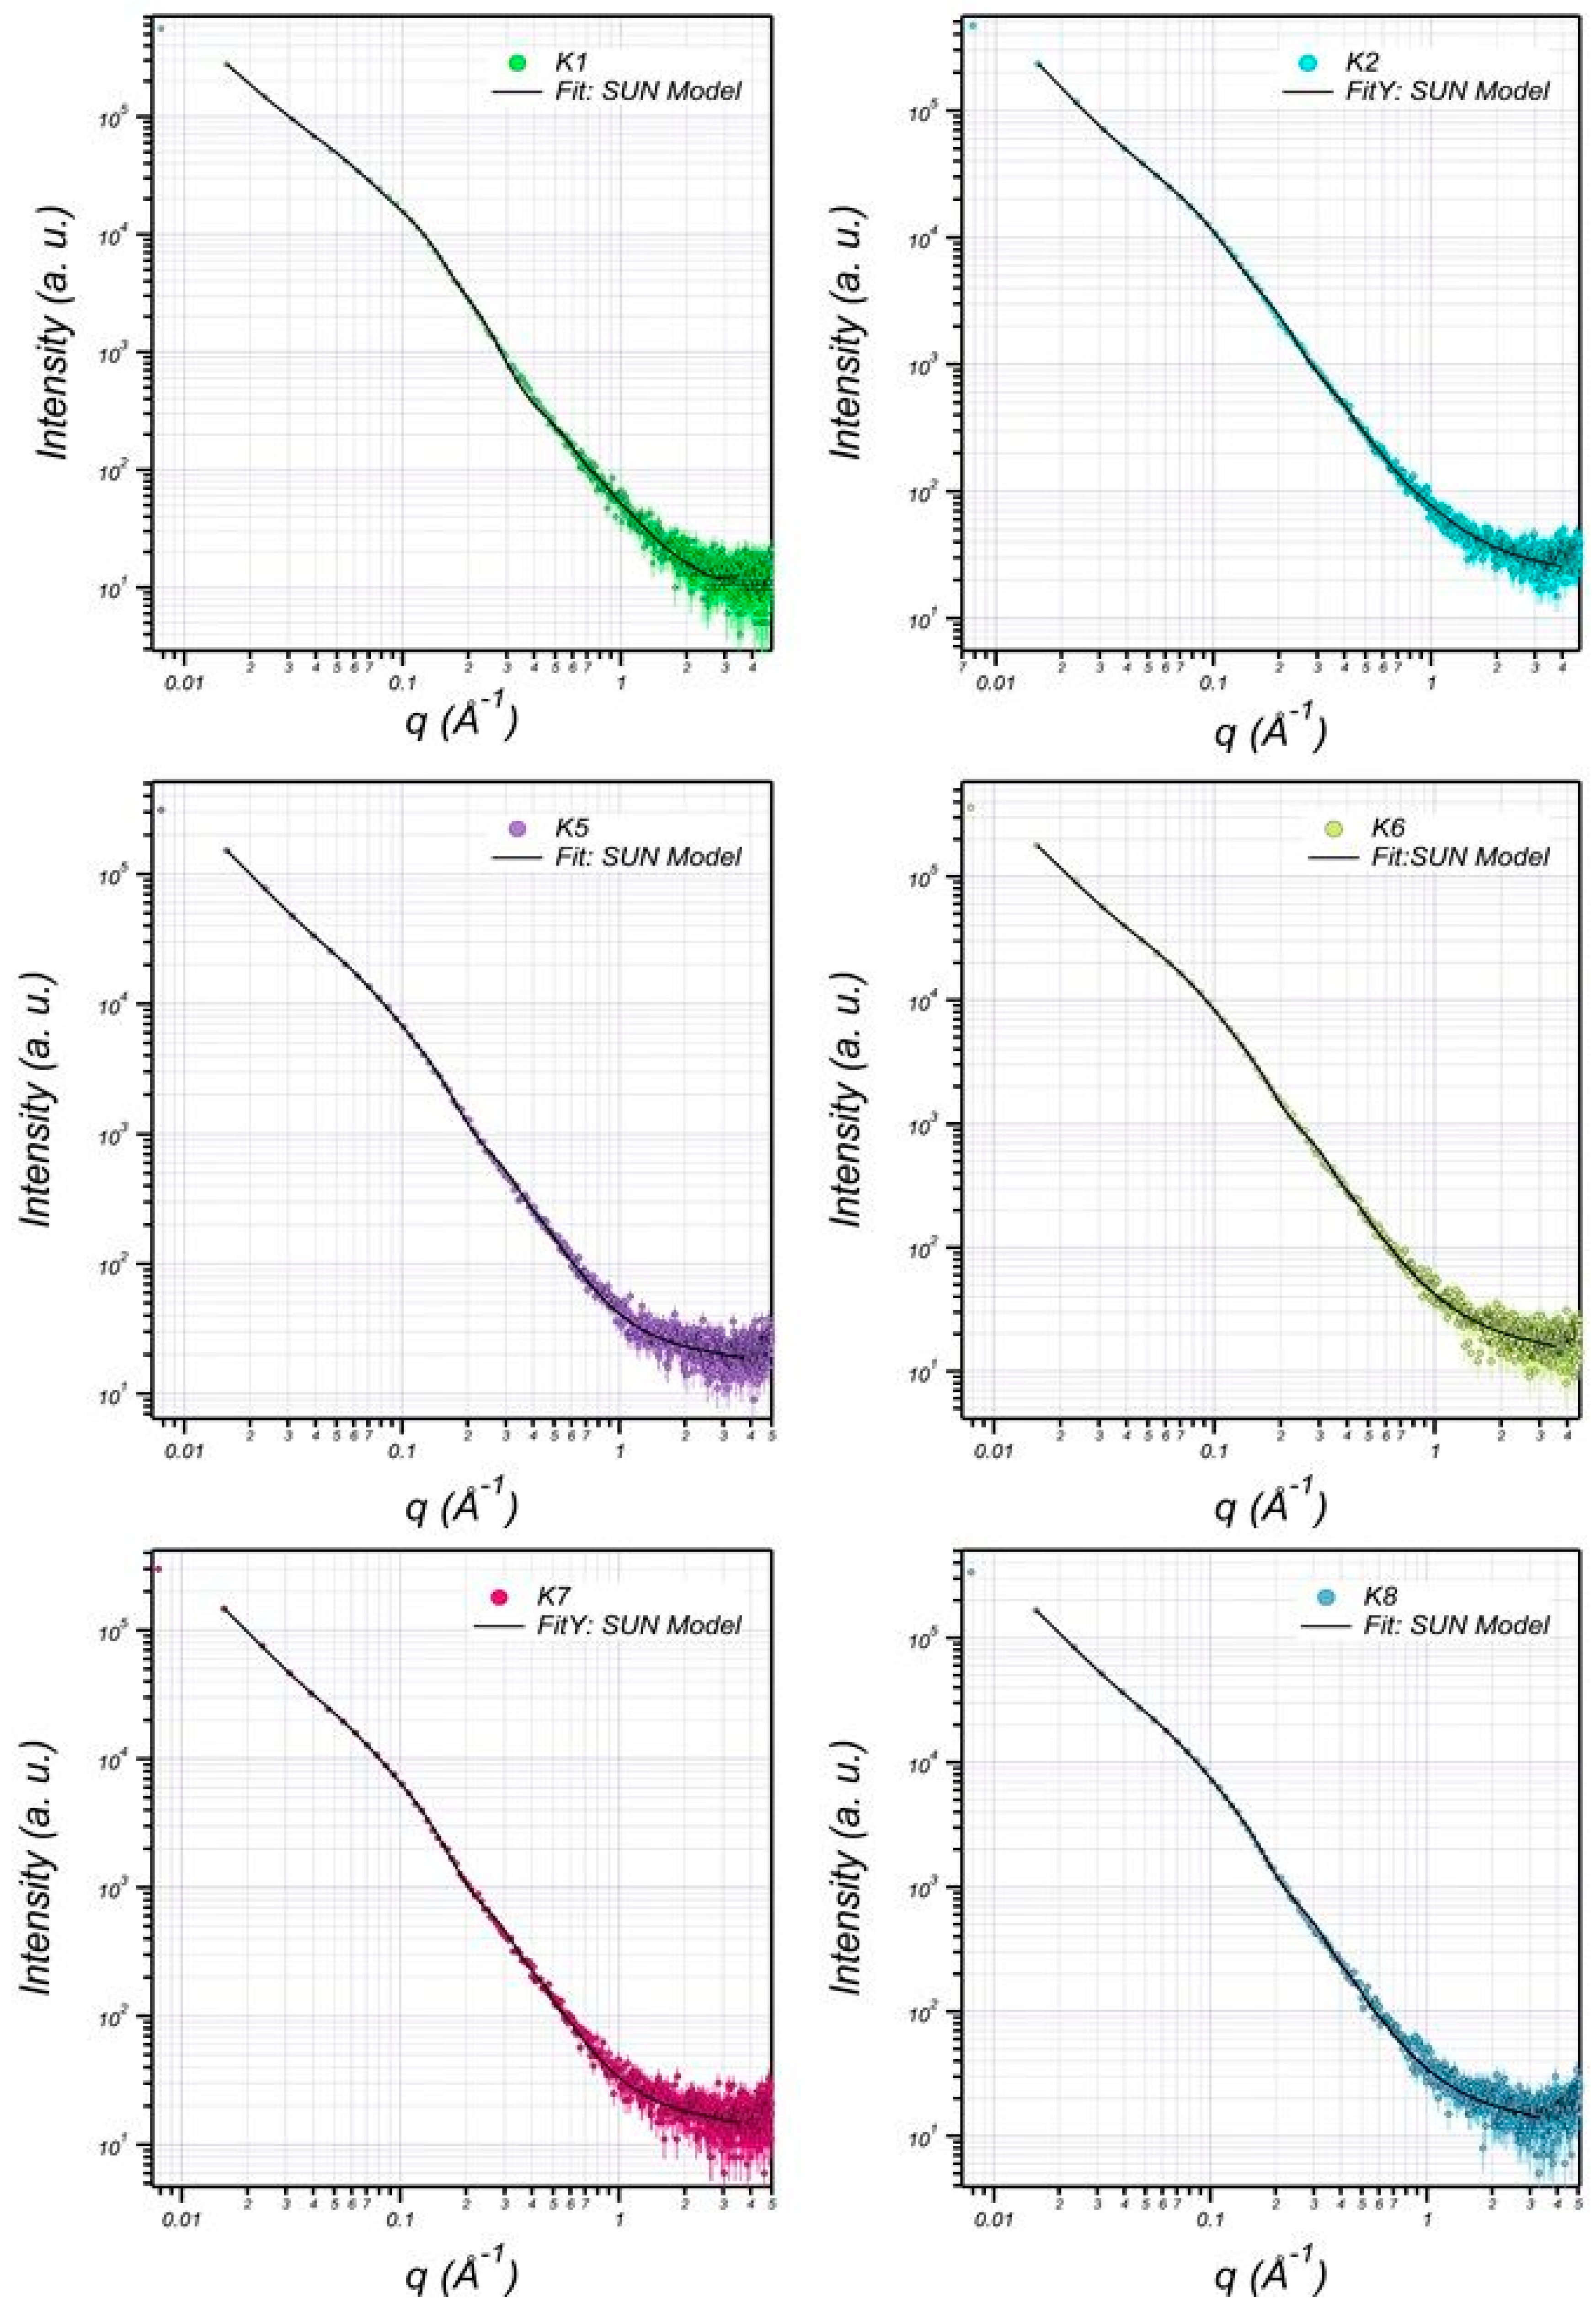
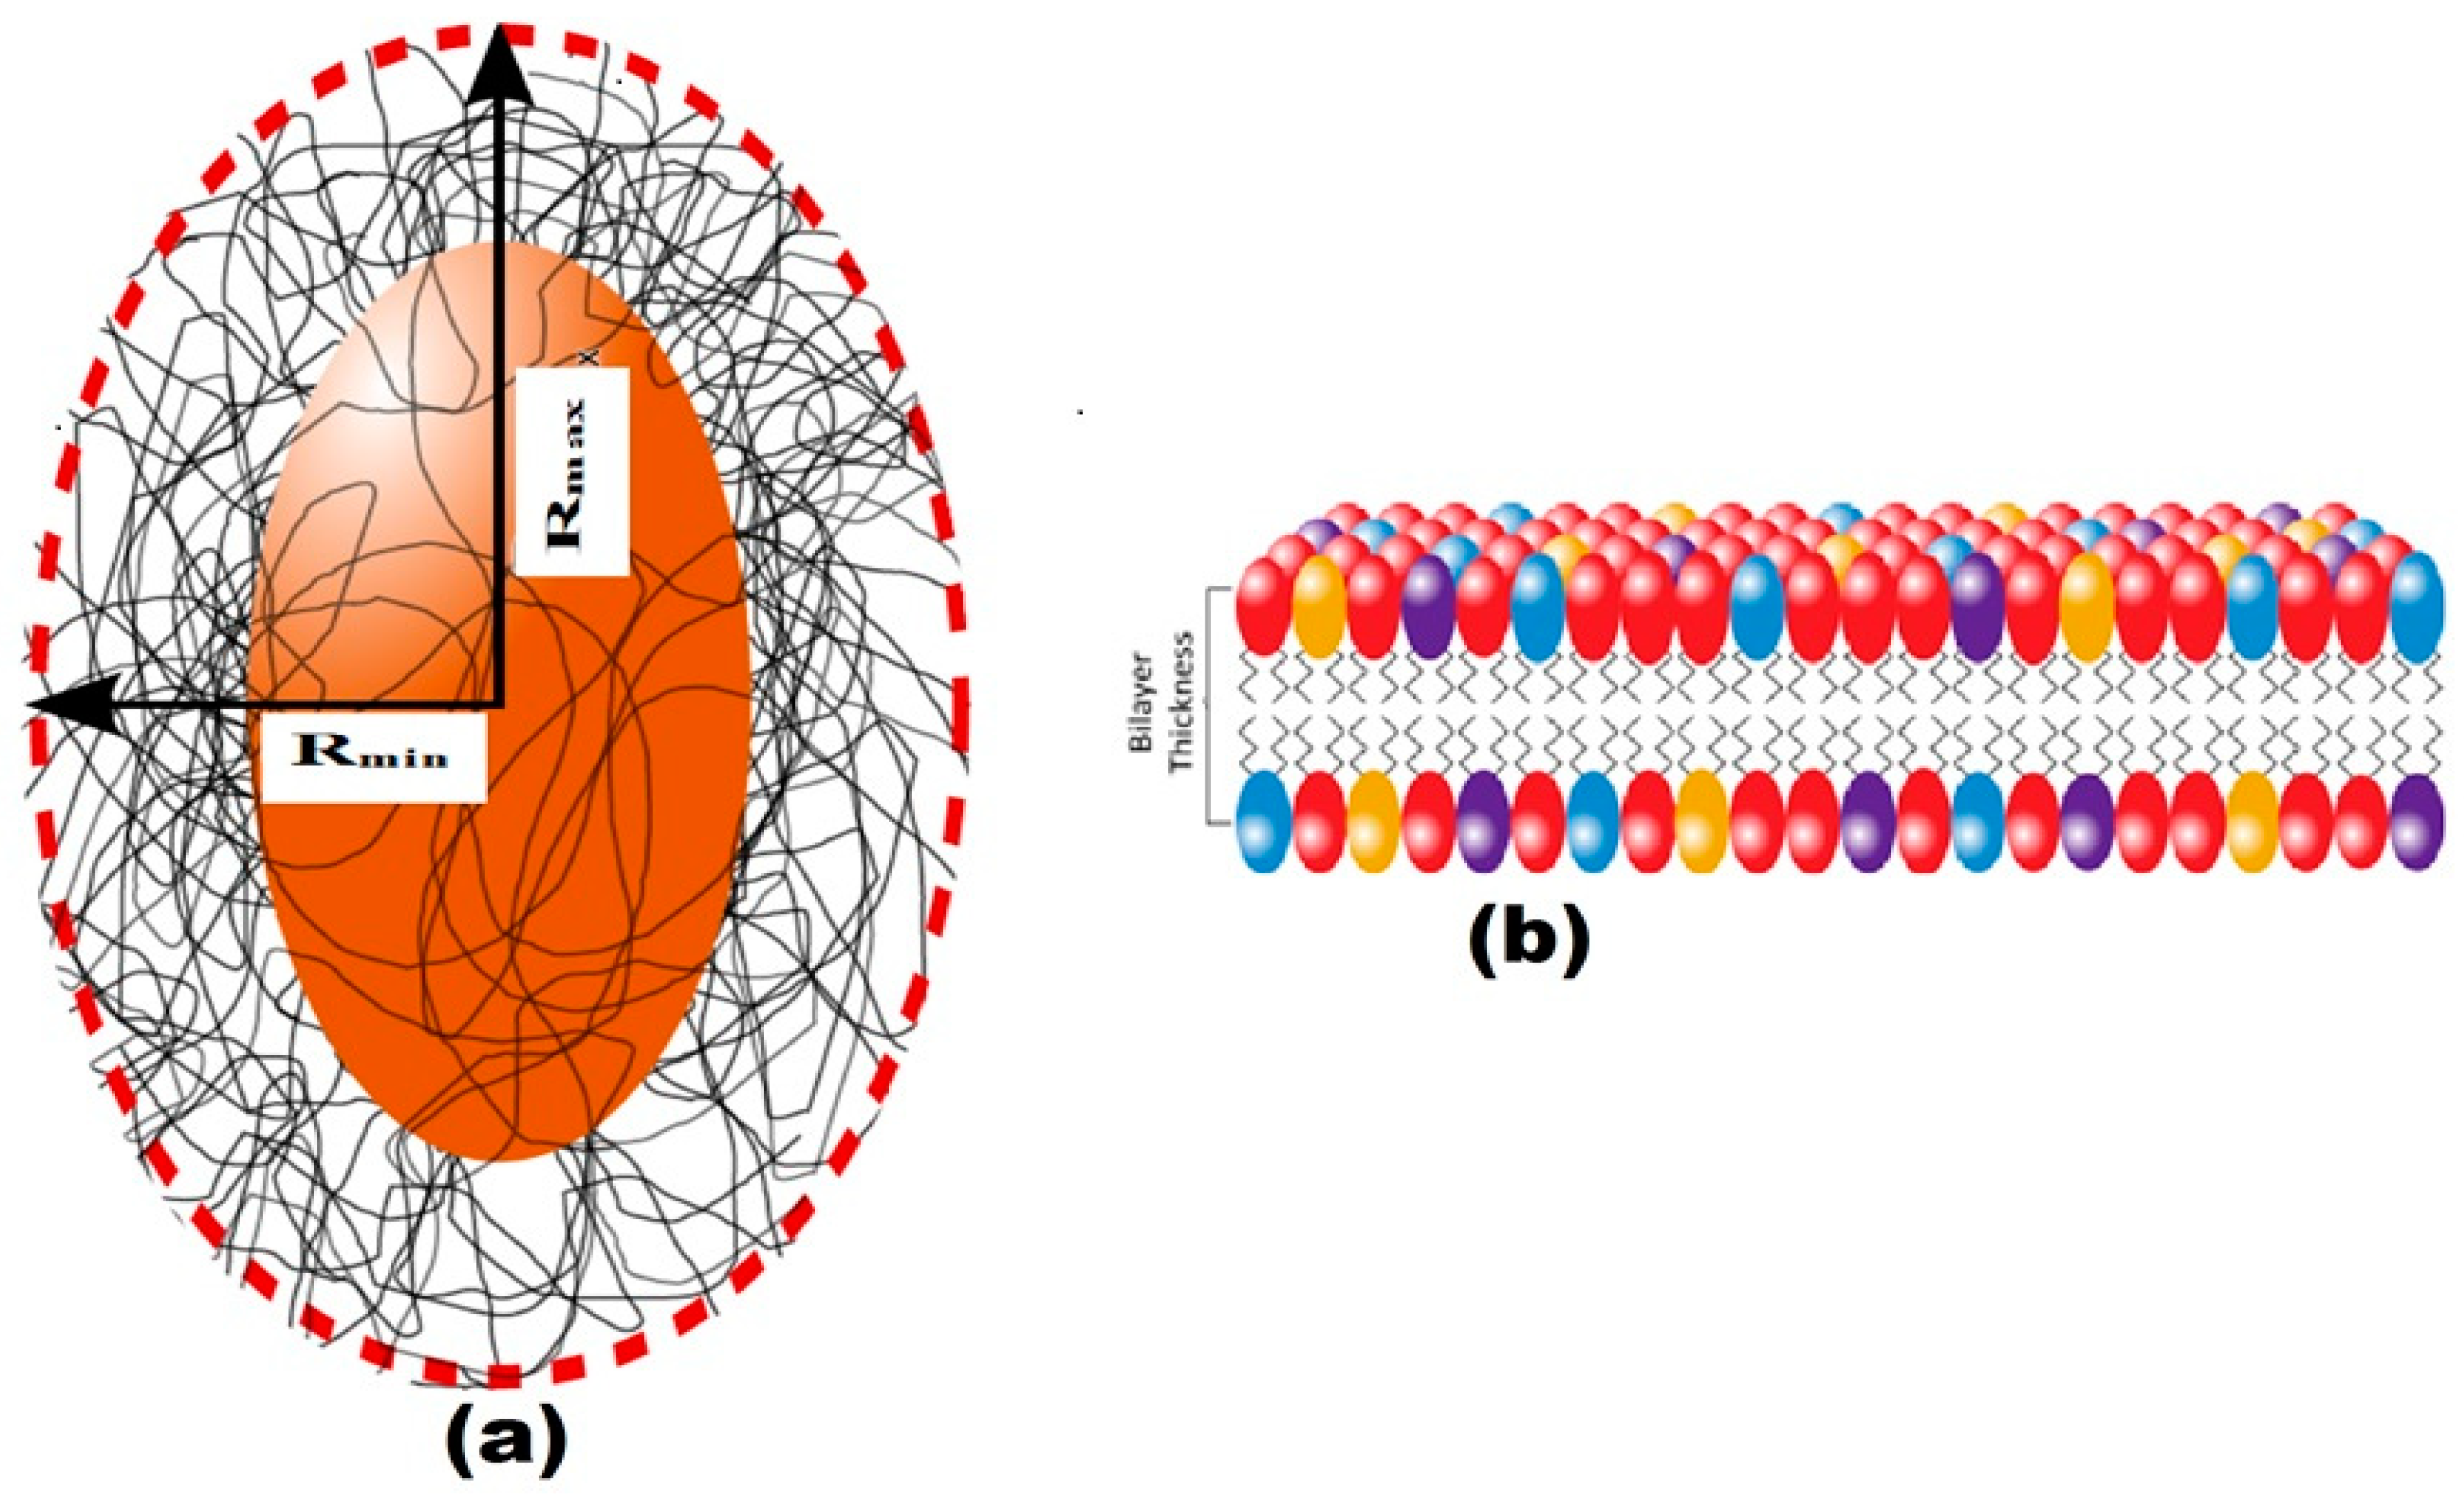
The structure of EPS extracted from U10 was characterized in detail by small-angle X-ray scattering (SAXS), which is a powerful method to investigate nano-aggregations formed by the self-assembly of polymers in melted, solution, or crystal state [49,50]. The EPS structures, including the size, shape, and bilayer thickness, were characterized using SAXS. The results indicate that a more stable EPS structure can be achieved within aqueous (0.5% w/v) at room temperature. Figure 5 includes the SAXS profiles of the particulate and dissolved EPS of U10 in the water solution at room temperature. Model-independent approximations using Guinier, Porod and Kratky plots can extract the morphology characteristics on the basis of which a suitable model shape may be chosen to fit the SAXS profiles [51,52,53]. The data can be fitted reasonably well using a lamellar with prolate core shell model, as shown in Figure 6. Figure 6 shows the SAXS data for EPS of U10 in the water solution, at the same pH value, and at 24 °C. Under such conditions, the SAXS data indicate the formation of EPS for both cases. The EPS solutions have a lamellar and prolate core shell with a major core radius of 1001.52 ± 5.01 Å, a major shell thickness of 1201.46 ± 2.40 Å, and a bilayer thickness of 14.07 ± 0.72 Å in the water solution with bacteria grown in LB medium. In the LB with whey medium, the EPS solutions have a lamellar and prolate core shell with a major core radius of 845.75 ± 5.01 Å, a major shell thickness of 998.94 ± 2.40 Å, and a bilayer thickness of 12.04 ± 0.72 Å. For the addition of glucose as a water solvent with LB, the EPS solutions have a lamellar and prolate core shell with a major core radius of 845.75 ± 3.22 Å, a major shell thickness of 998.94 ± 3.14 Å, and a bilayer thickness of 12.04 ± 0.81 Å (see Table 6). As a result, the radius of a major core, shell thickness and bilayer thickness obtained for the EPS decreases from 1001.52 ± 5.01 to 845.75 ± 3.22 Å, 1201.46 ± 2.40 to of 998.94 ± 3.14 Å and 14.07 ± 0.72 to 12.04 ± 0.81 Å with the addition of glucose as a solvent in LB. The proposed prolate structural model derived from these considerations is schematically illustrated in Figure 7.
3.7. SEM Analysis of EPS
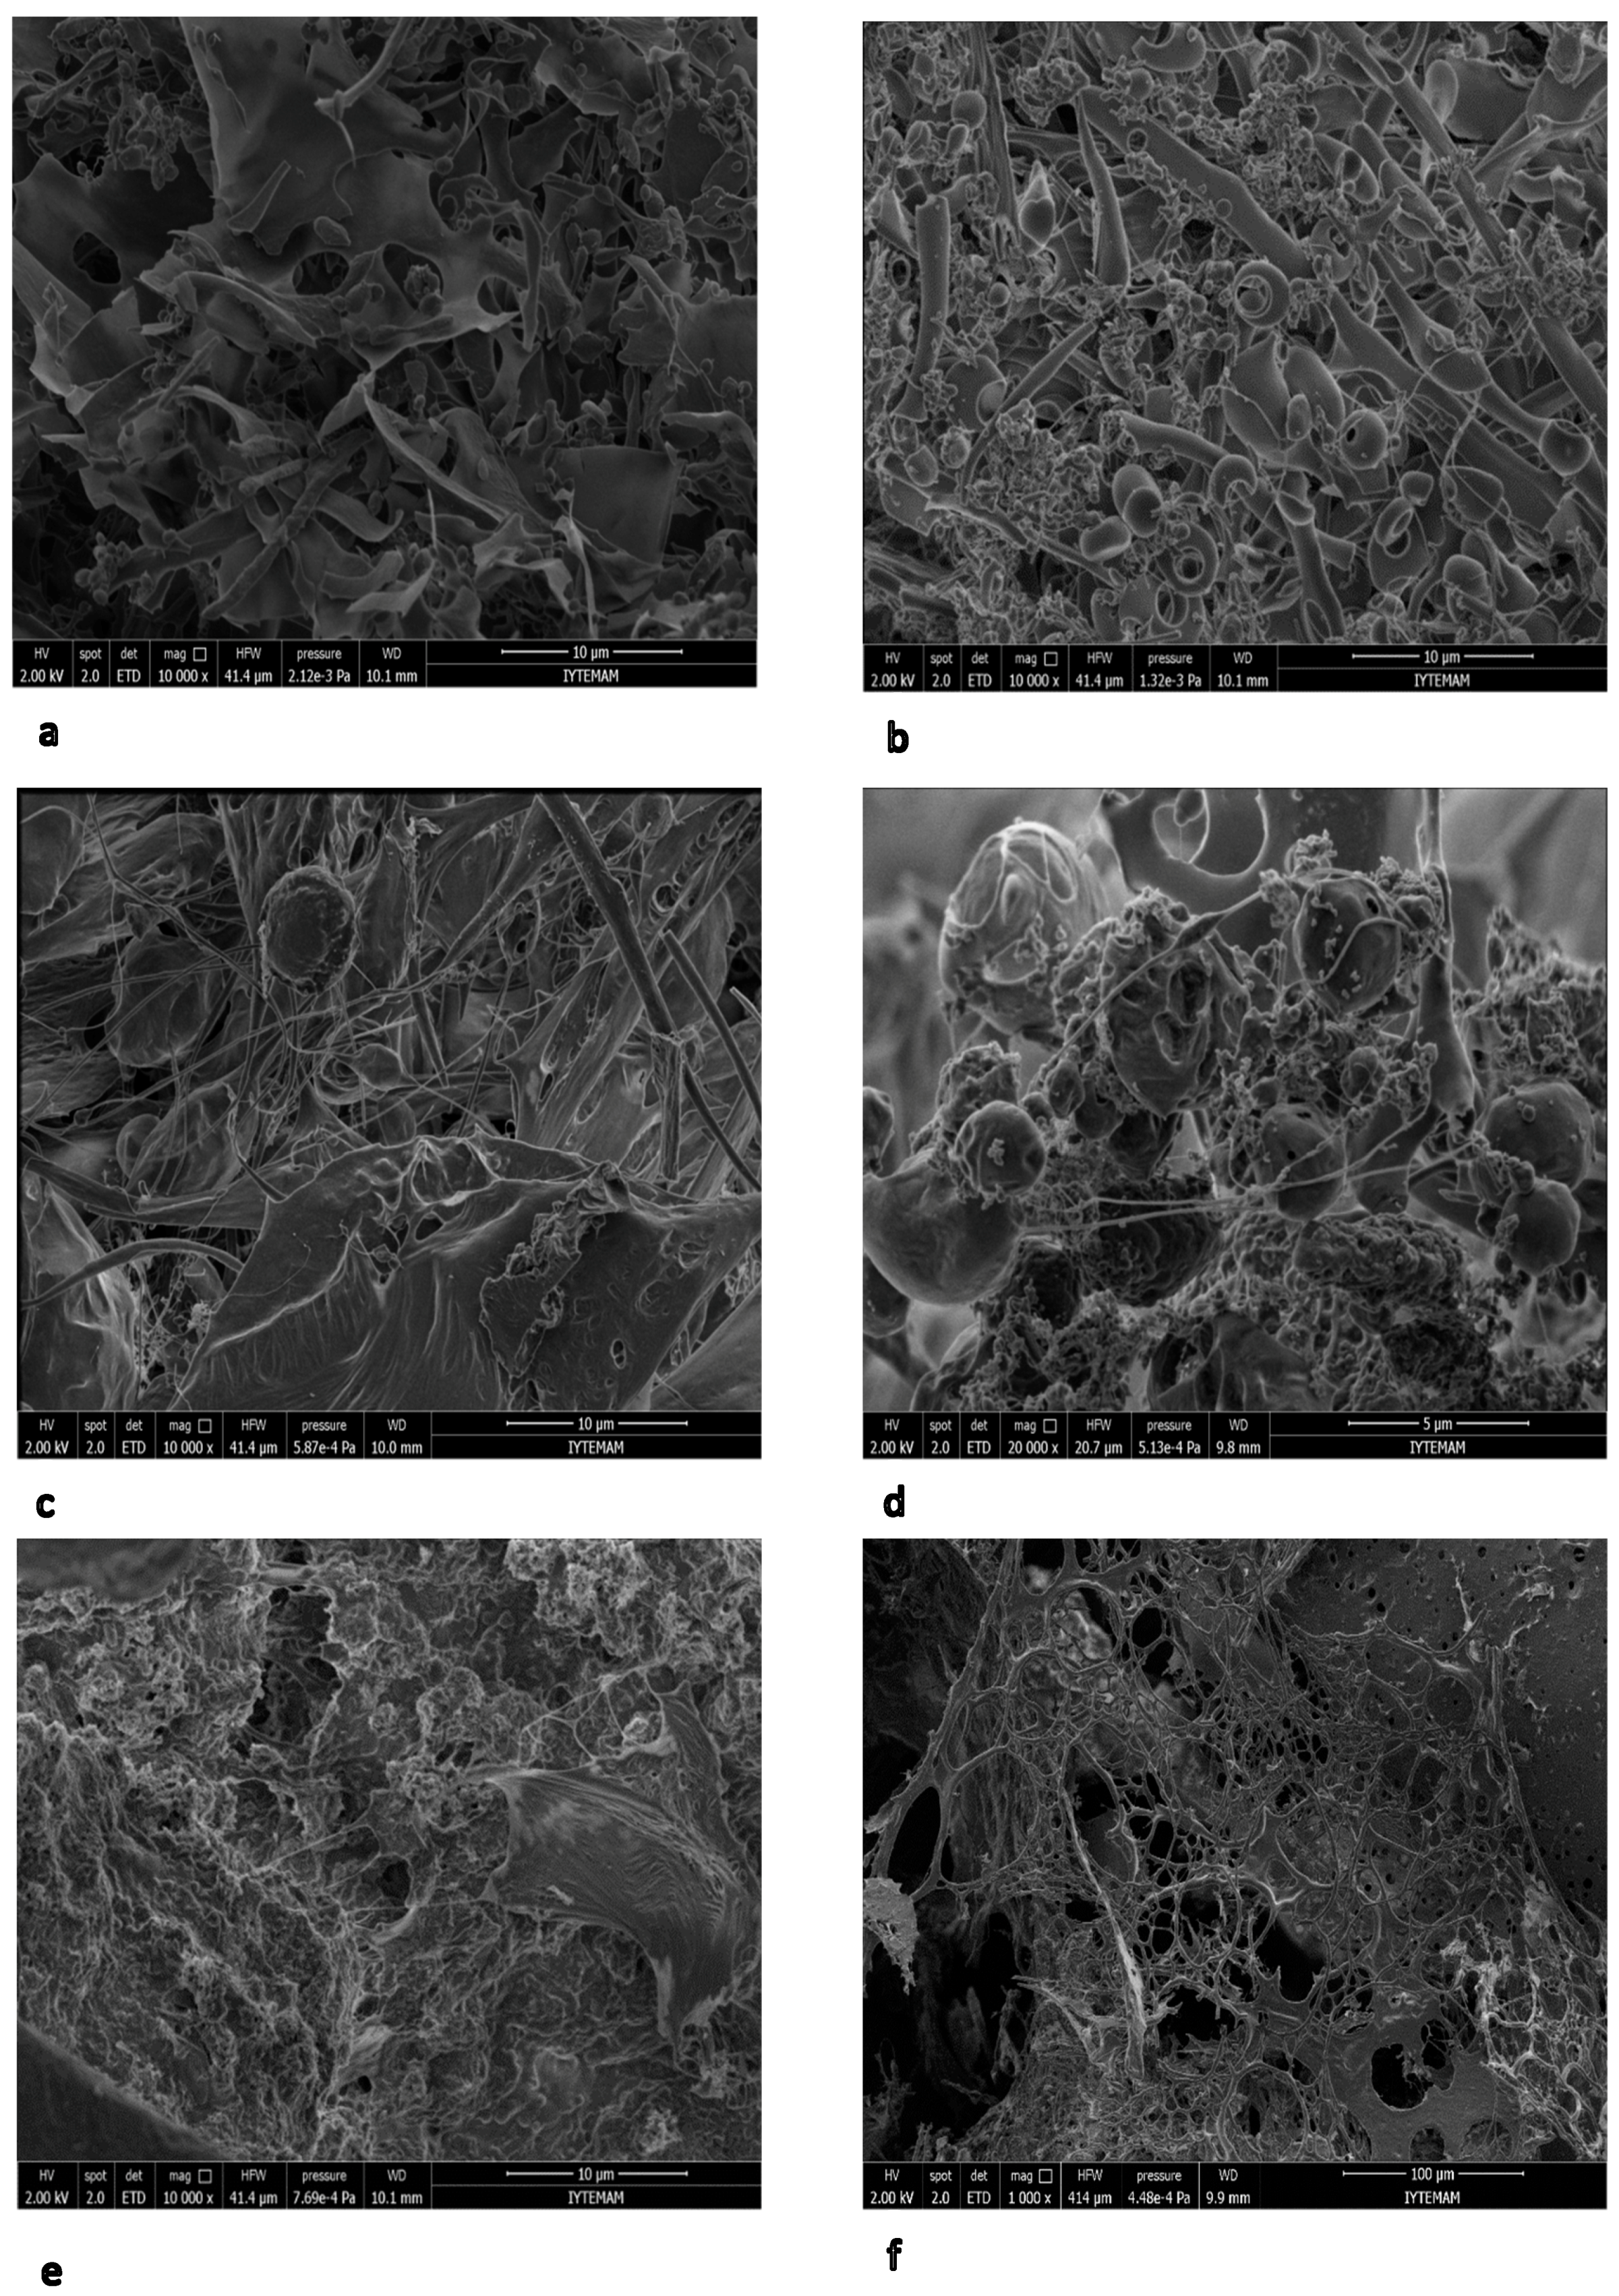
SEM investigations of EPS show that B. pseudomycoides U10 cells are observed as individual and in dense clusters within the polymeric carbohydrate matrix (Figure 8). U10 cells have approximately a 0.25–0.5 μm radius, connected to each other with thin EPS fibrils or filaments. The EPS matrix is shown as mostly condensed lamellas (CL) and rarely rolled layers (RL). In general, CL and RL types are, respectively, dominant in dissolved and membrane-bound EPSs. On the other hand, a filamentous (and fibrous) structure is more common in media of whey addition.
4. Conclusions
Extracellular polysaccharides (EPSs) are synthesised by microorganisms and are important for industrial applications with significant commercial value. Different strategies are applied to reduce the cost of production such as using cheaper substrates and improving product yield by optimizing fermentation conditions. The findings indicate that glycerol was not a suitable carbon source for the growth of B. pseudomycoides U10, so EPS was not produced. In contrast, the addition of whey as a cheaper source was effective for the production of EPS. There are many studies on EPS production by microorganisms. However, EPS produced by B. pseudomycoides U10 has been explored for the first time in detail. The XRD data of EPS produced by B. pseudomycoides U10 under different growth environments indicate an amorphous (i.e., poorly developed ordering) structure. Two different EPS peaks (EPS1 = 4.1–4.4 Å and EPS2 = 3.7–4.0 Å) were detected, probably belonging to chitin/chitosan and proteins, respectively. Whey addition caused an increase in the d-values of EPS particles. Also, SAXS analyses have recently been very successful and useful for characterizing surface structures. Therefore, we performed SAXS analysis to reveal the surface structure of EPS of B. pseudomycoides U10. Fitting to the SAXS data showed that the results of solutions are in agreement with aqueous results. Compared to the aggregation behavior of the particulate, the EPS of U10 (Figure 5) apparently forms a more compact EPS, with a clearer prolate core-shell model and bilayer thickness (Figure 6). Our analysis revealed that the EPS matrix was condensed in a layer around the cells, which is confirmed by the SAXS data in Figure 7. TGA curves of the EPS exhibit two-stage (20–200 °C and 200–400 °C) weight loss together with increasing temperature. The first stage has 10% weight loss and corresponds to the loss of bonding water molecules (or moisture) and degradation of the carboxyl groups. The second stage has maximum weight loss (60–70%) and resulted from pyrolysis of the EPS. Whey addition to LB medium decreased the weight loss values of EPSs. SEM photomicrographs of EPS showed that U10 cells were found to be individual and in dense clusters within the polymeric carbohydrate matrix as mostly condensed lamellas (CL) and rarely rolled layers (RL). The CL-type matrix was dominant in dissolved EPS, whereas RL was the characteristic matrix type for membrane-bound EPSs. Whey addition increased the filamentous (and fibrous) structure. Finally, whey addition changed EPS structures, such as higher d-values, lower weight losses and more filamentous structures, which seems to be related to increasing durability and/or stability. Thus, medium with whey added had more potential for EPS production by B. pseudomycoides U10.
Author Contributions
N.M.D. designed the experiments and wrote the paper; K.B.S. performed the experiments. O.B., Y.O. and S.I. analyzed the data of XRD, TGA and SAXS, respectively.
Acknowledgments
This study is a part of the MSc of Kubra Betul Solmaz. The authors would like to thank the scientific research council of Pamukkale University, Turkey, for research grant 2014FBE036.
Conflicts of Interest
The authors declare no conflicts of interest.
References
- Sheng, G.P.; Yu, H.Q.; Li, X.Y. Extracellular polymeric substances (EPS) of microbial aggregates in biological wastewater treatment systems: A review. Biotechnol. Adv. 2010, 28, 882–894. [Google Scholar] [CrossRef] [PubMed]
- Frolund, B.; Palmgren, R.; Keiding, K.; Nielsen, P.H. Extraction of extracellular polymers from activated sludge using a cation exchange resin. Water Res. 1996, 30, 1749–1758. [Google Scholar] [CrossRef]
- Dignac, M.F.; Urbain, V.; Rybacki, D.; Bruchet, A.; Snidaro, D.; Scribe, P. Chemical description of extracellular polymeric substances: Implication on activated sludge floc structure. Water Sci. Technol. 1998, 38, 45–53. [Google Scholar] [CrossRef]
- Wingender, J.; Neu, T.R.; Flemming, H.C. Microbial Extracellular Polymeric Substances: Characterization, Structure and Function; Springer: Berlin/Heidelberg, Germany; New York, NY, USA, 1999. [Google Scholar]
- Tian, Y. Behaviour of bacterial extracellular polymeric substances from activated sludge: A review. Int. J. Environ. Pollut. 2008, 32, 78–89. [Google Scholar] [CrossRef]
- Zhang, X.; Bishop, P.L. Biodegradability of biofilm extracellular polymeric substances. Chemosphere 2003, 50, 63–69. [Google Scholar] [CrossRef]
- Rasa, M.; Lefebvre, D.; Derlon, N.; Hamelin, J.; Bernet, N.; Paul, E.; Girbal-Neuhauser, E. Distribution and hydrophobic properties of Extracellular Polymeric Substances in biofilms in relation towards cohesion. J. Biotechnol. 2013, 165, 85–89. [Google Scholar] [CrossRef] [PubMed]
- Wei, L.; Li, Y.; Noguera, D.R.; Zhao, N.; Song, Y.; Ding, J.; Zhao, Q.; Cui, F. Adsorption of Cu2+ and Zn2+ by extracellular polymeric substances(EPS) in different sludges: Effect of EPS fractional polarity on binding mechanism. J. Hazard. Mater. 2017, 321, 473–483. [Google Scholar] [CrossRef] [PubMed]
- Chen, X.D.; Zhang, C.K.; Zhou, Z.; Gong, Z.; Zhou, J.J.; Tao, J.F.; Paterson, D.M.; Feng, Q. Stabilizing Effects of Bacterial Biofilms: EPS Penetration and Redistribution of Bed Stability Down the Sediment Profile. J. Geophys. Res. Biogeosci. 2017, 122, 3113–3125. [Google Scholar] [CrossRef]
- Flemming, H.C.; Leis, A. Sorption Properties of Biofilms, Encyclopedia of Environmental Microbiology; John Wiley & Sons, Inc.: Hoboken, NJ, USA, 2003. [Google Scholar]
- Czaczyk, K.; Myszk, K. Biosynthesis of extracellular polymeric substances (EPS) and its role in microbial biofilm formation. Pol. J. Environ. Stud. 2007, 16, 799–806. [Google Scholar]
- Sun, C.; Wang, J.W.; Fang, L.; Gao, X.D.; Tan, R.X. Free radical scavenging and antioxidant activities of EPS2, an exopolysaccharide produced by a marine filamentous fungus Keissleriella sp. YS 4108. Life Sci. 2004, 75, 1063–1073. [Google Scholar] [CrossRef] [PubMed]
- Iyer, A.; Mody, K.; Jha, B. Emulsifying properties of a marine bacterial exopolysaccharide. Enzym. Microb. Technol. 2006, 38, 220–222. [Google Scholar] [CrossRef]
- Kantar, C.; Demiray, H.; Dogan, N.M. Role of microbial exopolymeric substances (EPS) on chromium sorption and transport in heterogeneous subsurface soils: II. Binding of Cr(III) in EPS/soil system. Chemosphere 2011, 82, 1496–1505. [Google Scholar] [CrossRef] [PubMed]
- Saravanan, C.; Rajesh, R.; Kaviarasan, T.; Muthukumar, K.; Kavitake, D.; Shetty, P.H. Synthesis of silver nanoparticles using bacterial exopolysaccharide and its application for degradation of azo-dyes. Biotechnol. Rep. 2017, 15, 33–40. [Google Scholar] [CrossRef] [PubMed]
- Prasanna, P.H.P.; Grandison, A.S.; Charalampopoulos, D. Microbiological, chemical and rheological properties of low fat set yoghurt produced with exopolysaccharide (EPS) producing Bifidobacterium strains. Food Res. Int. 2013, 51, 15–22. [Google Scholar] [CrossRef]
- Laurienzo, P. Marine Polysaccharides in Pharmaceutical Applications: An Overview. Mar. Drugs 2010, 8, 2435–2465. [Google Scholar] [CrossRef] [PubMed]
- Kitamura, S.; Minami, T.; Nakamura, Y.; Isuda, H.; Kobayashi, H.; Mimura, M.; Urakawa, H.; Kajiwara, K.; Ohno, S. Chain dimensions and scattering function of (1→3)-β-d-glucan simulated by the Monte Carlo method. J. Mol. Struct. THEOCHEM 1997, 395–396, 425–435. [Google Scholar] [CrossRef]
- Jaud, S.; Tobias, D.J.; Brant, D.A. Molecular Dynamics Simulations of Aqueous Pullulan Oligomers. Biomacromolecules 2005, 6, 1239–1251. [Google Scholar] [CrossRef] [PubMed]
- Brant, A.D. Novel approaches to the analysis of polysaccharide structures. Curr. Opin. Struct. Biol. 1996, 9, 556–562. [Google Scholar] [CrossRef]
- Gamini, A.; Paoletti, S.; Toffanin, R.; Micali, F.; Michielin, L.; Bevilacqua, C. Structural investigations of cross-linked hyaluronan. Biomaterials 2002, 23, 1161–1167. [Google Scholar] [CrossRef]
- Hirata, Y.; Sano, Y.; Aoki, M.; Shohji, H.; Katoh, S.; Abe, J.; Hitsukuri, S.; Yamamoto, H. Small angle x-ray scattering studies of moderately concentrated dextran solution. Carbohydr. Polym. 2003, 53, 331–335. [Google Scholar] [CrossRef]
- Mischenko, N.; Denef, B.; Koch, M.H.J.; Reynaers, H. Influence of ionic effects on the ordering and association phenomena in dilute and semidilute carrageenan solutions. Int. J. Biol. Macromol. 1996, 19, 185–194. [Google Scholar] [CrossRef]
- Yuguchi, Y.; Urakawa, H.; Kajiwara, K. The effect of potassium salt on the structural characteristics of gellan gum gel. Food Hydrocoll. 2002, 16, 191–195. [Google Scholar] [CrossRef]
- Dogsa, I.; Kriechbaum, M.; Stopar, D.; Laggner, P. Structure of Bacterial Extracellular Polymeric Substances at Different pH Values as Determined by SAXS. Biophys. J. 2005, 89, 2711–2720. [Google Scholar] [CrossRef] [PubMed]
- Frengova, G.I.; Simova, E.D.; Beshkova, D.M.; Simov, Z.I. Production and monomer composition of exopolysaccharides by yogurt starter cultures. Can. J. Microbiol. 2000, 46, 1123–1127. [Google Scholar] [CrossRef] [PubMed]
- Dubois, M.; Gilles, K.A.; Hamilton, J.K.; Roberts, P.A.; Smith, F. Colorimetric Determination of Sugars and Related Substances. Anal. Chem. 1956, 28, 350–356. [Google Scholar] [CrossRef]
- Hung, C.C.; Santschi, P.H.; Gillow, J.B. Isolation and characterization of extracellular polysaccharides produced by Pseudomonas fluorescens Biovar II. Carbohydr. Polym. 2005, 61, 141–147. [Google Scholar] [CrossRef]
- Hartree, E.F. Determination of Protein: A Modification of the Lowry Method That Gives a Linear Photometric Response; Agricultural Research Council, Unit of Reproductive Physiology and Biochemistry: Cambridge, UK, 2004; p. 307. [Google Scholar]
- Hung, C.C.; Santschi, P.H. Spectrophotometric determination of total uronic acids in seawater using cation-exchange separation and pre-concentration by lyophilization. Anal. Chim. Acta 2001, 427, 111–117. [Google Scholar] [CrossRef]
- Larpin, S.; Sauvageot, N.; Pichereau, V.; Laplace, J.M.; Auffray, Y. Biosynthesis of exopolysaccharide by a Bacillus licheniformis strain isolated from ropy cider. Int. J. Food Microbiol. 2002, 77, 1–9. [Google Scholar] [CrossRef]
- Binupriya, A.R.; Sathishkumar, M.; Ku, C.S.; Yun, S. Sequestration of Reactive Blue 4 by free and immobilized Bacillus subtilis cells and its extracellular polysaccharides. Colloids Surf. B Biointerfaces 2010, 76, 179–185. [Google Scholar] [CrossRef] [PubMed]
- Liu, C.; Lu, J.; Lu, L.; Liu, Y.; Wanga, F.; Xiao, M. Isolation, structural characterization and immunological activity of an exopolysaccharide produced by Bacillus licheniformis 8-37-0-1. Bioresour. Technol. 2010, 101, 5528–5533. [Google Scholar] [CrossRef] [PubMed]
- Chowdhury, S.R.; Basak, R.K.; Sen, R.; Adhikari, B. Production of extracellular polysaccharide by Bacillus megaterium RB-05 using jute as substrate. Bioresour. Technol. 2011, 102, 6629–6632. [Google Scholar] [CrossRef] [PubMed]
- Dogan, N.M.; Doganli, G.A.; Dogan, G.; Bozkaya, Ö. Characterization of Extracellular Polysaccharides (EPS) Produced by Thermal Bacillus and Determination of Environmental Conditions Affecting Exopolysaccharide Production. Int. J. Environ. Res. 2015, 9, 1107–1116. [Google Scholar]
- Gandhi, H.P.; Ray, R.M.; Patel, R.M. Exopolymer production by Bacillus species. Carbohydr. Polym. 1997, 34, 323–327. [Google Scholar] [CrossRef]
- Barker, D.J.; Stuckey, D.C. A review of soluble microbial products (SMP) in wastewater treatment systems. Water Res. 1999, 33, 3063–3082. [Google Scholar] [CrossRef]
- Freitas, F.; Alves, V.D.; Pais, J.; Costa, N.; Oliveira, C.; Mafra, L.; Hilliou, L.; Oliveira, R.; Reis, M.A.M. Characterization of an extracellular polysaccharide produced by a Pseudomonas strain grown on glycerol. Bioresour. Technol. 2009, 100, 859–865. [Google Scholar]
- Celik, G.Y.; Aslim, B.; Beyatli, Y. Characterization and production of the exopolysaccharide (EPS) from Pseudomonas aeruginosa G1 and Pseudomonas putida G12 strains. Carbohydr. Polym. 2008, 73, 178–182. [Google Scholar] [CrossRef]
- Guibaud, G.; Comte, S.; Bordas, F.; Dupuy, S.; Baudu, M. Comparison of the complexation potential of extracellular polymeric substances (EPS), extracted from activated sludges and produced by pure bacteria strains, for cadmium, lead and nickel. Chemosphere 2005, 59, 629–638. [Google Scholar] [CrossRef] [PubMed]
- Castro, L.; Zhang, R.; Muñoz, J.A.; González, F.; Blázquez, M.L.; Sand, W.; Ballester, A. Characterization of exopolymeric substances (EPS) produced by Aeromonas hydrophila under reducing conditions. Biofouling 2014, 30, 501–511. [Google Scholar] [CrossRef] [PubMed]
- Lindberg, B.; Lonngren, J.; Svensson, S. Specific degradation of polysaccharides. Adv. Carbohydr. Chem. Biochem. 1975, 31, 185–239. [Google Scholar]
- Fazio, S.A.; Uhlinger, D.J.; Parker, J.H.; White, D.C. Estimations of Uronic Acids as Quantitative Measures of Extracellular and Cell Wall Polysaccharide Polymers from Environmental Samples. Appl. Environ. Microbiol. 1982, 43, 1151–1159. [Google Scholar] [PubMed]
- Kantar, C.; Honeyman, B.D. Plutonium(IV) complexation with citric and alginic acids at low PuT concentrations. Radiochim. Acta 2005, 93, 757–766. [Google Scholar] [CrossRef]
- Guibaud, G.; Tixier, N.; Bouju, A.; Baudu, M. Use of a polarographic method to determine copper, nickel, and zinc constants of complexation by extracellular polymers extracted from activated sludge. Process Biochem. 2004, 39, 833–839. [Google Scholar] [CrossRef]
- Kantar, C.; Demiray, H.; Mercan Dogan, N.; Dodge, C.J. Role of microbial exopolymeric substances (EPS) on chromium sorption and transport in heterogeneous subsurface soils: I. Cr(III) complexation with EPS in aqueous solution. Chemosphere 2011, 82, 1489–1495. [Google Scholar] [CrossRef] [PubMed]
- Krumm, S. WINFIT 1.2: Version of November 1996 (The Erlangen geological and mineralogical software collection) of WINFIT 1.0: A public domain program for interactive profile-analysis under WINDOWS. XIII Conference on Clay mineralogy and Petrology, Praha, 1994. Acta Univ. Carol. Geol. 1996, 38, 253–261. [Google Scholar]
- Kumar, C.G.; John, H.S.; Choi, J.W.; Koo, Y.M.; Chang, C.S. Purification and characterization of an extracellular polysaccharide from haloalkalophilic Bacillus sp. I-450. Enzym. Microb. Technol. 2004, 34, 673–681. [Google Scholar] [CrossRef]
- Hamley, I.W. The Physics of Blok Copolymers; Oxford University Press: New York, NY, USA, 1998. [Google Scholar]
- Hamley, I.W.; Castelletto, V. Small-Angle Scattering of Block Copolymers in the Melt, Solution and Crystal States. Prog. Polym. Sci. 2004, 29, 909–948. [Google Scholar]
- Guinier, A. La Diffraction des Rayons X aux Très Faibles Angles: Applications à l’Etude des Phénomènes Ultra-microscopiques. Ann. Phys. 1939, 12, 161–236. [Google Scholar] [CrossRef]
- Guinier, A.; Fournet, G. Small Angle Scattering of X-rays; Wiley: New York, NY, USA, 1955. [Google Scholar]
- Glatter, O.; Kratky, O. Small Angle X-ray Scattering; Academic Press: London, UK, 1982. [Google Scholar]
Figure 1.
The effect of pH on EPS production by B. pseudomycoides U10 in LB medium.

Figure 2.
The effect of temperature on EPS production by B. pseudomycoides U10 in LB medium and the initial pH was 7.0.
Figure 2.
The effect of temperature on EPS production by B. pseudomycoides U10 in LB medium and the initial pH was 7.0.

Figure 3.
X-ray diffraction (XRD) patterns of EPS from different media. (K-1: dissolved EPS in LB medium, K-2: particulate EPS in LB medium, K-5: dissolved EPS in LB with whey, K-6: particulate EPS in LB with whey).
Figure 3.
X-ray diffraction (XRD) patterns of EPS from different media. (K-1: dissolved EPS in LB medium, K-2: particulate EPS in LB medium, K-5: dissolved EPS in LB with whey, K-6: particulate EPS in LB with whey).

Figure 4.
Thermogravimetric analysis (TGA) curves of EPS from different media (K-1: dissolved EPS in LB medium, K-2: particulate EPS in LB medium, K-5: dissolved EPS in LB with whey, K-6: particulate EPS in LB with whey).
Figure 4.
Thermogravimetric analysis (TGA) curves of EPS from different media (K-1: dissolved EPS in LB medium, K-2: particulate EPS in LB medium, K-5: dissolved EPS in LB with whey, K-6: particulate EPS in LB with whey).

Figure 5.
Small-angle X-ray scattering (SAXS) graphics pattern of EPS production by B. pseudomycoides U10 in the water solutions. (K1: dissolved EPS in LB medium; K2: particulate EPS in LB, K5: dissolved EPS in LB with whey, K6: particulate EPS in LB with whey, K7: dissolved EPS in LB with glucose, K8: particulate EPS in LB with glucose).

Figure 6.
The SAXS data are fitted (solid curves) using lamellar + prolate core shell model (K1: dissolved EPS in LB; K2: particulate EPS in LB, K5: dissolved EPS in LB with whey, K6: particulate EPS in LB with whey, K7: dissolved EPS in LB with glucose, K8: particulate EPS in LB with glucose).
Figure 6.
The SAXS data are fitted (solid curves) using lamellar + prolate core shell model (K1: dissolved EPS in LB; K2: particulate EPS in LB, K5: dissolved EPS in LB with whey, K6: particulate EPS in LB with whey, K7: dissolved EPS in LB with glucose, K8: particulate EPS in LB with glucose).

Figure 7.
(a) In the schematic illustration of the model, Rmin and Rmax are the minor and major radii; (b) a proposed prolate structural model for the EPS of B. pseudomycoides U10 with the bilayer thickness of the membrane presentation, respectively.
Figure 7.
(a) In the schematic illustration of the model, Rmin and Rmax are the minor and major radii; (b) a proposed prolate structural model for the EPS of B. pseudomycoides U10 with the bilayer thickness of the membrane presentation, respectively.

Figure 8.
Scanning electron microscopy (SEM) photomicrographs of EPSs from different media. (a) Condensed lamellar type matrix of dissolved EPS in LB (K1), (b) Rolled layers EPSs associated with bacteria connected by filaments of particulate EPS in LB (K2), (c) Condensed lamellar structure and filaments of dissolved EPS in LB with whey (K5), (d) Filamentous structure of cells in particulate EPS from LB with whey (K6), (e) Condensed lamellar structure and filaments of dissolved EPS in LB with glucose (K7) (f) Filaments of particulate EPS in LB with glucose (K8).


Table 1.
The production of extracellular polysaccharides (EPS) by Bacillus pseudomycoides U10 in different media.
Table 1.
The production of extracellular polysaccharides (EPS) by Bacillus pseudomycoides U10 in different media.
| Time (h) | Luria-Bertani (LB) | Tryptic Soy Broth (TSB) | Nutrient Broth (NB) |
|---|---|---|---|
| 24 | 37.26 | 8.41 | 19.31 |
| 36 | 46.06 | 13.7 | 34.83 |
| 48 | 66.98 | 31.64 | 45.29 |
| 60 | 92.74 | 46.61 | 78.54 |
| 72 | 62.69 | 19.09 | 32.74 |
Table 2.
Absorbance results in different pH values (OD: 600 nm).
| Hours | 6.5 | 7.0 | 7.5 | 8.0 | 9.0 |
|---|---|---|---|---|---|
| 24 | 0.30 | 0.42 | 0.36 | 0.30 | 0.20 |
| 36 | 0.50 | 0.65 | 0.58 | 0.34 | 0.39 |
| 48 | 0.65 | 0.90 | 0.69 | 0.45 | 0.45 |
| 60 | 0.62 | 0.97 | 0.81 | 0.52 | 0.59 |
| 72 | 0.73 | 1.00 | 0.92 | 0.55 | 0.72 |
| 84 | 0.83 | 1.05 | 0.96 | 0.55 | 0.85 |
| 96 | 0.86 | 1.50 | 1.00 | 1.00 | 0.86 |
Table 3.
Absorbance results in different temperatures (OD: 600 nm).
| Hours | 25 | 30 | 37 | 45 |
|---|---|---|---|---|
| 24 | 0.35 | 0.40 | 0.48 | 0.16 |
| 36 | 0.42 | 0.48 | 0.65 | 0.20 |
| 48 | 0.45 | 0.48 | 0.90 | 0.22 |
| 60 | 0.50 | 0.58 | 0.97 | 0.30 |
| 72 | 0.66 | 0.67 | 1.00 | 0.35 |
| 84 | 0.76 | 0.79 | 1.05 | 0.50 |
| 96 | 0.85 | 0.99 | 1.50 | 0.52 |
| 108 | 0.92 | 1.00 | 1.68 | 0.55 |
| 120 | 1.20 | 1.25 | 1.92 | 0.62 |
Table 4.
The amount of EPS (mg/L) in different media. The LB medium used for EPS production was supplemented with 1 g/L glucose or whey. The initial pH was 7.0 and temperature was 37 °C.
Table 4.
The amount of EPS (mg/L) in different media. The LB medium used for EPS production was supplemented with 1 g/L glucose or whey. The initial pH was 7.0 and temperature was 37 °C.
| Time (h) | Whey | Glucose | LB (No Glucose and Whey) |
|---|---|---|---|
| 24 | 116.85 | 97.15 | 37.26 |
| 36 | 101.99 | 158.80 | 46.06 |
| 48 | 152.30 | 93.93 | 66.98 |
| 60 | 199.65 | 69.95 | 92.74 |
| 72 | 316.46 | 113.73 | 62.69 |
| 84 | 115.42 | 98.28 | 62.36 |
| 96 | 51.02 | 61.15 | 91.86 |
Table 5.
Biochemical composition of purified EPS (mg/g).
| Growth Medium | EPSs | Total Carbohydrate | Total Protein | Uronic Acid |
|---|---|---|---|---|
| LB | Dissolved | 380 | 211 | 12 |
| Particulate | 206 | 256 | 9 | |
| LB with whey | Dissolved | 150 | 182 | 16 |
| Particulate | 106 | 308 | 3 | |
| LB with glucose | Dissolved | 464 | 122 | 5 |
| Particulate | 176 | 340 | 5 |
Table 6.
EPS of B. pseudomycoides U10 in aqueous solution were characterized by the structural information given for data fitting.
Table 6.
EPS of B. pseudomycoides U10 in aqueous solution were characterized by the structural information given for data fitting.
| K1 | K2 | K5 | K6 | K7 | K8 | |
|---|---|---|---|---|---|---|
| Bilayer Thick (delta) (Å) | 14.07 | 14.07 | 12.04 | 12.74 | 12.02 | 12.54 |
| major core (Å) | 1001.52 | 905.85 | 845.75 | 851.85 | 845.65 | 849.85 |
| minor core (Å) | 301.89 | 230.42 | 196.22 | 199.42 | 196.10 | 199.52 |
| major shell (Å) | 1201.46 | 1100.34 | 998.94 | 1001.34 | 998.04 | 1001.94 |
| minor shell (Å) | 405.11 | 301.32 | 242.90 | 249.30 | 242.90 | 249.00 |
| SLD core (Å−2) | 1.65 × 10⁻⁶ | 1.15 × 10⁻⁶ | 1.21 × 10⁻⁶ | 1.11 × 10⁻⁶ | 1.21 × 10⁻⁶ | 1.11 × 10⁻⁶ |
| SLD shell (Å−2) | 1.44 × 10⁻⁶ | 1.204 × 10⁻⁶ | 1.10 × 10⁻⁶ | 1.15 × 10⁻⁶ | 1.10 × 10⁻⁶ | 1.11 × 10⁻⁶ |
| SLD solvent (Å−2) | 9.56 × 10⁻⁶ | 9.44 × 10⁻⁶ | 9.41 × 10⁻⁶ | 9.43 × 10⁻⁶ | 9.42 × 10⁻⁶ | 9.44 × 10⁻⁶ |
© 2018 by the authors. Licensee MDPI, Basel, Switzerland. This article is an open access article distributed under the terms and conditions of the Creative Commons Attribution (CC BY) license (http://creativecommons.org/licenses/by/4.0/).
Share and Cite
MDPI and ACS Style
Solmaz, K.B.; Ozcan, Y.; Mercan Dogan, N.; Bozkaya, O.; Ide, S. Characterization and Production of Extracellular Polysaccharides (EPS) by Bacillus Pseudomycoides U10. Environments 2018, 5, 63. https://doi.org/10.3390/environments5060063
AMA Style
Solmaz KB, Ozcan Y, Mercan Dogan N, Bozkaya O, Ide S. Characterization and Production of Extracellular Polysaccharides (EPS) by Bacillus Pseudomycoides U10. Environments. 2018; 5(6):63. https://doi.org/10.3390/environments5060063
Chicago/Turabian StyleSolmaz, Kubra Betul, Yusuf Ozcan, Nazime Mercan Dogan, Omer Bozkaya, and Semra Ide. 2018. "Characterization and Production of Extracellular Polysaccharides (EPS) by Bacillus Pseudomycoides U10" Environments 5, no. 6: 63. https://doi.org/10.3390/environments5060063
Note that from the first issue of 2016, this journal uses article numbers instead of page numbers. See further details here.