Estimation of Energy Savings Potential in Higher Education Buildings Supported by Energy Performance Benchmarking: A Case Study


1
INESC Coimbra, DEEC, Polo II, University of Coimbra, 3030-290 Coimbra, Portugal
2
School of Technology and Management, Campus 2, Polytechnic Institute of Leiria, 2411-901 Leiria, Portugal
*
Author to whom correspondence should be addressed.
Environments 2018, 5(8), 85; https://doi.org/10.3390/environments5080085
Submission received: 6 June 2018
/
Revised: 19 July 2018
/
Accepted: 19 July 2018
/
Published: 24 July 2018
(This article belongs to the Special Issue Smart Energy Management for a Sustainable Built Environment)
Abstract
:This paper presents results of work developed in the field of building energy benchmarking applied to the building stock of the Polytechnic Institute of Leiria, Portugal, based on a thorough energy performance characterisation of each of its buildings. To address the benchmarking of the case study buildings, an energy efficiency ranking system was applied. Following an energy audit of each building, they were grouped in different typologies according to the main end-use activities developed: Pedagogic buildings, canteens, residential buildings and office buildings. Then, an energy usage indicator was used to establish a metric to rank the buildings of each typology according to their energy efficiency. The energy savings potential was also estimated, based on the reference building energy usage indicator for each typology, and considering two different scenarios, yielding potential savings between 10% and 34% in final energy consumption.
1. Introduction
Buildings are very heterogeneous in terms of energy consumption and end-uses, meaning that some are highly efficient buildings, while others have considerable potential for improvement.
The building sector in the European Union (EU-28) is responsible for about 39% of the region’s total final energy consumption (approximately 46 million TJ in 2012) [1]. Therefore, addressing the energy issues of buildings is a significant way to reduce dependency on energy imports and meet the EU 2020 targets [2]. According to the report published by Buildings Performance Institute Europe (BPIE), in 2011, educational buildings in Europe have the third highest building stock (17%), accounting for 12% of the total energy consumed by the building sector [3]. Higher education institutions usually have a considerable number of buildings, with high overall energy consumption and associated financial costs. An effective energy management methodology is mandatory if actions toward energy efficiency improvement are to be implemented. This can be achieved by using management techniques, such as monitoring and targeting consumption, to control energy and cost [4].
There are some existing studies using energy auditing techniques to assess the energy performance of school buildings. An energy audit and indoor climate assessment was performed in a secondary school in Portugal, aiming at identifying energy conservation measures to improve the energy performance associated with ensuring environmental quality. In this work, several energy conservation opportunities were identified across information and communication technologies (ICT) equipment, lighting, and heating, ventilation and air conditioning (HVAC) systems, and some recommendations on management and behavioural matters were issued [5]. Also in Portugal, an energy efficiency plan was drawn for a higher education building leading to yearly savings of 26,123 kWh [6]. In the United Kingdom, a study to investigate the relationship between daily electric load profiles and user occupancy patterns in an academic building was carried out, with the aim of optimizing the existing control strategies to improve energy performance [7]. In 2016, a study aiming at estimating the energy savings in higher education institutions using an energy consumption behaviour model was published, estimating potential daily energy savings of 55 kWh [8].
More recently, an energy audit protocol was developed to tackle both the issues of thermal comfort and energy efficiency for higher education buildings in France [9], observing that capturing the full complexity of a building system requires a broad perspective and goes beyond the limits of a “traditional” energy audit.
Through the requirements for Operational Rating Certificates and Display Energy Certificates, the Energy Performance of Buildings Directive (EPBD) in 2002 (updated in 2010) was an important promoter of building energy benchmarking. However, within building management, benchmarks were used to compare the energy efficiency of buildings and to influence the energy policy long before the EPBD [10].
Although performance indicators for buildings are generally rated in terms of net floor area, building volume and the amount of trade are sometimes used as normalising factors. In this context, indicators which are adjusted according to weather conditions and/or occupancy are often called normalised performance indicators [11]. This normalisation is intended to improve comparison between buildings in different climatic regions or with different occupancy patterns. However, this approach should be used carefully, as it can often distort the data and mask energy consumption patterns [12].
One of the objectives of the benchmarking process is to set targets that will stimulate management and staff to make improvements [13]. These targets must be realistic and achievable, considering the likely savings from improvements in factors such as occupants’ behaviour, preventive maintenance and other efficiency measures.
Concerning benchmarking studies on higher education buildings, in 2014, 11 university buildings were selected for analysis of their current energy consumption patterns in South Korea. An energy savings potential of 6–30% was identified [14]. In 2018, a study comparing three campus buildings of the same typology (teaching and research activity) was made in France using statistical analysis tools, aiming to identify the main energy drivers and their relative weight in the overall energy consumption [15]. Also in 2018, a study aimed at comparing 80 university buildings with different typologies was performed using stochastic frontier analysis (SFA) to establish an energy benchmarking system. In this study, the buildings used mostly for research had the highest indicator value at 216 kWh/m2/year, whereas buildings for academic offices had the lowest indicator value at 137 kWh/m2/year [16].
There are also various relevant environmental assessment schemes for buildings of a qualitative nature, including: Building Research Establishment Environmental Assessment Method (BREEAM) in the United Kingdom; Comprehensive Assessment System for Built Environment Efficiency (CASBEE) in Japan; Green Building Assessment Tool (GBTool) in Canada; Leadership in Energy and Environmental Design (LEED) in the United States; and, the National Australian Built Environment Rating System (NABERS) in Australia [17]. Some of these certification schemes have since been adapted for use in other countries. Nevertheless, these schemes were developed for wider environmental assessment, also including energy and the need to be operated by experts.
The present paper aims to describe an approach for assessing the energy performance of a portfolio of buildings to provide building managers with a simplified tool for estimating an order of the magnitude of the potential energy savings. The approach followed has the advantage of being easier to be applied and understood by building owners and managers without significant mathematical and statistical modelling complexity.
2. Materials and Methods
The work presented in this paper relies on data obtained during energy audits to the complete set of buildings of a higher education institution, over several campuses. It came as an opportunity to use data from a coherent set of buildings as an input to a benchmarking process. The energy audits were not specifically driven to obtain data for scientific research and took place in a limited time frame. Some limitations on the availability of some specific data on the buildings are mentioned and discussed throughout the paper.
After thorough energy audits of all buildings, there was an attempt to group buildings adequately into different typologies, according to the main end-use activity engaged in there, which resulted in buildings being divided into pedagogic buildings, canteens, residence buildings and office buildings.
As a first approach, the specific energy consumption per net floor area was used as the reference energy usage indicator (EUI). The EUI was computed using the data collected during the energy audits of each building. The EUI is expressed through the amount of end-use energy supplied to the buildings per unit of floor area during a period of one year [kWh/m2]. Since the scope of this study is the estimated savings potential on the demand side, the total final energy supplied to each building was considered.
Energy benchmarking methods usually assign buildings to categories of performance with respect to other buildings of the same type. When the measured values present an adequate statistical distribution, the categorisation process can be done by quartiles, and so approximately 50% of the sample was categorised as “Average”, with the respective range limits set to the 25th and 75th percentiles. The specific consumption values in the first quartile were categorised as “Above-average” and those in the fourth quartile were categorised as “Below-average”.
According to [18], energy services companies use EUI as a starting point in energy audits and assess saving scenarios by comparison with existing references (benchmarks) of average (typical), above average (good) and excellent (best) practice.
Based on the previous approach, and selecting a reference building to compare with the others, the energy savings potential (ES) in building i of typology x was determined according to Equation (1):
To compute the energy savings for the set of buildings of each typology, two different scenarios for choosing the reference energy usage indicator (EUIref) were considered. In scenario 1, a conservative scenario, EUIref was the value of the median, which corresponds to a building categorised with “Average” energy performance, according to the ranking previously presented. In scenario 2, a more optimistic scenario, EUIref was the value of 25th percentile, corresponding to the lower range limit of buildings categorised with “Above-average” energy performance.
3. Data Collecting and Analysis
The buildings analysed under the present case study have different locations in the central region of Portugal. The main locations are the cities of Leiria, Caldas da Raínha and Peniche, and despite some differences, climate is mild in all sites and distances are relatively small (an official Portuguese climate region classification places all building locations in the same climate severity zone for both summer and winter).
Higher education buildings have specific characteristics that make the task of performing an energy audit different from that performed in other types of buildings. These include buildings dedicated to lecturing, offices, canteens, laboratories and other research facilities, libraries and others. These buildings are usually grouped into campuses, and sometimes share the energy supply infrastructure. Since in most cases the buildings/systems are not equipped with partial energy meters, the task of determining individual consumption is a true challenge. The data used in this paper were obtained from utility bills and monitoring using portable data-logging power analysers, thus allowing a reasonable level of disaggregation. The net floor area was determined from the final blueprints or, where available, measured on site. The heating-degree days (HDD) were computed for each building location considering the altitude above sea level, on an 18 °C basis, in accordance with the Portuguese legislation published in 2013 to define the severity of the climatic zones of the country [19].
Table 1 presents the main characteristics of the 23 buildings included in this study. Two other buildings (a research facility and a library) were excluded since it would be of little merit to have a typology with a single building.
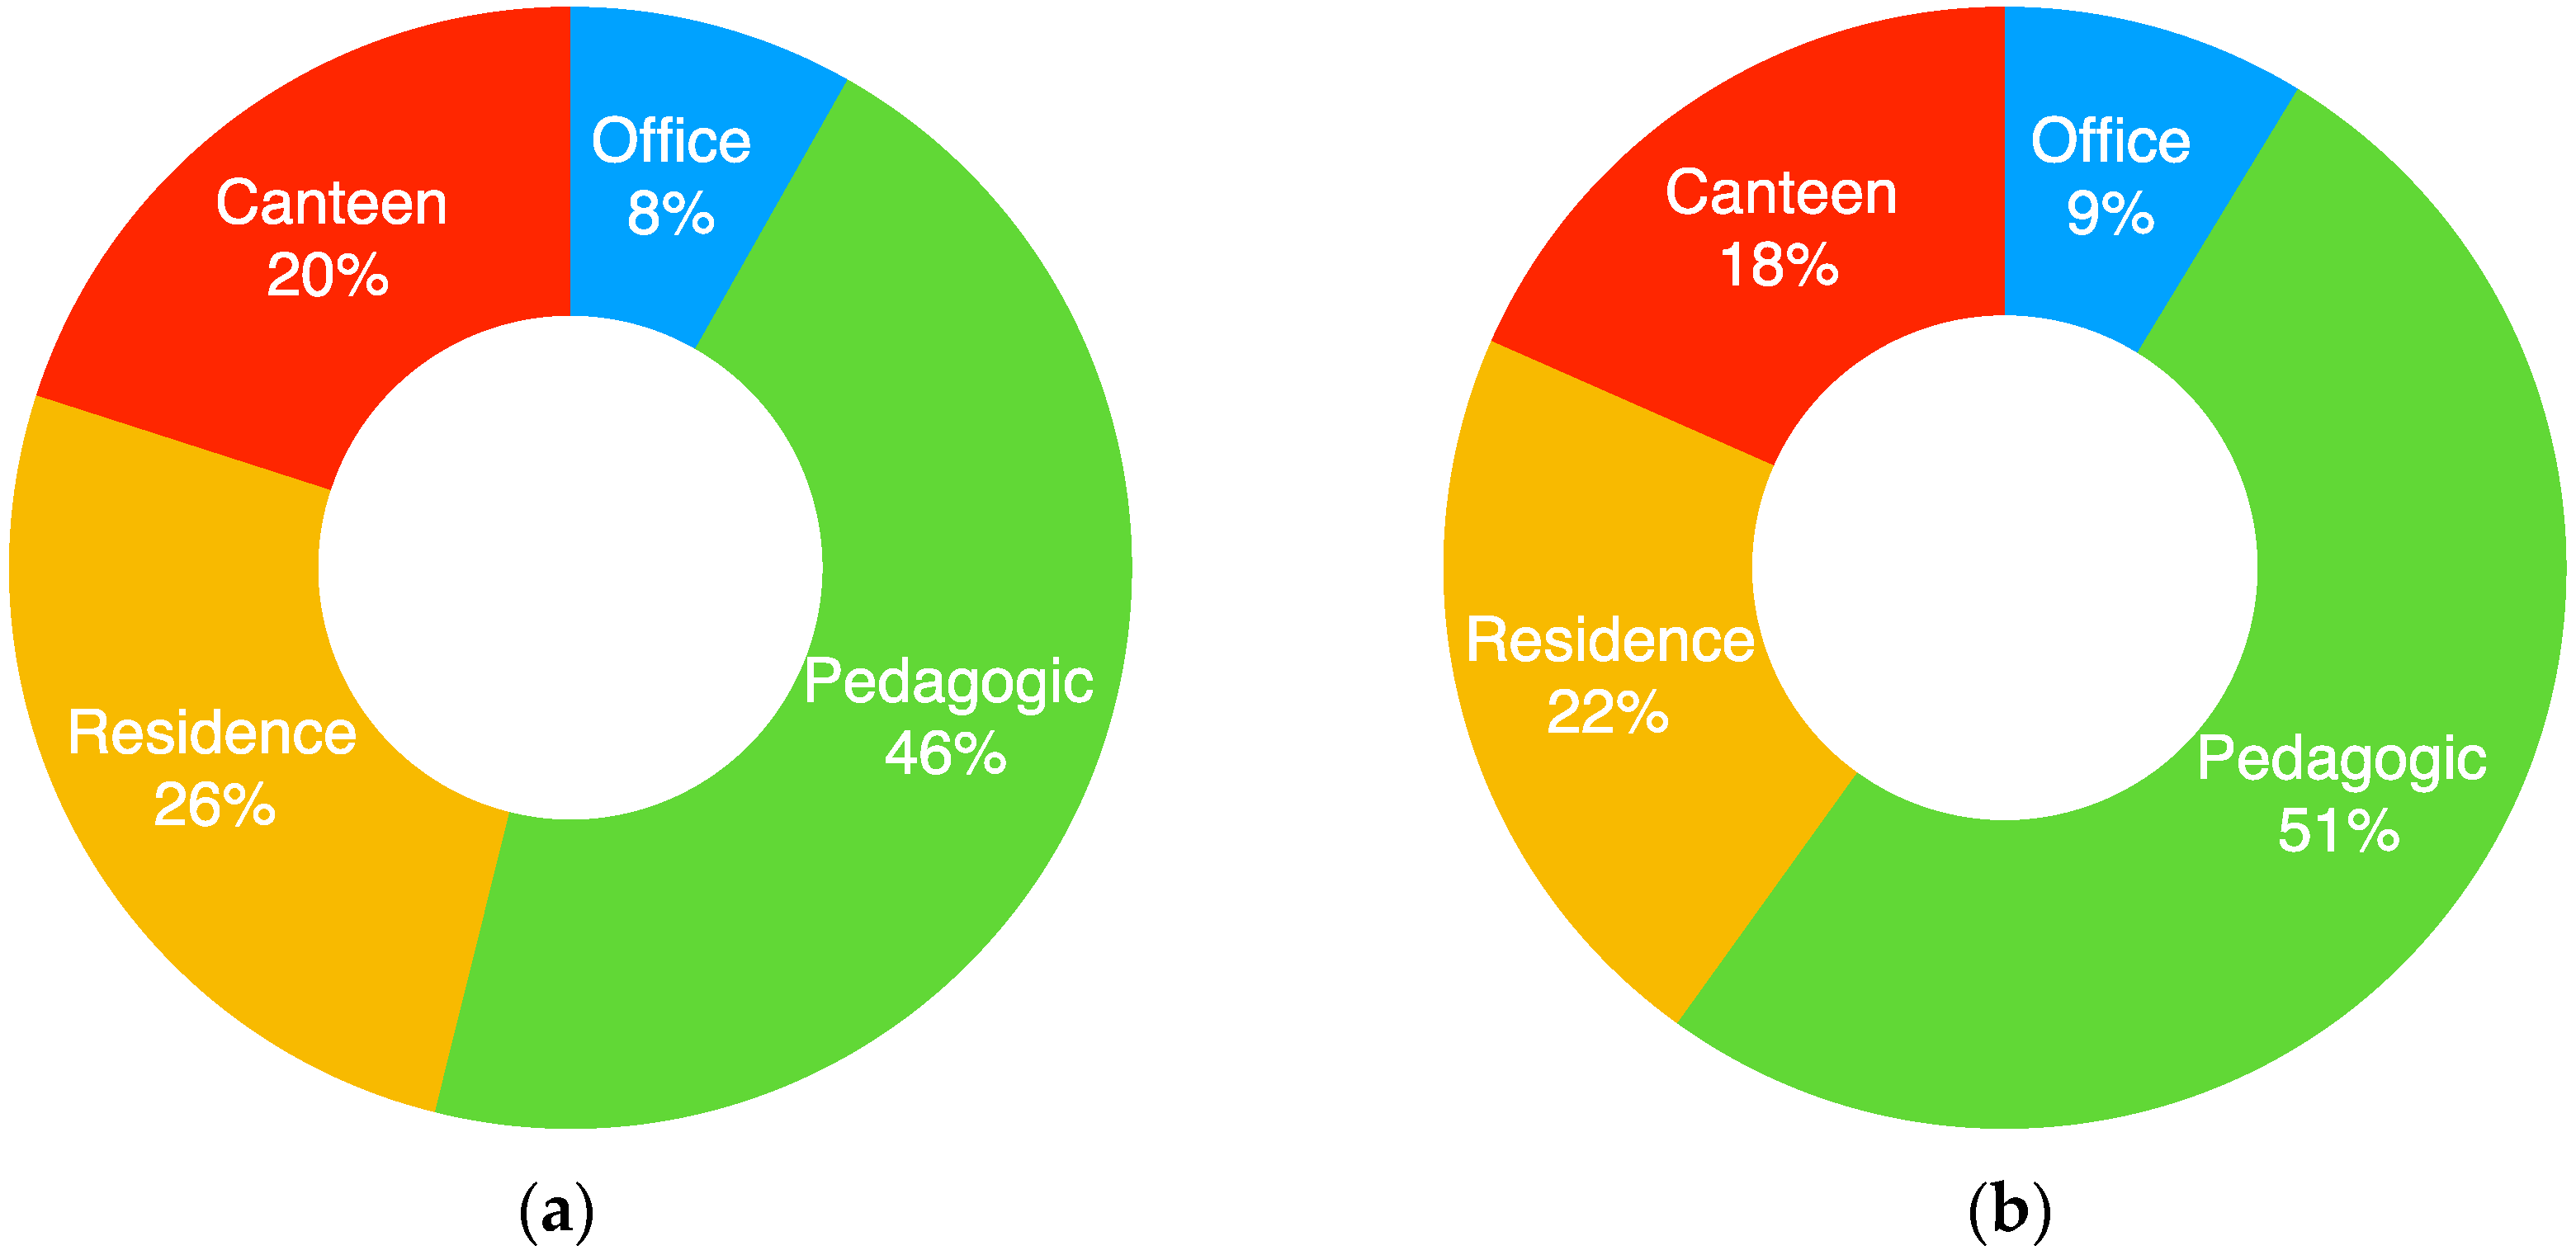
Figure 1 depicts the yearly breakdown of energy consumption and of greenhouse gases (GHG) emissions by typology of building for the building stock under analysis.
Figure 2 shows the relationship between total energy consumption and the net floor area for each typology of building analysed, each mark representing one building.
The plot in Figure 2 demonstrates that pedagogic buildings have more variable values of energy consumption and net floor area, while there seems to be some correlation between energy consumption and net floor area in the other typologies.
3.1. Canteen Buildings
Buildings exclusively dedicated to preparing and serving meals were grouped under this typology. In the Polytechnic Institute of Leiria there are four canteen buildings, which are responsible for 20% of the total energy consumption. Table 2 presents the main construction characteristics of these buildings.
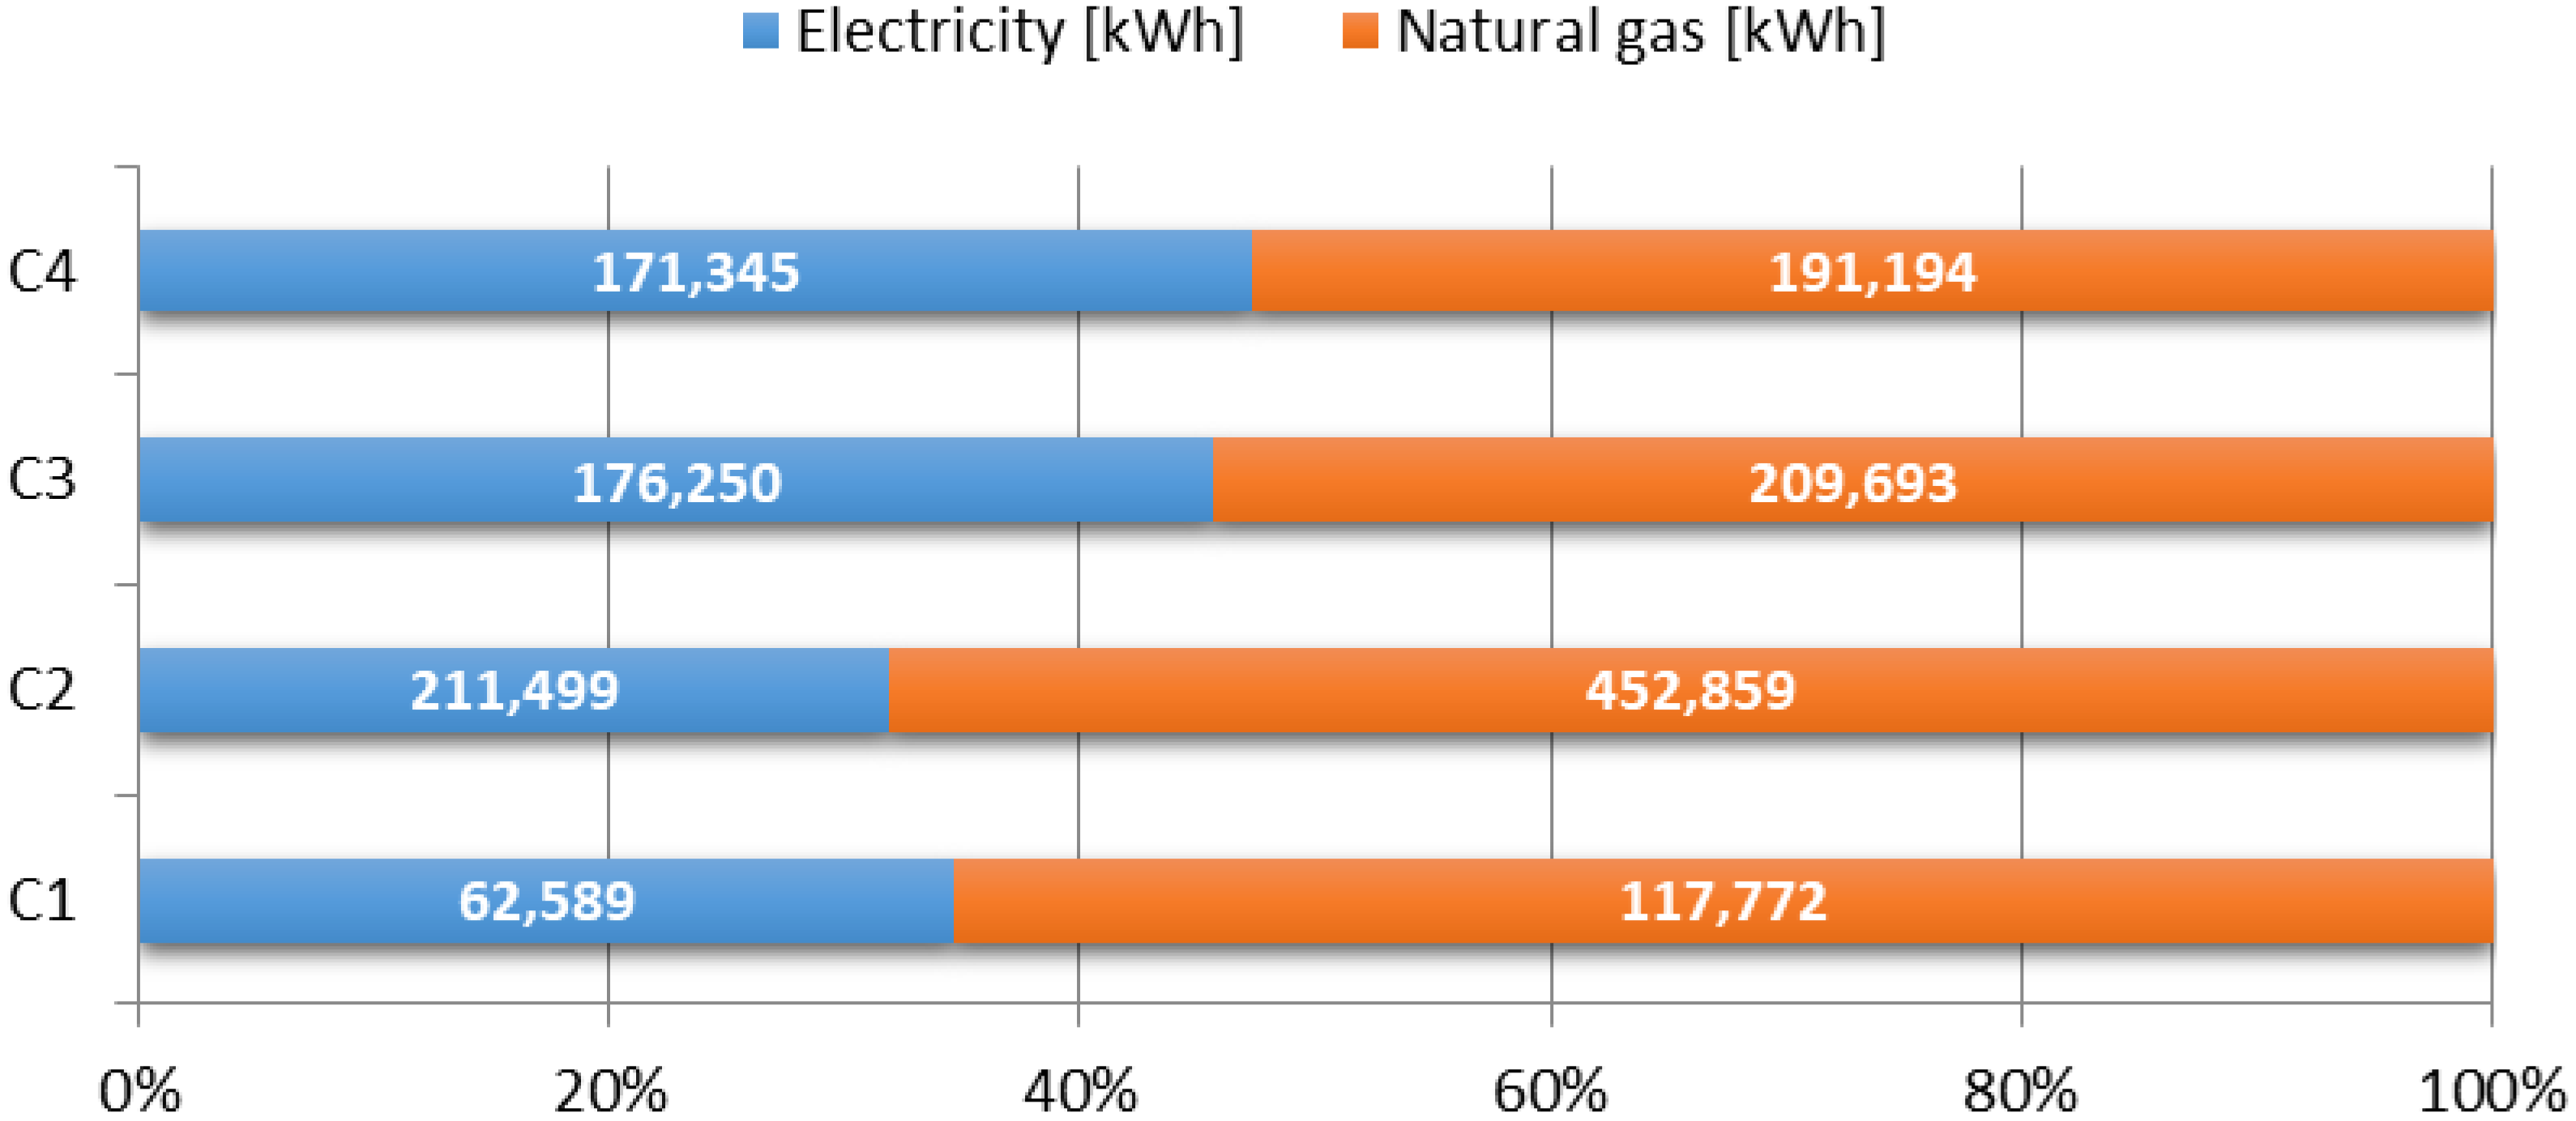
These canteens are fuelled by both electricity and natural gas, and all of them have a centralised system for the preparation of domestic hot water using a thermal solar system supported by a natural gas boiler. Figure 3 shows the fuel breakdown, for each building of this typology, in terms of electricity and natural gas.
It is clear that natural gas is the main resource used for energy in canteens, representing around 60% of the energy consumed. Also, the proportion between electricity and natural gas does not vary much from building to building, despite considerable differences in the age of each canteen.
Regarding HVAC, these buildings are provided with heating systems fuelled by natural gas, with the exception of C1, which only has an individual air conditioning device in the staff dining room. Heat distribution is performed by wall radiators (in C2) and by heat exchangers in the air handling units, ensuring indoor air exchange.
For lighting, in this typology of building there is a widespread use of luminaries equipped with tubular fluorescent lamps (T5 and T8 lamps), and modular and compact fluorescent lamps (CFL). The type of lamp selected for each place differs according to the use in question, with T5 and T8 lamps installed in working places and CFL mostly found in corridors and toilets.
3.2. Office Buildings
This typology groups all the buildings with a predominantly administrative function, meaning that the type of activity exerted there has a standard, predetermined schedule, with public opening hours and a number of computers and pieces of office electronic equipment. Table 3 presents the main construction characteristics of these buildings.
These buildings are usually also provided with centralized or individual HVAC systems capable of producing either heat or cold.
The HVAC systems installed in these buildings are capable of heating or cooling, according to the buildings’ needs. The solutions found in the various buildings are fairly diverse, with some spaces being equipped with individual air conditioning units of the split, multi-split and modular variable refrigerant volume (VRV) types. Other spaces and buildings are served by centralised heating systems, with heat provided by burning natural gas or by heat pumps, and centralised cooling provided by means of chillers. Thermal energy distribution depends mostly on the respective source; when heating is provided by natural gas boilers, the heated water is supplied to wall radiators and, in the remaining cases, fan coil (ceiling and/or wall) units distribute the heat. Air exchange in spaces is, as a rule, provided by air handling units that may include, in some cases, heating and/or cooling coils.
For lighting, in this typology of building there is a widespread use of luminaries equipped with fluorescent lamps (tubular T5 and T8) and CFL. T5 and T8 lamps are usually installed in working places, while CFL are mostly found in corridors and toilets. There are also some incandescent lamps in specific spaces, namely in the auditorium in building B, campus 2, where there are several halogen projectors installed to light the stage.
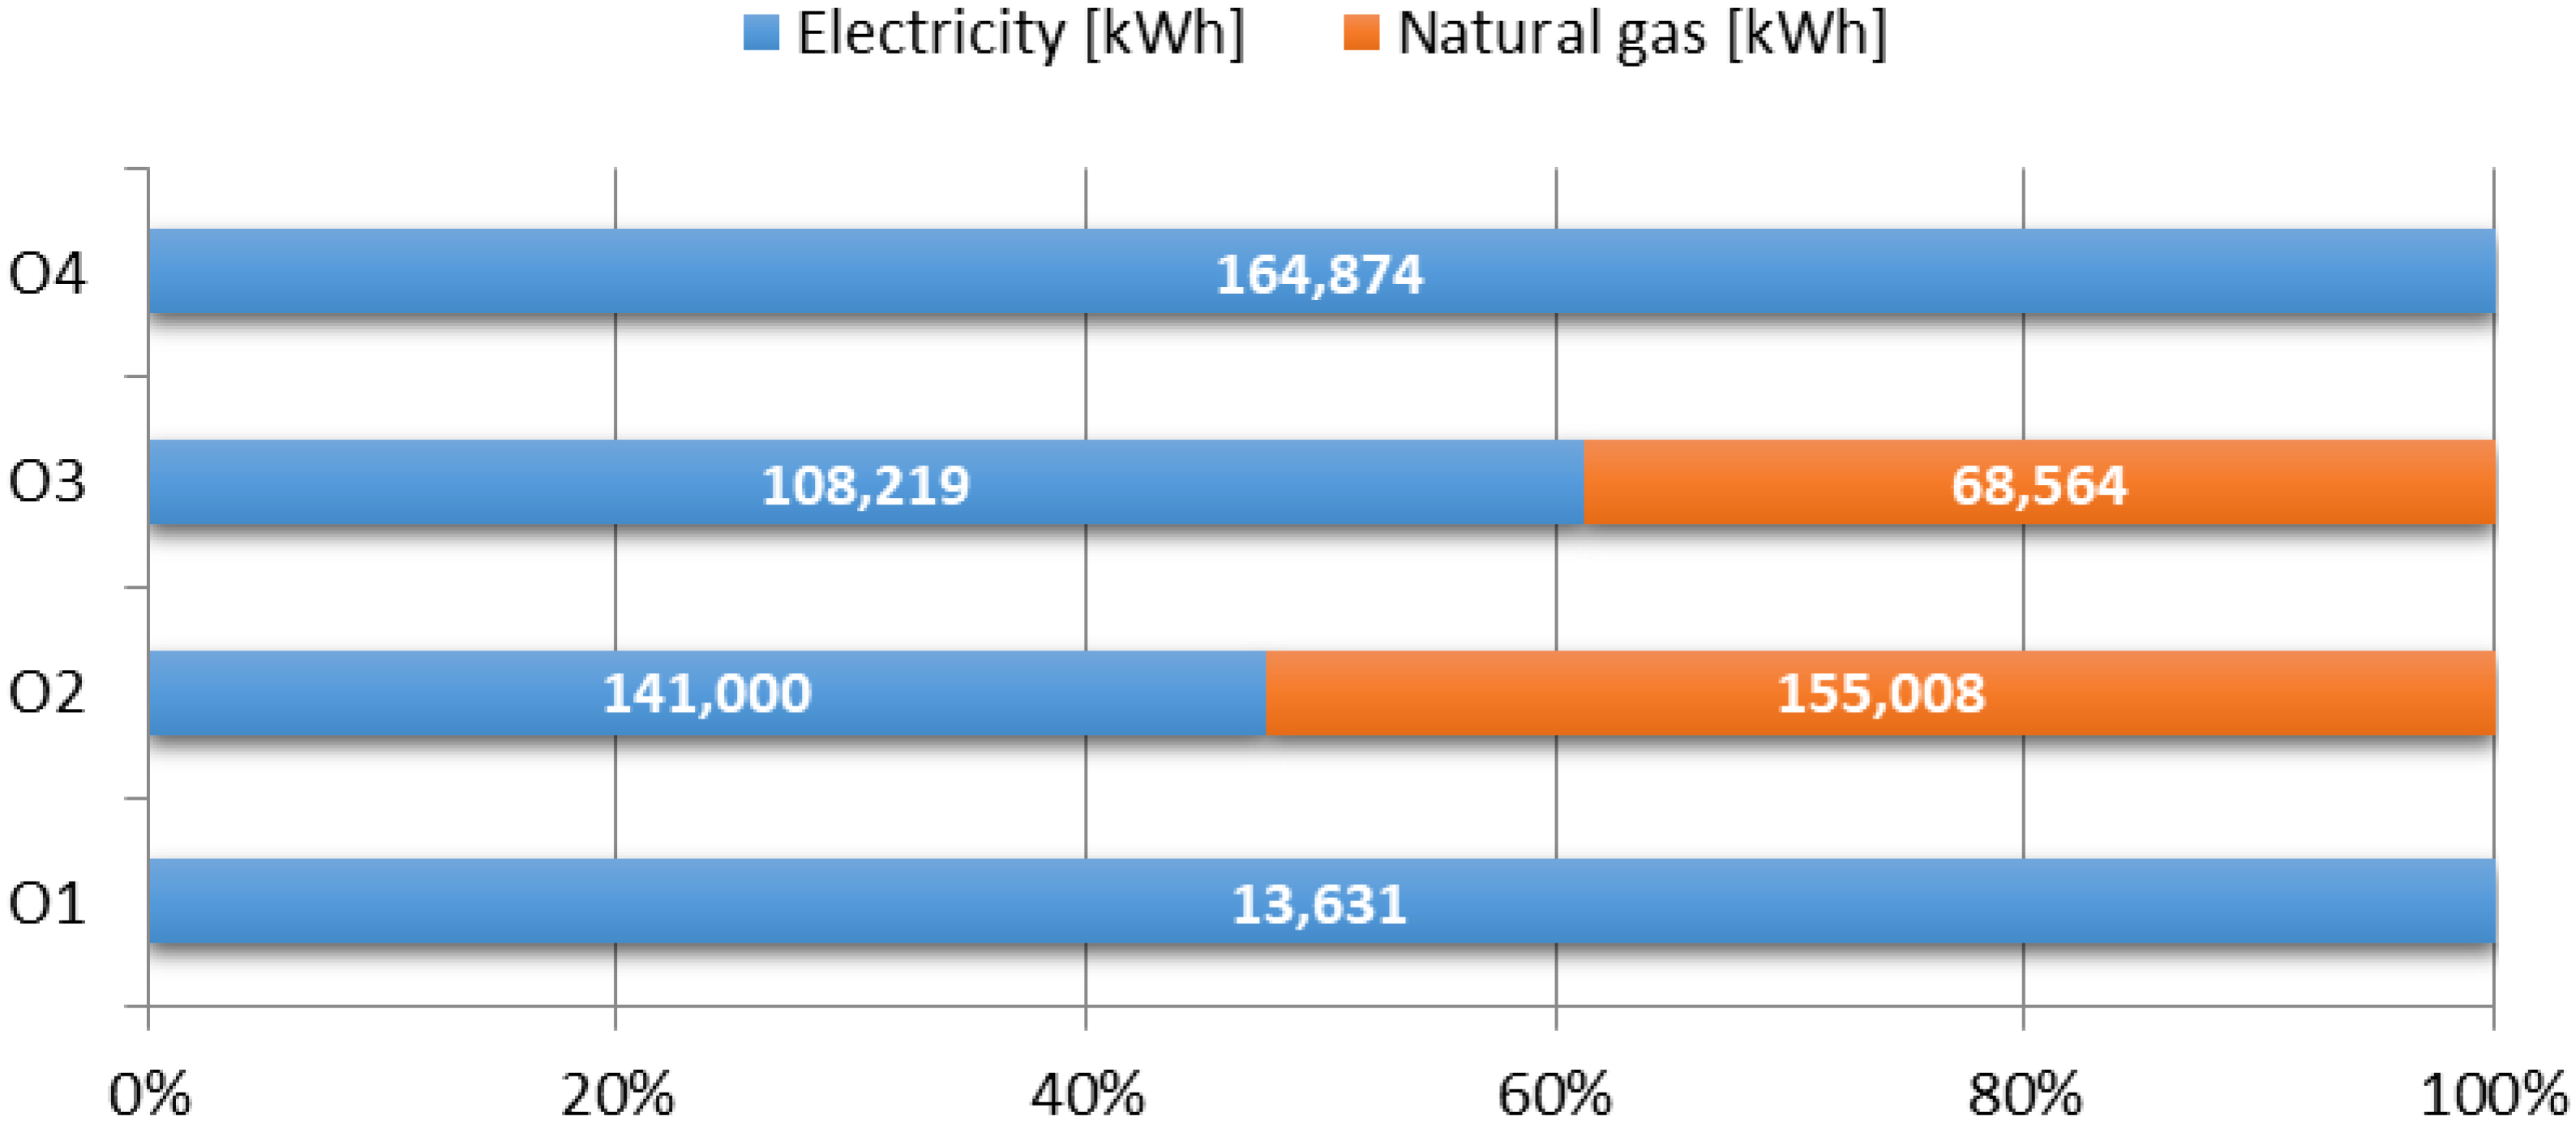
Concerning information technology equipment, only existing desktop computers were considered, since all the remaining equipment is diverse both in function and technical characteristics, namely power consumed. Consequently, only the number of computers was determined, separated into computers with TFT/LCD type monitors and those with CRT type monitors. Figure 4 presents the disaggregation of energy consumption per energy source.
3.3. Pedagogic Buildings
All the buildings which are mainly used for educational purposes were grouped under this typology. These buildings provide classrooms and other spaces where the courses provided by the Polytechnic Institute of Leiria have their lectures and work. This implies a considerable diversity of spaces, consisting of classrooms, specific labs, computer rooms, quick meals areas, lecturers’ offices, toilets and other technical areas necessary for the building to be operated. Table 4 presents the main construction characteristics of these buildings.
Most of these buildings are provided with both heating and cooling, although in some cases cooling is not provided. The technical solutions used to the implement heating and cooling are diverse; some spaces are equipped with individual split, multi-split or VRV modular systems, while other spaces have centralised heat production, either with natural gas boilers or heat pumps Centralised cold production can be found in some buildings, by means of chillers or heat pumps. Thermal energy distribution varies according to its source; heat coming from natural gas boilers is distributed using wall radiators and, in the remaining cases, wall or ceiling fan coil units distribute the heat. In building P7 there is no equipment designed for heating or cooling.
Regarding lighting, this typology of building has a widespread use of luminaries equipped with fluorescent lamps (tubular T5 and T8 lamps) and CFL. T5 and T8 lamps are mostly installed in classrooms, laboratories, offices, and corridors, while CFL are mostly found in corridors and partially in amphitheatres. There is also a small number of incandescent lamps.
Similar to the approach used for other typologies, for information technology equipment only existing desktop computers were considered. Most terminals are equipped with TFT/LCD monitors, with the exception of some computers in building P3 which are still equipped with CRT monitors. Figure 5 presents the disaggregation of energy consumption per energy source.
3.4. Residence Buildings
This typology groups the buildings mainly dedicated to housing students. Due to the services these buildings are dedicated to, they do not have a defined working schedule. Table 5 presents the main construction characteristics of these buildings.
All the buildings have a centralised domestic hot water system consisting of thermal solar panels complemented by a natural gas boiler. These buildings also have centralised heating fuelled by natural gas, with the heat distributed to the compartments by means of wall radiators.
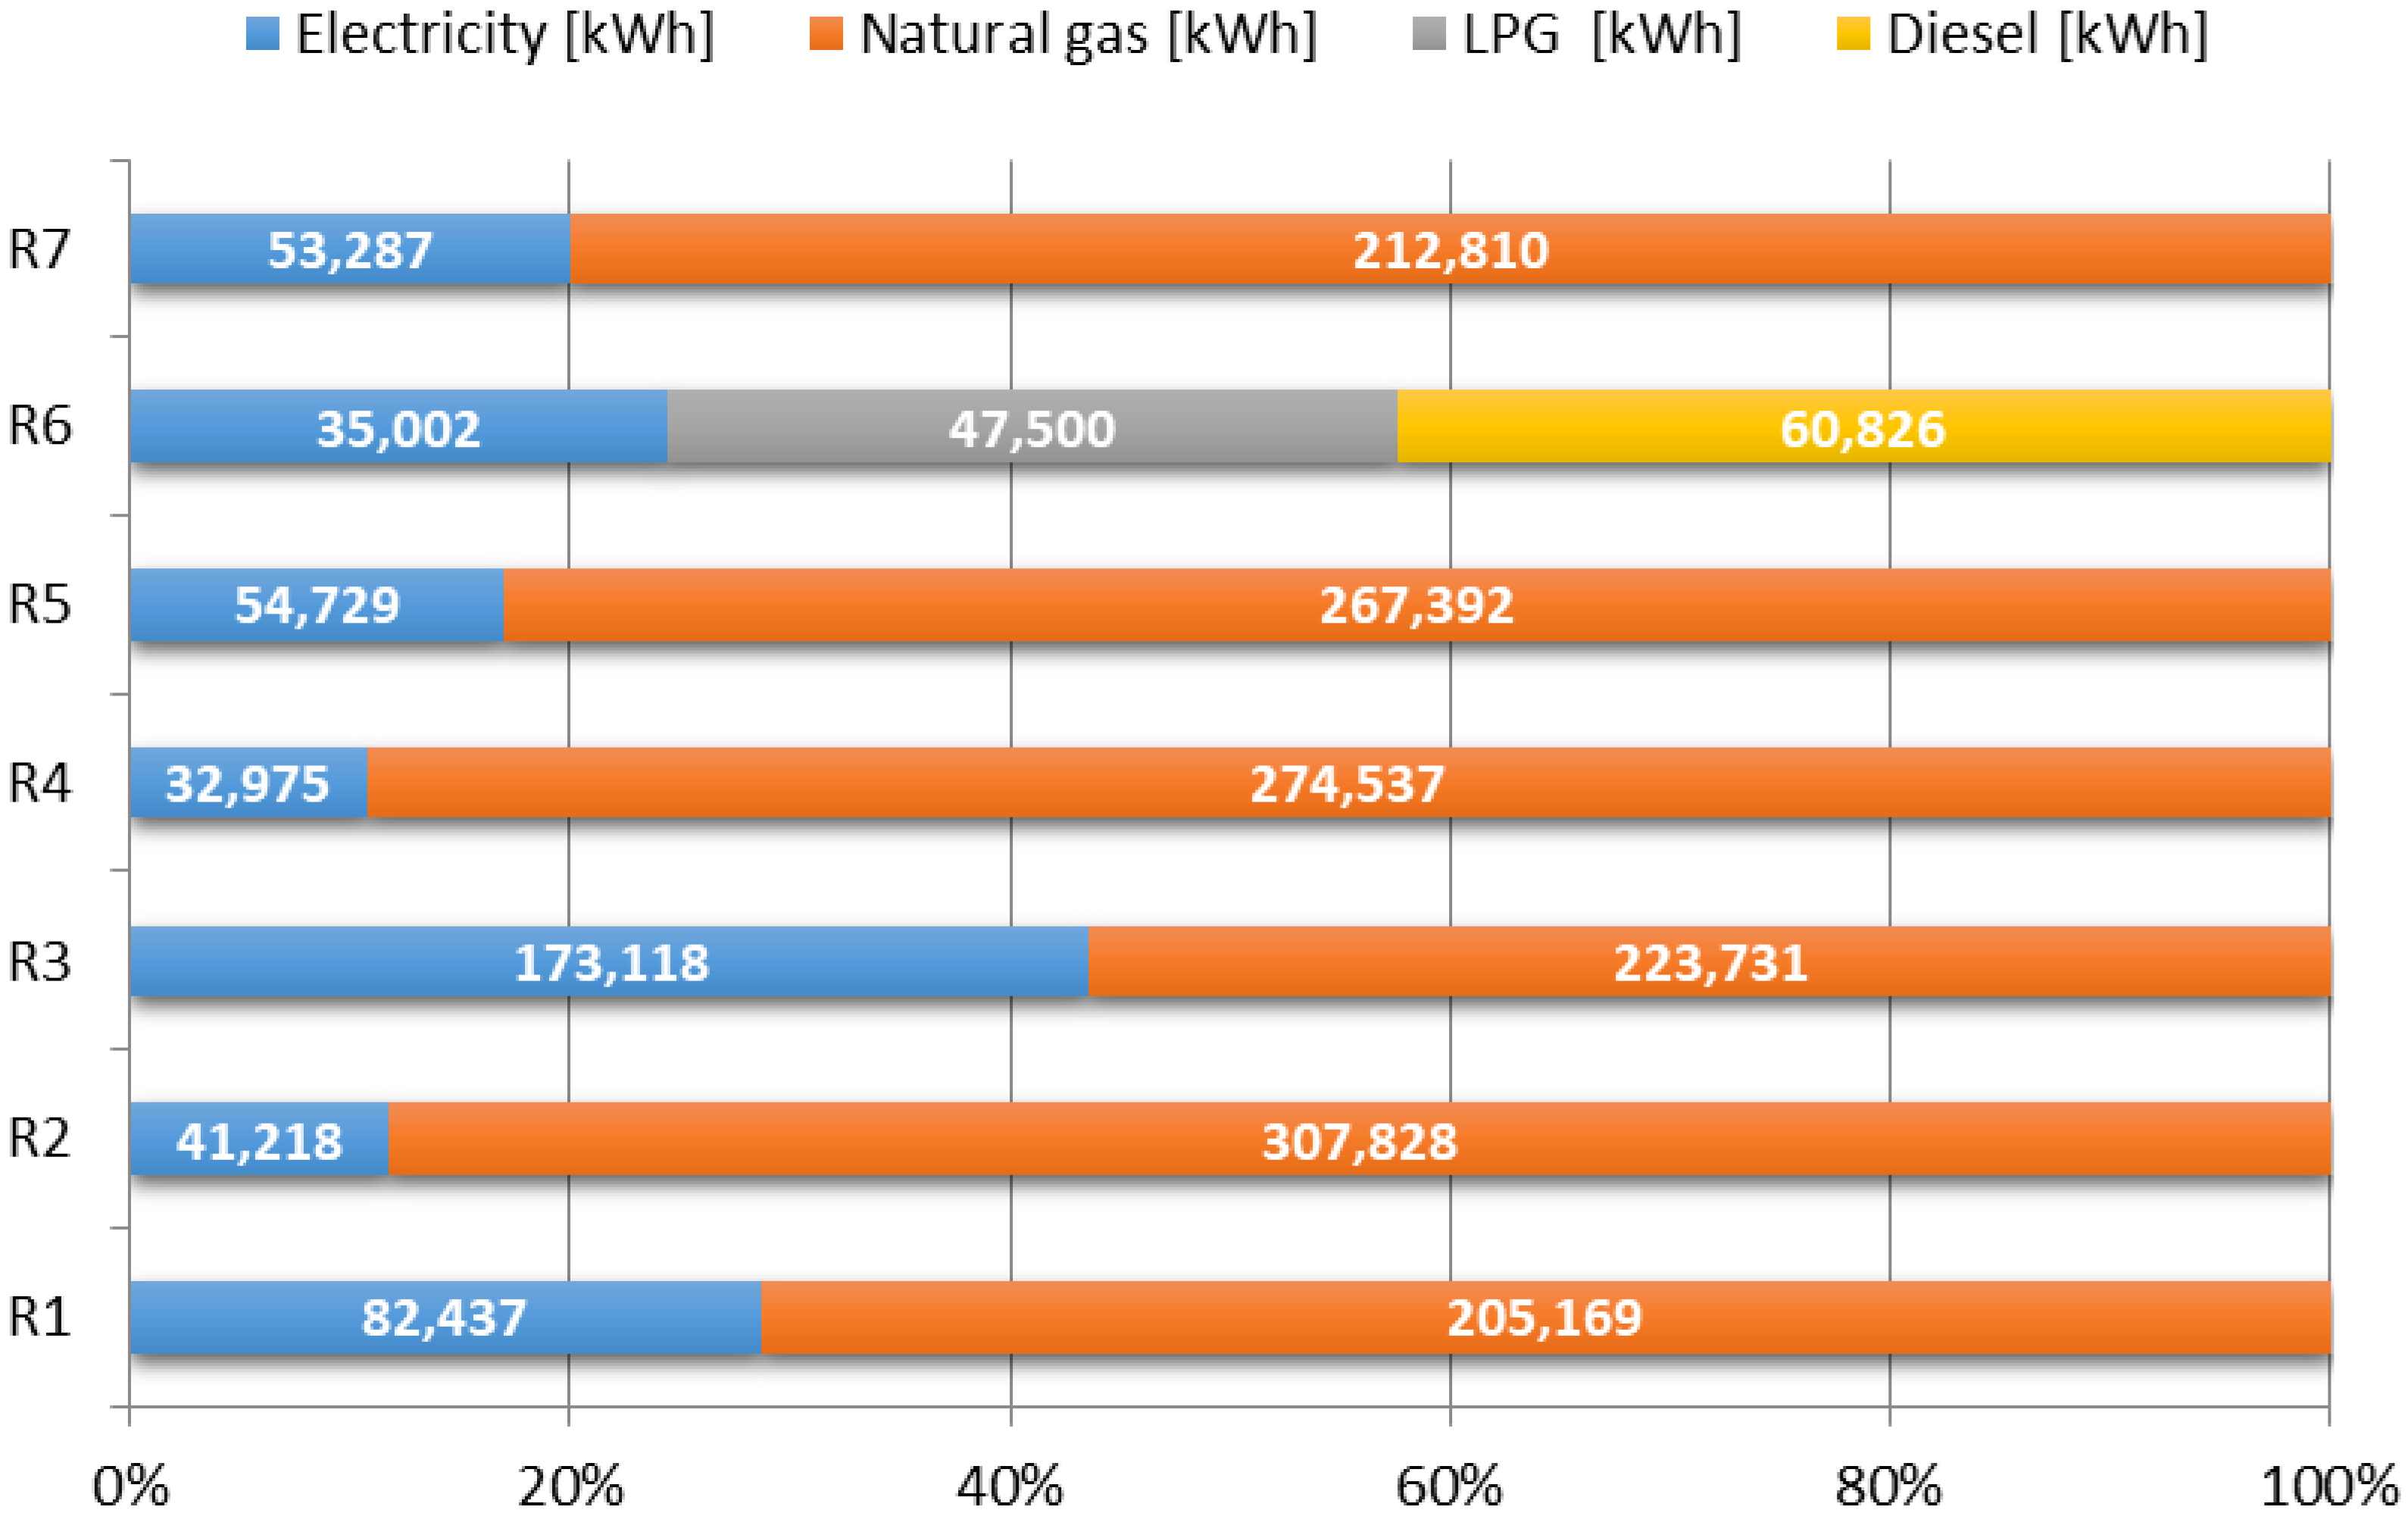
Concerning lighting, this typology of building has a widespread use of luminaries equipped with fluorescent lamps (tubular T5 and T8 lamps), and modular and CFL. There is also a small number of incandescent lamps. In this typology, there is no significant presence of desktop computers, although there is a wireless computer network to which the laptops of guests can be connected. Figure 6 presents the disaggregation of energy consumption per energy source.
4. Results and Discussion
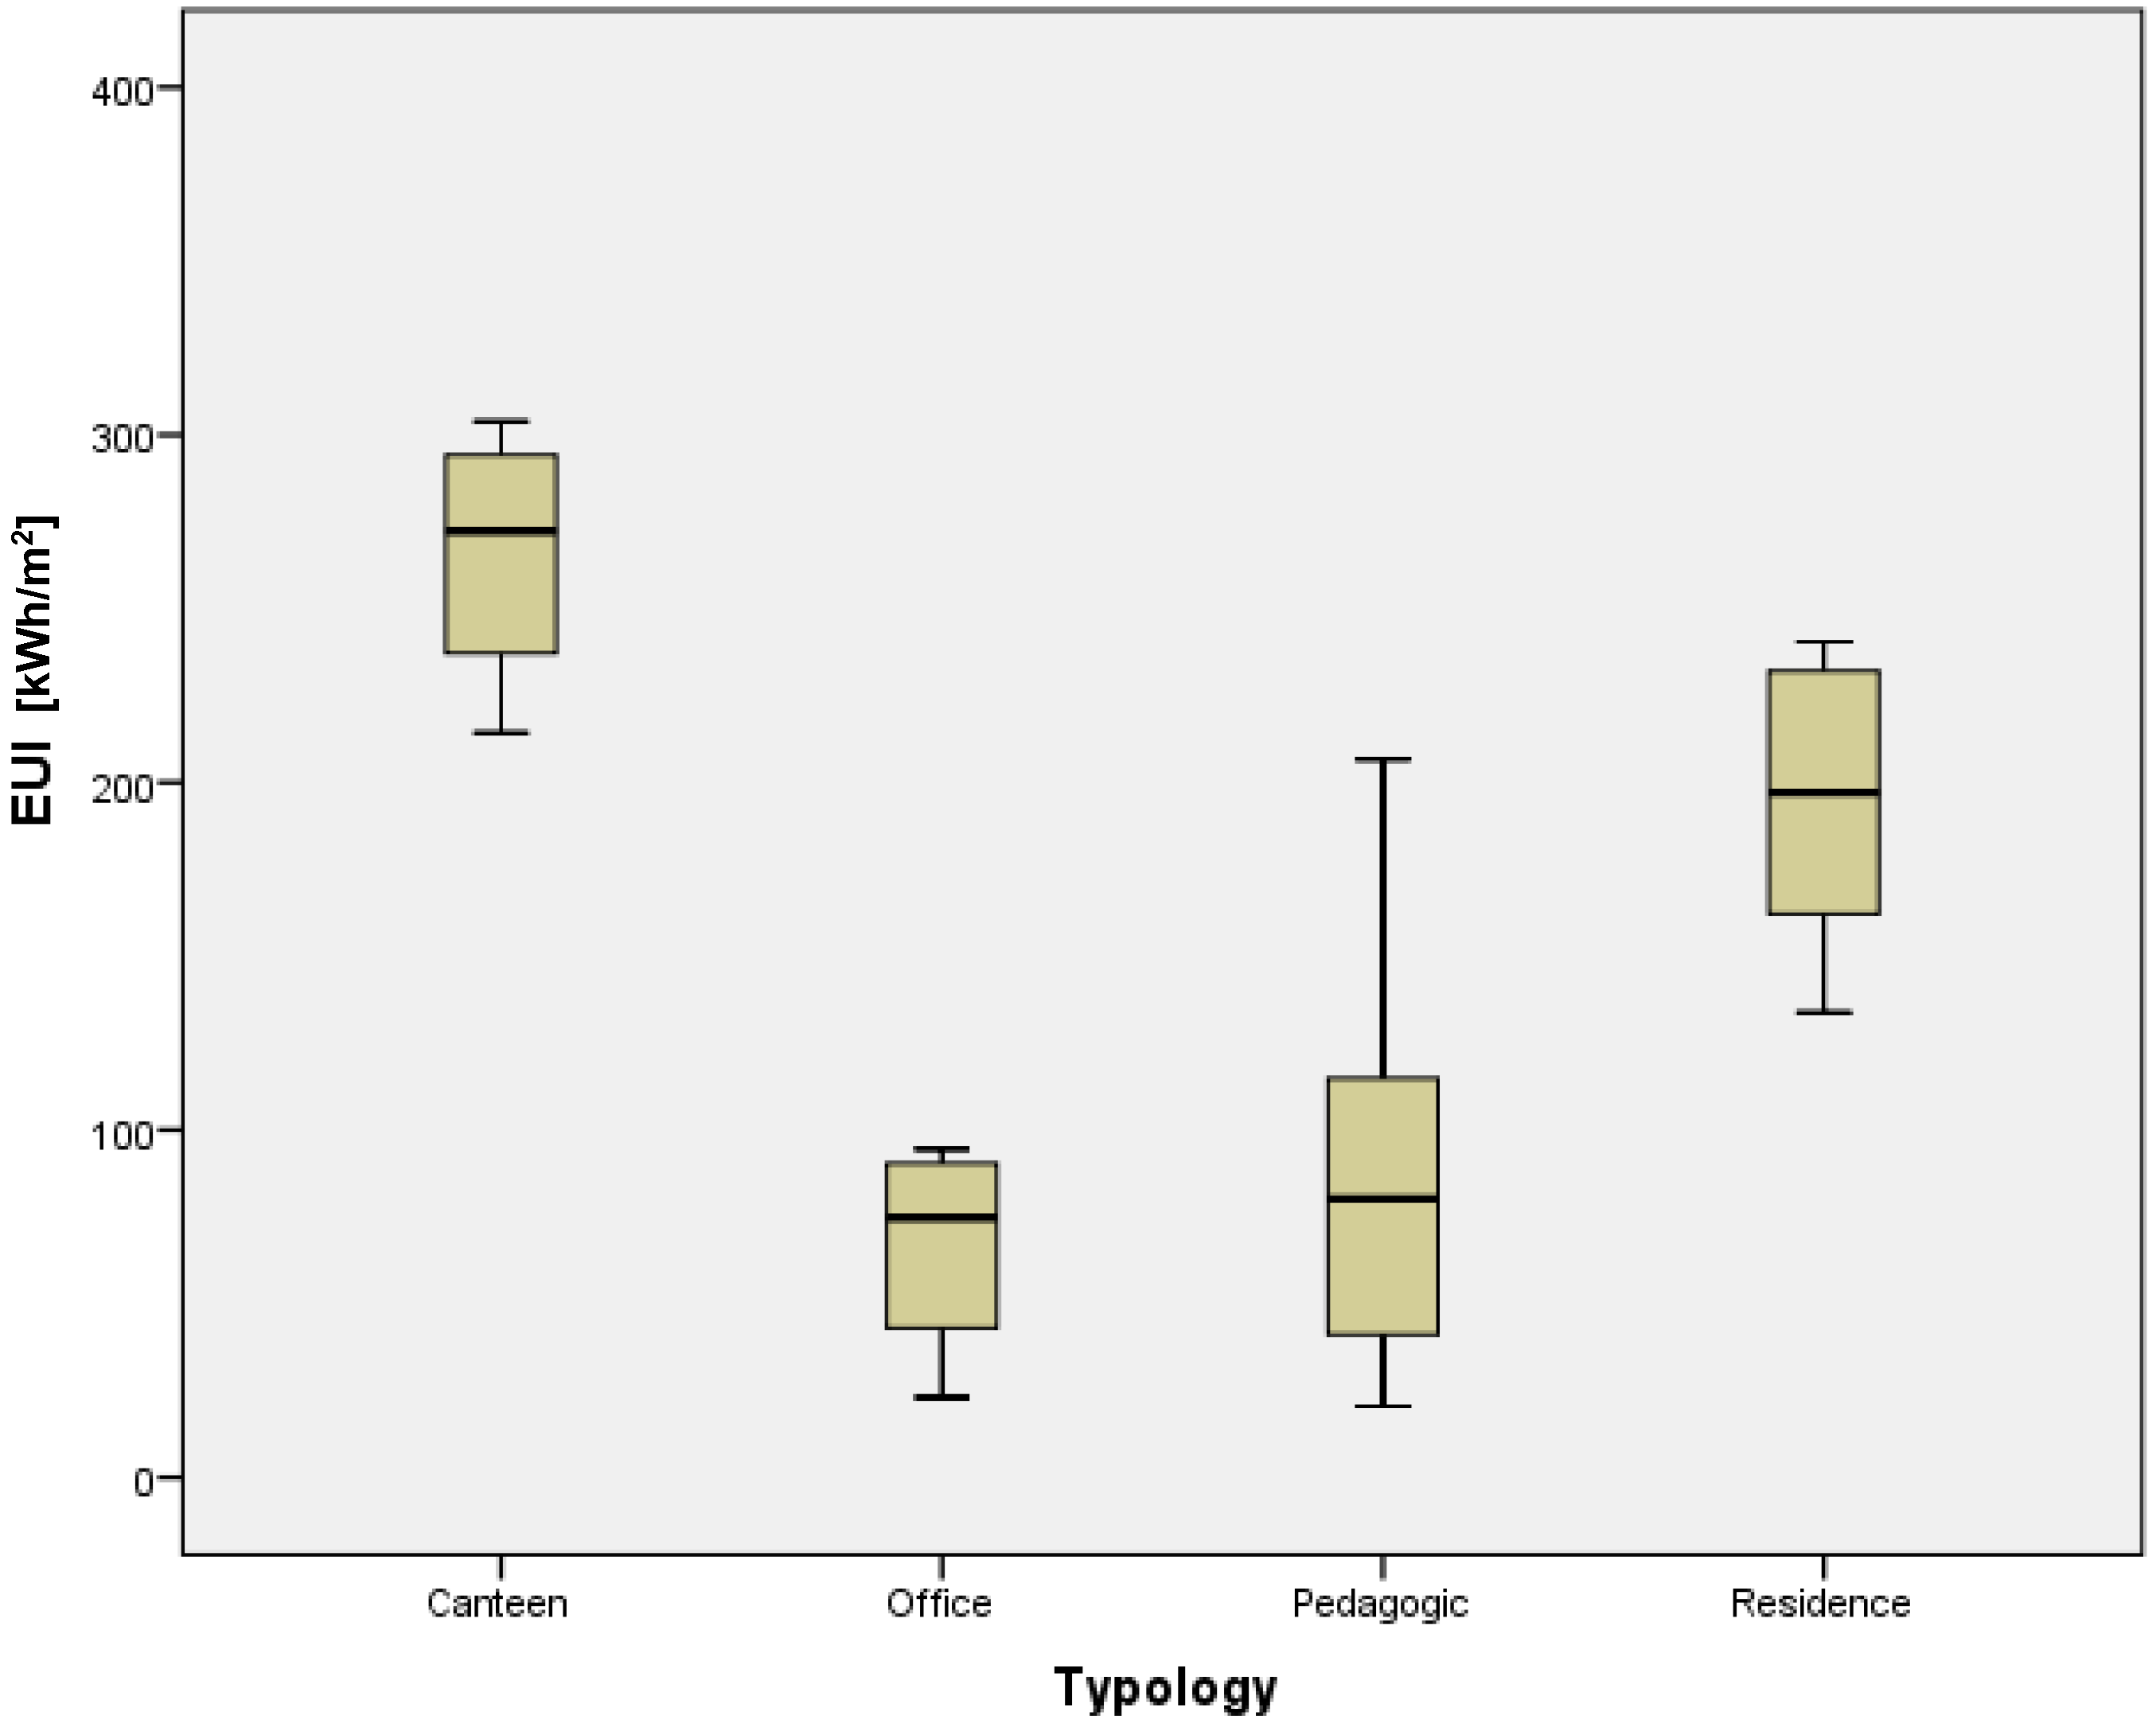
Firstly, the EUI was computed for all buildings, grouped by typology. It is patent that different buildings have very different specific energy consumptions; this is true even when buildings are used for the same purpose (i.e., within the same topology). In order to visualise the range of these differences more accurately, Figure 7 shows these indicators grouped by building typology, and Table 6 shows some relevant statistical parameters.
The boxplots presented show some dispersion of data for each typology, with an asymmetrical interval and no outliers.
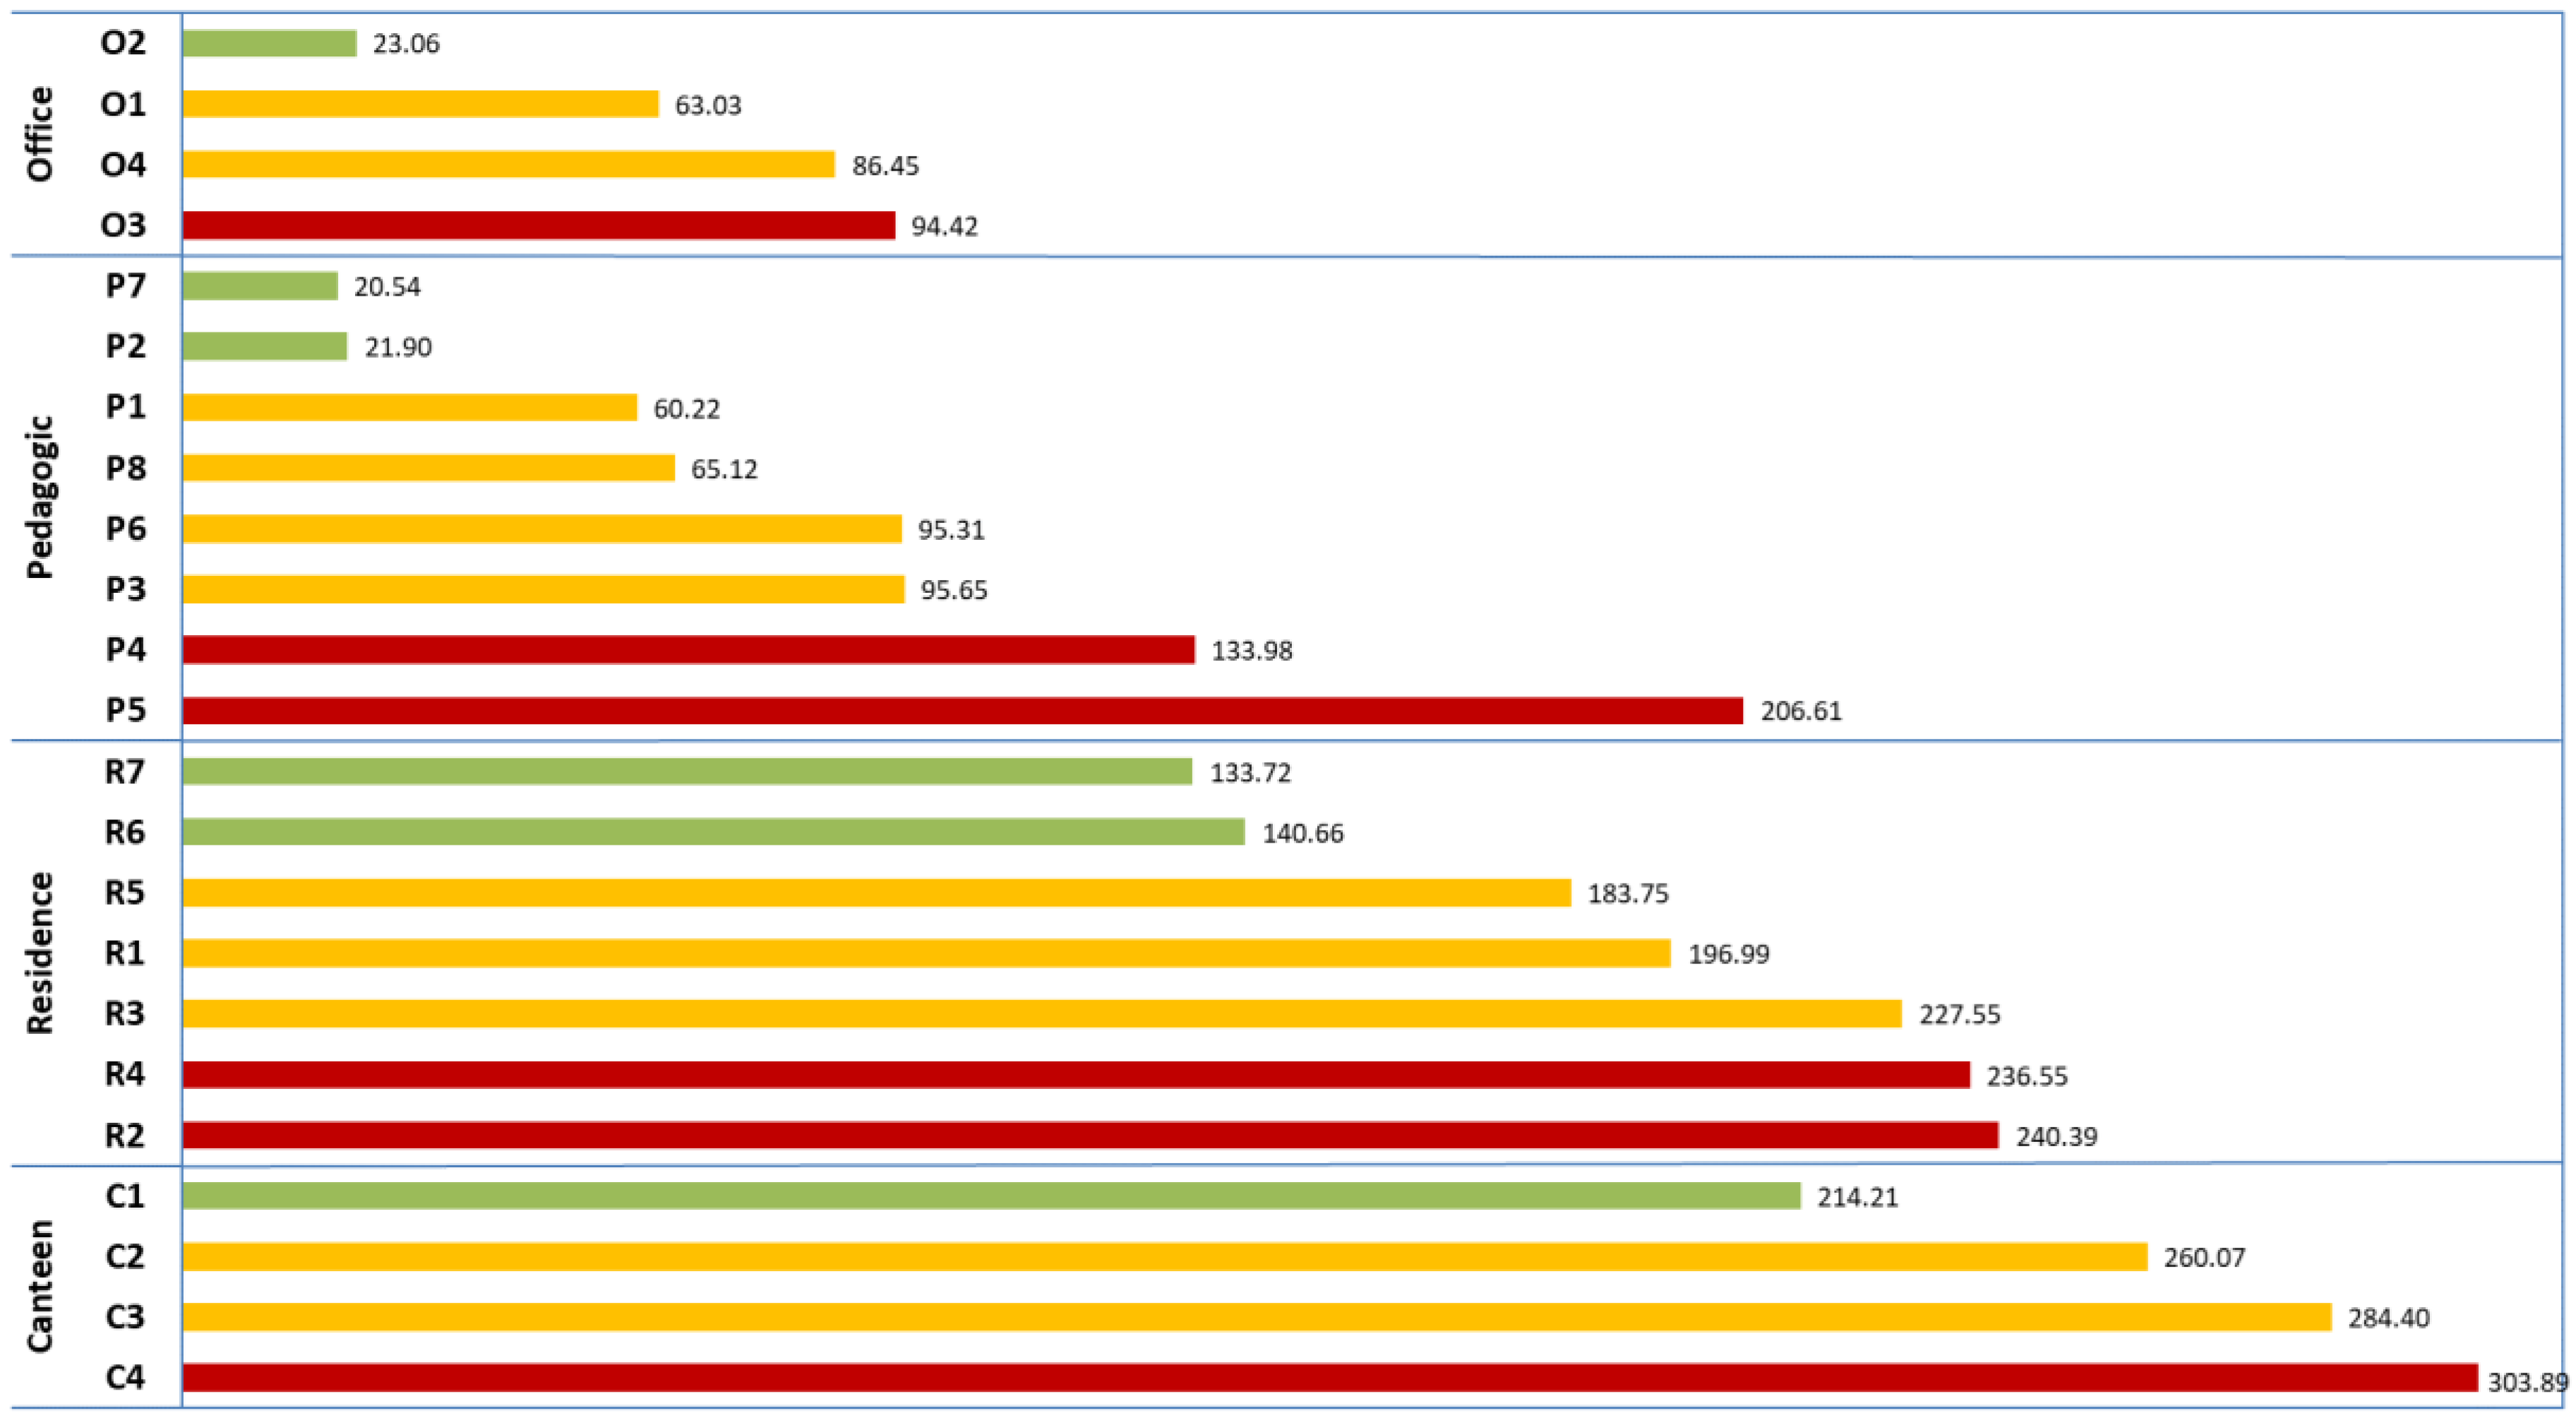
Applying the quartile-based categorization presented in Section 2 of this paper, it is thus possible to rank and categorize all buildings using a metric defined accordingly. Figure 8 presents the buildings, by typology, ranked by their energy usage indicator and categorised into “Above-average”, “Average” or “Below-average”.
From this it is possible to observe each typology separately, finding very different situations. The duration and type of activity in occupied periods plays an important role in the amount of energy consumed in a building, as well as occupant behaviour and type and availability of control over the existing equipment/systems.
For office buildings, all are similar except for one. Other than for some unapparent exception, this building may set an example to the others of its topology, allowing building managers to draw the pertinent conclusions. In office buildings, there is usually a relatively small occupancy density, with local control available to occupants.
For residence buildings, differences suggest that usage may influence energy consumption as well as net surface. These buildings have long-term occupancy of some areas, with a domestic-like usage pattern where energy consumption is very dependent on the behaviour of occupants.
Pedagogic buildings have variable occupation patterns, according to the way classes are conducted (tutorial, laboratory or classroom) and scheduled, showing very different energy performance levels. The worst performance found (P5) can be partially explained due to its nature (it is a building dedicated to automotive engineering, with a large laboratory/mechanical area). Other differences should be looked into more carefully, by returning to the buildings.
Canteens do not present very big discrepancies in their energy indicators, especially if considering that these, more than others, depend on other factors (e.g., number of meals served). These have public spaces with high occupancy densities, mostly at lunch and/or dinner times, while staff spaces have low occupancy densities, but typically high process loads due to catering equipment.
The energy savings potential was estimated according to the method presented in Section 2 of this paper, with two different scenarios, for a period of one year. The values computed for the energy savings potential, in both scenarios, for each typology of building, are presented in Table 7.
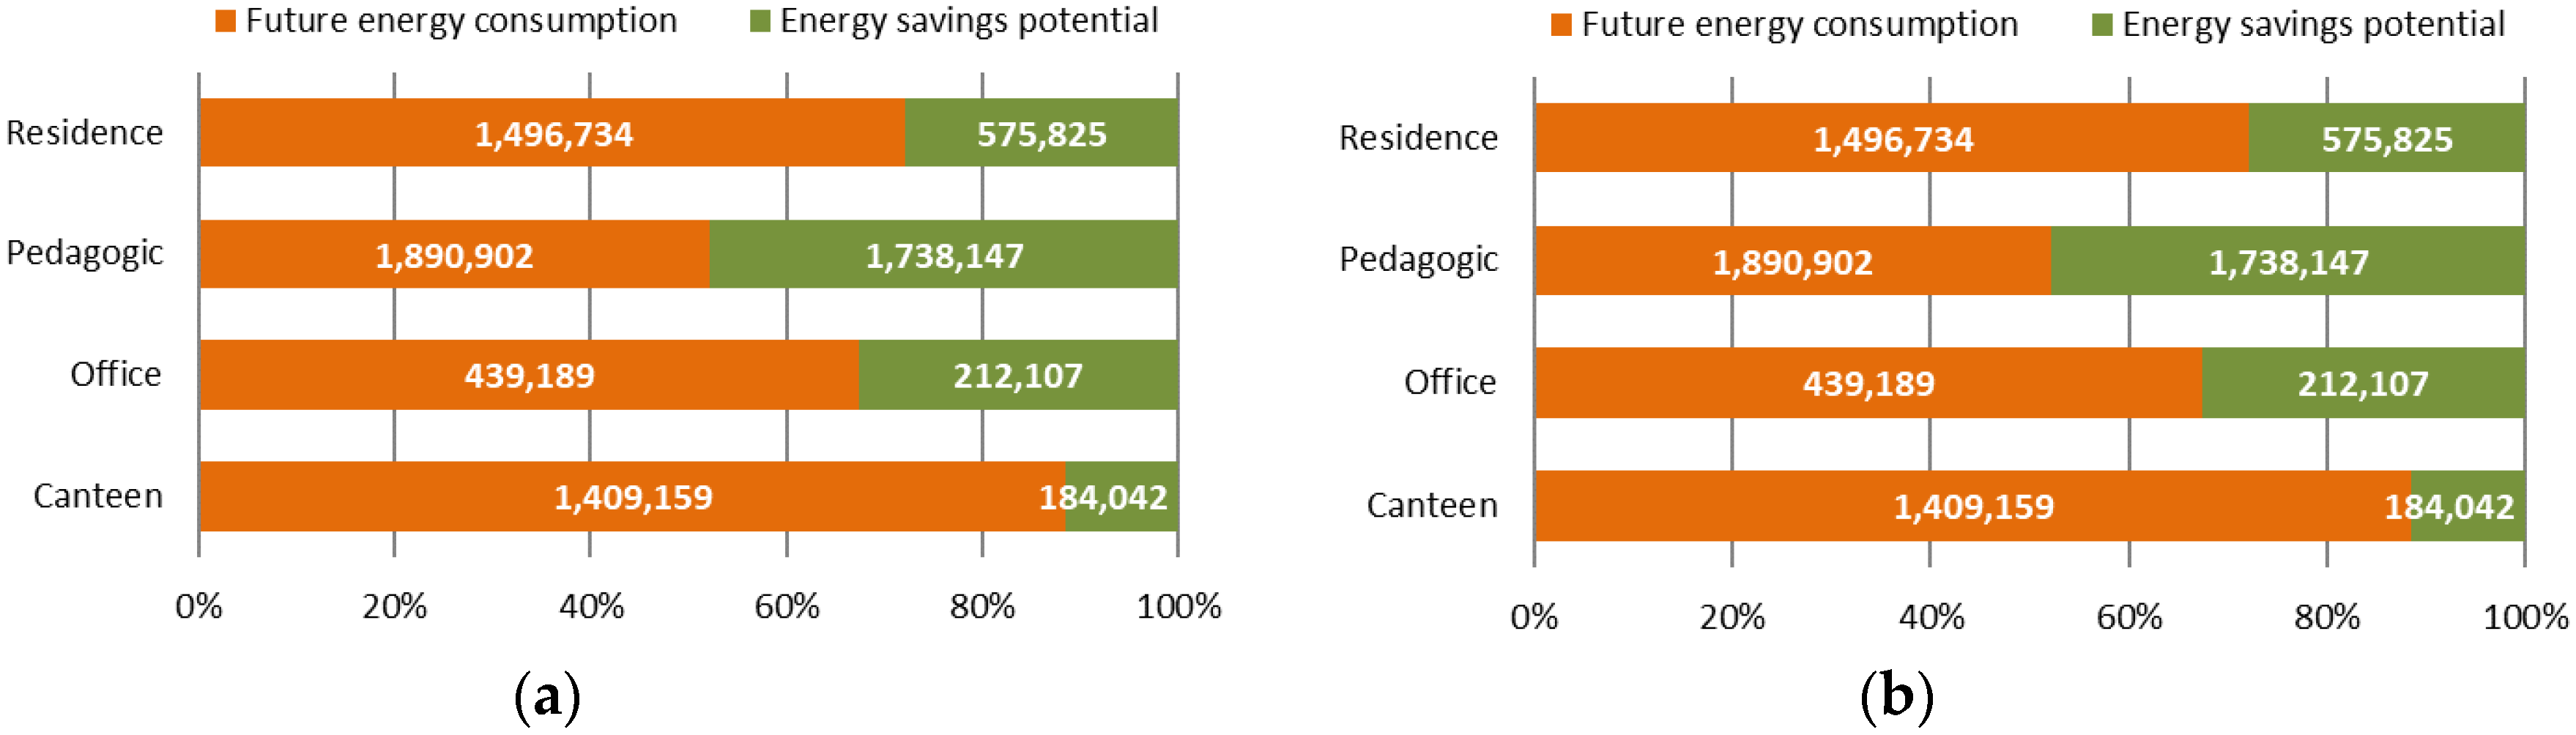
In Figure 9, future energy consumption and related energy savings potential, in the scenarios considered, are shown for each typology.
It is patent in Table 7 and Figure 9 that pedagogic buildings have the highest energy efficiency improvement potential, both in absolute terms and in percentage (15% for scenario 1 and 48% for scenario 2). Since this typology is responsible for 46% of the total amount of energy consumed, there is a considerable potential for improvement.
However, the raw categorisation formerly described, when analysed together with the knowledge and experience of the team that performed the audits, clearly distorts some results, leading to buildings with particular characteristics to be placed either at the top or at the bottom of the scale for that reason alone. This is the case with some buildings that are categorized as “Above-average” but cannot be taken as a reference by which to evaluate others because they lack in comfort for their users or have unique characteristics. In these cases, the savings potential may have been computed taking these buildings as examples and its EUI as a goal to others, resulting in a less accurate estimation of the savings potential. On the other hand, buildings with average characteristics are sometimes considered “Below-average” due to specific equipment, or to important loads due to specific building operation.
Results from performance indicators must be treated with caution since they may not reflect efficiency accurately. A building with an “above-average” performance indicator is not necessarily being operated as efficiently as possible and may have potential cost-effective savings. Also, when looking at overall performance indicators only, underlying problems with individual energy end-uses can be disregarded.
The energy savings potential was estimated between 10% and 34%, and despite the possible difficulty to achieve it in some buildings due to specific operation needs, the potential to save energy is still present in most of the buildings analysed.
5. Conclusions and Final Notes
A portfolio of buildings of a Portuguese higher education organization was analysed to compare final energy demands of buildings of the same typology. Energy audits of the 26 buildings revealed significant differences in energy consumption, equipment and technologies used, even for buildings of the same typology.
Dividing buildings into typologies according to end-use and comparing provided a more insightful view on the energy performance of each building.
The particular set of buildings is relevant as a group since all buildings share many characteristics: They belong to the same institution, are under the same administration/energy policy, are located in areas with same or similar weather/climate (three cities in the same region), and have users who share the same cultural identity, age and education level (probably implying similar behaviour of occupants), etc. This gives this set of data a greater likelihood of being more homogenous than others that can be found in building databases and other papers on the subject.
The energy benchmarking approach used yielded a rough estimation of potential energy savings simply based on relative merits, without going into detail on how actual savings could be obtained. Estimated savings potential rankings may help decision making when defining priorities in investments in energy conservation.
Many intrinsic factors may affect the energy benchmarking process. The studied higher education buildings have significant variations in occupancy, since they can have evening classes and, in some cases, buildings of the same typology are also equipped with different types of laboratories that sometimes resemble industrial facilities rather than services buildings, even if in most cases those types of equipment do not operate continuously. All these factors introduce some bias in the results, contributing to a lower accuracy in the energy savings potential estimation.
The output of this project provides the campuses with a building energy efficiency ranking, which is important to broadcast good practices, allowing ‘positive competition’ between buildings. The energy benchmarking approach followed in this study for each typology of building can support decision makers in higher education institutions to promote energy efficiency, by assessing energy usage, and to develop future improvement plans.
Rather than directly presenting definitive answers, this study and methodology helps the various players to pose the adequate questions. The answers to the questions can then be reincorporated into this study, and new conclusions drawn. Further work should focus on testing and improving this methodology, using different indicators and more case studies. It became clear that some sort of evaluation of comfort levels has to be incorporated in order to balance buildings. However, this type of approach is progressively less objective, more difficult to systematise and less reproducible in other cases.
Author Contributions
This paper is to be attributed in equal parts to the two authors.
Funding
This research was funded by the Polytechnic Institute of Leiria under project “OCEEES”, and by the Foundation for Science and Technology under project grant UID/MULTI/00308/2013.
Conflicts of Interest
The authors declare no conflict of interest.
References
- EUROSTAT. Energy, Transport and Environment Indicators: 2014 Edition; Publications Office of the European Union: Luxembourg, 2014. [Google Scholar]
- European Commission. European Commission Europe 2020: Integrated Guidelines for the Economic and Employment Policies of the Member States; European Commission: Brussels, Belgium, 2010. [Google Scholar]
- Laustsen, J.; Ruyssevelt, P.; Staniaszek, D.; Strong, D.; Zinett, S. Europe’s Buildings under the Microscope; Atanasiu, B., Despret, C., Economidou, M., Maio, J., Nolte, I., Rapf, O., Eds.; Buildings Performance Institute Europe (BPIE): Brussels, Belgium, 2011. [Google Scholar]
- Building Research Energy Conservation Support Unit. BRESCU Good Practice Guide 286: Energy Performance in the Government’s Civil Estate; Building Research Energy Conservation Support Unit: London, UK, 2000. [Google Scholar]
- Bernardo, H.; Antunes, C.H.; Gaspar, A.; Pereira, L.D.; da Silva, M.G. An approach for energy performance and indoor climate assessment in a Portuguese school building. Sustain. Cities Soc. 2016, 30, 184–194. [Google Scholar] [CrossRef]
- Pereira da Silva, P.; Dias Pereira, L.; Conceição, P.; Soares, N.; Ferreira, J. Energy efficiency of higher education buildings: A case study. Int. J. Sustain. High. Educ. 2015, 16, 669–691. [Google Scholar] [CrossRef]
- Gul, M.S.; Patidar, S. Understanding the energy consumption and occupancy of a multi-purpose academic building. Energy Build. 2015, 87, 155–165. [Google Scholar] [CrossRef] [Green Version]
- Ishak, M.H.; Sipan, I.; Sapri, M.; Mar Iman, A.H.; Martin, D. Estimating potential saving with energy consumption behaviour model in higher education institutions. Sustain. Environ. Res. 2016, 26, 268–273. [Google Scholar] [CrossRef]
- Allab, Y.; Pellegrino, M.; Guo, X.; Nefzaoui, E.; Kindinis, A. Energy and comfort assessment in educational building: Case study in a French university campus. Energy Build. 2017, 143, 202–219. [Google Scholar] [CrossRef] [Green Version]
- Liddiard, R.; Wright, A.; Marjanovic-Halburd, L. A Review of Non-Domestic Energy Benchmarks and Benchmarking Methodologies. In Proceedings of the International Conference on Improving Energy Efficiency in Commercial Buildings (IEECB’08), Frankfurt, Germany, 13–14 April 2008. [Google Scholar]
- EVO. International Performance Measurement & Verification Protocol; International Performance Measurement & Verification Protocol Committee: Washington, DC, USA, 2010; Volume 1. [Google Scholar]
- Chartered Institution of Building Services Engineers (CIBSE). CIBSE Guide F: Energy Efficiency in Buildings; Hutt, B., Ed.; CIBSE Publications; Chartered Institution of Building Services Engineers (CIBSE): London, UK, 2004; ISBN 1903287340. [Google Scholar]
- Lee, W.S. Benchmarking the energy efficiency of government buildings with data envelopment analysis. Energy Build. 2008, 40, 891–895. [Google Scholar] [CrossRef]
- Chung, M.H.; Rhee, E.K. Potential opportunities for energy conservation in existing buildings on university campus: A field survey in Korea. Energy Build. 2014, 78, 176–182. [Google Scholar] [CrossRef]
- Bourdeau, M.; Guo, X.; Nefzaoui, E. Buildings energy consumption generation gap: A post-occupancy assessment in a case study of three higher education buildings. Energy Build. 2018, 159, 600–611. [Google Scholar] [CrossRef]
- Khoshbakht, M.; Gou, Z.; Dupre, K. Energy use characteristics and benchmarking for higher education buildings. Energy Build. 2018, 164, 61–76. [Google Scholar] [CrossRef]
- International Energy Agency (IEA). Energy Performance Certification of Buildings: A Policy to Improve Energy Efficiency; International Energy Agency (IEA): Paris, France, 2010. [Google Scholar]
- Pérez-Lombard, L.; Ortiz, J.; González, R.; Maestre, I.R. A Review of Benchmarking, Rating and Labelling Concepts within the Framework of Building Energy Certification Schemes. Energy Build. 2009, 41, 272–278. [Google Scholar] [CrossRef]
- Despacho n.° 15793-F/2013: Parâmetros Para o Zonamento Climático e Respetivos Dados. 2013. Available online: http://www.dre.pt/ (accessed on 2 June 2017). (In Portuguese).
Figure 1.
Breakdown of: (a) final energy consumption, and (b) GHG (greenhouse gases) emissions.

Figure 2.
Variation of final energy consumption with net floor area.

Figure 3.
Fuel breakdown for each building of the typology canteen.

Figure 4.
Fuel breakdown for each building of the office typology.

Figure 5.
Fuel breakdown for each building of the typology pedagogic.

Figure 6.
Fuel breakdown for each building of the typology residence.

Figure 7.
EUI (energy usage indicator) for buildings according to typology.

Figure 8.
Buildings ranked by EUI, for each typology. (Green bars correspond to buildings categorised as “Above-average”, yellow bars to “Average” and red bars to “Below-average”).
Figure 8.
Buildings ranked by EUI, for each typology. (Green bars correspond to buildings categorised as “Above-average”, yellow bars to “Average” and red bars to “Below-average”).

Figure 9.
Future energy consumption and estimated energy savings, for each typology: (a) scenario 1, and (b) scenario 2.
Figure 9.
Future energy consumption and estimated energy savings, for each typology: (a) scenario 1, and (b) scenario 2.


Table 1.
Buildings characteristics.
| Typology | Building | HDD | Net Floor Area [m2] | Final Energy Consumption [kWh] | GHG Emissions [kgCO2e] | Weekday Opening Hours |
|---|---|---|---|---|---|---|
| Canteen | C1 | 1162 | 842 | 180,361 | 46,322 | 8:00–22:00 |
| C2 | 1194 | 2336 | 664,358 | 167,617 | 8:30–22:30 | |
| C3 | 1188 | 1484 | 385,943 | 105,808 | 8:30–22:30 | |
| C4 | 1055 | 1193 | 362,539 | 100,305 | 8:00–21:00 | |
| Office | O1 | 1188 | 591 | 13,631 | 4907 | 8:00–24:00 |
| O2 | 1190 | 3135 | 296,008 | 82,072 | 9:00–18:00 | |
| O3 | 1165 | 2045 | 176,783 | 52,809 | 9:00–24:00 | |
| O4 | 1192 | 2616 | 164,874 | 59,355 | 9:00–17:30 | |
| Pedagogic | P1 | 1160 | 4358 | 262,450 | 94,482 | 8:00–24:00 |
| P2 | 1165 | 1385 | 30,334 | 10,920 | 8:00–24:00 | |
| P3 | 1182 | 12063 | 1,153,841 | 344,465 | 7:00–2:00 | |
| P4 | 1194 | 8851 | 1,185,833 | 372,911 | 7:15–4:00 | |
| P5 | 1192 | 507 | 104,750 | 37,710 | 8:00–24.00 | |
| P6 | 1188 | 4438 | 422,999 | 152,280 | 7:30–24:00 | |
| P7 | 1177 | 2085 | 42,836 | 15,421 | 6:00–24:00 | |
| P8 | 993 | 6542 | 426,007 | 141,242 | 6:00–24:00 | |
| Residence | R1 | 1192 | 1460 | 287,606 | 71,121 | Variable |
| R2 | 1192 | 1452 | 349,046 | 77,020 | ||
| R3 | 1188 | 1744 | 396,849 | 107,516 | ||
| R4 | 1186 | 1300 | 307,512 | 67,327 | ||
| R5 | 1125 | 1753 | 322,121 | 73,716 | ||
| R6 | 969 | 1019 | 143,328 | 36,916 | ||
| R7 | 1004 | 1990 | 266,097 | 62,171 |
HDD: heating-degree days; GHG: greenhouse gases.
Table 2.
Main construction characteristics: canteen buildings.
| Building | Exterior Walls | Roof | Year of Construction |
|---|---|---|---|
| C1 | Double brick wall + insulation | Concrete slab + insulation + pitched clay tile roof | 2002 |
| C2 | Concrete slab + insulation + flat ceramic tile roof | 1997 | |
| C3 | Concrete slab + insulation + metal panel roof | 2006 | |
| C4 | 2005 |
Table 3.
Main construction characteristics: office buildings.
| Building | Exterior Walls | Roof | Year of Construction |
|---|---|---|---|
| O1 | Metal panels + steel frame + insulation | Metal panels + insulation | 2010 |
| O2 | Double brick wall + insulation | Concrete slab + insulation + flat gravel roof | 1997 |
| O3 | Concrete slab + insulation + flat tile roof | 2001 | |
| O4 | Single brick wall + exterior insulation | 2002 |
Table 4.
Main construction characteristics: pedagogic buildings.
| Building | Exterior Walls | Roof | Year of Construction |
|---|---|---|---|
| P1 | Double brick wall, no insulation | Concrete slab + fibre cement panels | 1984 |
| P2 | Double brick wall + insulation | Concrete slab + insulation + metal panels | 2003 |
| P3 | Double brick wall, no insulation | Concrete slab + insulation + flat tile roof | 1996 |
| P4 | Double brick wall + insulation | 2003 | |
| P5 | Single brick wall + insulation + metal panels | Metal panels, no insulation | 2000 |
| P6 | Double brick wall + insulation | Concrete slab + insulation + flat tile roof | 2006 |
| P7 | 2003 | ||
| P8 | 2001 |
Table 5.
Main construction characteristics: residence buildings.
| Building | Exterior Walls | Roof | Year of Construction |
|---|---|---|---|
| R1 | Double brick wall + insulation | Concrete slab + pitched clay tile roof (no insulation) | 1996 |
| R2 | 1997 | ||
| R3 | 1998 | ||
| R4 | 2002 | ||
| R5 | 1992 | ||
| R6 | Concrete slab + insulation + pitched clay tile roof | 2004 | |
| R7 | Concrete slab + insulation + flat pebble roof | 2002 |
Table 6.
Statistical parameters of EUI [kWh/m2] by typology of building.
| Typology | Sample Size | Mean | Standard Deviation | Minimum | Percentile 25th | Median | Percentile 75th | Maximum |
|---|---|---|---|---|---|---|---|---|
| Canteen | 4 | 265.64 | 38.69 | 214.21 | 237.14 | 272.23 | 294.14 | 303.89 |
| Office | 4 | 66.74 | 32.02 | 23.06 | 43.04 | 74.74 | 90.43 | 94.42 |
| Pedagogic | 8 | 87.42 | 61.53 | 20.54 | 41.06 | 80.22 | 114.81 | 206.61 |
| Residence | 7 | 194.23 | 44.12 | 133.72 | 140.66 | 196.99 | 236.55 | 240.39 |
Table 7.
Estimated energy savings by typology of building: scenario 1 and scenario 2.
| Typology | Energy Consumption [kWh] | Energy Savings Potential | |||
|---|---|---|---|---|---|
| Scenario 1 | Scenario 2 | ||||
| [kWh] | [%] | [kWh] | [%] | ||
| Canteen | 1,593,201 | 47,218 | 3 | 184,042 | 12 |
| Office | 651,296 | 42,926 | 7 | 212,107 | 33 |
| Pedagogic | 3,629,049 | 546,645 | 15 | 1,738,147 | 48 |
| Residence | 2,072,559 | 163,593 | 8 | 575,825 | 28 |
| Total | 7,946,105 | 800,382 | 10 | 2,710,121 | 34 |
© 2018 by the authors. Licensee MDPI, Basel, Switzerland. This article is an open access article distributed under the terms and conditions of the Creative Commons Attribution (CC BY) license (http://creativecommons.org/licenses/by/4.0/).
Share and Cite
MDPI and ACS Style
Bernardo, H.; Oliveira, F. Estimation of Energy Savings Potential in Higher Education Buildings Supported by Energy Performance Benchmarking: A Case Study. Environments 2018, 5, 85. https://doi.org/10.3390/environments5080085
AMA Style
Bernardo H, Oliveira F. Estimation of Energy Savings Potential in Higher Education Buildings Supported by Energy Performance Benchmarking: A Case Study. Environments. 2018; 5(8):85. https://doi.org/10.3390/environments5080085
Chicago/Turabian StyleBernardo, Hermano, and Filipe Oliveira. 2018. "Estimation of Energy Savings Potential in Higher Education Buildings Supported by Energy Performance Benchmarking: A Case Study" Environments 5, no. 8: 85. https://doi.org/10.3390/environments5080085
Note that from the first issue of 2016, this journal uses article numbers instead of page numbers. See further details here.