Article

The Effects of Traditional and Electronic Word-of-Mouth on Destination Image: A Case of Vacation Tourists Visiting Branson, Missouri

School of Hotel and Restaurant Administration, Oklahoma State University, Stillwater, OK 74078, USA
*
Author to whom correspondence should be addressed.
Adm. Sci. 2016, 6(4), 12; https://doi.org/10.3390/admsci6040012
Submission received: 7 July 2016 / Revised: 21 September 2016 / Accepted: 22 September 2016 / Published: 28 September 2016
(This article belongs to the Special Issue Customer Relationship Management and Recent Developments)

Abstract

:
The effects of integrated word-of-mouth (WOM), both traditional and electronic, on tourism products are yet to be fully investigated. The current study aims to assess the effects of and differences between traditional WOM and electronic WOM, between personal WOM and commercial WOM, and between positive and negative WOM on a destination image. Results of the study indicate that traditional WOM had a greater influence on destination image compared to electronic WOM. Personal traditional WOM had a greater influence on destination image compared to electronic personal WOM and commercial WOM. However, negative WOM exerted less influence on the destination’s image compared to positive WOM while negative electronic WOM had a greater influence on destination image compared to negative traditional WOM.

1. Introduction

Destination image is a major factor influencing tourists’ choice of destination [1,2]. Destination image is a term widely accepted by marketing researchers and practitioners, and it plays an important role in travel decision-making processes [3]. The development of the destination image has a multi-dimensional nature and formation [4]. In that regard, tourists develop their destination image through exposure to information sources.
Word-of-mouth (WOM) communication has been shown as the most influential and predominant resource of information in developing a destination image [2,5,6]. The power of WOM has been researched for several decades in the marketing field. However, despite the importance of WOM in tourism destination choice, existing research in tourism is still limited [7]. At the same time, recent developments in electronic communication technology has led to the rise of electronic WOM (eWOM) which allows individuals to share their opinions and experiences with other individuals via electronic communication channels, such as e-mails, blogs, networks, chat rooms, online reviews, and websites with user-generated information—all of which have become powerful tools of promotion and communication decisions [8].
eWOM utilizes the large scale, anonymous, ephemeral nature of the Internet and introduces a new way of capturing, analyzing, interpreting, and managing the influence of customer communication in hospitality and tourism marketing [7,9]. As Jeong and Jang [10] state, in contrast to traditional WOM, eWOM spans more widely and rapidly due to being directed at multiple individuals, being anonymous and available at any time; thus, the potential impact of eWOM on customers’ decision-making processes can be more powerful than the impact of traditional WOM.
Tourism promotion as a part of the destination image-formation process does not stand-alone. It is interdependent with many available information sources in addition to traditional WOM and eWOM [11]. The latter however is often perceived as less credible and influenced by a number of factors that stem from on-line communication [12,13,14]. For example, a study by Cox, Burgess, Sellito, and Buultjens [15] shows that although electronic sources containing user-generated content are popular among travelers, they are not yet considered to be as credible as non-commercial a government-sponsored tourism websites or face-to-face communication. Thus, combined traditional WOM and eWOM effects on destination image should be identified. However, no studies have compared the effects of traditional WOM and eWOM on destination image simultaneously.
Senecal and Nantel [16] suggest that consumer-generated information is more important to prospective purchasers of experiential products. Compared to other retail products, hospitality and tourism products are intangible and carry a high degree of uncertainty because these products cannot be evaluated before consumption [17]. In addition, these products are usually considered as high involvement products due to high costs and riskiness. Hence, WOM becomes an important aspect of the decision-making process [18] as it reduces uncertainty and perceived riskiness. WOM is particularly crucial for hospitality providers whose offerings are largely intangible, and experience or credence based [19]. In hospitality and tourism services customers rely heavily on the advice and suggestions from others who have experienced the service [15,20].
Bone [21] suggests that WOM influences are stronger when the consumer faces an ambiguous situation. Word-of-mouth is particularly critical for providers whose offerings are primarily intangible and experience-based [19]. The latter description is particularly relevant for destination choice as travelers rely greatly on the advice from others who have experienced the destination in question. Additionally, travelers often trust each other more than they trust communication from commercial entities, thus stressing the weight of WOM [22]. Due to the intangible and often ambiguous nature of tourism products, WOM affects tourist destination choice more than it does other industries’ products. Not also travel and tourism have a large intangible component, but also those areas are considered as high involvement products. Particularly for vacation travelers, as desire to make the right choice and minimize risks is paramount in such instance.
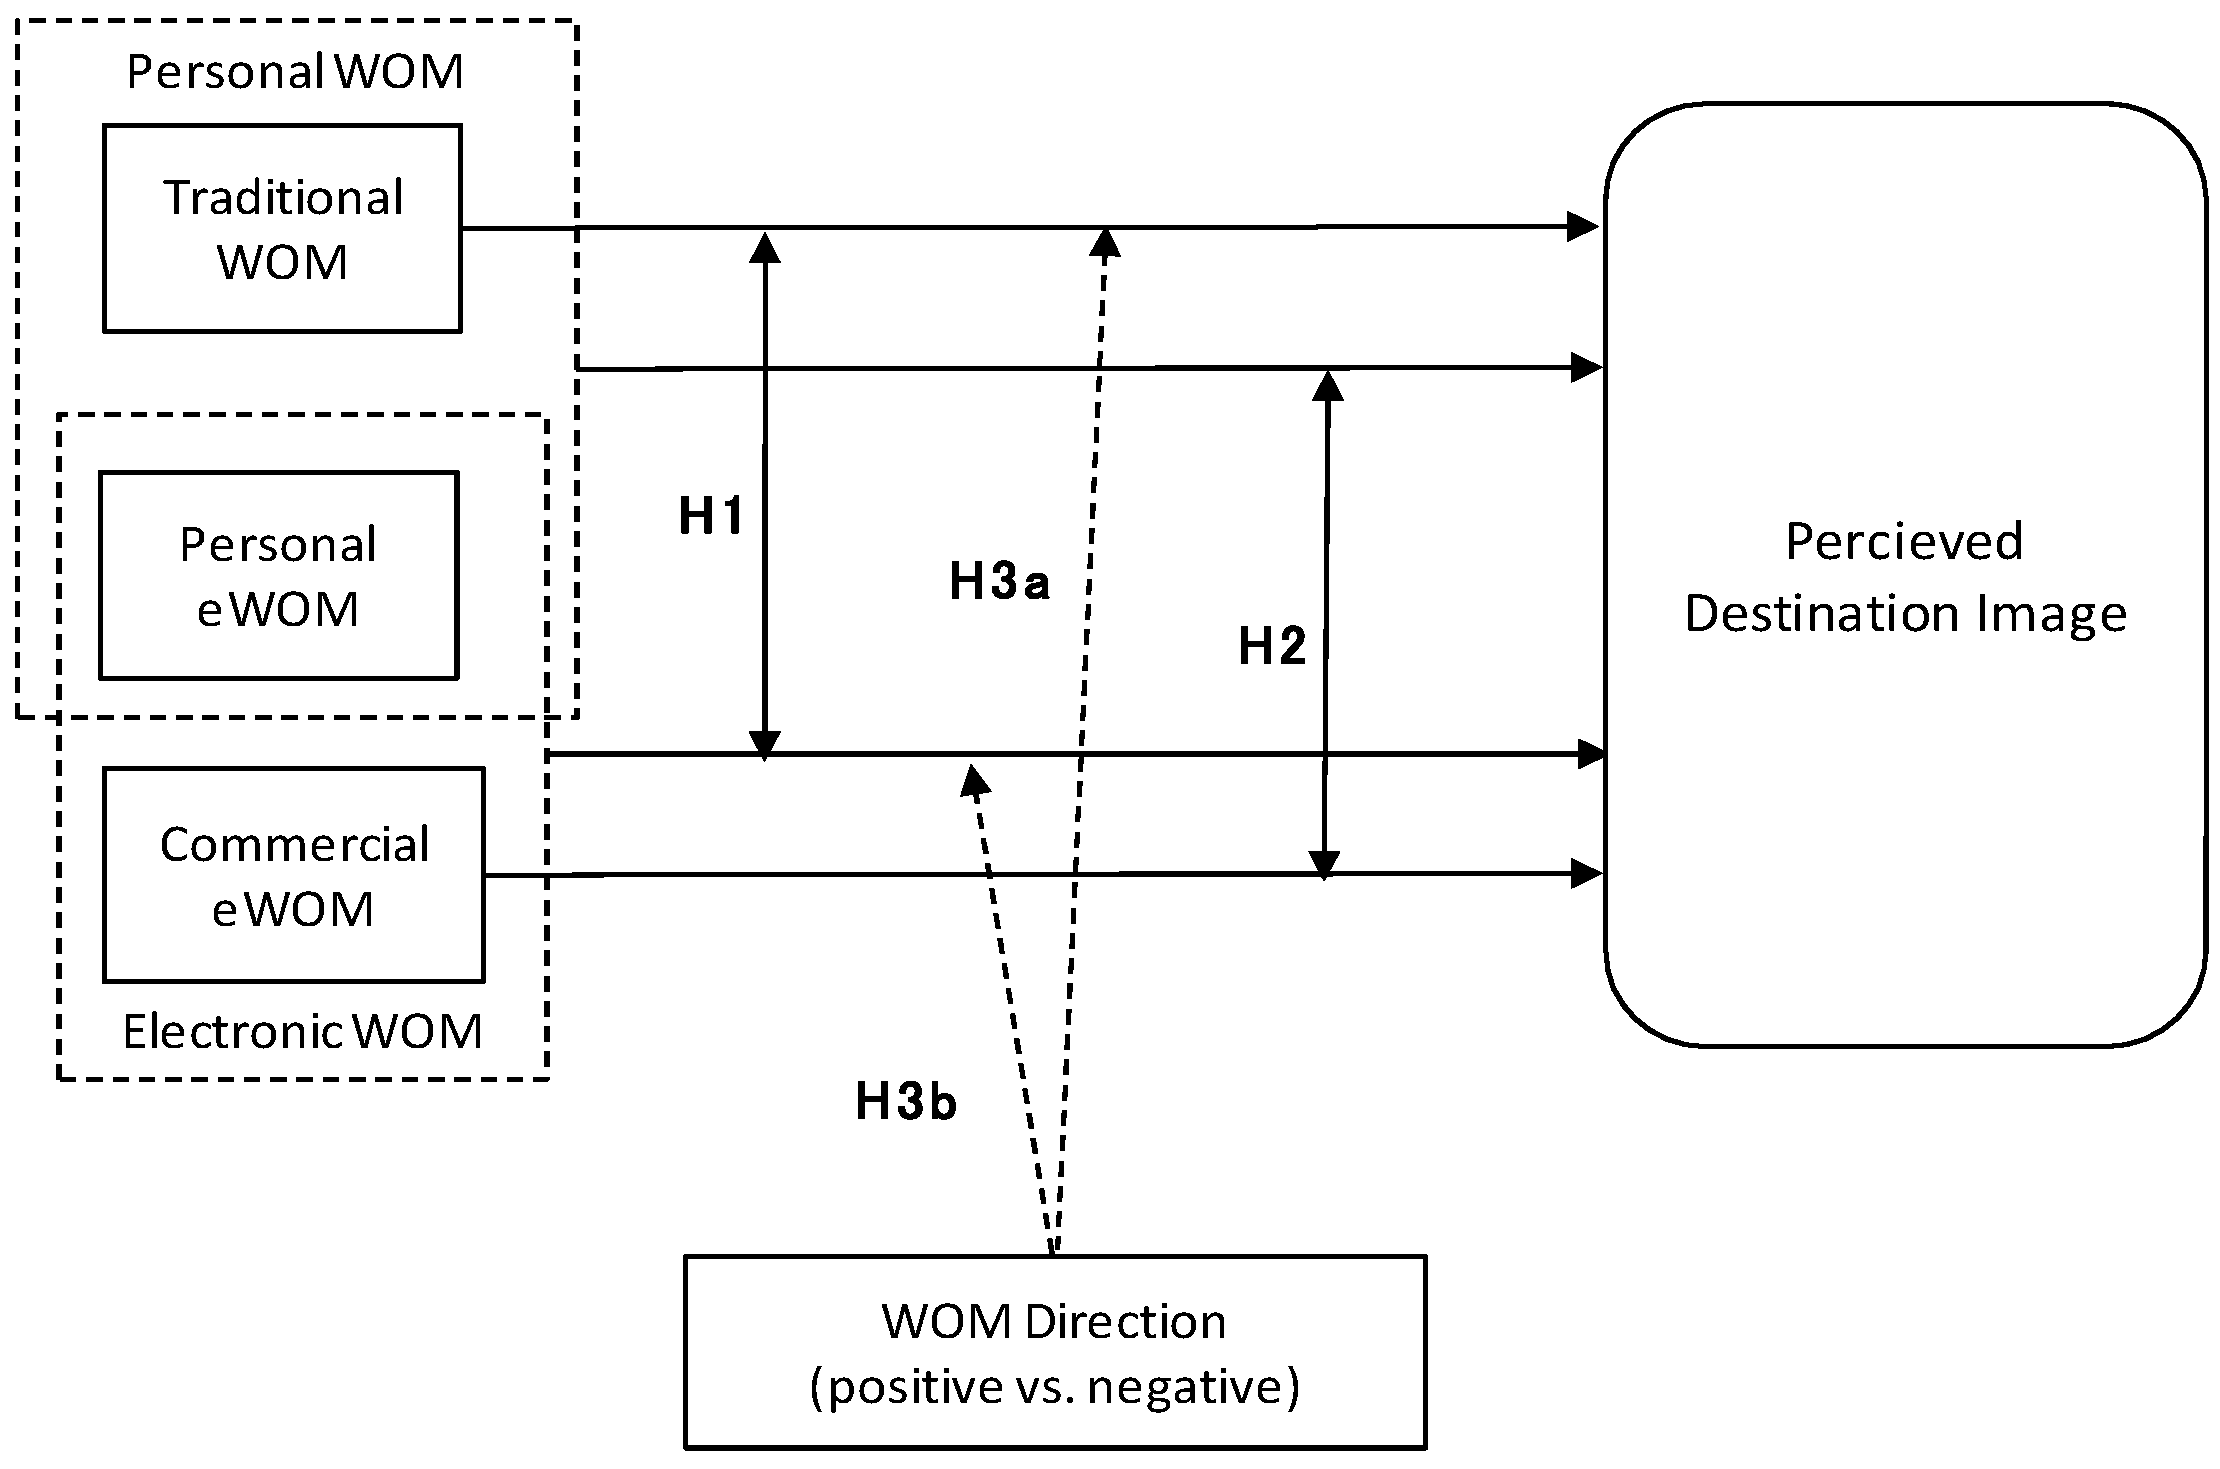
While traditional WOM is defined as personal communication between people who are not commercial entities, eWOM includes two types of communication, personal WOM and commercial WOM. These two eWOM typologies have different online information platform providers, non-commercial or commercial, respectively. In the first case, individuals share information using personal/non-commercial channels; in the second case individuals share information through commercial channels, such as company’s websites [15].
Xiang and Gretzel [23] state that large proportion of travelers use search engines, on-line sources, and social media when evaluating a destination. Several researchers indicate that information from strong-tie (personal) referral sources is perceived as more influential on the receiver’s decision-making than the information obtained from weak-tie (commercial) referral sources [24]. Therefore, this study needs to compare the effects of personal WOM and commercial WOM on destination image in terms of tie strength effects. Furthermore, general marketing researchers indicate that negative WOM exerts stronger influence on consumers’ brand evaluation [25,26] and purchase intention [24] compared to positive WOM. It is also one of the critical factors in the tourist destination choice process. However, very few studies have been concerned with whether or not consumers seek positive or negative direction from traditional WOM and eWOM in the context of travel destination choice [26].
Thus, the current study aims to investigate the effects of traditional and electronic WOM on destination image. Specifically, the purpose of this study is to examine how traditional and electronic WOMs influence perceived destination image and to identify what type of WOM (personal or commercial) are considered as the most credible sources. Additionally, this study seeks to compare positive and negative WOM in terms of their effect on destination image.
This study’s theoretical contribution stems from a holistic focus on WOM as it considers the attitudes of travel consumers seeking both traditional and electronic WOM information. Practical contribution is built around the fact that the obtained knowledge about WOM effects can help tourism marketers decide how much effort they should invest in terms of their marketing resources on traditional WOM and electronic WOM.
Following the introduction, the literature review section provides synthesis of published research on the subject and descriptions of key concepts. Having outlined the study’s methods, key results are presented. Discussion section situates current findings among existing literature and provides advice for industry practitioners. Finally, limitations of the current study are discussed and suggestions for future research are specified.

2. Literature Review

2.1. Destination Image and Its Effects on Decision-Making

While the tourism product’s characteristics of complexity and multidimensionality influence tourism destination image, more importantly, the intangibility of tourism services hinders image assessment due to the uncertainty of pre-visited selection [27]. Gallarza et al. [27] indicated that images were more important than tangible products in marketing materials for intangible products because perceptions rather than reality motivate consumers to purchase. Destination image is commonly recognized as an important aspect of successful tourism development and destination marketing, due to its effect on both push and pull factors [28]. Push factors are supply-side aspects of motivations for travel and pull factors are demand-side aspects of desirable features or attributes of destination attractions [1,28].
Image is a valuable concept in understanding the process of tourists’ destination selection [5,29,30]. Hunt [30] argued that images and perceptions, which travelers have about a destination, might strongly influence tourist’s decisions about the more tangible tourism resources. Hunt notes that this occurs because travelers who have very limited personal experience with destinations make decisions on the basis of images and perceptions of the destination rather than objective reality. However, it should be noted that in Hunt’s study [30], destination image was based on an image attribute component. Later conceptualizations of destination image included the attribute-based component as well as a holistic component [31]. Considering the holistic component of the destination image, Tapachai and Waryszak [3] used a category-based approach to examine the usefulness of a beneficial image in influencing the decision of potential tourists to visit Thailand and the United States as vacation destinations. They conclude that the beneficial image model provides more specific and useful characteristics that potential tourists can take into account in their decision to visit a destination compared to models that have attempted to capture the general characteristics of the destination image.

2.2. Formation Agents of Destination Image

Push factors that affect supply-side aspects of a destination image are comprised of information sources and personal factors [6]. These information sources include primary source of previous travel experience and intensity of visits, as well as secondary sources of induced, organic, and autonomous agent. Personal factors include motivations, travel experience, and socio-demographic characteristics [6]. Beerli and Martin [6] also consider destination image as a concept formed by the consumer’s reasoned and emotional interpretation formed as the consequence of two interrelated components: cognitive and affective. Cognitive evaluations refer to the individual’s own knowledge and beliefs about travel, while affective appraisals relate to an individual’s feelings towards travel. In addition, the combination of these two factors produces an overall image related to positive or negative evaluation of travel. Tourists will use these image dimensions to form their impressions and evaluate the considered destinations in their choice processes.
Beerli and Martin’s destination image formation model [6] was based on Gartner’s model [1] and Baloglu and McCleary’s model [5]; however, they developed the model in a way that differentiates between first-time and repeat tourists. These two groups may be different in terms of image perception, level of knowledge, and motivation regarding the destination that has an effect on the results. The result of Beerli and Martin’s study [6] showed that organic and autonomous sources significantly influence some of the factors determining the cognitive image of the destination.
While developing a conceptual model of the determinants of destination image, Baloglu and McCleary [5] propose that a destination image is formed by both personal and stimulus factors. Personal factors are the social and psychological characteristics of the perceiver while stimulus factors stem from the external stimulus and physical object as well as previous experience. Their study shows that variety of information sources, type of information sources, age, and education influence cognitive evaluations while sociopsychological motivations influence only affect. However, the effects of cognitive evaluation on affect were much stronger than the effects of travel motivations. Baloglu and McCleary [5] state that word-of-mouth recommendations from friends and relatives are the most important source in forming touristic images. Beerli and Martin [6] concur that word-of mouth is the most believable and truthful communication channel, which also significantly influences the cognitive image of the destination. It should be noted however that due to the intangibility of the tourism product, consumers may prefer to seek credible information sources like news reports as autonomous agents or word-of-mouth information as solicited and unsolicited agents.

2.3. Tie Strength

How actively WOM is sought is directly related to the strength of the tie between the information sender and receiver [32]. In their network analysis, Brown and Reingen [24] state that the tie strength concept addresses properties of social relations from which WOM behavior arises. Since WOM is a social phenomenon, properties of social relations are likely to play a crucial role in WOM behavior. It is found that when both strong and weak ties are available as sources of information, strong ties are more likely to be activated than weak ties because the flow of information and strong-tie referral sources would be perceived as more influential on information receivers’ decision-making compared to weak-tie referral sources [24,32]. In a study of Swiss tourists, Beiger and Laesser [33] found that WOM from friends and relatives was the most commonly used information source for travelers before the travel decision-making. It should be mentioned however, that recent studies report that more and more travelers seek information through on-line sources that provide user generated content, like feedback or ratings, and use that information to make their travel decisions [15,34]. Therefore, additional examination of such trend seems important.

2.4. Positive and Negative Word-of-Mouth

WOM direction, positive or negative, is one of the critical antecedents of WOM effects. In his examination of a direct relation between negative WOM and post-exposure brand evaluations, in the context of the diffusion of a new food product, Arndt [25] provides evidence that negative WOM has a stronger influence on consumers’ brand evaluations compared to positive WOM. In an attribution model of information processing, Mizerski [35] experimentally tested the disproportionate weighing of negative WOM with a sample of university students who were testing a new automobile and previewing a new movie. The study reveals that negative WOM messages about a product tend to produce more extreme effects toward the product compared to positive WOM messages. In case of eWOM, same tendencies have been reported. For example, Sparks and Browning [26] confirm the greater impact of negative eWOM on consumer evaluations.
Although most marketers believe negative WOM is more common than positive WOM, the effects of negative WOM on product judgments decline when vivid WOM is available [36,37]. In the context of personal computer brand evaluation, brand attributions mediate the relation between negative WOM messages and brand evaluations for certain information configurations. Specifically, negative WOM messages include information such as low consensus of other’s views of the brand, low distinctiveness of the sender’s opinion of the brand versus other brands, high consistency of the sender’s experience with the brand, as well as low consensus, high distinctiveness, and low consistency [37]. Several studies have pointed out that negative WOM may not necessarily have a negative influence on receivers’ brand evaluation due to non-generalizability of the studies supporting such proposition [9,38]. In one of the few service-product-related WOM direction attribution studies, Kim [39] tested customers lodging experiences using a scenario-based survey. The author concludes that a negative message of high consensus, high distinctiveness, and high consistency is most likely to lead customers to attribute negative WOM to the service product. Due to contradicting findings about the effects of positive and negative WOM, it can be concluded that more empirical investigations are needed on this subject.

2.5. Characteristics of Electronic Word-of-Mouth

Jeong and Jang [11] state that the major difference between WOM and eWOM is in the media used: WOM is typically face-to-face and eWOM is online. With the advancement of technology, the physical place in which this type of communication takes place has changed from face-to-face to cyberspace. Consequently, there are several shared as well as distinctive characteristics of traditional WOM and eWOM. For example, Pavlou and Dimoka [13] state that people rarely view comments beyond the first two pages in feedback sites. Sparks and Browning [26] showed that numerical feedback ratings were only relevant when accompanied by verbal feedback. Additionally, due to communication between consumers, not between the consumers and marketers of the product, these communication channels are perceived as more believable [40].
Nevertheless, eWOM is distinctive in that it shares characteristics with marketer-generated communications, such as advertising. As with traditional WOM messages, an information receiver establishes a sender’s credibility by inferring the sender’s reputation, experiences, and knowledge, as well as establishing how much the sender can be trusted in a given situation. On the other hand, in the case of eWOM messages, the receiver may not trust the sender’s reliability and may need to estimate it within the message and its environment. Specifically, when the eWOM message was viewed on a website that sells the products, the positive source credibility effect will be diminished [41]. Additionally, the lack of control and verification processes for eWOM makes it vulnerable to people who post false information that is positive or negative about a product as stated in Torres et al. [34].
It is difficult to directly observe traditional WOM because the information is exchanged in private conversation and is ephemeral. However, eWOM may offer an easy and cost-effective opportunity to measure and trace WOM communication because the messages about a product or service may be posted on the website accumulating within a planned term [42]. Moreover, eWOM activity has allowed consumers to overcome most of the information asymmetries that characterize the traditional consumer market and thus, consumers can obtain high levels of market transparency [43]. In addition, while traditional WOM messages generally are processed between small groups of two or more interested parties, eWOM allows consumers to obtain information related to goods or services from a vast, geographically dispersed group of people [8,44].

2.6. Types of Electronic Word-of-Mouth

eWOM can be generated in a variety of ways, such as emails, instant messages, websites, blogs, online community, newsgroups, chatrooms, hate sites, review sites, and social networking sites [7,8]. Each type of eWOM can be distinct from personal and commercial eWOM based on these online information platform providers. While email messages between and among Internet users who know each other personally resemble traditional WOM, email is forwarded easily with little time and cost compared to traditional WOM [45]. Web-based consumer opinion platforms (online communities, review sites) are the most widely used eWOM formations [46,47] that allow consumers to read other consumers’ opinions and experiences as well as write own contributions.

2.7. Electronic Word-of-Mouth-Seeking Behavior

According to Part and Allen [48], online reviews have become a significant and influential decision-making resource for consumers, particularly through eWOM. Consumers give and seek opinions online in much the same way as they do offline, thereby affecting the choice of many goods and services. Goldsmith and Horowitz [49] noted that it is important to analyze the motives for seeking eWOM opinions because they provide insights about consumer behavior. Goldsmith and Horowitz suggested that highly motivated consumers are more likely to be influenced by eWOM than by message from traditional advertising media (radio, TV, and newspaper). In their study of social networking analysis in online communities, Brown, Broderick, and Lee [50] stated that to determine the flow and nature of eWOM interaction, it is critical to explore whether and how the constructs of source credibility, tie strength, and homophily differ from traditional WOM exchanges. Consumers believe that consumer-generated website contents have higher credibility, relevance, and empathy than do marketer-generated contents [11,51]. However, online community users appear to spend at least some effort to evaluate the credibility of information, as well as the online community itself [50]. The results of Brown et al.’s study [50] showed that online communities or review websites could generate some kind of “authority”, which would give any information on that site more weight. This website authoritativeness may influence eWOM differently compared to effects on traditional WOM.
Traditional view suggests that face-to-face WOM plays a major role in consumer buying decisions by influencing consumer choice [25]. Due to the intangible nature of the products or service of tourism, the availability of trustworthy WOM becomes critically important for consumers seeking to minimize risk in service products consumption [15,18]. In order to obtain credible WOM, consumers may rely increasingly on eWOM as more available and accessible. However, consumers may use both traditional WOM and eWOM at different stages in the travel decision-making or destination image formation process. Instead of eWOM, traditional WOM may have a stronger influence on the decision-making stage.
Based on the described above information, the first hypothesis can be stated as following:
H1.
Traditional WOM perceptions has a greater effect on perceived destination image compared to electronic WOM perceptions in the context of vacation travel.

2.8. Social Ties and Personal and Commercial Word-of-Mouth

Offline traditional WOM research indicates that information obtained from source with strong tie connections is more influential in decision-making than weak tie information [24]. In spite of its importance, eWOM tie strength has not been studied extensively. O’Connor [11] suggests, in an information intensive situation, consumers actively seek out the opinions of others as a meane to manage risk. eWOM is perceived to be more relevant, easier to use and more trustworthy, than marketer-provided information [52,53].
Steffes and Burgee [54] investigated the value of traditional WOM and eWOM in the students’ course decision-making process. The study results indicate that eWOM emanating from online strangers could be equally or more preferred than information from strong tie (friends), which opposes the existing traditional WOM literature that highlights the fact that WOM is effective due to the strong tie between senders and receivers.
Brown et al. [50] who focused on the concept of the consumer brand relationship claim that brands can develop personalities and that consumers can have some kind of relationship with brands. They point out that this idea may also be applicable to websites as well. If websites had personalities, consumers would trust them as they would people. As a result, consumers could develop relationships with websites [50]. Brown et al. [50] conclude that the idea of individual-to-individual social ties is less relevant in an eWOM environment than in a traditional WOM one. Interview subjects appeared to use websites as proxies for individuals and thus, developing tie strength between an information seeker and a website as the individual information source [50]. Based on the results of the studies discussed above, it should be determined whether tie strength is relevant in the context of destination image formation in online discussion environment.
Additionally, consumer perception of the credibility of personal and commercial eWOM should be considered due to the lack of personal knowledge about the motivation of unknown strangers offering recommendations and the possibility of commercial interests being involved with a website or online forum [46,53]. Though personal eWOM tends to be perceived as more credible, other evidence exists as well. To illustrate, on one hand, Goh, Heng, and Lin [55] found that personal eWOM exhibited a stronger impact than commercial eWOM on consumer purchase behavior. Similarly, Gretzel and Yoo [56] suggest that on-line travel reviews are often perceived as more likely to provide up-to-date, enjoyable, and reliable information than content posted by travel service suppliers. On the other hand, Mayzlin [57] found that consumer eWOM could still be persuasive despite the overt promotional intent by firms when eWOM was presented as a mixture of consumer recommendations and disguised firm promotions. Such contradictory findings call for further investigation of the subject.
In the current study, personal WOM includes traditional WOM and personal eWOM (independent user-generated content), while commercial eWOM exchanges include virtual communities, blogs, websites, review sites, news groups, social networking sites, and emails obtained though commercial channels. Comparing tie strength with personal and commercial WOM, we hypothesize:
H2.
Personal WOM perceptions has greater effect on vacation travel consumers’ perceived destination image compared to commercial eWOM perceptions.

2.9. Positive and Negative Electronic Word-of-Mouth

As stated previously, in the context of traditional WOM, negative WOM influences consumers’ brand evaluations more than positive WOM does [25,35]. However, vivid WOM or brand attributions mediate the relation between negative WOM messages and evaluation of products [36,37]. It is likely that the information contained in negative WOM is more complex than information that includes only positive WOM. Park and Lee [58] report that the effect of eWOM on products purchasing decision is greater for negative eWOM than for positive eWOM. Negative eWOM effect appears to be more significant when eWOM is used for experience goods rather than for search goods [58]. Experience goods can sustain greater damage from the eWOM due to negative eWOM that magnifies consumers’ prevailing uncertainty and fear initiated by poor cognitive knowledge of experience goods [58]. Because tourism services can be categorized as experience products with a large uncertainty component, the negative eWOM effect may be more significant than for other products [19].
Conversely, in a study using attribution theory, Chatterjee [46] investigated the effect of negative online reviews on consumers’ evaluation and patronage intentions. The author reports that the consumer’s familiarity with the product provider mitigates the harmful effect of negative consumer eWOM on perceived reliability of product provider and purchase intention [46]. As familiarity is one of the most important trust-signals through which consumers reduce risk and build trust when they purchase products online [59], it may be easier to build a strong bond between consumers and product providers in online forum rather than in face-to-face traditional WOM.
Generally, negative reviews are more useful compared to positive reviews; however, each product category has a different magnitude of negative eWOM impact [60]. Consumers feel that reviewers’ negative comments about utilitarian products are motivated by a desire to accurately inform other buyers and that these comments are more likely to be based on reviewers’ true experience or feelings. However, in the case of negative hedonic reviews, consumers feel that the negative reviews are not related to product quality and that they are guided by internal reasons [60]. As the products of tourism can be categorized as hedonic products, consumers may not rely on negative eWOM about their tourism destination expressed in online reviews. As shown by Vermeulen and Seegers [61], a single negative online review generally does not cause much harm, whereas a single positive online review can do a lot of good. One of the reasons for that might be the fact that the majority of reviews tend to be positive [62]. Nevertheless, due to the lack of consensus on the matter the following hypotheses were proposed:
H3a.
In the process of destination image formation, vacation travel consumers are more affected by negative WOM perceptions compared to positive WOM ones.
H3b.
In the process of destination image formation, vacation travel consumers are less affected by negative eWOM perceptions compared to negative traditional WOM ones.
A hypothesized integrated model is presented in Figure 1.

3. Methods

3.1. Sample

A convenience sampling method was used to recruit visitors who registered in the Branson tourists’ database and to recruit the actual tourists who had visited Branson Welcome Center (Branson, MO, USA) during the survey period. To determine the sample size, a confidence interval approach and the following formula was used [63]:
n = z 2 ( p σ ) e 2 = 1.96 2 ( 0.5 ) ( 1 0.5 ) 0.05 2 = 385
where z is standard error associated with a 95% level of confidence (1.96); p is the estimated variability in the population (50% is widely used in social science research); q = (1−p); and e is the acceptable error ±5% confidence interval in this study. The study utilized a descriptive research design using a cross-sectional sample survey to project the results of the sample to the overall population in online and actual face-to-face survey setting.

3.2. Survey Instrument

The survey included questions measuring the level of WOM perceptions, both traditional and electronic, on the participants’ travelling to Branson. The questions were adopted from Mack, Blose, and Pan’s study [64].
To measure information perceptions as positive or negative WOM, Flynn, Goldsmith, and Eastman’s opinion-seeking scale was used [65]. In particular, respondents were asked to evaluate the contents of different types of WOM that they had checked prior to coming to Branson. A 7-point scale ranging from 1 (very negative) to 7 (very positive) was used for this assessment.
To examine overall destination image, respondents were asked to evaluate Branson as a “good place to visit” using a 7-point scale ranging from 1 (strongly disagree) to 7 (strongly agree). Finally, the survey included questions assessing participants’ general demographic information. A pilot test was conducted at Branson Welcome Center using a simple random sampling approach. Based on the results of the pilot test and respondents’ suggestions, positive and negative WOM perception questions were revised and reduced.

3.3. Data Collection and Analysis

Visitors who visited Branson in the past and registered in the Branson tourists’ database received an e-mail invitation. When the respondent’s residence was less than 100 miles away from Branson, such data was excluded. Additionally, face-to-face survey at Branson Welcome Center was conducted. However, face-to-face data collection yielded very low response rate. Consequently, on-line approach was applied to obtain the required number of responses. The data was analyzed using SPSS. Descriptive statistics was used to analyze respondents’ demographic characteristics. To assess the measure components, principal component factor analysis and reliability analysis were used. Finally, multiple linear regression, confidence intervals comparison using bootstrap, and one-way analysis of variance (ANOVA) were conducted for hypotheses testing.

4. Results

A total of 976 usable questionnaires were obtained after the screening test. The majority of respondents, 64.7%, were females. Such gender distribution may have affected the destination image perception because females are more likely to emphasize such dimensions as infrastructure and natural environment when assessing destination image [66]. A big proportion of respondents, 31.0%, were over 61 years of age. Most of the respondents, 41.9%, were empty nesters. Such trend could most likely be attributed to the fact that the majority of respondents were retirees and Branson as a destination is geared toward such demographic group.
Traditional WOM was the most frequent source of information the respondents used prior to visiting Branson and was mentioned in 43.5% of responses. Electronic WOM information sources comprised 33.7% of the total indicated sources of information (Commercial eWOM 32.1% + Personal eWOM 1.6%). The summary of demographic characteristics of the respondents is shown in Table 1.

4.1. Factor and Reliability Analysis

Factor analysis was used to test for internal consistency of three underlying dimensions of WOM perceptions which were analyzed in this study (in particular traditional WOM, personal e-WOM, commercial e-WOM perceptions). Items measuring visitors’ WOM perceptions when planning a trip to Branson (9 out of 13 items excluding four screening items) were factor analyzed. The varimax rotation method was used for that purpose. To test factor loadings, an exploratory factor analysis was employed. The dimensions were split as planned into traditional WOM, personal eWOM, and commercial eWOM perceptions. The Kaiser-Mayer-Olkin Measure of Sampling Adequacy (KMO) was 0.830, which was well above recommended 0.50 and Bartlett’s Test of Sphericity value was significant (6288, p < 0.005, which indicated an appropriate validation of the factor model. The factor loadings were all greater than 0.70, indicating high internal consistency within the proposed dimensions. High communalities of all items, ranging from 0.722 to 0.856, demonstrated that the common factors explained the variance in WOM constructs fairly well. Additionally, Cronbach’s alphas for all three factors were higher than recommended 0.70 [67], (p. 137). Therefore, all tested items passed reliability test and all three factors were considered relevant in this study (See Table 2).

4.2. Hypothesis Testing

A linear regression test was performed to test if traditional WOM has a higher impact on perceived image than electronic WOM (Hypothesis 1). The effects of information retrieved by visitors from different sources of WOM prior to visiting to Branson on destination’s image were analyzed. A single item measure of visitor’s overall perception of Branson’s image as a “good place to visit” was used as a dependent variable. Items measuring visitors’ experience of different types of Branson related WOM such as personal (traditional WOM), electronic communication (personal eWOM) and online sources (eWOM) were used as independent variables. Tolerance and VIF diagnostic tests indicated that multicollinearity was not an issue in the tested regression equation with Tolerance > 0.1, and VIF < 5.0. The results revealed that all of the three factors emerged as significant predictors of overall destination image (F = 64.136, p = 0.001) (see Table 3).
The F-statistic for the model was highly significant (p < 0.001, which shows that the overall goodness of fit of the model was high. The value of adjusted R² for the model was equal to 0.16. Thus, visitor’s experience of different types of WOM prior to their visit explained around 16% of total variation of Branson’s image perception. Standardized betas were statistically significant for all types of WOM, thus, it can be concluded that all three types of WOM perceptions had a significant impact on destination’s image. Consequently, an additional procedure was implemented to test if traditional WOM perceptions had a greater effect on perceived destination image than electronic WOM perceptions. In particular, the 50% overlap of confidence intervals rule was used to test whether traditional WOM perception had higher impact on perceived destination image than commercial eWOM perception [68]. According to Cumming [68], if confidence intervals for two variables overlap by less than 50% than, it gives a sufficient evidence to conclude that two beta coefficients are significantly different [68]. 95% confidence intervals for three variables were calculated via bias corrected bootstrap. The pairwise comparisons of 95% confidence intervals between commercial eWOM and traditional WOM perceptions, and personal eWOM and traditional WOM perceptions show that the confidence interval for traditional WOM is located above the confidence intervals for Personal eWOM and Commercial eWOM and does not overlap with any of them (Table 4). Thus, there is sufficient evidence to conclude that traditional WOM perception is significantly different from electronic (personal and commercial) WOM perceptions at 1% significance level, and that traditional WOM perception has a greater effect on overall destination image. Hypothesis 1 was supported.
Hypothesis 2 examined whether personal WOM perception had a greater effect on perceived destination image compared to commercial WOM. Cumming’s [68] 50% overlap of confidence intervals rule was used for to test it as well. Based on the Table 4 results, the confidence intervals for traditional WOM perception are located above the confidence interval for Commercial eWOM perception, and these confidence intervals do not overlap. Thus, there is a significant difference between beta coefficients for traditional personal and commercial eWOM perceptions at 1% significance level, and traditional WOM perception has a greater influence on the overall image of a destination.
At the same time, confidence intervals for personal eWOM perception and commercial eWOM perception overlap by more than 50% (Table 4). Thus, there is no significant difference between beta coefficients of personal and commercial eWOM. Consequently, the Hypothesis 2 was only partially supported.
With regard to Hypotheses 3a and 3b, a one-way ANOVA test was conducted to assess the differences in the effects among the four variables of positive and negative traditional and electronic WOM perceptions (see Table 5). Statistically significant differences were found for all four WOM perceptions items (positive traditional WOM- F = 9.32, p < 0.001; positive eWOM- F = 4.76, p < 0.001; negative traditional WOM- F = 4.01, p < 0.05; negative eWOM- F = 5.52, p < 0.001). Analysis of the means for four WOM perceptions variables showed that positive WOM perceptions, both traditional and electronic, had a greater influence on destination choice compared to the negative traditional and eWOM perceptions, while negative traditional WOM perception had less pronounced influence compared to negative eWOM perception. The mean of positive WOM perception was higher than the mean of negative WOM perception, both traditional and eWOM cases.
In addition, a multiple linear regression analysis was used to examine if positive traditional and electronic WOM perceptions, and negative eWOM perceptions had different magnitude of effects on destination image in terms of WOM directions (see Table 6).
Tolerance and VIF diagnostic tests showed acceptable levels with Tolerance > 0.1, and VIF < 5.0 and multicollinearity was not an issue. The results indicated that only positive traditional WOM perception was a significant predictor of destination image (F = 6.74, p < 0.001) with the beta coefficient of 0.125 (p < 0.05). The other three factors of WOM items were not statistically significant (p > 0.05). These four WOM items accounted 2.9 percent of the variance in destination image (R² = 0.029).
Combining ANOVA mean differences and regression analysis together, it was concluded that positive traditional WOM perception was more influential on destination image than negative traditional WOM perception. Thus, the results of Hypothesis 3a that negative WOM influences destination image more than positive WOM was not supported. Concerning Hypothesis 3b, the results indicated significant differences between means of negative traditional WOM and negative eWOM perceptions. The mean of negative eWOM perception was higher compared to the mean of negative traditional WOM one (Table 5). However, the differences in the magnitudes of the effects between negative traditional WOM and negative eWOM perceptions could not be compared because of statistically insignificant regression coefficients.
Such outcomes can be interpreted as an indication that while deciding on a destination, the respondents had more positive perceptions of traditional WOM compared to eWOM. Additionally, the respondents had less negative perceptions of traditional WOM when compared to eWOM.

5. Discussion and Implications

The results of the study support that traditional WOM has greater influence on destination image compared to eWOM, including personal and commercial eWOM. In the category of personal WOM, traditional WOM had a greater effect on destination image compared to commercial eWOM; however, personal eWOM appeared to have smaller effect on destination image compared to commercial eWOM. Additionally, negative traditional WOM had smaller effect on destination image compared to positive traditional WOM. Tourists also seemed to pay less attention to negative eWOM than compared to positive eWOM. At the same time, negative eWOM seemed to grab more of their attention than did negative traditional WOM while considering a travel destination.
Previous studies indicated that WOM emanating from friends and relatives was the most powerful factor in forming tourists’ destination image [5,19]. The results of Hypothesis 1 supported that notion. Even though both traditional WOM and commercial eWOM perceptions had a statistically significant impact on how the respondents viewed Branson, traditional WOM perception had a higher effect than commercial eWOM perception on destination image. Such result corresponds with the idea by Brown et al. [50] that though eWOM generates some kind of “authority” it is also viewed as more biased. In other words, tourists tend to be somewhat skeptical about eWOM and that is reflected on how they view it. They perceive eWOM as some kind of supplemental information source.
Previous studies show that personal WOM tend to be more influential than commercial WOM on receivers’ decision-making [24,32]. The results of this study were in line with previous findings as both types of personal WOM perceptions examined in this study (traditional and personal electronic) were found to have significant effect on the destination perception. At the same time, this study indicated important differences between personal electronic and face-to-face WOM perceptions. Traditional WOM perception had a higher influence on destination image than commercial eWOM perception. However, personal eWOM perception did not differ significantly in the level of influence on destination image and choice from commercial eWOM perception.
If commercial eWOM, such as websites and review sites, which were found to be more sought-after compared to other commercial eWOM in this study, were vividly presented to information receivers, they could have had a stronger effect on destination image compared to duly present personal eWOM [36]. In reality, Branson as a tourist destination, has well organized official website including tourist reviews. Such website may have stronger effect on tourists than personal eWOM.
Generally, negative WOM has a larger effect on product evaluation than positive WOM [25,35]. However, in the context of electronic WOM, negative eWOM has more influence on destination image than positive eWOM, but less influence than negative traditional WOM due to hedonic nature of tourism products [58,60]. The results of this study, however, showed a different trend, which corresponds with Vermeulen and Seegers [61]. The findings revealed that positive traditional WOM perception had greater influence on destination image compared to negative traditional WOM perception.
The observed tendency might be due to such conditions or configurations as high consensus, high distinctiveness, and high consistency of WOM [39]. Because Branson has distinctive characteristics that identify it as a fun place, many tourists visit Branson repeatedly, some of them more than 12 times. That is why the WOM information about Branson is mostly characterized by high consensus, high distinctiveness, and high consistency with positive connotation. This may be the reason why positive WOM rather than negative WOM both traditional and electronic tended to influence the respondents more.
Although some previous research emphasized that negative WOM exceeds the effect of positive WOM, this might not hold for destination products, as shown in Kim’s study [39] and Vermeulen and Seegers [61]. Combination of WOM configurations may change travelers’ perceptions in a completely different way.

5.1. Managrial Implications

The results of the current study indicate that traditional WOM seems to have the most pronounced effect on destination image. However, the power of eWOM should not be overlooked. Since the Internet provides easy access to information with minimum time and costs involved, prospective tourists are likely to take advantage of eWOM information as a supplementary information source. The results also indicate that negative WOM is likely to have a smaller effect on tourists’ perceptions of a destination compared to positive WOM. Accordingly, it is good news for marketers because the tourists seem not to consider negative WOM seriously, especially in a situation of repeat visits. Positive image developed by positive WOM dominates in their mind.
It is difficult for practitioners to observe and control traditional WOM because traditional WOM is usually exchanged in private conversations and is ephemeral. However, eWOM is more manageable because the messages about destination are posted online and are easily accessible. For tourism practitioners, observing messages posted on review sites may help monitoring different kinds of destination images in a timely and cost effective way.
It is possible to analyze the review messages by categorizing destination image dimensions. The review items can be divided into such categories as infrastructure and socioeconomic environment, atmosphere, natural environment, and cultural environment. Satisfaction with those items can be measured on a ratio scale. Positive and negative reviews can also be measured quantitatively by counting the numbers of positive or negative words reviewers used. When specific problematic attribution is found in the destination image, environmental impact assessment should be conducted. By contentiously working with such destination image assessment, continuous tourism stream can be developed in the destination.
The basic strategy should include actions reducing negative eWOM messages and utilizing the following steps:
(1)
Conduct inventory of positive and negative WOM messages and categorize them by levels of satisfaction or dissatisfaction.
(2)
Evaluate positive and negative WOM trends by analyzing WOM dimensions such as consensus, distinctiveness, and consistency.
(3)
Evaluate reviewers’ travel expertise and socio-demographic characteristics.
(4)
Utilize statistical analysis to examine the overall destination image and factors affecting destination image to the greatest extend.
(5)
Set goals and objectives to reduce negative destination image.
(6)
Examine alternatives to reduce negative destination image.
(7)
Select preferred alternatives.
(8)
Develop implementation strategy.
(9)
Implement.
(10)
Evaluate.
By contentiously working with such destination image assessment, continuous tourism stream can be developed in the destination. Additionally, the fact that negative eWOM reviews match the reality of the destination should be carefully evaluate because review message may include misunderstanding or exaggerating by reviewers.

5.2. Limitations and Recommendations for Future Research

The current study has several limitations. First, the study evaluated WOM perceptions in a specific destination, Branson (Missouri), which limits the generalizability of findings. Although Branson region was purposefully chosen, other destinations should be examined to assess transferability of the current findings. Second, convenience sampling technique limits generalizability of the findings. Third, this study did not measure or control for respondents’ level of brand attribution or familiarity with online sites to test eWOM perception effects on destination image. Fourth, the adopted measurement scales allowed capturing only limited range of customer responses. In addition, finally, the demographic profile of the respondents limits generalizability of the results. The majority of the sample was comprised of elderly people who tend to be less proficient with technology and on-line communication.
Future studies should integrate different combinations of WOM factors that would produce the greatest effects on multiple dimensions of destination image. Moreover, factors that can possibly moderate WOM effects on destination image, such as tourists’ sociodemographic characteristics, advanced online information media source, geographical and infrastructural conditions should also be examined.

Author Contributions

These authors contributed equally.

Conflicts of Interest

The authors declare no conflict of interest.

References

  1. Gartner, W.C. Image Formation Process. J. Travel Tour. Mark. 1993, 2, 191–216. [Google Scholar] [CrossRef]
  2. Hanlan, J.; Kelly, S. Image formation, information sources and an iconic Australian tourist destination. J. Vacat. Mark. 2004, 11, 163–177. [Google Scholar] [CrossRef]
  3. Tapachai, N.; Waryszak, R. An examination of the role of beneficial image in tourist destination selection. J. Travel Res. 2000, 39, 37–44. [Google Scholar] [CrossRef]
  4. Martin, H.S.; Rodriguez del Bosque, I.A. Exploring the cognitive-affective nature of destination image and the role of psychological factors in its formation. Tourism Manag. 2008, 29, 263–277. [Google Scholar] [CrossRef]
  5. Baloglu, S.; McCleary, K.W. A model of destination image formation. Ann. Tour. Res. 1999, 26, 868–897. [Google Scholar] [CrossRef]
  6. Beerli, A.; Martin, J.D. Factors influencing destination image. Ann. Tour. Res. 2004, 31, 657–681. [Google Scholar] [CrossRef]
  7. Litvin, S.W.; Goldsmith, E.R.; Pan, B. Electronic word-of-mouth in hospitality and tourism Managment. Tourism Manag. 2008, 29, 458–468. [Google Scholar] [CrossRef]
  8. Blal, I.; Sturman, M. The differential effects of the quality and quantity of online reviews on hotel room sales. CQ 2014, 55, 365–375. [Google Scholar] [CrossRef]
  9. Torres, E.N.; Adler, H.; Behnke, C.; Miao, L.; Lehto, X. The Use of Consumer-Generated Feedback in the Hotel Industry: Current Practices and Their Effects on Quality. Int. J. Hosp. Tourism Adm. 2015, 16, 224–250. [Google Scholar] [CrossRef]
  10. Jeong, E.; Jang, S. Restaurant experiences triggering positive electronic word-of-mouth (eWOM) motivations. Int. J. Hosp. Manag. 2011, 30, 356–366. [Google Scholar] [CrossRef]
  11. O’Connor, P. Managing a hotel’s image on TripAdvisor. JHMM 2010, 19, 754–772. [Google Scholar] [CrossRef]
  12. Govers, R.; Go, F.M.; Kumar, K. Promoting tourism destination image. J. Travel Res. 2007, 46, 15–23. [Google Scholar] [CrossRef]
  13. Pavlou, P.A.; Dimoka, A. The nature and role of feedback text comments in online marketplaces: Implications for trust building, price premiums, and seller differentiation. Inf. Syst. Res. 2006, 18, 392–414. [Google Scholar] [CrossRef]
  14. Ye, Q.; Law, R.; Gu, B. The impact of online user reviews on hotel room sales. Int. J. Hosp. Manag. 2009, 28, 180–182. [Google Scholar] [CrossRef]
  15. Cox, C.; Burgess, S.; Sellito, C.; Buultjens, J. The role of user-generated content in tourists’ travel planning behavior. JHMM 2009, 18, 746–764. [Google Scholar] [CrossRef]
  16. Senecal, S.; Nantel, J. The influence of online product recommendations on consumers’ online choices. J. Retailing 2004, 80, 159–169. [Google Scholar] [CrossRef]
  17. Murray, K.B.; Schlacter, J.L. The impact of services versus goods on consumers’ assessment of perceived risk and variability. J. Acad. Market. Sci. 1990, 18, 51–65. [Google Scholar] [CrossRef]
  18. Murray, K.B. A test of services marketing theory: Consumer information acquisition activities. J. Mark. 1991, 55, 10–25. [Google Scholar] [CrossRef]
  19. Ng, S.; David, M.; Dagger, T. Generating positive word-of-mouth in the service experience. MSQ 2011, 21, 133–151. [Google Scholar] [CrossRef]
  20. Kinard, B.; Capella, M. Relationship marketing: the influence of consumer involvement on perceived service benefits. J. Serv. Mark. 2006, 20, 359–368. [Google Scholar] [CrossRef]
  21. Bone, P.F. Word-of-mouth effects on short-term and long-term product judgments. J. Bus. Res. 1995, 32, 213–223. [Google Scholar] [CrossRef]
  22. Zeithaml, V.A.; Bitner, M.J. Services Marketing; McGraw Hill: New York City, NY, USA, 1996. [Google Scholar]
  23. Xiang, Z.; Gretzel, U. Role of social media in online travel information search. Tourism Manag. 2010, 31, 179–188. [Google Scholar] [CrossRef]
  24. Brown, J.J.; Reingen, P.H. Social ties and word-of-mouth referral behavior. J. Consum. Res. 1987, 14, 350–362. [Google Scholar] [CrossRef]
  25. Arndt, J. Role of product-related conversations in the diffusion of a new product. J. Mark. Res. 1967, 4, 291–295. [Google Scholar] [CrossRef]
  26. Sparks, B.A.; Browning, V. The impact of online reviews on hotel booking intentions and perception of trust. Tourism Manag. 2011, 32, 1310–1323. [Google Scholar] [CrossRef] [Green Version]
  27. Gallarza, M.G.; Saura, I.G.; Garcia, H.C. Destination image towards a conceptual framework. Ann. Tourism Res. 2002, 29, 56–78. [Google Scholar] [CrossRef]
  28. Tasci, A.D.; Gartner, W.C. Destination image and its functional relationships. J. Travel Res. 2007, 45, 413–425. [Google Scholar] [CrossRef]
  29. Crompton, J.L. An assessment of the image of Mexico as a vacation destination and the influence of geographical location upon that image. J. Travel Res. 1979, 17, 18–23. [Google Scholar] [CrossRef]
  30. Hunt, J.D. Image as a factor in tourism development. J. Travel Res. 1975, 13, 1–7. [Google Scholar] [CrossRef]
  31. Echtner, C.M.; Ritchie, J.R.B. The meaning and measurement of destination image. J. Tour. Stud. 1991, 14, 37–48. [Google Scholar]
  32. Bansal, S.H.; Voyer, A.P. Word-of-mouth processes within a services purchase decision context. J. Serv. Res. 2000, 3, 166–177. [Google Scholar] [CrossRef]
  33. Bieger, T.; Laesser, C. Information sources for travel decisions: Toward a Source Process Model. J. Trav. Res. 2004, 42, 357–371. [Google Scholar] [CrossRef]
  34. Torres, E.N.; Singh, D.; Robertson-Ring, A. Consumer reviews and the creation of booking transaction value: Lessons from the hotel industry. Int. J. Hosp. Manag. 2015, 50, 77–83. [Google Scholar] [CrossRef]
  35. Mizerski, R.W. An attribution explanation of the disproportionate influence of unfavorable information. J. Consum. Res. 1982, 9, 301–310. [Google Scholar] [CrossRef]
  36. Herr, P.M.; Kardes, F.R.; Kim, J. Effects of word-of-mouth and product attribute information on persuasion: An accessible-diagnosticity perspective. J. Consum. Res. 1991, 17, 454–462. [Google Scholar] [CrossRef]
  37. Laczniak, R.N.; DeCarlo, T.E.; Ramaswami, S.N. Consumers’ responses to negative word-of-mouth communication: An attribution theory perspective. J. Consum. Psychol. 2001, 11, 57–73. [Google Scholar] [CrossRef]
  38. East, R.; Hammond, K.; Lomax, W. Measuring the impact of positive and negative word of mouth on brand purchase probability. Int. J. Market. Res. 2008, 25, 215–224. [Google Scholar] [CrossRef]
  39. Kim, Y.S. Business vs. leisure travelers: Their responses to negative word-of-mouth. JAAB 2009, 15, 70–76. [Google Scholar]
  40. Kasavana, M.; Nusair, K.; Teodosic, K. Online social networking: Redefining the human web. J. Hosp. Manag. Tourism 2010, 1, 68–82. [Google Scholar] [CrossRef]
  41. Sen, S. Determinants of consumer trust of virtual word-of-mouth: An observation study from a retail website. JAAB 2008, 14, 30–35. [Google Scholar]
  42. Godes, D.; Mayzlin, D. Using online conversations to study word-of-mouth communication. Mark. Sci. 2004, 23, 545–560. [Google Scholar] [CrossRef]
  43. Rezabakhsh, B.; Bornemann, D.; Hansen, U.; Schrader, U. Consumer power: A comparison of the old economy and the Internet economy. J. Consum. Policy 2006, 29, 3–36. [Google Scholar] [CrossRef]
  44. Dellarocas, C. The digitization of word of mouth: Promise and challenges of online feedback mechanisms. Manag. Sci. 2003, 49, 1407–1424. [Google Scholar] [CrossRef]
  45. Kiecker, P.; Cowles, D. Interpersonal communication and personal influence on the Internet: A framework for examining online word-of-mouth. J. E. M. 2001, 11, 71–88. [Google Scholar] [CrossRef]
  46. Chatterjee, P. Online reviews: Do consumer use them? Adv. Consum. Res. 2001, 28, 129–133. [Google Scholar] [CrossRef]
  47. Henning-Thurau, T.; Gwinner, K.P.; Walsh, G.; Gremler, D.D. Electronic word-of-mouth via consumer-opinion platforms: What motivates consumers to articulate themselves on the Internet? J. Interact. Mark. 2004, 18, 38–52. [Google Scholar] [CrossRef]
  48. Park, S.; Allen, J. Responding to online reviews: Problem solving and engagement in hotels. CQ 2013, 54, 64–73. [Google Scholar] [CrossRef]
  49. Goldsmith, R.E.; Horowitz, D. Measuring motivations for online opinion seeking. J. Interact. Advert. 2006, 6, 1–16. [Google Scholar] [CrossRef]
  50. Brown, J.; Broderick, A.J.; Lee, N. Word of mouth communication within online communities: Conceptualizing the online social network. J. Interact. Mark. 2007, 21, 2–20. [Google Scholar] [CrossRef]
  51. Bickart, B.; Schindler, R.M. Internet forums as influential sources of consumer information. J. Interact. Mark. 2001, 15, 31–39. [Google Scholar] [CrossRef]
  52. Schmallegger, D.; Carson, D. Blogs in tourism: Changing approaches to information exchange. J. Vacat. Mark. 2007, 14, 99–110. [Google Scholar] [CrossRef]
  53. Zhang, Z.; Ye, Q.; Law, R.; Li, Y. The impact of e-word-of-mouth on the online popularity of restaurants: A comparison of consumer reviews and editor reviews. Int. J. Hosp. Manag. 2011, 29, 694–700. [Google Scholar] [CrossRef]
  54. Steffes, E.M.; Burgee, L.E. Social ties and online word of mouth. Int. Res. 2009, 19, 42–59. [Google Scholar] [CrossRef]
  55. Goh, K.; Heng, C.; Lin, Z. Social media brand community and consumer behavior: Quantifying the relative impact of user- and marketer-generated content. ISR 2013, 24, 88–107. [Google Scholar] [CrossRef]
  56. Gretzel, U.; Yoo, K. Use and impact of online travel reviews. In Information and Communication Technologies in Tourism; O’Connor, P., Hopken, W., Gretzel, U., Eds.; Springer: Wien, Austria, 2008; pp. 35–46. [Google Scholar]
  57. Mayzlin, D. Promotional chat on the Internet. Market. Sci. 2006, 25, 155–163. [Google Scholar] [CrossRef]
  58. Park, C.; Lee, T.M. Information direction, website reputation and eWOM effect: A moderating role of product type. J. Bus. Res. 2009, 62, 61–67. [Google Scholar] [CrossRef]
  59. Einwiller, S.; Geissler, U.; Will, M. Engendering trust in Internet business using elements of corporate branding. In Proceedings of Americans Conference on Information Systems (AMCIS), Long Beach, CA, USA; 2000; pp. 733–739. [Google Scholar]
  60. Sen, S.; Lerman, D. Why are you telling me this? An examination into negative consumer reviews on the web. J. Interact. Mark. 2007, 21, 76–94. [Google Scholar] [CrossRef]
  61. Vermeulen, I.E.; Seegers, D. Tried and tested: The impact of online hotel reviews on consumer consideration. Tourism Manag. 2009, 30, 123–127. [Google Scholar] [CrossRef]
  62. Melian-Gomez, S.; Bulchand-Gidumal, J.; Gonzalez-Lopez, B. Online customer reviews: As participation increases, better evaluation is obtained. CQ 2013, 54, 274–283. [Google Scholar]
  63. Burns, A.C.; Bush, R.F. Marketing Research: Online Research Applications; Pearson Prentice Hall: Upper Saddle River, NJ, USA, 2005. [Google Scholar]
  64. Mack, R.W.; Blose, J.E.; Pan, B. Believe it or not: Credibility of blogs in tourism. J. Vacat. Mark. 2007, 14, 133–144. [Google Scholar] [CrossRef]
  65. Flynn, L.R.; Goldsmith, R.E.; Eastman, J.K. Opinion leaders and opinion seekers: Two new measurement scales. J. Acad. Market. Sci. 1996, 24, 137–147. [Google Scholar] [CrossRef]
  66. Chen, P.; Kerstetter, D.L. International students’ image of rural Pennsylvania as a travel destination. J. Travel Res. 1999, 37, 256–266. [Google Scholar] [CrossRef]
  67. Hair, J. Multivariate Data Analysis; Prentice Hall: Upper Saddle River, NJ, USA, 2006. [Google Scholar]
  68. Cumming, G. Inference by eye: Reading the overlap of independent confidence intervals. Stat. Med. 2009, 28, 205–220. [Google Scholar] [CrossRef] [PubMed]
Figure 1. Integrated Model of Effects of Traditional and Electronic WOM on Destination Image.
Admsci 06 00012 g001
Table 1. Demographic Characteristics of Respondents (N = 976).
DemographicsN%
Gender
Female63164.7
Male34535.3
Age
Over 6130331.0
51–6026627.3
36–5029229.9
22–3510010.2
Under 21151.5
Education
Elementary and Junior20.2
High School31131.9
2-year college25325.9
4-year college27528.2
Master’s degree11511.8
Doctorate Degree202.0
Income
Under $24,999596.0
$25,000–$49,00023724.3
$50,000–$74,99931832.6
$75,000–$99,99919920.4
$100,000 and above16316.7
Table 2. Factor Analysis of Three Factors Solution for WOM Perceptions concerning travel to Bronson.
ItemsLoadingsCommunality
123
Traditional WOM Perceptions
I feel more comfortable travelling when I have gotten opinions from people I know face-to-face.0.889 0.825
When I consider travelling, I ask other people face-to-face for opinions and advice.0.861 0.790
Face-to-face communication with people I know influences my choice of travel.0.808 0.752
Personal eWOM Perceptions
I feel more comfortable travelling when I have gotten opinions from people I know electronically. 0.870 0.856
Electronic communication with people I know influences my choice of travel. 0.810 0.814
When I consider traveling, I ask people I know to give me advice via electronic tools such as e-mails, instant messaging, etc. 0.804 0.742
Commercial eWOM Perceptions
I feel more comfortable travelling when I have gotten other people’s online travel opinions. 0.8570.834
When I consider traveling, I seek opinions and advice online from commercial and independent sources. 0.8430.722
Online opinions influence my choice of travel. 0.8340.787
Total
Chronbach’s Alpha0.8600.8800.8530.869
KMO0.830
Bartlett6287.937
Significance0.001
Table 3. The effects of Traditional and eWOM Perceptions on Perceived Destination Image.
Independent VariableAdjusted R²FSig.BetaTSig.VIF
0.1670.16564.1360.000
(Constant) 3.6818.850.000 **
Traditional WOM Perception 0.3309.380.000 **1.31
Personal e-WOM Perception 0.0802.080.038 *1.70
Commercial e-WOM Perception 0.1002.780.006 *1.41
* p < 0.05, ** p < 0.001.
Table 4. Confidence intervals for Traditional WOM and Personal and Commercial eWOM Perceptions.
ConditionIndependent VariableBeta95% Confidence Interval
Lower BoundUpper Bound
Bootstrap
(Constant)−0.002−0.0600.050
Traditional WOM Perception0.3200.2300.410
Personal eWOM Perception0.080−0.0100.170
Commercial eWOM Perception0.0100.0200.180
Table 5. ANOVA Results.
SourceMeanStd.Dev.dfMSFp
Positive Traditional WOM4.740.8446.369.320.000 **
Positive eWOM4.420.9354.094.760.000 **
Negative Traditional WOM2.821.0554.394.010.001 *
Negative eWOM3.061.1456.965.520.000 **
* p < 0.05; ** p < 0.001.
Table 6. The effects of Positive and Negative WOM on Destination Image.
Independent VariableRFp-ValueBetaT-Valuep-Value
0.170.036.730.000 **
Constant 5.99
Positive Traditional WOM Perception 0.132.620.01 *
Positive eWOM Perception −0.01−0.110.91
Negative eWOM Perception −0.09−1.680.09
Negative traditional WOM Perception 0.010.240.80
* p < 0.05; ** p < 0.001.

