Evolving Government Information Processes for Service Delivery: Identifying Types & Impact


KU Leuven Public Governance Institute, KU Leuven, 3000 Leuven, Belgium
*
Author to whom correspondence should be addressed.
Adm. Sci. 2018, 8(2), 15; https://doi.org/10.3390/admsci8020015
Submission received: 27 February 2018
/
Revised: 10 April 2018
/
Accepted: 30 April 2018
/
Published: 3 May 2018
(This article belongs to the Special Issue Innovating Public Sector through Digitalization)
Abstract
:The fulfilment of government objectives is dependent on information. Traditionally, this information originates from a classic process of input, (processing) activities, and output. However, in light of increased intergovernmental data sharing, the movement towards open data and opportunities concerning big data, traditional government information processes are evolving. This article aims to bring insight into these evolutions by creating a typology. Based on the typology, the paper further reflects on the impact these evolutions have on the processes and creation, delivery and improvement of public service.
1. Introduction
Information and governments are bounded together. Their committed relationship has a long history, dating, for instance, already back from the early censuses in Ancient Rome, and continuing on in recent developments that concern biometric population registration systems in developing countries (Breckenridge and Szreter 2012). Governments need, process, and use information for various objectives such as resource management, tax collection, the granting of rights to citizens (e.g., social benefits, land property ownership, driving licenses), the enforcement of regulations, the ensuring of public health, and national security, etc. (e.g., Dunleavy et al. 2008; Gitelman 2013; Henninger 2013; Higgs 2004; Lyon 2014).
In order to realize those objectives, data input must be turned into usable output information. Viewed from a traditional sequential pattern (Van Dooren et al. 2015), the government information process can be described as a pathway of three steps:
- (1)
- the collection of initial data serving as information input;
- (2)
- a range of processing activities to make the input usable and
- (3)
- the availability of output information enabling the achievement of objectives.
The objectives are often embedded within government internal and external services. Hence, data and information are crucial resources for service delivery. Observations of government practices show that the creation of new services or the improvement of existing services affect traditional government information processes. These observations include:
- (a)
- the use of present output information for the achievement of new objectives
- (b)
- better achievement of existing objectives by applying additional data processing activities to the initial data
- (c)
- new sorts of output information, based on the integration of existing output information, leading to new objectives.
Changes in the traditional government information process are inter alia situated within a context of increased intergovernmental data sharing, innovations stimulated by open data, and opportunities concerning big data.
1.1. Research Objectives
In this paper we argue, based on exemplary observations, that governments are employing new approaches of dealing with information in order to create or improve services. The goal of this paper is to grasp how traditional government information processes are evolving by these practices. As the kind of evolutions vary, we believe that the elaboration of an evolution typology has the potential to provide a better understanding about the kind of evolutions that are taking place. Furthermore, the clarification of different evolutions will help to guideline some reflections on how the evolutions concerning traditional government information processes impact the processes and government service creation in general.
As a summary, this paper aims
- (1)
- to provide insight into how the traditional government information process is evolving,
- (2)
- to develop a typology of evolutions and
- (3)
- to explore the impact of these evolutions on the information process and service creation, delivery, and improvement.
1.2. Structure of the Paper
Following this introduction, the paper begins Section 2 with an outline and illustration of the traditional government information process. Afterwards, Section 3 explains the methodology to identify evolutions in the traditional government information process. In Section 4 a typology to categorize, describe, and illustrate evolutions in government information processes is outlined and reflected upon. The paper ends in Section 5 with a discussion and recommendation for future research.
2. The Traditional Government Information Process
The traditional government information process, which we drew from the production model of performance (Van Dooren et al. 2015), comprises three steps, as shown in Figure 1. Each process step will be briefly described.
The process starts with input (I) regarding the acquisition of initial data to support government policies, tasks, and services. The data are derived from citizens, companies, government agencies, non-profit organizations (e.g., schools, hospitals) etc. They are gathered by paper or electronic collection methods. These initial data serve as input information which is paramount for government functioning. However, the collection and availability of the initial data in itself is often not sufficient. The data requires transactions and processing in order to become usable.
After the collection of input information, the initial data are subjected to processing activities (A). These activities include for instance data cleansing to ensure the quality of the data. Other activities regard inter alia the analysis of the (cleaned) data as also the visualization and sharing of the data and/or the results of the data analysis. All these activities are intended to make the initial data employable regarding information needs and access rights.
The processing activities lead to information output (O). Output information refers to ready to use information allowing government actors to achieve certain objectives. These objectives comprise, among others, well-informed decision making, sound policy making, effective public service delivery and law enforcement. The information output forms the end-product of the traditional government information process. The end-product is able to assist internal and external services.
Internal services refer to services aimed at assisting government functioning. They deal for instance with financial management, the measurement of organizational performance, the provision of societal information to guideline policies (e.g., economic and demographic statistics) or informational means to monitor compliance with laws and rules (e.g., food safety standards, border control). External services refer to the delivery of public sector services geared towards citizens and private organizations. They comprise inter alia the granting of social benefits to individuals (e.g., social housing), assistance for firms (e.g., subsidies for innovation projects), the provision of information (e.g., health promotion, new laws) or the production of official documents (e.g., passports). These services and related government information processes include either personal or impersonal data. In contrast to impersonal data, personal data can be linked to an individual person (Van Zoonen 2016). As will be discussed later in the typology section, dealing with personal data often brings extra challenges related to the legal (e.g., privacy regulations) and ethical aspects of data collection.
To illustrate the traditional government information process, two general examples are briefly sketched.
- (1)
- The production of national or regional statistics through surveys: Surveys are a traditional instrument for governments to obtain useful societal information. Typical examples include household budget surveys, consumer price index surveys, national health surveys and tourism surveys (see e.g., (Eurostat 2018)). Initial data is collected from citizens or companies who are invited to fulfil questionnaires serving as input (=I). These questionnaires need to be processed. The processing activities such as data cleansing, data analysis, and visualization of the analysis (=A) result in usable statistics (=O). This output facilitates informed decision-making, for instance to improve existing services or develop new services related to social, economic, or health domains.
- (2)
- The granting of benefits by governments: In order to receive particular benefits, applicants (e.g., citizens, companies, non-profit organizations) need to provide initial data such as identity data and data related to the conditions of the benefit, e.g., income and family status of an individual or the type of company or organization (=I). These initial data need to be analyzed by the responsible government agencies or delegated entities. The processing activities, whether manual or automated, involve for instance the verification of the initial data and assessment of these data related to benefit criteria. The results of the analysis (=O) allows an administration to decide if an application is valid and if the service will be offered or rejected.
3. Methodology
This research started with the observation of examples in which government agencies are using information in evolving ways to create or improve internal or external services. The sources of observations included government documents, news articles, and former case study research. Based on an inductive analysis of these examples we searched for patterns that somehow deviated from the normal pattern (Billiet and Waege 2003), which we accordingly classified and explained as a singular traditional government information process consisting of initial data input—processing activities—and information output (see Section 2). Deviations of a singular traditional government information process, intended to support one service or a couple of services, were labelled as evolving activities leading to: (1) expansion of existing output information use, (2) the reinforcing of output information and (3) the rise of new kinds of output information. This pattern recognition resulted in a typology consisting of several types of government information process evolutions. Besides the inductive analysis of the examples, we made use of literature broadly related to e-government in order to provide some theoretical context regarding the evolutions and justify the derived types.
The analyzed examples, which will be provided in Section 4, consist of evolved government information processes within Belgium and the Netherlands. However, similar examples can be found in other countries (see e.g., (Gamage 2016; Munné 2016)) with equivalent capacities to get value out of data and information. Those countries can be considered as countries with high data collection and high information use (Amankwah-Amoah 2015). For instance, both Belgium and the Netherlands score very high on the United Nations E-Government Development Index, which means that their national administrations show a significant will and capacity to use information and communication technologies to deliver public services (United Nations 2016). Therefore, the typology will primarily apply to countries with already a reasonable level of experience, infrastructure, and expertise to leverage data and strategically deploy information.
4. A Typology of Evolutions Concerning the Traditional Government Information Process
Having outlined the traditional government information process and research methodology, this next section proceeds with constructing a typology of three process evolution types in order to better understand the kind of evolutions that occur. They provide insight into how input (I), processing activities (A), and output information (O) may evolve in order to create or improve services. Each of the three process evolution types are subsequently elaborated. They will be (1) textually explained and presented by a figure, (2) illustrated by relevant example(s) of which they were derived, (3) situated in context based on e-government literature, and (4) reflected upon regarding their impact on the process and services.
The section ends with a general overview of the process evolutions types and limitations of the typology.
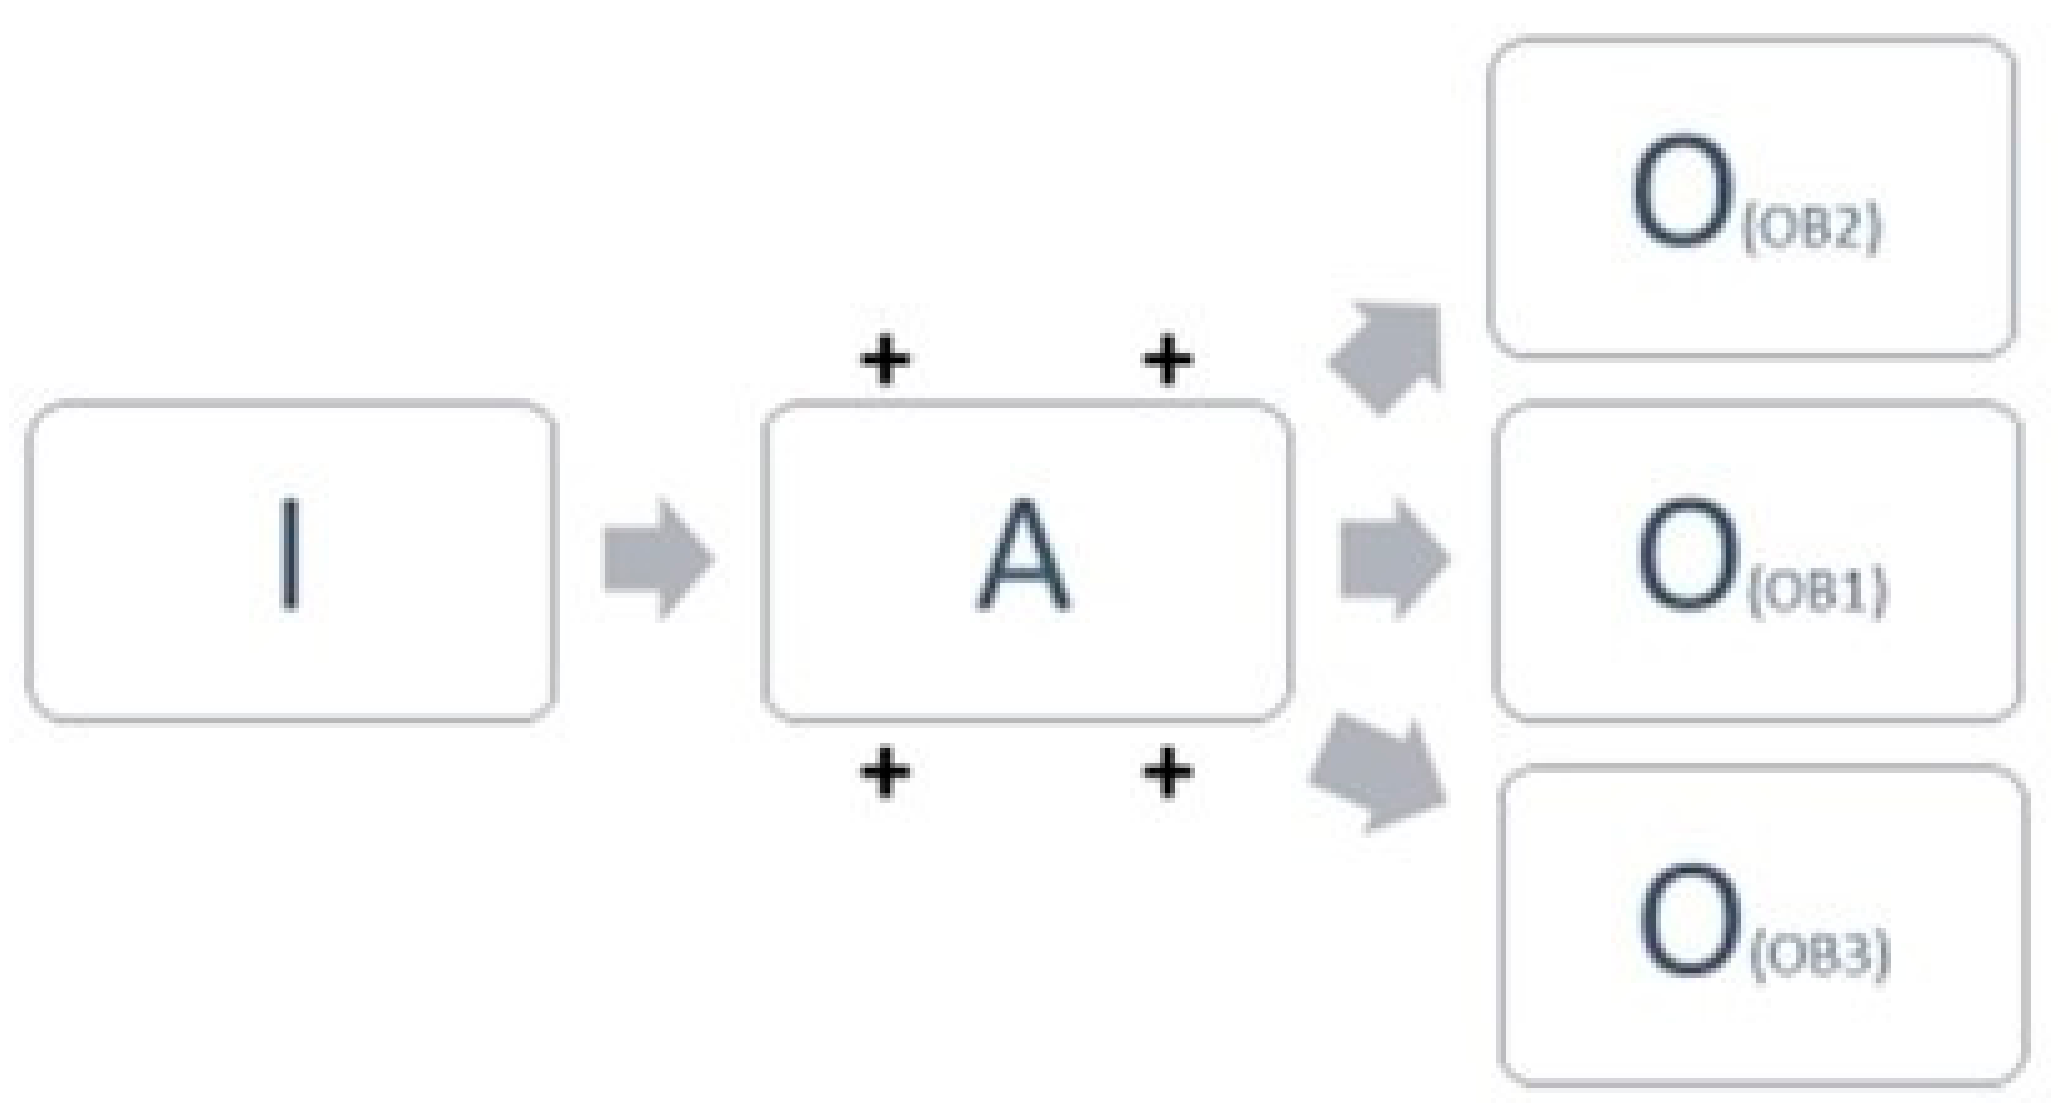
4.1. Process Evolution Type A: Initial Data—New Activities—Expansion of Output Information Objectives
In type A existing output information, originally supporting one or some objectives (OB1), becomes used for new (multiple) objectives as well (OB2, OB3, …) (Figure 2). In other words, the output information is also employed, for new internal or external services. The government actors responsible for the new service make use of an existing information process that implies either moderate or potentially large change. Moreover, the expansion of the objectives requires novel and/or modified activities (+) to process the initial data for additional output information use. These activities include, for instance, the operationalization of novel access rights, the reinforcement of the data infrastructure to handle the increased data inquiries or the connection of information systems from different actors. The original objectives of the output information stay either dominant or become overshadowed by new objectives.
4.1.1. Example: Extensive Use of License Plate Data
Looking at the history of license plates in Belgium, the object evolved from an original instrument for taxation to a data object entailing information on vehicle ownership, insurance status, technical vehicle aspects etc. This information served and continues to serve various objectives, such as the calculation of car taxation, supervision of insurance obligations, compliance of traffic policies, retributions for parking, and crime solutions. Some of these objectives are fulfilled with the assistance of ANPR (Automatic Number Plate Reader) technology. The information streams concerning license plate data are covered by a base registry on vehicles. Although the original taxation objective still exists, the inquiries for license plate data are much broader in other fields. For instance, the recent introduction of the first Belgian low-emission zone for vehicles in the city center of Antwerp, enforced by ANPR-cameras, caused a huge explosion in the demands concerning license plate data (Heijlen and Crompvoets 2017). For the implementation of Antwerp’s low-emission zone, a few hundred thousand vehicles entering the city are monitored on a daily basis linking number plate data to emission norms and owners of vehicles. Accordingly, the use of license plate data has expanded with environmental objectives. To provide access to the demanded information from the base registry, extra processing activities dealing with data quality and infrastructural capacity were required.
4.1.2. Example: The Extensive Use of Camera Networks
Security and ANPR-cameras have for a long time pervaded the life in public areas and private places (Koskela 2000; Spiller 2016). Cameras are often initially installed to serve specific prevention and detection objectives on a local level (e.g., a city wanting to tackle littering, brawling, or traffic incidents in specific city area) or within a specific context (e.g., dealing with vandalism at public transport). In Belgium, legal steps have been taken to facilitate the use by the federal police and intelligence services of (a) the camera networks of the local police units (municipalities, cities) and (b) the camera networks on publically closed areas such as airports (Commissie voor de Bescherming van de Persoonlijke Levenssfeer 2017). Access to the camera data (retrospective of real-time) and new storage obligations, all demanding new data processing activities, need to support broader objectives related to crime investigation and national security.
4.1.3. Context
Making use of an existing government information process for new services fits within the goal to increase intergovernmental data sharing. Many countries are stimulating data sharing between government agencies in order to overcome data silos within the public sector (Liu and Yuan 2015; United Nations 2016). The call for more intergovernmental cooperation, including information sharing, is driven by factors such as cost savings, integrated service delivery, the complexity of societal problems and improved decision-making (Bekkers and Hamburg 2005; Gil-Garcia et al. 2007; Pardo et al. 2008; Van Cauter 2016).
Different strategies have already been employed to enable government-to-government information sharing. The promotion of the “Once only”-principle, aimed at reducing administrative burden by avoiding multiple registrations, is one of them (e.g., Australian Government Information Management Office 2009; OECD 2014). This principle connects with base registries. Base registries are considered to contain accurate up-to-date information on a certain subject (European Commission 2017). The agencies owning this authentic information source are responsible for the data quality, keeping in mind the dependency of other agencies and echelons concerning the produced information (Dumortier and Robben 2010; Janssen et al. 2009). By appointing, recognizing, and using base registries or other authentic information sources government agencies can avoid duplication of data and data infrastructure. Concerning type A, we notice however an ongoing expansion of output information use altering the original objectives for which the data was gathered and processed. As a sudden expansion of objectives for new services often requires extra activities to manage the additional information streams between the information supplier and the new demander(s) (Heijlen and Crompvoets 2017), the existing government information process faces potential pressure.
4.1.4. Impact of the Evolution on the Process and Service Creation, Delivery, and Improvement
Although the process evolution within type A appears at first glance perhaps rather limited considering the fact that it implies the expansion of an existing process for new use(s) and the demander and supplier of information both belong to the public sector, various challenges may precede the implementation of process evolution and new services. The novel processing activities and new objective(s) depend inter alia on legal, judicial, and financial aspects (Van Cauter 2016). Changes in data objectives can for instance be bound by legal principles such as the data protection concept of purpose limitation, meaning the interdiction of processing personal data in ways that are not compatible with the original specific, explicit, and legitimate objective (Article 29 Data Protection Working Party 2013). Hence, when using personal data for a new kind objective, authorization from Data Protection Authorities might be required. Working with impersonal data might show less judicial complexity. Additionally, access to the information output, whether based on personal or impersonal data, relies on the willingness and capacity of the governmental actor that owns the data and information. Intergovernmental trust and viable business models concerning the operating costs of the expanded information demands are, therefore, paramount to manage this evolution in the traditional government information process (see e.g., (Welle Donker and van Loenen 2016)).
4.2. Process Evolution Type B: Initial Data—New Activities—Improved Output Information
In type B the change in the original, traditional information process is marked by improved output information (↑) (see Figure 3). Improved output refers to an output that enables a higher effectiveness in the achievement of objectives for which the output information is intended. This allows enhanced internal or external services. The improvement of output information is caused by new processing activities (+). They comprise for instance the adding of external novel data to the initial data and the introduction of specific advanced analytics leading to innovative insights. The additional data can be publicly shared, state owned or obtained from private actors.
4.2.1. Example: Fraud Detection in Taxation and Social Security
Many governments own traditional initial data (e.g., present in base registries on persons, businesses, employment, or VAT declarations) to detect taxation or social security fraud. This fraud detection is becoming more advanced as novel datasets and/or sophisticated analytic methods are employed. In the Netherlands, social media data like Facebook are used to check for instance incompatibilities between the claims of people (e.g., having none or limited income) and their ownings or activities (Janssen et al. 2017). Furthermore, analytic techniques applied on traditional and new datasets in the field of taxation and social security create risk profiles of persons or organizations supporting the prevention and/or detection of fraud. These practices have already shown positive results in the Netherlands and Belgium (Crompvoets and Van der Voort 2016). The output information for fraud detection provides new insights because of novelties in data processing: adding external data and advanced analytics.
4.2.2. Example: Job Searching Assistance for Unemployed Workers
VDAB, the public employment service of Flanders (Belgium), is introducing big data sources and big data analytics in their operations to innovate and improve their services such as the support to citizens in finding a job (Deloitte 2016; Lesaffer 2017). One of the initiatives includes the combination of initial data (electronic CV’s of unemployed workers) with clickstream data (derived from the VDAB-website) and external data (e.g., from social security and education agencies) followed by the application of statistical analysis, machine learning, and artificial intelligence on these merged, varied datasets. The output of these data processing activities gives VDAB the possibility to provide more customized advice for unemployed workers and orients the employment advisers to those clients with the highest needs.
4.2.3. Context
Examples of process change type B are for instance present within big data projects from the public sector. Big data refers to voluminous, varied, and dynamic datasets which require maximizing computational power and advanced analytics to generate innovative insights (Chen et al. 2012; Gartner 2017; Kitchin 2014; Boyd and Crawford 2012). Big data relates not only to the data itself but also entails its analysis and use (Van der Sloot and Van Schendel 2016). Approached from an overarching perspective, Klievink et al. (2017) characterize big data use as:
- (1)
- the use and the combination of multiple, large datasets, from various sources, both external and internal to the organization;
- (2)
- the use and the combination of structured (traditional) and less structured or unstructured (non-traditional) data in analysis activities;
- (3)
- the use of incoming data streams in real time or near real time;
- (4)
- the development and application of advanced analytics and algorithms, distributed computing, and/or advanced technology to handle very large and complex computing tasks;
- (5)
- the innovative use of existing datasets and/or data sources for new and radically different applications than the data were gathered for or spring from.
The government sector has been identified as a sector that can profit from big data use (e.g., (Kim et al. 2014; McKinsey Global Institute 2011; OECD 2015; Rogge et al. 2017)). Firstly, new sorts of datasets (e.g., social media data, mobile phone data, GPS signals, website clickstream data, sensor data etc.) offer possibilities to combine these data with traditional government information, mainly survey data and administrative data (Giest 2017; Mergel et al. 2016). Secondly, advanced analyzing techniques (e.g., complex algorithms, machine learning and statistic correlations) enable governments to build prediction models, to discover hidden patterns and anomalies, to assess sentiments and to customize service delivery (Deloitte 2016; Mergel et al. 2016; Technopolis Group et al. 2015; Van der Sloot and Van Schendel 2016). These opportunities might alter the traditional government information process as initial data can be enriched, combined with other datasets and analyzed to find hidden correlations or other useful knowledge potentially leading to improved output information to achieve objectives. After all, the crux of big data lies in creating an unknown or underutilized value out of datasets.
4.2.4. Impact of the Evolution on the Process and Service Creation, Delivery and Improvement
Enhancing a service by adding new (big) data and/or applying (big) data analytics to an existing government information process sounds very promising. For instance, advanced data processing activities provide, as we showed in the example of improved assistance for unemployed workers, the opportunity to customize services. Segmentation allows governments, often offering the same service to everyone, to deliver more personal advice or benefits for citizens and companies or to profile them concerning risks (McKinsey Global Institute 2011; Wamba et al. 2015; Rogge et al. 2017).
However, cautiousness behavior is recommendable. Reviewing the critical literature on big data learns that one can find various warnings concerning undesired outcomes such as discrimination, biases, enforcement of stereotypes, and ‘freedom of speech’-impediments when carelessly applying big data practices (i.e., Boyd and Crawford 2012; Executive Office of the President 2016; Mergel et al. 2016; O’Neill 2016; Van der Sloot and Van Schendel 2016). Data quality and ethics play an important role. To what extent are added datasets accurate, closely selected, representative and or neutral (see e.g., Crawford 2013; Executive Office of the President 2016)? Or to what degree are certain segmentations, automated decisions, and predictive analytics infallible and fair towards citizens and companies (see e.g., Barocas et al. 2013; Diakopoulos 2016)? Hence, the new processing activities require certain considerations such as:
- a quality assessment of the added (new) data sources in light of the objectives of the internal or external service;
- possible trade-offs between the benefits using sensitive, personal data (e.g., social media data, mobile phone tracking data, website clickstream data) and privacy or ethical concerns and
- transparency and accountability regarding applied analytics.
Additionally, ownership of the added data is an important aspect. They can involve non-traditional data for governments and may belong to citizens, companies or non-profit organizations. If not publicly shared, public-private partnerships regarding data access have to be installed. Furthermore, the access to the additional data may or may not have a price which need to be incorporated in the financial management of the process.
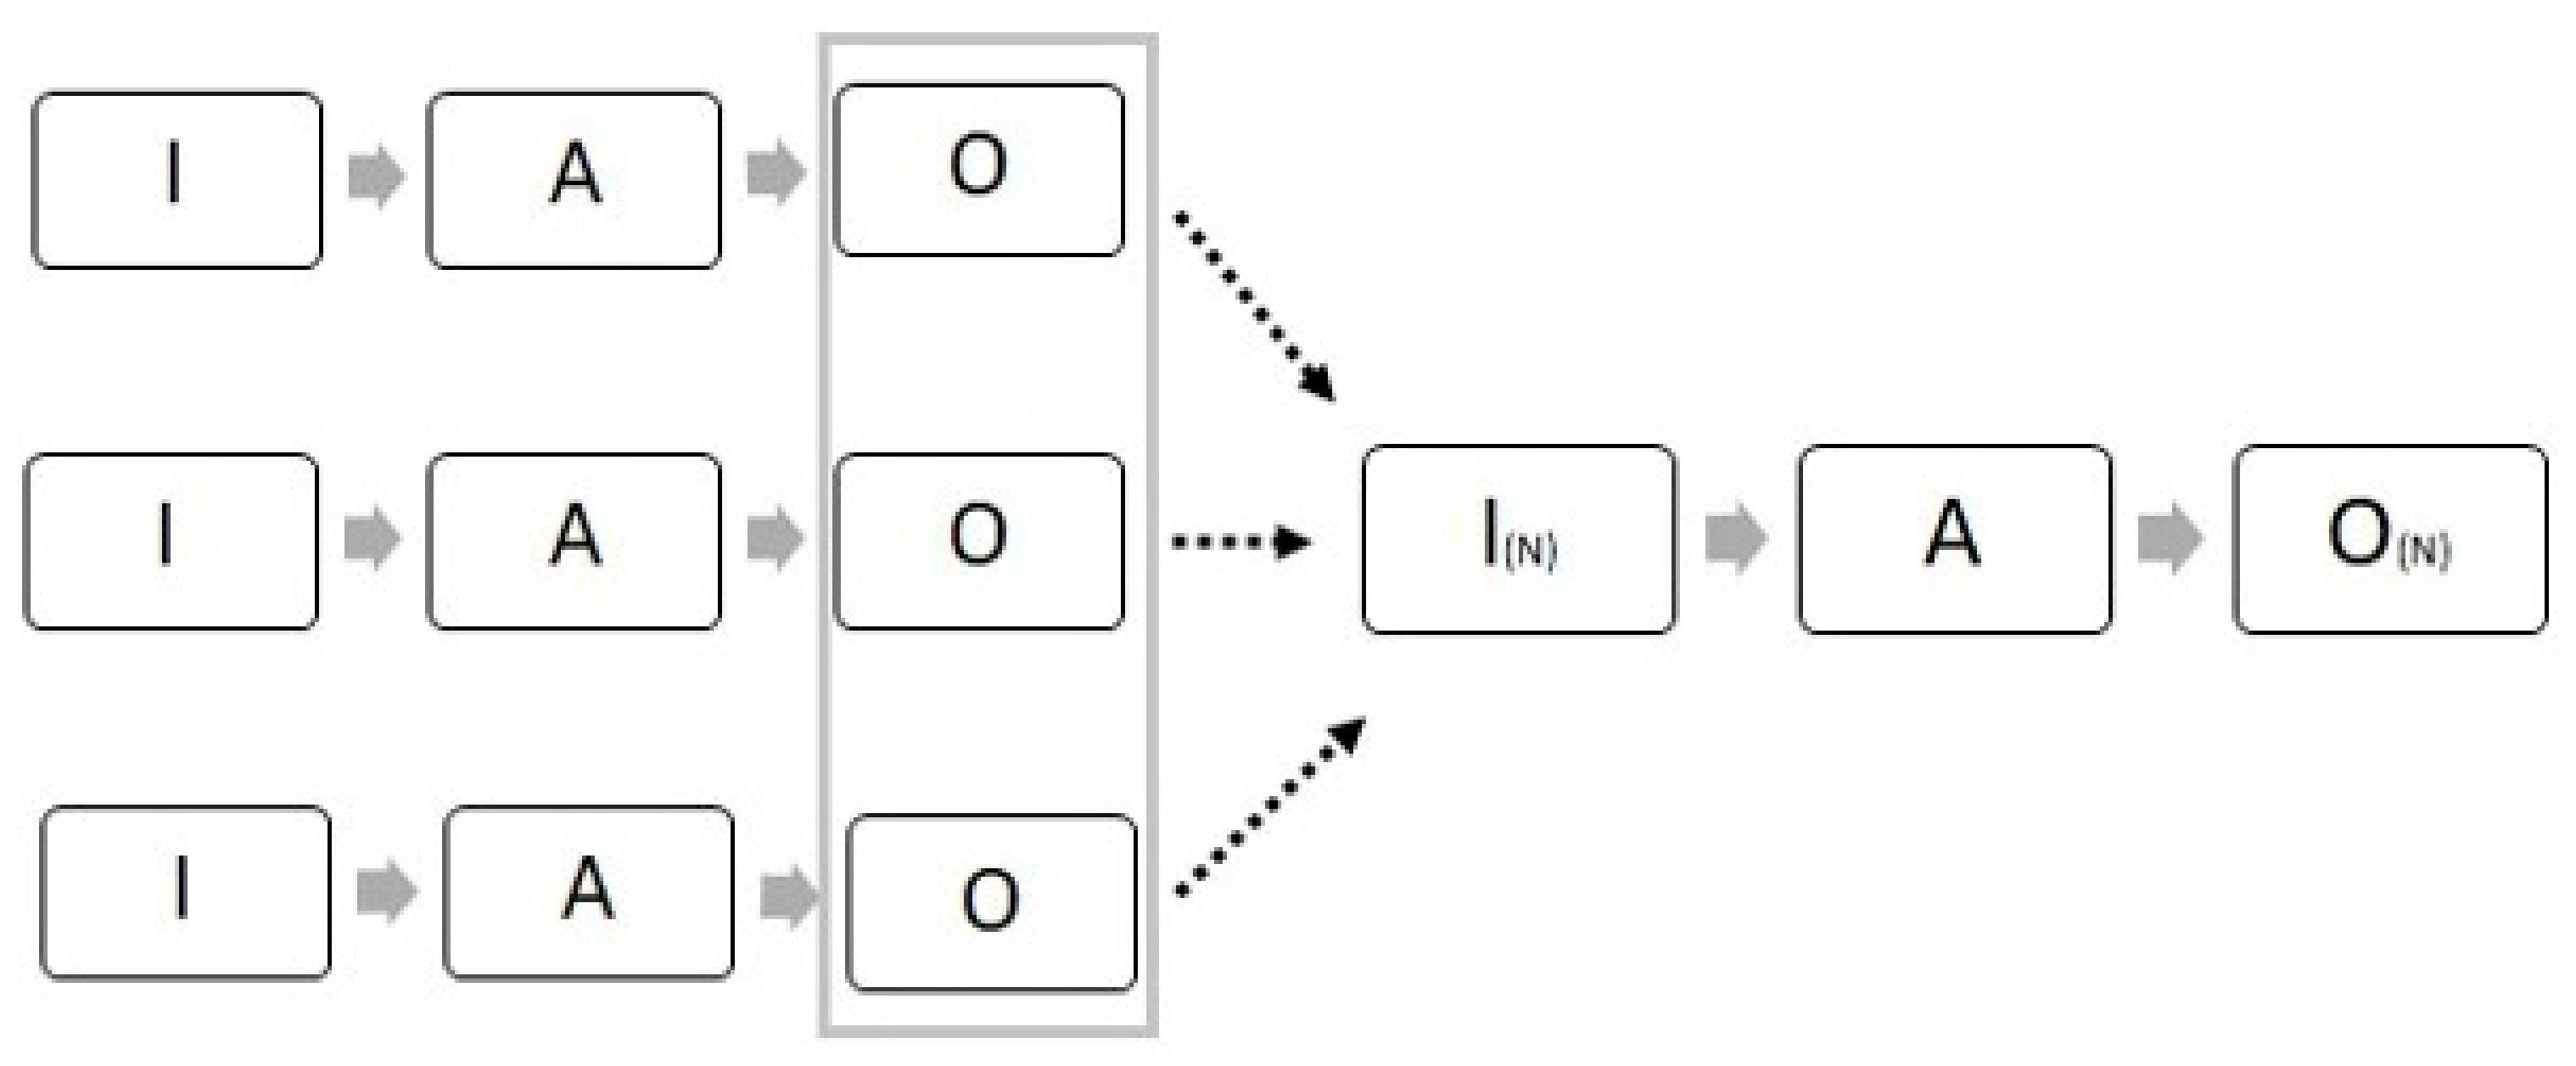
4.3. Process Change Type C: A Merger of Output Information Forms New Input—Activities—New Output
In type C different sets of existing output information, all created by their own information processes and serving their own objectives, are combined in order to serve a new government objective related to an innovative service (See Figure 4). The combination of these datasets creates novel input (=I(n)) that subsequently requires an information process. Data processing activities such as data linking/fusion, analytics and visualization have to make the new input usable. The activities result in a new kind of output information (=O(n)), which is a necessity for the new service.
4.3.1. Example: The Solar Map
The Solar Map is an initiative of the Flemish Energy Agency (Flemish Administration) to inform owners or potential buyers of buildings (e.g., houses or premises) on the suitability of solar panels for buildings. By using a free government e-service people can search for a building and will receive an index stating the fitness of the buildings’ roof for solar energy (panels) (VITO 2017). The objective is to encourage people to be enthusiastic about solar energy. To develop this novel service different existing information sets from different government agencies had to be combined in order to calculate the indexes for each building (=new output information). These new input data include on the one hand a large-scale reference file on buildings and elevation maps (containing information on the height of buildings, trees, and other objects) from the Agency Information Flanders and on the other hand detailed solar radiation data from the Royal Meteorological Institute of Belgium.
4.3.2. Context
The creation of new services, produced by merged information, can for instance be driven by the fad to innovate with open data. In the example of the Solar Map, the merged information sources comprised open data. Open data relates to making data available for anyone who wants to use it (Van der Voort and Crompvoets 2016). It has been widely acknowledged that the re-use of public sector information by citizens and enterprises provides societal and economic opportunities regarding transparency and innovation (Cerrilo-i-Martinez 2012; Gonzalez-Zapata and Heeks 2015; Janssen et al. 2012; Vickery 2011). Attard et al. (2015) state for instance the following: “All data, whether addresses of schools, geospatial data, environmental data, transport and planning data, or budget data, has social and commercial value, and can be used for a number of different purposes which are different than the ones originally envisaged. By publishing such data the government encourages stakeholders to innovate upon it”.
Fuelled by the open data principles intended to facilitate data re-use (see e.g., (Open Knowledge International 2017)) and gain potential socio-economic benefits, government actors are taking action to publicly share their information. These behold the publishing of relevant, (mostly) free datasets in machine readable formats on open government data portals (Attard et al. 2015; Dong et al. 2017; Gamage 2016; Ojo et al. 2015; Zotano and Bersini 2017).
Although innovative services stemming from open government data are often expected to be developed by creative citizens or enterprises, government agencies can also be at the root of innovative service developments originating from the merger of open datasets from their own or other public sector actors. Such mergers lead to new input creating new output information.
4.3.3. Impact of the Evolution on the Process and Service Creation, Delivery, and Improvement
Compared to type A, the new service of type C demands the construction of a whole novel information process that is built on the output of other government information processes. The new process has to be designed, funded, and fully implemented. If the merged information sets involve open data, the service developer has the advantage that the demanded data are directly accessible (e.g., through an open data portal) and mostly without costs. Ownership issues play a lesser role regarding open data although the owner may impose certain rules regarding its data usage. When the merged information sets do not or not at all concern open data, similar relational aspects (e.g., intergovernmental trust, data partnerships) and/or financial aspects, as in type A and type B, enter the field. In essence, open data is, because of privacy reasons, only applied to impersonal data. However, even impersonal data may unintentionally reveal sensitive information about related persons. Some data, which at a first sight seem innocent and appropriate for sharing, could by the application of datamining techniques be (mis)used to identify individuals or groups (Bannister and Connolly 2011). Therefore, when reflecting on the creation of new services based on combined information sets, whether open or not, not all data mergers are desirable.
4.4. Typology Overview and Limitations
Table 1 provides an overview of the different process evolution types based on the three steps of the traditional government information process, namely initial data input, data processing activities, and information output.
As mentioned earlier, these three types are inductively derived based on the authors observations. We are however aware that these types are not exhaustive. New or other observations of current or future government practices dealing with information may expand this typology.
For example, the typology building started from an ‘as is’-situation in which existing traditional initial data are multiply used, enriched with other data or becomes newly created by mergers of existing government output information. It did not yet include situations in which some traditional government initial data will be entirely replaced by new kinds of data. Some examples, which are being investigated and/or carefully tested by researchers and government agencies, are:
- replacement of census and household surveys by the use of mobile positioning data or electricity smart meter data (Florescu et al. 2014; World Bank 2017);
- replacement of land surveys and land registrations by data derived from satellites and drones (World Bank 2017)
- replacement of socio-economic surveys (concerning for instance unemployment) by combining data from social media, Google searches, credit cards, online shops etc. (Mergel et al. 2016).
When such practices of total traditional data replacement become implemented, the current typology will have to integrate this change. Furthermore, we should keep in mind that differences between countries are possible. For instance, in some countries characterized by low data collections and low information (Amankwah-Amoah 2015), those kinds of replacements will not be applicable, as some initial data from countries with high data collection and high information access might not be available. These types of countries might start directly with non-traditional government information. For example, as noted by the World Bank (2017): “In developing countries, governments have an opportunity to adopt big data solutions and leapfrog traditional administrative approaches”.
5. Discussion and Future Research
Based on the observations of government practices, this paper developed a typology to clarify evolutions in the traditional government information process of input—processing activities—and output. These changes are situated within the aim of government actors to create or improve upon internal and external services. Information serves as a crucial resource for these services. The observations lead to a typology built around three types of evolutions:
- type (A) initial data—new activities—expansion of output information objectives
- type (B) initial data—new activities—improved output information
- type (C) a merger of output information forms new input—activities—new output
The generated insights derived from the developed typology were helpful to reflect on the impact of the changes on the traditional government information process and on service creation, delivery, and improvement. Dependent on the evolution type and potentially the type of data (personal or impersonal) the impact involves large or small provisions regarding funding, infrastructure, data partnerships, and legal or ethical considerations.
Contemplating on our research, it appears that when developing or adapting internal and external services, several public sector organizations are enlarging the use of existing initial data and are experimenting with new kinds of data, such as novel combinations of datasets and advanced analytics. Data-driven innovation is steadily becoming the norm (OECD 2015). Within this context, one might notice the start of a movement from supply driven information use towards demand driven information use. A growing number of government agencies do not refine themselves any longer to the supply of current information and conventional data processing activities when thinking about new or enhanced services. In a proactive manner, they are examining—alone or together with governmental, academic, or private IT-partners—the question: What kind of data and/or analytics have the potential to innovate our internal or external services? To fulfil these data demands looking beyond the datasets from the own policy domain or even the government sector is not unusual anymore. Considering the types of government information process evolutions, initial data is used for new objectives (type A), combined with other data and/or innovatively analyzed (type B), or newly created via data mergers (type C). The typology can assist scholars and practitioners to understand different approaches how governments can use data and information in innovative ways as a resource for internal and external services, the sort of process evolutions they imply, and their potential impact.
However, we are aware that typologies provide a simplification of reality. The elaborated three step process of input, activities and output provides a high-level view on information production. The actual operations within these steps are probably more complex then described in this paper. Future extensions or adaptions of the typology are welcome, thereby thinking for instance about integrating novel examples or other kind of observations. Furthermore, the reflections in this paper on the impact of the transformations were not exhaustive. Therefore, this typology might inspire public administration researchers as well as practitioners to reflect on possible effects in non-discussed fields (e.g., required personnel skills to handle process evolutions) that are affected by the outlined changes.
Author Contributions
R.H. wrote the paper and conducted the research which was designed by G.B., J.C. and R.H. J.C. and M.C. reviewed the paper and provided suggestions.
Acknowledgments
This research was possible due to the C2-project ‘Connecting administrative law and public sector reform’ sponsored by the KU Leuven.
Conflicts of Interest
The authors declare no conflict of interest.
References
- Amankwah-Amoah, Joseph. 2015. Safety or no safety in numbers? Governments, big data and public policy formulation. Industrial Management & Data Systems 115: 1596–603. [Google Scholar]
- Article 29 Data Protection Working Party. 2013. Opinion 03/2013 on Purpose Limitation. 00569/13/EN, WP 203. Brussels: European Commission. [Google Scholar]
- Attard, Judie, Fabrizio Orlandi, Simon Scerri, and Sören Auer. 2015. A systematic review of open government data initiatives. Government Information Quarterly 32: 399–418. [Google Scholar] [CrossRef]
- Australian Government Information Management Office. 2009. National Government Information Sharing Strategy—Unlocking Government Information Assets to Benefit the Broader Community; Parkes: Department of Finance and Deregulation, Australia.
- Bannister, Frank, and Regina Connolly. 2011. The Trouble with Transparency: A Critical Review of Openness in e-Government. Policy and Internet 3: 8. [Google Scholar] [CrossRef]
- Barocas, Solon, Sophie Hood, and Malte Ziewitz. 2013. Governing Algorithms: A Provocation Piece. Available online: https://ssrn.com/abstract=2245322 (accessed on 2 May 2018).
- Bekkers, V., and V. M. F. Hamburg. 2005. E-Government, Changing Jurisdictions and Boundary Management. In The Information Ecology of E-Government. Amsterdam: IOS Press, pp. 53–71. [Google Scholar]
- Billiet, Jaak, and Hans Waege. 2003. Een Samenleving Onderzocht. Methoden van Sociaal-Wetenschappelijk Onderzoek. Antwerpen: De Boeck. [Google Scholar]
- Boyd, Danah, and Kate Crawford. 2012. Critical Questions for Big Data. Information, Communication and Society 15: 662–79. [Google Scholar] [CrossRef]
- Breckenridge, Keith, and Simon Szreter. 2012. Registration and Recognition: Documenting the Person in World History. Oxford: Oxford University Press. [Google Scholar]
- Cerrilo-i-Martinez, Agusti. 2012. Fundamental interests and open data for re-use. International Journal of Law and Information Technology 20: 203–22. [Google Scholar] [CrossRef]
- Chen, Hsinchun, Roger H. L. Chiang, and Veda C. Storey. 2012. Business Intelligence and Analytics: From Big Data to Big Impact. MIS Quarterly 36: 1165–88. [Google Scholar]
- Commissie voor de Bescherming van de Persoonlijke Levenssfeer. 2017. Advies Betreffende het Voorontwerp van Wet tot Wijziging van de Wet op het Politieambt en de Wet van 21 Maart 2007 tot Regeling van de Plaatsing en het Gebruik van Bewakingscamera’s (CO-A-2017-054). Advies nr. 53/2017 van 20 September 2017. Brussels: Commissie voor de Bescherming van de Persoonlijke Levenssfeer. (In Dutch) [Google Scholar]
- Crawford, Kate. 2013. The Hidden Biases in Big Data. Harvard Business Review. Available online: https://hbr.org/2013/04/the-hidden-biases-in-big-data (accessed on 11 December 2017).
- Crompvoets, Joep, and H. G. Van der Voort. 2016. Big data en de toezichthouder: Een gesprek met Gaël Kermarrec. Bestuurskunde 25: 3–8. (In Dutch). [Google Scholar] [CrossRef]
- Deloitte. 2016. Big Data Analytics for Policy Making. A Study Prepared for the European Commission DG Informatics. Brussels: European Union. [Google Scholar]
- Diakopoulos, Nicholas. 2016. Accountability in algorithmic decision making. Communications of the ACM 59: 56–62. [Google Scholar] [CrossRef]
- Dong, Haiwei, Gobindbir Singh, Aarti Attri, and Abdulmotaleb El Saddik. 2017. Open Data-Set of Seven Canadian Cities. IEEE 5: 529–43. [Google Scholar] [CrossRef]
- Dumortier, Jos, and Frank Robben. 2010. User and Access Management in Belgian e-Government. In ISSE 2009 Securing Electronic Business Processes. Wiesbaden: Vieweg+Teubnern, pp. 97–107. [Google Scholar]
- Dunleavy, Patrick, Helen Margetts, Simon Bastow, and Jane Tinkler. 2008. Digital Era Governance: IT Corporations, the State, and E-Government. Oxford: Oxford University Press. [Google Scholar]
- European Commission. 2017. New European Interoperability Framework Promoting Seamless Services and Data Flows for European Public Administrations. Luxembourg: Publications Office of the European Union. [Google Scholar]
- Eurostat. 2018. Publications. Available online: http://ec.europa.eu/eurostat/publications/statistical-reports (accessed on 8 April 2018).
- Executive Office of the President. 2016. Big Data: A Report on Algorithmic Systems, Opportunity, and Civil Rights; White House Report; Washington: White House.
- Florescu, Denisa, Martin Karlberg, Fernando Reis, P. Rey Del Castillo, Michail Skaliotis, and Albrecht Wirthmann. 2014. Will ‘Big Data’ Transform Official Statistics? Available online: http://www.q2014.at/fileadmin/user_upload/ESTAT-Q2014-BigDataOS-v1a.pdf (accessed on 9 January 2018).
- Gamage, Pandula. 2016. New development: Leveraging ‘big data’ analytics in the public sector. Public Money & Management 36: 385–90. [Google Scholar]
- Gartner. 2017. IT Glossary. Big Data. Available online: www.gartner.com/it-glossary/big-data (accessed on 18 October 2017).
- Giest, Sarah. 2017. Big data for policymaking: Fad or fasttrack? Policy Sciences 50: 367–82. [Google Scholar] [CrossRef]
- Gil-Garcia, J. Ramon, InduShobha Chengalur-Smith, and Peter Duchessi. 2007. Collaborative E-government: Impediments and Benefits of Information-sharing Projects in the Public Sector. European Journal of Information Systems 16: 121–33. [Google Scholar] [CrossRef]
- Gitelman, Lisa. 2013. “Raw Data” Is an Oxymoron. Cambridge: The MIT Press. [Google Scholar]
- Gonzalez-Zapata, Felipe, and Richard Heeks. 2015. The multiple meanings of open government data: Understanding different stakeholders and their perspectives. Government Information Quarterly 32: 441–52. [Google Scholar] [CrossRef]
- Heijlen, Roel, and Joep Crompvoets. 2017. Clean data for cleaner air? Case study research about data streams concerning low-emission zones and car-free zones. Zenodo. [Google Scholar] [CrossRef]
- Henninger, Michael. 2013. The Value and Challenges of Public Sector Innovation. Cosmopolitan Civil Societies Journal 5: 75–95. [Google Scholar]
- Higgs, Edward. 2004. The Information State in England: The Central Collection of Information on Citizens Since 1500. Basingstoke: Palgrave Macmillan. [Google Scholar]
- Janssen, Marijn, Soon Ae Chun, and J. Ramon Gil-Garcia. 2009. Building the next generation of digital government infrastructures. Government Information Quarterly 26: 233–37. [Google Scholar] [CrossRef]
- Janssen, Marijn, Yannis Charalabidis, and Anneke Zuiderwijk. 2012. Benefits, Adoption Barriers and Myths of Open Data and Open Government. Information Systems Management 29: 258–68. [Google Scholar] [CrossRef]
- Janssen, Marijn, Haiko van der Voort, and Agung Wahyudi. 2017. Factors influencing big data decision-making quality. Journal of Business Research 70: 388–45. [Google Scholar] [CrossRef]
- Kim, Gang-Hoon, Silvana Trimi, and Ji-Hyong Chung. 2014. Big-Data Applications in the Government Sector. Communications of the ACM 57: 78–85. [Google Scholar] [CrossRef]
- Kitchin, Rob. 2014. The real-time city? Big data and smart urbanism. GeoJournal 79: 1–14. [Google Scholar] [CrossRef]
- Klievink, Bram, Bart-Jan Romijn, Scott Cunningham, and Hans de Bruijn. 2017. Big data in the public sector: Uncertainties and readiness. Information Systems Frontiers 19: 267–83. [Google Scholar] [CrossRef]
- Koskela, Hille. 2000. ‘The gaze without eyes’: Video-surveillance and the changing nature of urban space. Progress in Human Geography 24: 243–65. [Google Scholar] [CrossRef]
- Lesaffer, Pharmaceutica. 2017. VDAB Wil Surfgedrag van Werklozen Screenen. Gazet van Antwerpen. Available online: www.gva.be/cnt/dmf20170904_03051877/vdab-wil-surfgedrag-van-werklozen-screenen (accessed on 12 January 2018). (In Dutch).
- Liu, Shuhua Monica, and Qianli Yuan. 2015. The Evolution of Information and Communication Technology in Public Administration. Public Administration and Development 35: 140–51. [Google Scholar] [CrossRef]
- Lyon, David. 2014. Situating surveillance: History, Technology, Culture. Histories of State Surveillance in Europe and Beyond. New York: Routledge, pp. 332–46. [Google Scholar]
- McKinsey Global Institute. 2011. Big Data: The Next Frontier for Innovation, Competition and Productivity. New York: McKinsey & Company. [Google Scholar]
- Mergel, Ines, R. Karl Rethemeyer, and Kimberley Isett. 2016. Big data in Public Affairs. Public Administration Review 76: 928–37. [Google Scholar] [CrossRef]
- Munné, Ricard. 2016. Big Data in the Public Sector. In New Horizons for a Data-Driven Economy. New York: Springer International Publishing, pp. 195–208. [Google Scholar]
- O’Neill, Cathy. 2016. Weapons of Math Destruction: How Big Data Increases Inequality and Threatens Democracy. New York: Crown Publishing Group. [Google Scholar]
- OECD. 2014. Recommendation of the Council on Digital Government Strategies. Available online: www.oecd.org/governance (accessed on 14 January 2018).
- OECD. 2015. Data-Driven Innovation. Big Data for Growth and Well-Being. Paris: OECD Publishing. [Google Scholar]
- Ojo, Adegboyega, Edward Curry, and Fatemeh Ahmadi Zeleti. 2015. A tale of Open Data innovations in five smart cities. Paper presented at the 2015 48th Hawaii International Conference on System Sciences (HICSS), Washington, DC, USA, January 5–8; pp. 2326–35. [Google Scholar]
- Open Knowledge International. 2017. Open Data Handbook. Available online: http://opendatahandbook.org/ (accessed on 17 October 2017).
- Pardo, Theresa A., J. Ramon Gil-Garcia, and G. Brian Burke. 2008. Sustainable Cross-Boundary Information Sharing. In Digital Government. Integrated Series in Information Systems. Boston: Springer, vol. 17. [Google Scholar]
- Rogge, Nicky, Tommaso Agasisti, and Kristof De Witte. 2017. Big data and the measurement of public organizations’ performance and efficiency: The state of the art. Public Policy and Administration 32: 263–81. [Google Scholar] [CrossRef]
- Spiller, Keith. 2016. Experiences of accessing CCTV data: The urban typologies of subject access requests. Urban Studies 53: 2885–900. [Google Scholar] [CrossRef]
- Technopolis Group, Oxford Internet Institute, and Centre for European Policy Studies. 2015. Data for Policy: A Study of Big Data and Other Innovative Data-Driven Approaches for Evidence-Informed Policymaking. Amsterdam: Technopolis Group. [Google Scholar]
- United Nations. 2016. E-Government Survey 2016. E-Government for the Future We Want. New York: United Nations. [Google Scholar]
- Van Cauter, Lies. 2016. Government-to-Government Information System Failure in Flanders: An In-Depth Study. Ph.D. dissertation, Katholieke Universiteit Leuven, Leuven, Belgium. [Google Scholar]
- Van der Sloot, Bart, and Sashavan Schendel. 2016. International and Comparative Legal Study on Big Data. Working Paper 20. The Hague, The Netherlands: The Netherlands Scientific Council for Government Policy (WRR). [Google Scholar]
- Van der Voort, Haiko, and Joep Crompvoets. 2016. Big data: Een zoektocht naar instituties. Bestuurskunde 25: 3–8. (In Dutch). [Google Scholar] [CrossRef]
- Van Dooren, Wouter, Geert Bouckaert, and John Halligan. 2015. Performance Management in the Public Sector Oxon. Abingdon: Routledge. [Google Scholar]
- Van Zoonen, Liesbet. 2016. Privacy concerns in smart cities. Government Information Quarterly 33: 472–80. [Google Scholar] [CrossRef]
- Vickery, Graham. 2011. Review of Recent Studies on PSI Re-Use and Related Market Development. Paris: Information Economics. Available online: https://ec.europa.eu/digital-single-market/en/news/review-recent-studies-psi-reuse-and-related-market-developments (accessed on 17 October 2017).
- VITO. 2017. How Suitable Is Your Roof for the Installation of Solar Panels or a Solar Boiler? See for Yourself on the SOLAR MAP. Available online: https://vito.be/en/media-events/press-releases/how-suitable-is-your-roof-for-the-installation-of-solar-panels-or-a-solar-boiler-see-for-yourself-on-the-solar-map (accessed on 15 February 2018).
- Wamba, Samuel Fosso, Shahriar Akter, Andrew Edwards, Geoffrey Chopin, and Denis Gnanzou. 2015. How ‘Big Data’ Can Make Big Impact: Findings from a Systematic Review and a Longitudinal Case Study. International Journal of Production Economics 165: 234–46. [Google Scholar] [CrossRef]
- Welle Donker, Frederika, and Bastiaan van Loenen. 2016. Sustainable business models for public sector open data providers. JeDEM Journal of eDemocracy & Open Government 8: 28–61. [Google Scholar]
- World Bank. 2017. Big Data in Action for Government: Big Data Innovation in Public Services, Policy, and Engagement (English). Solutions Brief. Washington: World Bank Group, Available online: http://documents.worldbank.org/curated/en/176511491287380986/Big-data-in-action-for-government-big-data-innovation-in-public-services-policy-and-engagement (accessed on 2 May 2018).
- Zotano, Miguel Angel Gomez, and Hugues Bersini. 2017. A data-driven approach to assess the potential of Smart Cities: The case of open data for Brussels Capital Region. Energy Procedia 111: 750–58. [Google Scholar] [CrossRef]
Figure 1.
Traditional government information process. Source: Based on the production model of performance (Van Dooren et al. 2015).
Figure 1.
Traditional government information process. Source: Based on the production model of performance (Van Dooren et al. 2015).

Figure 2.
Process evolution type A.

Figure 3.
Process evolution type B.

Figure 4.
Process evolution type C.


Table 1.
Overview typology evolutions in the traditional government information process.
| Type | Input | Processing Activities | Output | Case Examples |
|---|---|---|---|---|
| A | Initial data | New activities such as
| Output stays (basically) the same but its use multiplies because of new objectives | Extensive use of license plate data and camera data |
| B | Initial data | New activities such as
| Improved output, better achievement of objectives | New insights for fraud detection (taxation, social security) and assistance for unemployed workers |
| C | A merge of existing output information forms together input information | The merge requires data linking, analytics, visualization etc. to become usable | New sort of output information | Innovative service: the Solar Map |
© 2018 by the authors. Licensee MDPI, Basel, Switzerland. This article is an open access article distributed under the terms and conditions of the Creative Commons Attribution (CC BY) license (http://creativecommons.org/licenses/by/4.0/).
Share and Cite
MDPI and ACS Style
Heijlen, R.; Crompvoets, J.; Bouckaert, G.; Chantillon, M. Evolving Government Information Processes for Service Delivery: Identifying Types & Impact. Adm. Sci. 2018, 8, 15. https://doi.org/10.3390/admsci8020015
AMA Style
Heijlen R, Crompvoets J, Bouckaert G, Chantillon M. Evolving Government Information Processes for Service Delivery: Identifying Types & Impact. Administrative Sciences. 2018; 8(2):15. https://doi.org/10.3390/admsci8020015
Chicago/Turabian StyleHeijlen, Roel, Joep Crompvoets, Geert Bouckaert, and Maxim Chantillon. 2018. "Evolving Government Information Processes for Service Delivery: Identifying Types & Impact" Administrative Sciences 8, no. 2: 15. https://doi.org/10.3390/admsci8020015
Note that from the first issue of 2016, this journal uses article numbers instead of page numbers. See further details here.