Optical Response of an Interacting Polaron Gas in Strongly Polar Crystals
by
 ,
,
Serghei Klimin
1,* ,
,
Jacques Tempere
1,2,
Jozef T. Devreese
1,
Cesare Franchini
3,4 and
Georg Kresse
3 1
TQC, University of Antwerp, Universiteitsplein 1, B-2610 Antwerp, Belgium
2
Lyman Laboratory of Physics, Harvard University, Cambridge, MA 02138, USA
3
Faculty of Physics, Computational Materials Physics, University of Vienna, A-1090 Vienna, Austria
4
Dipartimento di Fisica e Astronomia, Università di Bologna, 40127 Bologna, Italy
*
Author to whom correspondence should be addressed.
Appl. Sci. 2020, 10(6), 2059; https://doi.org/10.3390/app10062059
Submission received: 14 February 2020
/
Revised: 28 February 2020
/
Accepted: 12 March 2020
/
Published: 18 March 2020
(This article belongs to the Special Issue Optical Properties of Confined Quantum Systems 2020)
Abstract
:Optical conductivity of an interacting polaron gas is calculated within an extended random phase approximation which takes into account mixing of collective excitations of the electron gas with longitudinal optical (LO) phonons. This mixing is important for the optical response of strongly polar crystals where the static dielectric constant is rather high, as in the case of strontium titanate. The present calculation sheds light on unexplained features of experimentally observed optical conductivity spectra in n-doped SrTiO. These features appear to be due to dynamic screening of the electron–electron interaction by polar optical phonons and hence do not require additional mechanisms for their explanation.
1. Introduction
Polaron manifestations in the optical response of polar crystals, such as complex oxides and high- superconductors are the subject of intense investigations [1,2,3,4,5,6,7] (for a review, see also [8,9]). Several features in the infrared optical-absorption spectra of complex oxides have been associated with large polarons [10] or with a mixture of large and small polarons [11]. The analysis in those papers was performed using a single-polaron model, so that the concentration dependence of the optical-absorption spectra could not properly take into account many-polaron effects.
The many-body theory of the optical absorption of a gas of interacting polarons [12,13] allows one to study the density dependence of the optical-absorption spectra. The calculation [12] was performed in the single-branch approximation for optical phonons. In Ref. [13], the optical conductivity of n-doped SrTiO was calculated accounting for the electron-phonon interaction with multiple longitudinal optical (LO) and transverse optical (TO) phonon branches. The calculations of the optical conductivity of a weak-coupling polaron gas [12,13] compare fairly well with the experimental data [1,2] and therefore confirm the contribution of large polarons in the optical response. Strontium titanate represents an especially interesting case due to its unique features, particularly a high static dielectric constant at low temperatures and essentially non-parabolic shape of the conduction band which consists of three subbands. This requires a treatment of the optical conductivity beyond the frequently used lowest-order perturbation approximation.
The first-principle methods are powerful for the theoretical study of both equilibrium and response properties of polarons. At present, ab initio calculations of the polaron band energies are developed, for example, in Refs. [14,15,16,17,18]. Also, the polaron mobility has been calculated from the first principles (see, for review, [19]). In the present work, we consider a complementary semianalytic approach, which has its own advantages. First, it is much less time- and memory-consuming for computation. Second, more important, it allows sometimes a clear physical interpretation of features of obtained spectra, as they follow from a used model.
The present work is focused on the many-polaron optical response in strongly polar crystals like SrTiO. The strong polarity means that the ratio of the static and high-frequency dielectric constant is large: . This does not necessarily lead to a high electron-phonon coupling constant: in strontium titanate the effective coupling constant as determined in [13]. Even in this moderate-coupling case, electron collective excitations (attributed to plasmons only in the long-wavelength limit) are substantially mixed with LO phonons [20] and therefore can result in a non-trivial spectrum of the optical conductivity. Therefore, in this paper, we determine the optical conductivity of a many-polaron gas taking into account mixing of phonons and electron collective excitations in the total dielectric function of the electron-phonon system, and taking also into account the multi-subband structure of the conductivity band. The method is applied to n-doped strontium titanate.
2. Many-Polaron Optical Conductivity
We consider an electron-phonon system with the following Hamiltonian in the momentum representation:
where is the electron energy with the momentum in the -th subband of the conduction band, and are, respectively, creation and annihilation fermionic operators for an electron with the spin projection , is the phonon frequency for the momentum and the phonon branch j, and are, respectively, phonon creation and annihilation operators. The electron-phonon interaction amplitudes are used here neglecting their possible dependence on the electron momentum and the subband number. This dependence can only be non-negligible when high-energy electrons bring an important contribution to the many-polaron response, which is not believed to be the case for strontium titanate.
For the many-polaron optical response, we start from the Kubo formula,
where V is the system volume, e is the electronic charge, and the constant is determined by the current-current correlator:
and is the current operator determined by:
The constant can be calculated explicitly. Substituting (4) to (3) and applying commutation relations for second quantization operators, we arrive at the result,
with the distribution function of the electrons,
Next, we perform twice the integration by parts in the integral over time in (2) and introduce the force operator,
which is explicitly given by the expression:
with
After these two integrations by parts, the Kubo formula is equivalently rewritten through the force-force correlation function,
Next, we consider the weak-coupling regime. The weak-coupling optical conductivity can be expressed in the memory-function form, as, e.g., in Refs. [21,22]:
where the memory function is:
Here, the averaging is performed with the Hamiltonian of interacting electrons neglecting the electron-phonon interaction.
We can transform the memory function in an explicitly tractable expression substituting (8) and (9) in (12). Thus, we obtain the resulting memory function:
where is the phonon Green’s function:
and is the Bose distribution of phonons:
The f-sum rule for the optical conductivity reads:
3. Semianalytic Approximations
The optical conductivity of an interacting polaron gas is calculated here within the extended random phase approximation (RPA), as described below. The memory function can be expressed through the polarization function of the electron gas for sufficiently small . Thus, the RPA can be applied under the assumption that the long-wavelength phonons bring the dominant contribution to the polaron optical response. In this approximation, the band energy which enters the operator is expanded in powers of the momentum as . In SrTiO, the band mass obtained within the tight-binding analytic fit as described in Appendix A appears isotropic with the same value (where is the electron mass in vacuum) for all three subbands of the conduction band. Thus, the memory function for the optical conductivity is approximated by the expression:
where is the Fourier component of the electron density. Please note that below, when calculating the density-density correlation function, we do not perform this expansion.
The treatment is restricted here to the optical response provided by the Fröhlich electron-phonon interaction with LO phonons, because this mechanism brings the main contribution to the mid-infrared optical conductivity in polar crystals. The LO- and TO-phonon frequencies are denoted below as and , respectively. In the present work, they are not calculated, being input parameters of the theory.
We use the Fröhlich interaction amplitudes with the partial coupling constants for the j-th LO-phonon branch in a multimode polar crystals as derived in Ref. [13]:
where are the LO-phonon frequencies in the phonon Brillouin zone center. The expression (18) does not mean that the phonon dispersion is neglected, because enters only as a dimensional parameter, compensated in the coupling constant [24]. In terms of Green’s functions, the memory function (17) takes the form:
with
In Ref. [13], the Green’s functions were calculated within the RPA for an electron gas. Here, we apply the RPA extended for an interacting electron-phonon system, which leads to a formula structurally similar to that obtained within RPA, but with a different (momentum and frequency dependent) electron–electron interaction matrix element:
with the dielectric function of the lattice , which describes the dynamic lattice polarization. In the present calculation, we use the model of independent oscillators [25,26] which correspond to the LO- and TO-phonon modes:
The extended RPA thus takes into account the dynamic screening of the Coulomb electron–electron interaction by the lattice polarization. The resulting retarded density-density Green’s function is:
where is the Lindhard polarization function,
with the Fermi distribution function :
The function is obtained from using the analytic identity,
and then the Kramers–Kronig dispersion relation for .
For a comparison with experiment, the Green’s functions are calculated here accounting for damping within the Mermin–Lindhard approach [27,28,29,30] (where the damping is introduced in such a way to conserve the local electron number). This leads to the modification of the retarded density-density Green’s function as follows:
where is the phenomenological damping factor. The values of found in the literature are of the order of the Fermi energy of electrons [31,32]. Here, is a fitting parameter of the same order of magnitude (the only fitting parameter which is in fact used here). The calculation is performed with the values for and for . It should be noted that the results appear to be only slightly sensitive to chosen values of .
The calculation of the Green’s functions for non-parabolic bands requires knowledge of overlap integrals [33] for the Coulomb and electron-phonon interactions, which is not yet reliably known and needs a microscopic calculation. In order to simplify the computation keeping main features of the non-parabolic band dispersion, we perform two approximations.
First, we apply the density-of-states approach already successfully used in Ref. [34]. The approximation consists of the replacement of the true band energy by the model isotropic band energy which provides the same density of states as that for the true band energy . The density of states in the -th subband of the conductivity band is determined using the carrier density:
where . The model isotropic band energy dispersion is determined through the function
so that is the inverse function to this .
Second, appears to be approximately parabolic in a rather wide range of the momentum. Therefore, we assume the parabolic conduction band for the calculation of Green’s functions but with the density-of-states effective masses determined through the density of states from the condition that the low-momentum expansion of the polarization function with the dispersion coincides with that for a parabolic band dispersion with the mass . This gives us the expression:
In the zero-temperature limit, is analytically expressed through the density of states at the Fermi energy :
As mentioned above, this approximation is not a series expansion of the band energy near the band bottom, and hence the density-of-states mass does not coincide with the band effective mass . An approach which involves the effective band mass and the density-of-states band mass has been used also in Ref. [13]. Here, the density-of-states band mass is determined in a more rigorous way, effectively accounting for the realistic band structure of a crystal, electron density and temperature, as can be seen from (31).
4. Application to SrTiO
The approach described above is focused mainly on crystals with a high ratio like strontium titanate, where it can reveal specific features related to the high polarizability. In the previous treatment of the many-polaron optical conductivity in doped SrTiO [13], the pronounced peak for meV at a relatively low temperature remains unexplained. It was suggested in [13] that it might be provided by other (non-polaron) mechanisms, for example, the small-polaron and mixed-polaron [35] channels for the optical response. As we show below, additional mechanisms are not necessary for the explanation of this 130-meV feature.
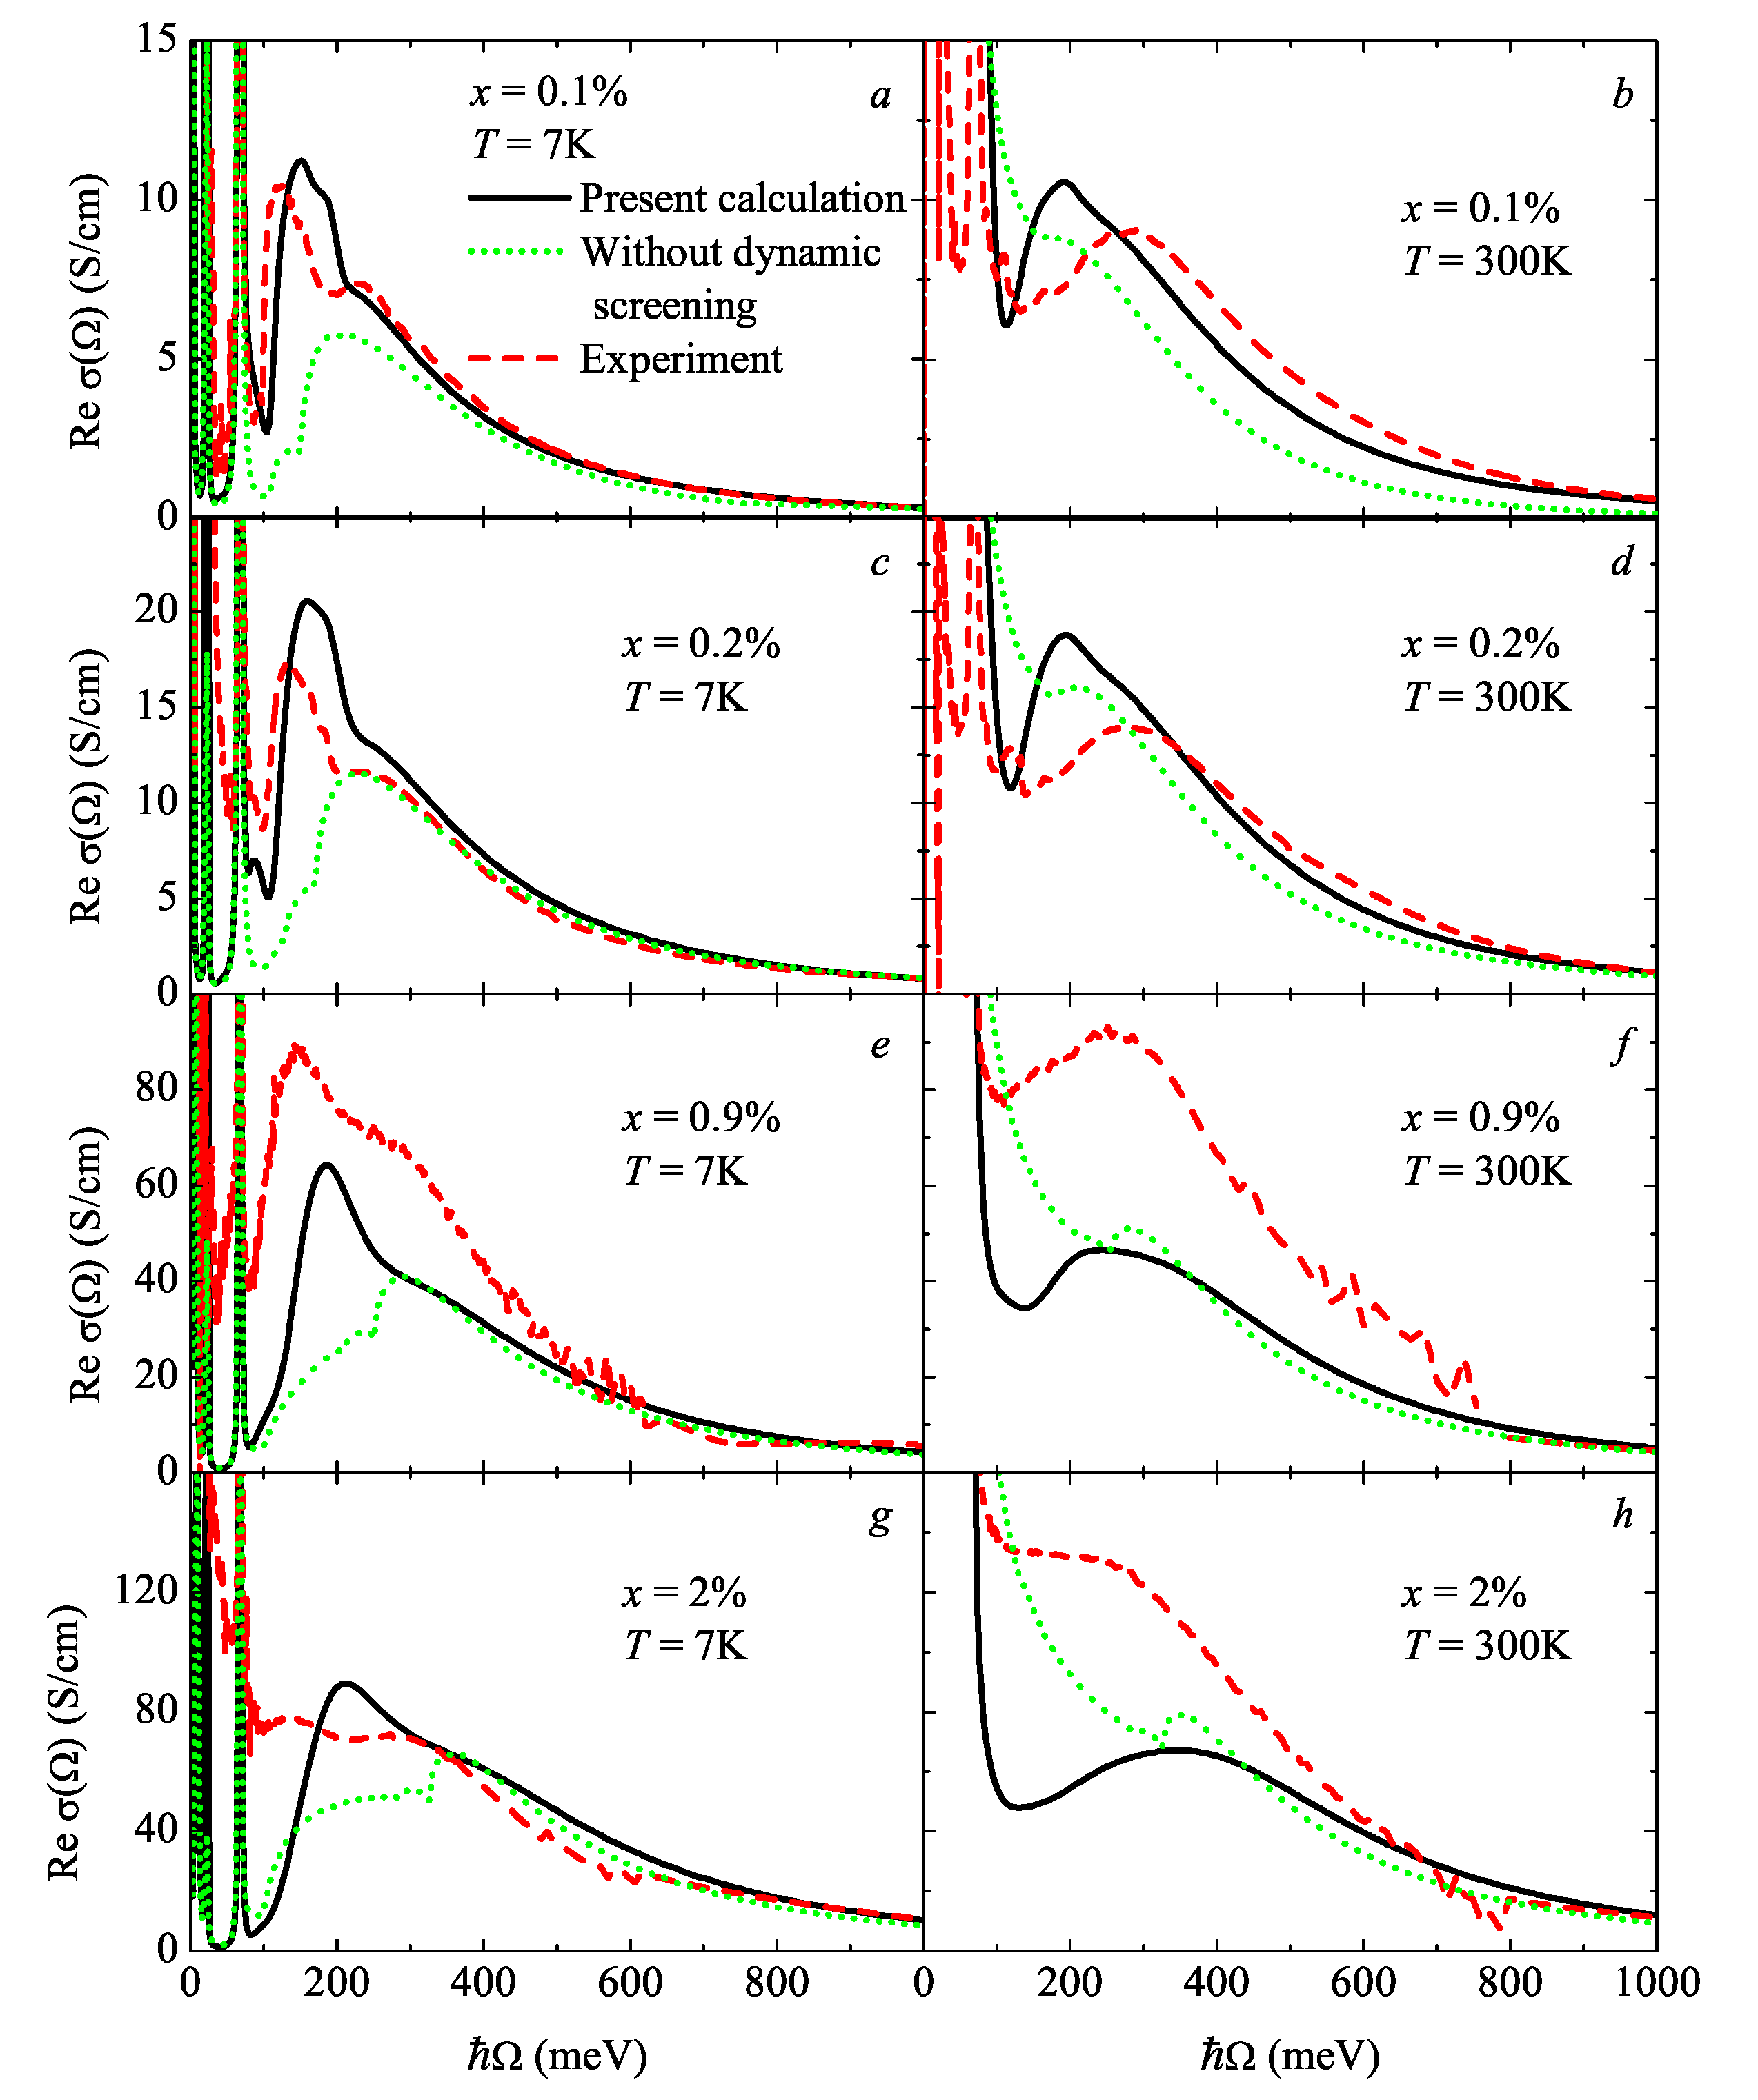
The numeric results for the many-polaron optical conductivity are shown in Figure 1. In the computation, the following set of electron band and phonon material parameters is used. The conduction band shape is simulated by the analytic tight-binding fit as described in Ref. [36] and here in Appendix A. The optimal values for this analytic approximation are the diagonal matrix elements corresponding to the recent results of the microscopic calculation [37] using the GW method [38]: meV, meV, and the band splitting parameters from Ref. [36] meV, meV. The optical-phonon energies at the Brillouin zone center of SrTiO are taken from the experimental data of Ref. [2], the same as described in Ref. [13]. Also, the direct TO-phonon optical response has been included in the figure in the same way as in Ref. [13]. It is represented by sharp peaks in the low-energy part of the optical conductivity spectrum.
The calculated many-polaron optical conductivity in SrTiO is compared with the experimental data of Ref. [2] for two temperatures: and and for several values of the carrier concentration. Also, the earlier calculation the optical conductivity [13] is reproduced in the figure. As can be seen from the low-temperature results shown in the left-hand panels of the figure, the 130-meV peak and the dip at meV (corresponding to twice the highest-energy LO-phonon mode ion strontium titanate) experimentally observed at the low temperature and at relatively low concentrations are fairly well revealed in the calculated spectra of the optical conductivity.
The obtained expression (24) for the retarded density-density Green’s function gives us a transparent explanation of the shape of the optical conductivity spectrum, which is more complicated than in the absence of the dynamic screening. The Green’s functions enter the memory function (19) with the arguments . Therefore the dynamically screened electron–electron interaction matrix element (22) contains poles, in particular, at , which result in dips of the optical conductivity at these frequencies. The most significant contribution to the dips comes from the highest LO-phonon energy meV. This feature is visible in both the measured and calculated optical conductivity spectra. The part of the spectrum below constitutes the aforesaid 130-meV peak. The other part of the spectrum, above , contains the “plasmon-phonon” peak provided by the response due to undamped plasmons [12,13].
There is still a discrepancy between the present theory and the experiment at and high doping concentrations in what concerns the shape of the spectrum in the low-energy range meV. Also, the small peak near meV in the spectra for relatively low concentrations at is not captured by the calculation. These discrepancies can be attributed to the fact that a long-wavelength approximation is used here for the electron-phonon interaction. When rising the temperature and/or the carrier concentration, momentum transfers with higher phonon momenta q bring increasingly important contributions to the optical response. This requires steps beyond the present approximation. First, more advanced electron-phonon matrix elements can be relevant, i.e., rather than , where is the electron momentum. They can be taken from a microscopic first-principle theory, e.g., [14,15,16,17,18] as input parameters for the present method. Second, at a high phonon momentum, intersubband transitions in the conductivity band may be non-negligible. This needs an extension of the electron-phonon matrix elements as where denotes different subbands of the conductivity band. This is a subject of the next study.
5. Conclusions
In the present work, we revisit the optical response of a polaron gas in complex polar crystals using the random phase approximation extended for an interacting electron-phonon system. This extension results in a modified many-polaron optical conductivity with an effective electron–electron interaction accounting for the dynamic screening by LO phonons. For a more realistic calculation relevant for comparison with experiment for strontium titanate, the phonon dielectric function contains several optical-phonon modes that have been identified in SrTiO.
A distinctive low-frequency peak of the many-polaron optical conductivity in a polar medium appears when a crystal is highly polar, , which is realized in strontium titanate. As can be seen from the obtained spectra of the optical conductivity, the dynamic screening leads to an appearance of this peak which is close to the experimental “130-meV feature”, except for the highest available density. Moreover, its width and shape asymmetry are remarkably similar to those of the experimental peak, including even fine details such a small kink at the shoulder above the maximum. Also, the whole shape of the spectrum at least for the two lower densities is similar to the experimental results, containing both the low-frequency peak and the “plasmon-phonon” peak due to undamped plasmons. This similarity makes the dynamic screening mechanism for the low-frequency peak convincing. As can be seen from the comparison of the results [13] obtained without account of dynamic screening with those of the present work, we have achieved now much better agreement with the experiment remaining completely within a single physical mechanism exploited for the theoretical interpretation of the many-polaron optical response. Strontium titanate exhibits probably the strongest manifestation of the effect of dynamic screening with respect to other known polar crystals because of an extremely large ratio, especially at low temperatures.
There is also a remarkable agreement between the present theory and the experimental results [2] in what concerns the high-frequency dependence of the optical conductivity (in the range ), achieved without adjustment, using reliable material parameters known from literature. This agreement is in line with experimentally substantiated conclusion [39] that polarons in SrTiO are large rather than small.
The developed method has of course less predictive accuracy than ab initio calculations supported by an outstanding progress of the computation power. The semianalytic approaches have, as shown above, an advantage to give a transparent physical picture of observable features of the many-polaron response spectra. In this connection, it would be interesting to compare the obtained results with those calculated from the first principles, fore example, DFT. At present, such a comparison is still problematic, because the ab initio calculation of the many-polaron optical conductivity is much more complicated than the semianalytic treatment. It is not yet clear whether DFT is capable of providing the optical response for many-polaron systems. In the recent review [19], the Kubo formula for a many-polaron optical conductivity has been derived from the first principles. However, its practical application has not yet been fully realized. As noted in Ref. [19], “in practice, the current-current correlation function is seldom evaluated exactly. Instead, it is common to work in the independent-particle approximation”, which is in fact equivalent to the single-polaron approach (maybe including many-polaron effects through corrections to single-polaron parameters). Moreover, the first-principle theory of the polaron response is at present still restricted to the DC mobility. Consequently, a comparison of our semianalytic approach with the first-principle calculations can be a subject of the future work.
The present theory can be straightforwardly applied to other complex polar crystals where large polarons are physically relevant, particularly to doped cuprates. Even an earlier version [12] of the present method shows a good agreement to experimental data [1]. This confirms independently the validity of the exploited physical approach for the optical response of crystals where an interacting large-polaron gas is realized.
Author Contributions
Conceptualization, S.K., J.T., J.T.D., C.F. and G.K.; methodology, S.K. and J.T.; software, S.K.; validation, S.K. and J.T.; formal analysis, S.K. and J.T.; investigation, S.K. and J.T.; resources, C.F. and G.K.; data curation, S.K., C.F. and G.K.; writing–original draft preparation, S.K.; writing–review and editing, S.K., J.T., J.T.D., C.F. and G.K.; supervision, J.T. and J.T.D.; project administration, J.T.; funding acquisition, J.T., C.F. and G.K. All authors have read and agreed to the published version of the manuscript.
Funding
This research was funded by the joint FWO-FWF project POLOX (Grant No. I 2460-N36).
Acknowledgments
We thank D. van der Marel for the experimental data on the optical absorption of SrTiO.
Conflicts of Interest
The authors declare no conflict of interest.
Appendix A. Analytic Model for the Conductivity Band in SrTiO3
For the calculation of the many-polaron response, it is useful to simulate numerical data for the band structure by an analytic expression. Here, we treat the tight-binding expression similarly to Refs. [2,13]. In these works, an analytic parametrization of the ab initio band structure is introduced using the matrix Hamiltonian:
with the energies which enter the diagonal part of this matrix Hamiltonian,
where is the lattice constant. The matrix W describes the mixing of subbands within the conductivity band, which comes from the spin-orbit coupling in first-principle calculations. For the cubic phase of SrTiO, counting the band energy from the G point (i.e., dropping a uniform shift of the whole band), W is given by:
Here, the parameter D at the main diagonal of W describes a uniform shift of each subband due to the spin-orbit coupling, while the parameter is responsible for mixing between different subbands. The values of parameters entering the analytic parametrization are determined from the numeric fit to the ab initio band structure. They are described in Section 4.
References
- Lupi, S.; Maselli, P.; Capizzi, M.; Calvani, P.; Giura, P.; Roy, P. Evolution of a Polaron Band through the Phase Diagram of Nd2−xCexCuO4−y. Phys. Rev. Lett. 1999, 83, 4852. [Google Scholar] [CrossRef] [Green Version]
- Van Mechelen, J.L.M.; Van der Marel, D.; Grimaldi, C.; Kuzmenko, A.B.; Armitage, N.P.; Reyren, N.; Hagemann, H.; Mazin, I.I. Electron-Phonon Interaction and Charge Carrier Mass Enhancement in SrTiO3. Phys. Rev. Lett. 2008, 100, 226403. [Google Scholar] [CrossRef] [PubMed] [Green Version]
- Genzel, L.; Wittlin, A.; Bauer, M.; Cardona, M.; Schönherr, E.; Simon, A. Phonon anomalies and range of superconducting energy gaps from infrared studies of YBa2Cu3O7−δ. Phys. Rev. B 1989, 40, 2170. [Google Scholar] [CrossRef]
- Calvani, P.; Capizzi, M.; Lupi, S.; Maselli, P.; Paolone, A.; Roy, P. Polaronic optical absorption in electron-doped and hole-doped cuprates. Phys. Rev. B 1996, 53, 2756. [Google Scholar] [CrossRef] [PubMed] [Green Version]
- Lupi, S.; Capizzi, M.; Calvani, P.; Ruzicka, B.; Maselli, P.; Dore, P.; Paolone, A. Fano effect in the a-b plane of Nd1.96Ce0.04CuO4+y: Evidence of phonon interaction with a polaronic background. Phys. Rev. B 1998, 57, 1248. [Google Scholar] [CrossRef] [Green Version]
- Zhang, J.G.; Bi, X.X.; McRae, E.; Eklund, P.C.; Sales, B.C.; Mostoller, M. Optical studies of single-crystal Nd2−xCexCuO4−δ. Phys. Rev. B 1991, 43, 5389. [Google Scholar] [CrossRef]
- Homes, C.C.; Clayman, B.P.; Peng, J.L.; Greene, R.L. Optical properties of Nd1.85Ce0.15CuO4. Phys. Rev. B 1997, 56, 5525. [Google Scholar] [CrossRef]
- Devreese, J.T.; Alexandrov, A.S. Fröhlich polaron and bipolaron: Recent developments. Rep. Prog. Phys. 2009, 72, 066501. [Google Scholar] [CrossRef] [Green Version]
- Alexandrov, A.S.; Devreese, J.T. Advances in Polaron Physics; Springer: Berlin, Germany, 2009. [Google Scholar]
- Devreese, J.T.; Tempere, J. Large-polaron effects in the infrared spectrum of high-Tc cuprate superconductors. Solid State Commun. 1998, 106, 309. [Google Scholar] [CrossRef]
- Eagles, D.M.; Lobo, R.P.; Gervais, F. Infrared absorption in oxides in the presence of both large and small polarons. Phys. Rev. B 1995, 52, 6440. [Google Scholar] [CrossRef]
- Tempere, J.; Devreese, J.T. Optical absorption of an interacting many-polaron gas. Phys. Rev. B 2001, 64, 104504. [Google Scholar] [CrossRef] [Green Version]
- Devreese, J.T.; Klimin, S.N.; van Mechelen, J.L.M.; Van Der Marel, D. Many-body large polaron optical conductivity in SrTi1−xNbxO3. Phys. Rev. B 2010, 81, 125119. [Google Scholar] [CrossRef] [Green Version]
- Hao, X.; Wang, Z.; Schmid, M.; Diebold, U.; Franchini, C. Coexistence of trapped and free excess electrons in SrTiO3. Phys. Rev. B 2015, 91, 085204. [Google Scholar] [CrossRef] [Green Version]
- Giustino, F. Electron-phonon interactions from first principles. Rev. Mod. Phys. 2017, 89, 015003. [Google Scholar] [CrossRef] [Green Version]
- Sio, W.H.; Verdi, C.; Poncé, S.; Giustino, F. Ab initio theory of polarons: Formalism and applications. Phys. Rev. B 2019, 99, 235139. [Google Scholar] [CrossRef] [Green Version]
- Sio, W.H.; Verdi, C.; Poncé, S.; Giustino, F. Polarons from First Principles, without Supercells. Phys. Rev. Lett. 2019, 122, 246403. [Google Scholar] [CrossRef] [PubMed] [Green Version]
- Reticcioli, M.; Diebold, U.; Kresse, G.; Franchini, C. Small Polarons in Transition Metal Oxides. In Handbook of Materials Modeling; Andreoni, W., Yip, S., Eds.; Springer: Cham, Switzerland, 2019. [Google Scholar]
- Poncé, S.; Li, W.; Reichardt, S.; Giustino, F. First-principles calculations of charge carrier mobility and conductivity in bulk semiconductors and two-dimensional materials. Rep. Progr. Phys. 2020, 83, 036501. [Google Scholar]
- Lemmens, L.F.; Devreese, J.T. Collective excitations of the polaron-gas. Solid State Commun. 1974, 14, 1339. [Google Scholar] [CrossRef]
- Peeters, F.M.; Devreese, J.T. Impedance function of large polarons: An alternative derivation of the Feynman-Hellwarth-Iddings-Platzman theory. Phys. Rev. B 1983, 28, 6051. [Google Scholar] [CrossRef]
- De Filippis, G.; Cataudella, V.; de Candia, A.; Mishchenko, A.S.; Nagaosa, N. Alternative representation of the Kubo formula for the optical conductivity: A shortcut to transport properties. Phys. Rev. B 2014, 90, 014310. [Google Scholar] [CrossRef] [Green Version]
- Devreese, J.T.; Lemmens, L.F.; Van Royen, J. Sum rule leading to a relation between the effective mass and the optical absorption of free polarons. Phys. Rev. B 1977, 15, 1212. [Google Scholar] [CrossRef]
- Fröhlich, H. Electrons in lattice fields. Adv. Phys. 1954, 3, 325. [Google Scholar]
- Toyozawa, Y. Polarons in Ionic Crystals and Polar Semiconductors; North-Holland Publishing Company: Amsterdam, The Netherlands, 1972; pp. 1–27. [Google Scholar]
- Zheng, R.; Taguchi, T.; Matsuura, M. Theory of long-wavelength optical lattice vibrations in multinary mixed crystals: Application to group-III nitride alloys. Phys. Rev. B 2002, 66, 075327. [Google Scholar] [CrossRef]
- Mermin, N.D. Lindhard Dielectric Function in the Relaxation-Time Approximation. Phys. Rev. B 1970, 1, 2362. [Google Scholar] [CrossRef]
- Arkhipov, Y.V.; Ashikbayeva, A.B.; Askaruly, A.; Davletov, A.E.; Tkachenko, I.M. Dielectric function of dense plasmas, their stopping power, and sum rules. Phys. Rev. E 2014, 90, 053102. [Google Scholar] [CrossRef] [PubMed]
- Röpke, G.; Selchow, A.; Wierling, A.; Reinholz, H. Lindhard dielectric function in the relaxation-time approximation and generalized linear response theory. Phys. Lett. A 1999, 260, 365. [Google Scholar]
- Barriga-Carrasco, M.D. Influence of damping on proton energy loss in plasmas of all degeneracies. Phys. Rev. E 2007, 76, 016405. [Google Scholar] [CrossRef]
- Barriga-Carrasco, M.D. Full conserving dielectric function for plasmas at any degeneracy. Laser Particle Beams 2010, 28, 307. [Google Scholar] [CrossRef]
- Morawetz, K.; Fuhrmann, U. General response function for interacting quantum liquids. Phys. Rev. E 2000, 61, 2272. [Google Scholar] [CrossRef] [Green Version]
- Yamaguchi, M.; Inaoka, T.; Hasegawa, M. Electronic excitations in a nonparabolic conduction band of an n-type narrow-gap semiconductor. Phys. Rev. B 2002, 65, 085207. [Google Scholar] [CrossRef] [Green Version]
- Klimin, S.N.; Tempere, J.; Devreese, J.T.; He, J.; Franchini, C.; Kresse, G. Superconductivity in SrTiO3: Dielectric Function Method for Non-Parabolic Bands. J. Supercond. Novel Magnet. 2019, 32, 2739. [Google Scholar] [CrossRef] [Green Version]
- Eagles, D.M. Theory of Transitions from Large to Nearly-Small Polarons, with Application to Zr-Doped Superconducting SrTi O3. Phys. Rev. 1969, 181, 1278. [Google Scholar] [CrossRef]
- Van Der Marel, D.; van Mechelen, J.L.M.; Mazin, I.I. Common Fermi-liquid origin of T2 resistivity and superconductivity in n-type SrTiO3. Phys. Rev. B 2011, 84, 205111. [Google Scholar] [CrossRef] [Green Version]
- Ergönenc, Z.; Kim, B.; Liu, P.; Kresse, G.; Franchini, C. Converged GW quasiparticle energies for transition metal oxide perovskites. Phys. Rev. Mater. 2018, 2, 024601. [Google Scholar]
- Hedin, L. New Method for Calculating the One-Particle Green’s Function with Application to the Electron-Gas Problem. Phys. Rev. A 1965, 3, A796. [Google Scholar] [CrossRef]
- Meevasana, W.; Zhou, X.J.; Moritz, B.; Chen, C.C.; He, R.H.; Fujimori, S.I.; Lu, D.H.; Mo, S.K.; Moore, R.G.; Baumberger, F.; et al. Strong energy-momentum dispersion of phonon-dressed carriers in the lightly doped band insulator SrTiO3. New J. Phys. 2010, 12, 023004. [Google Scholar] [CrossRef]
Figure 1.
Many-polaron optical conductivity of n-doped SrTiO in the mid-infrared frequency range for several values of the doping x and two temperatures (the parameters are indicated in the figure), corresponding to the experimental conditions of Ref. [2]. The calculated spectra (solid curves) are compared with the experimental data (dashed curves). Dotted curves show the results of Ref. [13]. The subgraphs correspond to the following cases: in (a,b) doping relative concentration is , for K (a) and K (b). The panels (c,d), (e,f), (g,h), describe the results for , and , respectively.

© 2020 by the authors. Licensee MDPI, Basel, Switzerland. This article is an open access article distributed under the terms and conditions of the Creative Commons Attribution (CC BY) license (http://creativecommons.org/licenses/by/4.0/).
Share and Cite
MDPI and ACS Style
Klimin, S.; Tempere, J.; Devreese, J.T.; Franchini, C.; Kresse, G. Optical Response of an Interacting Polaron Gas in Strongly Polar Crystals. Appl. Sci. 2020, 10, 2059. https://doi.org/10.3390/app10062059
AMA Style
Klimin S, Tempere J, Devreese JT, Franchini C, Kresse G. Optical Response of an Interacting Polaron Gas in Strongly Polar Crystals. Applied Sciences. 2020; 10(6):2059. https://doi.org/10.3390/app10062059
Chicago/Turabian StyleKlimin, Serghei, Jacques Tempere, Jozef T. Devreese, Cesare Franchini, and Georg Kresse. 2020. "Optical Response of an Interacting Polaron Gas in Strongly Polar Crystals" Applied Sciences 10, no. 6: 2059. https://doi.org/10.3390/app10062059
Note that from the first issue of 2016, this journal uses article numbers instead of page numbers. See further details here.