1. Introduction
Renewable energy attracts attention for the protection of the environment and supplies our energy needs by reducing dependence on petroleum and non-renewable energy sources. Bio-ethanol, which is one of the energy sources, is known to be a potential alternative to petroleum-derived fuels and has the potential to meet the increasing demand for energy for industrial processes, heating and transportation [
1]. In 2009, 19,534.99 millions of gallon of ethanol were produced worldwide [
2]. The U.S. and Brazil are the two major countries and produced 10,600.00 and 6,577.89 million gallon of ethanol in 2009, respectively [
2]. However, the U.S. is still the largest petroleum consumer in the world and consumed 18.8 million barrels per day of petroleum products in 2011. Advanced bio-fuels (may include ethanol derived from cellulose, sugar or starch, or waste material, including crop residue, other vegetative waste material, animal waste, and food waste) production under The U.S. Renewable Fuel Standard (RFS) scenario could reduce U.S. petroleum import by approximately $23 billion in 2016 according to the report for “U.S. Economic Impact of Advanced Biofuels Production: Perspectives to 2030” [
3].
Sugar cane, as a raw material, is used for 60% of global ethanol production, however; corn is the main raw material of ethanol production in the United States (90%) [
1]. These carbon sources are high value products as a food source [
4,
5]. Potato is another high value crop as a food source and currently, utilized 60% frozen, 14% fresh, 13% chip, 13% dehydrated, and 1% potato seedin the US [
6]. Today, the U.S. produces about 460 billion pound of potatoes annually on 1.3 million acres with an approximate value of 3$ billion. During processing of potato, some of the potatoes wasted, for example 18% in the potato chips industry and 5%–20% in potato cultivation [
7,
8] Keystone Potato Products, LLC (Hegins, PA) manufactures potato products including potato flakes with the capacity of 7,700 kg/h, out of 900 kg skin and 225 kg low quality waste mash potato per h (Personal communication with Keith Masser). Therefore, the waste from potato industry can be utilized as growth media for the fermentation processes. The wastes of potato industry are currently being utilized as animal feed [
9]. However, they can be consumed for ethanol production without requiring drying process. Waste of potato industry could be an economical carbon source for ethanol fermentation in the industry, because of high starch content of potato wastes. Waste potato mash is a waste of potato flakes process and composed of approximately 80% moisture.
Hydrolysis is a process of breaking down starch (amylopectin and amylose) into fermentable sugars and is needed before the fermentation. Hydrolysis is carried out at high temperature (90–110 °C); however, at low temperatures, it is possible and can contribute to energy savings [
10]. To convert starch into the fermentable sugars, either acid hydrolysis or enzymatic hydrolysis needs to be performed. Each has their own set of advantages and disadvantages for use. The limitations of acid hydrolysis can be by-products inhibition on growth of yeast (such as 5-hydroxymethylfurfural (5-HMF)), neutralization before fermentation and expensive constructional material due to corrosion risks [
11]. On the other hand, high prices of enzymes play a crucial role when feasibility is of concern. Enzyme hydrolysis is chosen even though high cost of enzymes and initial investment because of high conversion yield of glucose [
11]. Amylases (α-amylase, β-amylase, and glucoamylase) are employed for hydrolysis of starchy materials. Although amylases are derived from plants, animals, and microorganisms, microbial amylases are in use commonly [
12]. α-Amylase (endo-1,4-α-D-glucan glucohydrolase, EC 3.2.1.1) hydrolyses the 1,4-α-D-glucosidic linkages in the linear amylase chain, randomly. However, glucoamylase (exo-1,4-α-D-glucan glucohydrolase, EC 3.2.1.3) cleaves the 1,6-α-linkages at the branching points of amylopectin as well as 1,4-α-linkages [
13].
Response Surface Methodology (RSM) is a combination of mathematical and statistical techniques and used for the modeling and analysis of problems in which a response of interest is influenced by several variables and the objective is to optimize this response [
14]. Furthermore, Box-Behnken is a sub-category of response surface design and is used to study the quadratic effect of factors after identifying the significant factors using screening factorial experiments. The advantage of this method is a reduced number of samples and replicates (12 edges for three factors with three levels; for a total of 12 data points) and the center of the factor space (center point is replicated three times, in total 15 data points), whereas the full factorial design has 27 data points (3 factors × 3 levels × 3 replicates). The three variables (X1, X2, and X3) can predict what the response of product production (Y) is.
Ethanol production from waste potato is a relatively new topic and limited research has been conducted about the utilization of potato waste for ethanol production. Fadel [
7] and Liimatainen
et al. [
8] showed that different wastes of potato industry can be a carbon source for yeast during alcohol fermentation by studying waste from potato chips industry (98.67% total carbohydrate) and different potato cultivations (starch content in a range of 11.2% to over 19.3%), respectively. Fadel [
7] reported that the highest alcohol concentration (13.2%
v/
v) was achieved after 24 h at 34 °C in a medium contained 25%
w/
v glucose with initial pH level of 5, using 0.075% urea as the sole nitrogen source, 0.05% orthophosphoric acid; 8% inoculum size (
v/
v) and agitation rate of 100 rpm.
Therefore, this study was undertaken to further investigation of optimum liquefaction and saccharification conditions specifically for waste potato mash while evaluating fermentation parameters, such as pH, inoculum size and nitrogen sources for ethanol production from waste potato mash.
2. Experimental Section
2.1. Microorganism and Medium
Saccharomyces cerevisiae (ATCC 24859) was obtained from the American Type Culture Collection (Manassas, VA, USA). To prepare inoculum, S. cerevisiae was grown in medium composed of 20 g/L of glucose (Domino Sugar, Domino Foods Inc., Yankers, NY, USA), 6 g/L of yeast extract (Difco, Sparks, MD, USA), 0.3 g/L of CaCl2·2H2O, 4 g/L of (NH4)2SO2, 1 g/L of MgSO4·7H2O, and 1.5 g/L of KH2PO4 at 30 °C for 24 h. In order to maintain viability, the culture was stored at 4 °C and sub-cultured biweekly, whereas stock cultures were kept in 20% glycerol at −80 °C.
2.2. Waste Potato Mash
Waste potato mash was obtained from Keystone Potato Products (Hegins, PA, USA), which manufactures potato flakes commercially. There were a variety of potatoes used throughout the study, including Frito-lay FL 1833, Atlantis, and Russet Burbank. The starch content of waste potato mash was 17%–24%. Waste potato mash was stored at −20 °C until use without any pretreatment.
2.3. Enzymes
α-Amylase (EC 3.2.1.1) for liquefaction and amyloglucosidase (EC 3.2.1.3) for saccharification were used. These enzymes were manufactured by Novozyme Corporation and distributed by Sigma-Aldrich (Saint Louis, MO, USA). Their activity or concentration was reported as 18.8 mg protein/mL for α-amylase and 300 Unit/mL for amyloglucosidase by the manufacturer.
2.4. Hydrolysis of Starch
2.4.1. Experimental Design
Response Surface Methodology (RSM) was employed to optimize three experimental factors for optimization of liquefaction and saccharification of waste potato mash. RSM with a three-factor, three-level Box–Behnken design [
15] was used to optimize the response as % loss in non-dissolved solid for three variables.
The actual factor levels corresponding to coded factor levels are shown in
Table 1 and
Table 2. The ranges of factor levels for experimental design were selected based on our preliminary studies (unpublished data). The optimal conditions for maximum loss in non-dissolved solid and glucose conversion were estimated by statistical analysis using Minitab (Version 13.3; Minitab Inc., State College, PA, USA). The coefficients in the second-order polynomial were calculated by multiple regression analysis on the experimentally obtained data.
Table 1.
Levels of factors chosen for the experimental design of liquefaction.
Table 1.
Levels of factors chosen for the experimental design of liquefaction.
| Factors | Symbols | Coded Levels |
|---|
| −1 | 0 | 1 |
|---|
| Temperature (°C) | X1 | 50 | 72.5 | 95 |
| Enzyme dose (mL) | X2 | 0.2 | 0.6 | 1 |
| Dry weight of WPM * (g/100 mL) | X3 | 1 | 5.5 | 10 |
Table 2.
Levels of factors chosen for the experimental design of saccharification.
Table 2.
Levels of factors chosen for the experimental design of saccharification.
| Factors | Symbols | Coded Levels |
|---|
| −1 | 0 | 1 |
|---|
| Temperature (°C) | X1 | 30 | 45 | 60 |
| Enzyme dose (mL) | X2 | 0.2 | 0.6 | 1 |
| Time (h) | X3 | 24 | 48 | 72 |
2.4.2. Liquefaction
Various concentrations of waste potato mash slurries were prepared and pH of the slurry was adjusted to 6.5 by 1 N NaOH. The mixture was agitated at 120 rpm agitation in a shaker water bath for 3 h at temperature chosen by the design based on the preliminary study. Also, 0.2, 0.6, and 1 mL of α-amylase solution, and 1, 5.5, and 10 g dry weight of waste potato mash/100 mL of DI water in 250 mL flasks were evaluated to determine the optimum combination based on the Box-Behnken design. Initial and final samples were taken and analyzed for non-dissolved solid in the mixture to determine optimum condition to yield the maximum loss in dry weight and non-dissolved solid ratio. After optimum combination was obtained, three run was performed at this combination for verification.
The %loss (Equation (1)) in dry weight for liquefaction was chosen as response variable to optimize conditions of liquefaction and calculated as follows:
2.4.3. Saccharification
Liquefied slurry, which was processed at the determined optimum liquefaction condition, was used for saccharification. Box-Behnken RSM design was constructed by the Minitab Statistical Software (Version 13.3; Minitab Inc., State College, PA, USA). Various volumes of enzyme solution (1, 0.6, and 0.2 mL of amyloglucosidase solution) and various temperatures (30, 45, and 60 °C) were evaluated to determine the optimum combination based on the Box-Behnken design as well as three different incubation times (24, 48, and 72 h). Also, agitation was set up at 120 rpm in a shaker water bath. For verification, saccharification at determined optimum combination was performed in triplicate. Samples were taken at the end of the process and analyzed for glucose concentration to determine optimum temperature-time-enzyme concentration combination after 20-fold dilution without any other sample preparation step.
After optimization of hydrolysis, enzyme concentration and dry weight levels increased with same ratio at the same temperature to obtain more glucose. As a result, a linear relation was obtained with a 0.9985 R2.
2.6. Ethanol Fermentation
Sartorious Biostat B Plus Bioreactors (Allentown, PA, USA) with 2.5 L vessel (working volume of 1.5 L) equipped with pH, temperature, and agitation controls were used. Temperature was maintained at 30 °C and agitation was maintained at 400 rpm. pH was controlled at 5.5 by adding 4 N NaOH or 4 N H2SO4. Inoculum was grown for 24 h at 30 °C. After inoculation, 48 h fermentation was carried out and samples were taken every two hour first 12 h of fermentation whereas every 6 h during the remaining of the fermentation time.
2.7. Analysis
2.7.1. Microbial Cell Population
The spiral plating method was used to determine cell population by using a spiral auto-plater (Model 4000, Spiral Biotech, Norwood, MA, USA) and Q-count software (Version 2.1; Spiral Biotech, Norwood, MA, USA). Collected samples were serially diluted 0.1% peptone water and spiral plated on potato dextrose agar (Difco, MD, USA). After 24 h incubation at 30 °C, Q-count software (Version 2.1; Spiral Biotech) was used for enumeration. Results were indicated as log10 CFU/mL.
2.7.2. Glucose and Ethanol
Samples were analyzed for glucose and ethanol concentrations by using YSI 2700 Analyzer (Yellow Springs, OH, USA). YSI analyzer included specific membranes for each of the components as well as system buffers and calibration solutions. One milliliter of samples was diluted by 20 fold to bring the concentration of either ethanol or glucose in the range and then analyzed by YSI Analyzer.
2.7.3. Moisture Analysis
To determine moisture of waste potato mash, samples were weighed and drying process was carried out at 105 °C in an oven for 48 h until weight of samples stabilized.
2.7.4. Non-Dissolved Solid Analysis
The liquefaction slurry was centrifuged at 4,000 rpm for 30 min. After the supernatant is discarded, the distilled water was used to wash the solid and the washing process was repeated two times. Then the mixture was dried in an oven at 105 °C for 24 h. The solid was weighed and percentage loss was calculated with the respect to the initial slurry as the non-dissolved solid (Equation (1)).
2.7.5. Statistical Analysis
Statistical analysis was conducted to test significant differences between each treatment. In particular, the two-sample t test, ANOVA, and Dunnett tests were used to test for significant differences between the mean of production rate and growth rate values of each treatment. Since controlled and uncontrolled pH were compared, the two-sample t-test was chosen, whereas ANOVA was chosen for inocula sizes and nitrogen sources due to number of parameters [
16]. The Dunnett test was used to determine whether any of nitrogen sources yields statistically different than yeast extract. The level of significance was set at 0.05. Statistical analysis was performed using Minitab Statistical Software (Version 13.3; Minitab Inc., State College, PA, USA).
3. Results and Discussion
3.1. Liquefaction and Saccharification
By applying multiple regression analysis on the experimentally determined data, the regression coefficients were estimated and the following second-order polynomial equation (Equation (2)) was obtained using Minitab software:
The lowest loss in non-dissolved solids of waste potato mash observed at the combination of 50 °C, 0.6 mL of α-amylase, and 10 g dry waste potato mash with a 43.7% loss. On the other hand, the maximum loss in non-dissolved solids of waste potato mash observed at the combination of 95 °C, 0.6 mL of α-amylase, and 1 g dry waste potato mash with a 79% loss (
Table 3). Also, %loss is compared for 1 and 10 g dry waste potato mash while temperature and enzyme concentrations were kept same to determine the enzyme-substrate relation.
Table 3.
Box–Behnken design matrix for the three factors and their experimental results for liquefaction.
Table 3.
Box–Behnken design matrix for the three factors and their experimental results for liquefaction.
| Run | | Factors | % Loss |
|---|
| | X1 | X2 | | X3 | Experimental | Predicted |
|---|
| 1 | | 50 | 0.2 | | 5.5 | 52.1 | 60.95 |
| 2 | | 72.5 | 0.2 | | 10 | 58.07 | 39.68 |
| 3 | | 72.5 | 0.6 | | 5.5 | 60.09 | 57.48 |
| 4 | | 95 | 0.6 | | 10 | 52.1 | 62.39 |
| 5 | | 95 | 1 | | 5.5 | 65.13 | 56.27 |
| 6 | | 95 | 0.6 | | 1 | 79 | 69.47 |
| 7 | | 72.5 | 0.2 | | 1 | 72.41 | 73.84 |
| 8 | | 72.5 | 1 | | 10 | 54.37 | 52.93 |
| 9 | | 50 | 1 | | 5.5 | 50.03 | 41.93 |
| 10 | | 72.5 | 1 | | 1 | 5.77 | 24.15 |
| 11 | | 72.5 | 0.6 | | 5.5 | 60.05 | 57.48 |
| 12 | | 95 | 0.2 | | 5.5 | 65.59 | 73.68 |
| 13 | | 72.5 | 0.6 | | 5.5 | 52.32 | 57.48 |
| 14 | | 50 | 0.6 | | 10 | 43.73 | 53.25 |
| 15 | | 50 | 0.6 | | 1 | 61.84 | 51.54 |
From counterplots, it can be seen that higher dry waste potato mash require higher levels of enzymes (Data not shown). When counterplots are interpreted, it can be seen that increasing temperature (more than 95 °C) might have resulted higher % loss, but at that time enzyme would not be active. By using the results of Box-Behnken design, Box-Behnken optimizer was used to determine optimum conditions of liquefaction, and then an optimum parameter combination suggested as 95 °C, 1 mL of α-amylase, and 4.04 g dry weight of waste potato mash per 100 mL of deionized water, with a prediction of 68.8% loss in dry weight. Verification for this optimum combination was performed with three replications and 74 ± 0.05% of loss in non-dissolved components was obtained, which is very close the estimated value by the RSM optimizer.
Waste potato mash slurry, 4.04 g dry weight of waste potato mash per 100 mL of deionized water, was liquefied at 95 °C after addition of 1 mL of α-amylase solution, which was determined as optimum combination for liquefaction process. This liquefied slurry obtained at the optimum liquefaction conditions was used for saccharification. By applying multiple regression analysis on the experimentally determined data, the regression coefficients were estimated as shown in the following second-order polynomial equation (Equation (3)) was obtained using Minitab software:
Results of saccharification were summarized as glucose concentration, because saccharification is a conversion of liquefied starch to glucose (
Table 4). Levels of temperature were 30, 45, and 60 °C, whereas 0.2, 0.6, and 1 mL of amyloglucosidase solutions were compared to find out optimum combination for saccharification. Moreover, time was another factor, which also had three levels; 24, 48, and 72 h. Minimum glucose (19.2 g/L) obtained at 30 °C, 0.2 mL of amyloglucosidase, and 48 h combination. Maximum glucose concentration was found at 60 °C, 72 h and 0.6 mL of amyloglucosidase with 30.7 g/L glucose concentration. Although longer saccharification might result in higher glucose conversion, this wasn’t recommended due to high energy costs. By using the results of Box-Behnken design, Box-Behnken optimizer was used to determine optimum conditions of saccharification, an optimum parameter combination suggested as 60 °C, 0.8 mL of amyloglucosidase, and 72 h. Validation for this optimum combination was performed with three replications and 34.9 g/L glucose was obtained, which is very close the estimated value by the optimizer.
It is reported that the highest dextrose equivalent of 94% was achieved after acid hydrolization of fresh potato tubers [
11]. Another study showed that 825.1 mg/g glucose content can be obtained when 100 units of α-amylase and 80 units of amyloglucosidase to hydrolyze potato pulp with enzymes from Sigma [
17]. Arapoglou
et al. [
18] reported that 19.37 g/L of total amount of sugars was achieved after acidic hydrolysis of potato peel waste. Studies show that glucose conversions of starchy materials are subject to characteristic of raw materials, type of enzyme, dosage of enzyme, temperature, and pH.
Waste potato mash is a potential fermentation medium for industrial ethanol fermentation. Although a promising glucose concentration (34.9 g/L) was generated by enzyme treatment, glucose concentration was still far away from desired glucose level for typical ethanol fermentation. The amount of waste potato mash and enzyme were increased simultaneously while ratio obtained from Box-Behken RSM optimization was kept constant. To enhance the conversion yield, amount of enzyme and waste potato mash were increased with linear approach and evaluated. The reason for increasing only the amount of enzymes and waste potato mash and holding the time and temperature is that it was seen that enzyme and amount of waste potato mash have a significant effect on the glucose conversion yield from the results of Box-Behnken RSM. There was a linear regression between glucose concentration and amounts of enzyme and dry weight of waste potato mash with a 0.9985 R2 (data not shown). Based on the average of three replications, 16.16 g dry weight/100 mL DEIONIZED WATER was the best choice with 93.5 g/L glucose yield at the end of saccharification as well as viscosity of the mixture, which allows a reasonable agitation.
Table 4.
Box–Behnken design matrix for the three factors and their experimental results for saccharification.
Table 4.
Box–Behnken design matrix for the three factors and their experimental results for saccharification.
| Run Order | Factors | Glucose (g/L) |
|---|
| X1 | X2 | X3 | Experimental | Predicted |
|---|
| 1 | 45 | 1 | 5.572 | 20.7 | 22.1 |
| 2 | 45 | 0.6 | 48 | 24.5 | 22.9 |
| 3 | 45 | 0.6 | 48 | 22.4 | 22.9 |
| 4 | 30 | 0.6 | 24 | 22.7 | 22.4 |
| 5 | 60 | 0.6 | 24 | 21.1 | 22.2 |
| 6 | 60 | 1 | 48 | 28.2 | 26.4 |
| 7 | 30 | 1 | 48 | 24 | 23.7 |
| 8 | 45 | 1 | 24 | 21.7 | 22.3 |
| 9 | 60 | 0.6 | 72 | 30.7 | 31 |
| 10 | 45 | 0.2 | 72 | 26 | 25.4 |
| 11 | 30 | 0.2 | 48 | 19.2 | 20.9 |
| 12 | 45 | 0.2 | 24 | 20.6 | 19.2 |
| 13 | 60 | 0.2 | 48 | 29.2 | 29.4 |
| 14 | 45 | 0.6 | 48 | 22 | 22.9 |
| 15 | 30 | 0.6 | 72 | 20.7 | 19.5 |
3.2. Effect of pH on Ethanol Production
Ethanol fermentation was evaluated at two different pH profiles to determine the effect of pH: uncontrolled pH and controlled pH at 5.5.
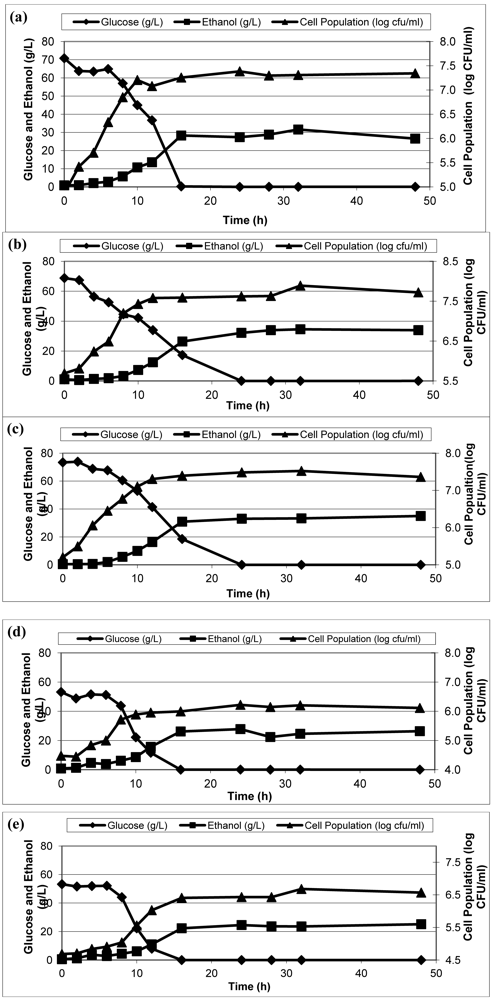
Figure 1 shows the cell population and concentrations of glucose and ethanol in the fermentation broth with controlled pH at 5.5 and uncontrolled pH. The results clearly indicate that a higher growth rate for biomass was obtained with the controlled pH at 5.5 (0.496 log CFU/mL/h) than uncontrolled pH (0.289 log CFU/mL/h).
Figure 1.
Glucose and ethanol, and biomass concentrations at pH 5.5 (a) and uncontrolled pH (b).
Figure 1.
Glucose and ethanol, and biomass concentrations at pH 5.5 (a) and uncontrolled pH (b).
Furthermore, the maximum ethanol concentration and production rates were 27.7 g/L and 5.47 g/L/h, respectively at controlled pH 5.5, whereas 22.75 g/L and 2.22 g/L/h were obtained at uncontrolled pH. Yields of the fermentations (product produced /substrate consumed) were similar; 46.23% and 44.55% for controlled and uncontrolled pH profiles, respectively. For controlled pH, glucose concentration of the fermentation medium began to increase during the first few hours of fermentation instead of reduction, which might be due to saccharification was still in progress (
Figure 1). Therefore, glucose conversion continued simultaneously during earlier stage of the fermentation, and after 24 h of fermentation, glucose was completely consumed. This increase of glucose enhances ethanol yield and growth of biomass.
Yields of the fermentations (product produced/substrate consumed) were similar; 46.23% and 44.55% for controlled and uncontrolled pH profiles, respectively. However, it was difficult to determine the exact amount of consumed glucose because saccharification was still being performed in the earlier stage of fermentation. Therefore, determination of optimum pH was dependent on growth rate, production rate, and ethanol concentrations, which indicated that controlled pH at 5.5 is better for ethanol fermentation.
It was reported that high ethanol production was obtained by using initial pH 5.0 to 6.0 [
7], which was in agreement with the results of this study. It was also shown that no ethanol production exists lower than pH 4.0 [
19]. During the uncontrolled pH treatment, however, the minimum observed pH was 4.1. Turhan
et al. [
20] reported that maximum ethanol yield, maximum growth rate, and biomass concentration were obtained at pH 5.5 on carob as a medium for ethanol production. Therefore, pH 5.5 was found to be the best pH level and therefore, used for the rest of the study.
3.3. Effect of Inoculum Size on Ethanol Production
Three different inoculum sizes (1%, 3%, and 5% (
v/
v)) were investigated to determine the effect of inoculum size on kinetic parameters of ethanol fermentation from waste potato mash.
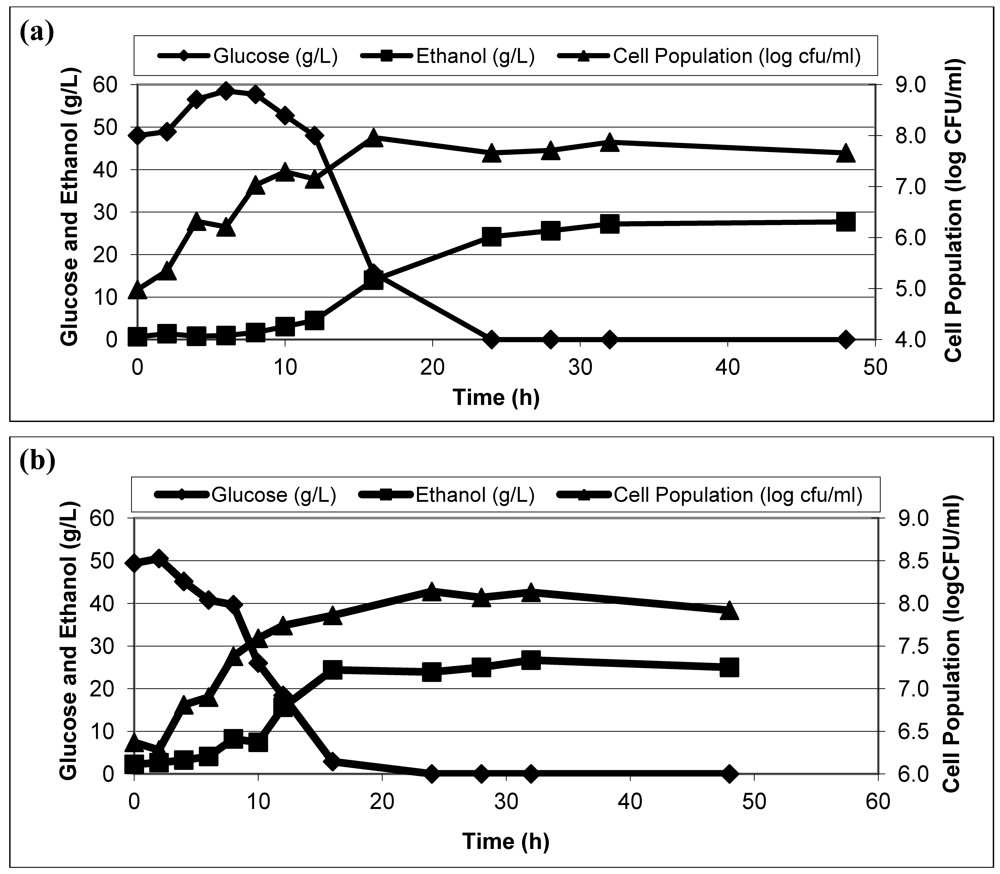
Figure 2 shows the ethanol production (g/L), glucose consumption (g/L), and the cell population (log CFU/mL) over 48 h fermentation periods for all cases. The maximum ethanol productivity (6.48 g/L/h) and maximum growth rate (0.3 log CFU/mL/h) were obtained with 3% inoculation, which produced 30.99 g/L ethanol.
Figure 2.
Ethanol, glucose, and cell population in the fermentation broth with different inoculum size; 1% (a), 3% (b), and 5% (c).
Figure 2.
Ethanol, glucose, and cell population in the fermentation broth with different inoculum size; 1% (a), 3% (b), and 5% (c).
Although 5% inoculum sizes demonstrated a higher ethanol yield; growth rate, production rate and consumption rate were lower than parameters of 3% inoculum size. Among 1, 3, and 5% inoculum sizes, 3% was chosen to be the optimum inoculum by comparing production rate, maximum growth rate and produced ethanol. The highest production rate, growth rate, and produced ethanol were obtained for 3% inoculum size as 6.48 g/L/h, 0.3 log CFU/mL/h, and 30.99 g/L, respectively. There was no statistically significant difference in mean production rate among the inoculum sizes (p > 0.05), however, growth rates were statistically different for inoculum sizes (p < 0.05).
The results demonstrated that there is an increase of ethanol yield up to 3%, however 5% inoculum causes a decrease of kinetic parameters for ethanol fermentation by
S. cerevisiae. Fadel [
7] reported that ethanol production increases by inoculum up to 4%. Furthermore, it was reported that 3% inoculum size was the optimum for ethanol production from carob [
20]. Therefore, 3% inoculum size was also suggested to be the optimum level for ethanol by this study.
3.4. Effect of Nitrogen Sources
In order to find more economical and efficient alternative nitrogen sources, ethanol fermentations were performed in hydrolyzed waste potato mash media by using poultry meal, hull and fines mix, feather meal, and meat and bone instead of yeast extract as the nitrogen source.
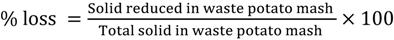
Figure 3 shows ethanol, glucose and cell populations using four different nitrogen sources in fermentation medium.
Figure 3.
Ethanol, glucose and cell populations in the fermentation broth with different nitrogen sources: Yeast extract (a), Feather meal (b), Poultry meal (c),Meat bone meal (d), Hull and fines mix (e).
Figure 3.
Ethanol, glucose and cell populations in the fermentation broth with different nitrogen sources: Yeast extract (a), Feather meal (b), Poultry meal (c),Meat bone meal (d), Hull and fines mix (e).
Although the maximum ethanol yield was attained from poultry meal as 35 g/L ethanol, growth rate, production rate, and consumption rate of poultry meal fermentation (0.211 log CFU/mL/h, 3.2 g/L/h, and −5.35 g/L/h, respectively) were lower compared to yeast extract (growth rate 0.28 log CFU/mL/h; production rate 3.68 g/L/h; and consumption −7.07 g/L/h). The second highest ethanol yield (32 g/L ethanol concentration in final broth) was observed with feather meal, which also had very good results for growth rate (0.28 log CFU/mL/h), production rate (3.59 g/L/h), and consumption rate (5.06 g/L/h). Final ethanol concentrations for hull and fines mix and meat bone meal were less than yeast extract with 24.59 and 25.54 g/L ethanol, respectively, whereas 30.80 g/L ethanol obtained while yeast extract was nitrogen source. Moreover, these two nitrogen sources fell behind in growth and production rates (0.194 log CFU/mL/h and 1.97 g/L/h and 0.13 log CFU/mL/h and 2.36 g/L/h, respectively). Overall, the maximum growth rate was observed with yeast extract and feather meal (both 0.28 log CFU/mL/h). However, maximum production rate was obtained with yeast extract (3.68 g/L/h) with a 30.8 g/L ethanol production.
Although poultry meal has the highest ethanol yield, it has lower growth and production rates compared to yeast extract and feather meal. Statistical analysis showed that there is a significant difference among production rates of different nitrogen sources (p < 0.05). Compared to yeast extract by Dunnett Test and it was concluded that no nitrogen source produces ethanol significantly different than yeast extract (p > 0.05).
According to the results, it can be concluded that all of the animal by-products investigated in this study provide nitrogen for growth of yeast in ethanol fermentation. However, a limitation of the use of alternative nitrogen sources was that these animal-by-products were not 100% soluble, maybe due to partial hydrolysis during manufacturing of these animal by-products, which caused plugging in the tubes of the reactors.
A comparison of poultry meal, hull and fines mix, feather meal and meat bone meal for ethanol production on carob extract by using
S. cerevisiae was reported by Turhan
et al. [
20]. In their study, maximum production rate and ethanol yield among four alternative nitrogen sources were determined by addition of meat bone meal, whereas none of the other evaluated nitrogen sources reached the yield of ethanol and growth rate when yeast extract was added. Graf-Sirakaya and Demirci [
21] also studied the effect of nitrogen sources for ethanol fermentation with S. cerevisiae in a chemically defined media to evaluate seven different animal by-products as a nitrogen source instead of yeast extract. For these studies, yeast extract was compared with poultry meal, hulls and fines mix, beef stock, blood meal, feather meal, pork stock and meat and bone meal [
21]. Pork stock and meat and bone meal were reported as giving the two highest ethanol yields as alternative nitrogen sources, however, the second highest production rate after yeast extract was obtained with poultry meal [
21]. These animal by-products could be alternative nitrogen sources for ethanol production instead of yeast extract although all of them had lower production rates than the yeast extract.
4. Conclusions
In this study, optimal liquefaction and saccharification combinations of three important growth parameters, temperature, enzyme dose, dry weight for liquefaction and temperature-enzyme dose, and time for saccharification were generated using RSM with Box–Behnken design. Optimum combinations were 95 °C, 1 mL of α-amylase, and 4.04 g dry weight of waste potato mash per 100 mL of deionized water and 60 °C, 0.8 mL of amyloglucosidase, and 72 h for liquefaction and saccharification, respectively. The final glucose conversion under optimum medium was 34.9 g/L. Furthermore, higher glucose conversion was obtained by increasing amounts of dry-weight and enzyme by keeping ratio constant. Maximum glucose (137 g/L) was obtained from 24.24 dry-weight/100 mL DIW, however 16.16 g dry-weight/100 mL DIW was promising for ethanol fermentation process when agitation is of concern.
Overall, ethanol fermentation from waste potato mash was found to perform better at pH of 5.5, and 3% inoculum size. The maximum production rate was obtained at pH 5.5, 30 °C, 400 rpm agitation, and 3% inoculum size with a 30.99 g/L ethanol production. By combining optimum conditions, 35 g/L ethanol was produced at pH 5.5 with an inoculum size of 3% when the nitrogen source was poultry meal. However, kinetic parameters of this fermentation were relatively low in comparison with yeast extract and feather meal. Feather meal yielded 32.9 g/L ethanol with 0.28 log CFU/mL/h growth rate and 3.59 g/L/h production rate, which are comparable kinetic parameters to yeast extract. It is clearly indicated that waste potato mash can be an effective fermentation medium for production of ethanol under conditions of controlled pH at 5.5, inoculum size of 3% and supplementation of the nitrogen source. In conclusion, waste potato mash was found promising carbon source for ethanol fermentation with alternate nitrogen sources.

