1. Introduction
Coherent light sources in the mid-infrared spectral region (MIR, 3–20
μm) are highly important for studies in molecular science since a number of molecular vibrations have resonance in this wavelength region. The light source can be applied to various advanced molecular spectroscopies, such as frequency comb spectroscopy for the molecular fingerprint region [
1], pump-probe spectroscopy to trace ultrafast structural dynamics [
2], and control of photodissociation by selective excitation of vibrational states [
3].
On the other hand, intense few-cycle MIR sources are recently getting much attention from the strong-field research community. By using a long wavelength driver laser pulse, it becomes possible to generate shorter wavelength high harmonics due to the ponderomotive energy scaling with square of wavelength [
4]. It may result in shorter attosecond pulse generation via high harmonic generation. Recently, the scaling of the harmonic cutoff was clearly demonstrated with high energy MIR pulses [
5].
A typical MIR femtosecond pulsed laser is based on combination of an optical parametric amplifier (OPA) and difference frequency generation. The OPA with a
β-barium borate (BBO) crystal pumped by the fundamental of a Ti:sapphire amplifier generates a signal and an idler wave in the wavelength range between 1 and 2.5
μm, and the difference frequency generation between the signal and the idler in a AgGaS
2 crystal produces an MIR pulse [
6,
7]. Such a system has already been commercially available (TOPAS, light conversion). This provides the temporal width and the output energy of about 100 fs and several micro joules, respectively. The reason for using the sequential down-conversion process is that the wavelength difference between the pump pulse (800 nm) and the MIR pulse is so large that few crystals are transparent in the both wavelength regions.
As an alternative to the MIR pulse generation with the second-order nonlinear processes, third-order nonlinear processes were considered [
8]. Although third-order processes are much less efficient than second-order processes, a variety of nonlinear media are available since isotropic media can be used for third-order processes. In [
8], the OPA signal (1.2–1.5
μm) and the fundamental of a Ti:sapphire laser were mixed in a calcium fluoride plate or a barium fluoride plate, which are transparent in the wavelength range from 200 nm to 10
μm. Tunable (2.4–7.7
μm) MIR pulses were produced by four-wave mixing (FWM) in fluoride plates [
8]. On the other hand, a broadband spectrum cannot be generated in the MIR region with this scheme, because of a narrow phase-matching bandwidth. The output energy is also limited to a few hundred nano joule level due to the damage threshold of the fluoride plates.
Using gas media instead of solid media would be effective in terms of phase matching bandwidth and damage threshold. However, the nonlinearity of gas media is much smaller than that of bulk media. To overcome the low efficiency, filamentation [
9–
11] in gases can be used. The balance between self-focusing and plasma self-defocusing makes the pulse propagate much longer than the Rayleigh range with a very high intensity. It results in a dramatic enhancement of nonlinear processes occurring in the filamentation zone.
The enhanced nonlinear-optical processes in laser-induced filaments suggest a new strategy for frequency conversion of femtosecond pulses. In contrast to the third harmonic generation process, FWM does not suffer from phase mismatch caused by Gouy phase shift [
12]. This means that the conversion efficiency of FWM can be significantly improved with a filamentation effect. Wavelength conversion of Ti:sapphire laser output by using FWM through filament to ultraviolet [
13–
16], visible [
17], infrared [
18–
22], and terahertz (THz) [
23–
36] regions were demonstrated so far.
In particular, ultrabroadband MIR pulse generation by using FWM of the fundamental and second harmonic output of a Ti:sapphire amplifier is one of the most attractive applications of the filamentation effect. Such MIR pulses with more than one octave at full width at half maximum are very attractive to be applied for molecular spectroscopy, e.g., pump-probe spectroscopy, two-dimensional infrared spectroscopy, and chirped pulse up-conversion. It is also possible to generate MIR coherent light with self-phase modulation of one-color ultrashort pulse through filamentation in gases [
37]. However, the bandwidth is much narrower and the efficiency is much less than those achieved with the two-color input pulses. The MIR pulse generation by using FWM of two-color pulses through filamentation was firstly demonstrated in 2007 [
18], and the technique was followed and slightly modified by several groups [
19–
21,
34]. Generation of sub-single-cycle pulses in MIR region was demonstrated with this scheme [
22]. Recently, the light source has started to be used for spectroscopy [
38,
39].
In this paper, we report the detail of the performance of the MIR pulses generated by using FWM through filamentation. The fundamental (
ω1) and second harmonic (SH,
ω2) output of a 30-fs Ti:sapphire amplifier were focused into a nitrogen gas and produced phase-stable broadband MIR (
ω0) pulses through FWM processes (
ω1 +
ω1 −
ω2 →
ω0 and
ω2 −
ω1 −
ω1 →
ω0). An important difference from the previous experiment [
22] is the system for generating synchronized fundamental and SH pulses. In this experiment, so-called inline configuration was used to have the polarization and delay of the fundamental and SH pulses adjusted [
20,
30,
38,
39]. The benefit of the inline scheme is the stability of relative phase between the fundamental and SH pulses, which enables us to clarify the relative phase dependence of the generated MIR spectrum. By adjusting the phase between the two FWM processes, the bandwidth of the MIR spectrum was optimized and the pulse duration was estimated as 6.9 fs with the center wavelength of 3.3
μm. The stability of the carrier-envelope phase was significantly improved with the inline scheme.
2. Experimental Setup
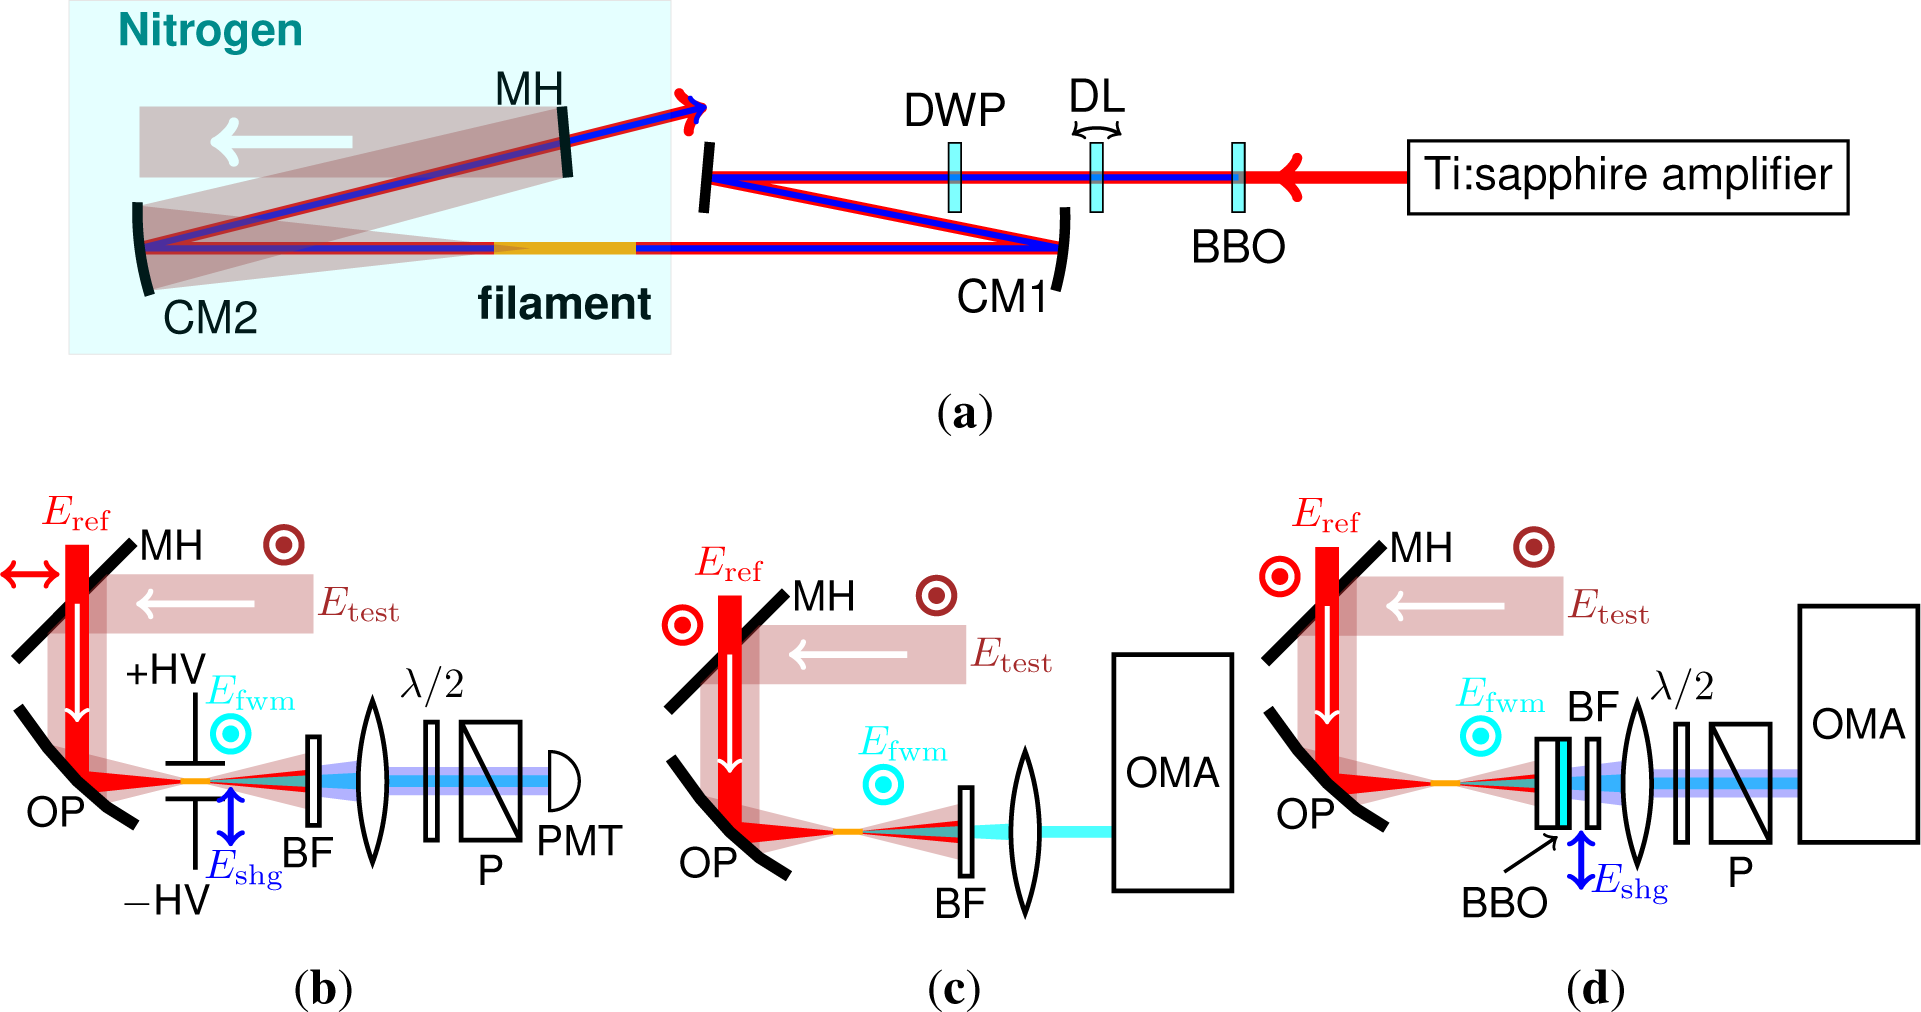
The experimental setup is shown in
Figure 1(a). The light source was based on a Ti:sapphire multi-pass amplifier system (790 nm, 30 fs, 0.85 mJ at 1 kHz, Femtopower compactPro, FEMTOLASERS) with a Dazzler (Fastlite) stretcher and a transmission grating compressor. The MIR generation scheme is basically the same as our previous experiments [
18,
22]. However, one important difference is that a delay plate and a dual wave plate were inserted in the path of the co-propagating fundamental and SH pulses, and used to adjust the delay and the polarization of the fundamental and SH pulses inline [
20,
30,
38,
39] instead of separating them at first and combining them together by using dichroic mirrors. SH (
ω2, 15
μJ) was generated by Type-I frequency doubling the collimated fundamental beam in a 0.1 mm thick BBO crystal cut at 29°. It was easy to achieve more than 10% efficiency of the SHG. However, we tilted the crystal from the optimal angle for two reasons. One is to reduce the conversion efficiency to avoid back conversion effects that distort the fundamental beam profile, and the other is to generate SH at slightly longer wavelengths, which helps to generate a broad MIR spectrum. Temporal walkoff in the doubling crystal and wave plate was compensated by a delay plate, which was a 1.7-mm-thick calcite crystal. A dual wave plate (
λ at 400 nm and
λ/2 at 800 nm) was used to adjust the relative polarizations of the fundamental and SH pulses. The beam was focused into nitrogen at around atmospheric pressure by a concave mirror (
r = −1 m), and a bright filament was generated with a length of ~3 cm around the beam focus. This filament generated an MIR pulse (
ω0) through an FWM process (
ω1 +
ω1 −
ω2 →
ω0). The energy of this MIR pulse was measured as ~0.5
μJ by using a pyroelectric detector (J-10MB-LE, Coherent). With this energy level, it is possible to apply the pulses for the nonlinear spectroscopy of condensed matter. The pulse-to-pulse intensity fluctuation was about 1.6% rms while that of the amplifier output was about 1.0% rms.
3. Spectra
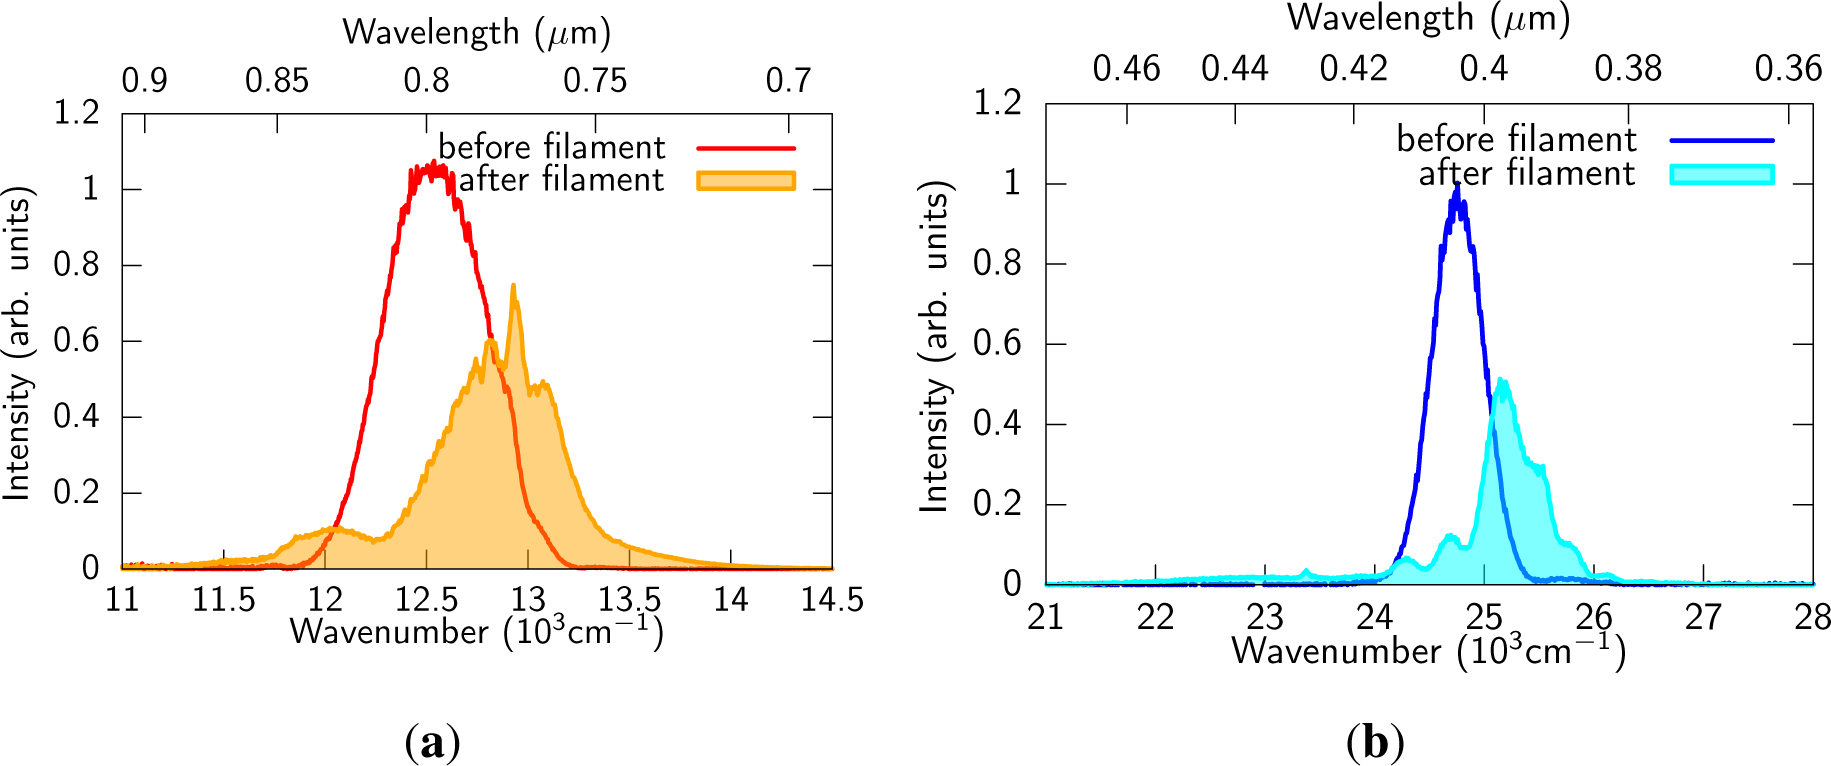
Spectra of the fundamental and SH used for MIR generation are shown in
Figure 2. The fundamental spectrum showed significant ionization-induced blue shift, whereas the SH spectrum was also blue shifted and strongly broadened to low frequency region by cross-phase modulation, which fact was also observed in previous experiments [
18,
22]. The fundamental pulse was self-compressed down to 15 fs, which was characterized with cross-correlation frequency-resolved optical gating.
The spectrum of the MIR pulse filtered through ZnSe (
t = 1 mm), Ge (
t = 0
.5 mm), and two Si (
t = 0.5 mm) plates was measured with a home-built Fourier transform spectrometer. The Michelson-type interferometer consisted of a Ge coated KBr beam splitter optimized for 3–20
μm, silver mirrors, and a feedback-loop piezo electric translation stage (PX400SG, Jena). The beam from the interferometer was focused into a TGS (triglycine sulfate) pyroelectric detector by an aluminium-coated parabolic mirror (
f = 150 mm). The measured spectrum is shown as a filled curve in
Figure 3(a). The broadband spectrum spread over the whole MIR region (400–5500 cm
−1 at tenth maximum), which was due to the weak dispersion of the medium. While straightforward convolution of the fundamental and SH spectra should yield the MIR spectrum, the experimental MIR spectrum was reproduced only with the spectra after the filament. This means that the blue shift and broadening of the input spectra in the filament are the key processes to generate wavelength shorter than THz. The slight detuning of the input SH wavelength did not significantly contribute to the shift of the generated wavelength from THz to MIR since the detuning frequency was about 7.5 THz (250 cm
−1), which is far from the MIR frequencies.
The MIR generation technique, FWM of the fundamental and SH of Ti:sapphire amplifier output, is essentially identical to those used for THz generation [
23–
36]. Here we discuss the difference between the MIR generation and the THz generation experiments. The first point is the length of the plasma. At the THz generation, typical length of the plasma is about 5 mm, which is six times shorter than our experiment. Considering the confocal parameter of THz wave, it is understandable that the longer filament does not contribute very much to increase the efficiency of the THz generation but contribute to increase the shorter wavelength components, namely MIR components here. The second point is the adjustment of the relative delay and polarization of the input pulses. At the THz generation experiments in the references [
23–
35], only the angles of the BBO crystal for the SHG can be adjusted to optimize the efficiency of the wavelength conversion. In this case, the freedom to control the relative delay and polarizations of the fundamental and SH pulses is seriously limited. In contrast, by using the inline scheme with a delay plate and a dual wave plate, it is possible to perfectly adjust the relative delay and polarizations of the fundamental and SH pulses. The adjustment of the two input pulses affect not only the efficiency of the wavelength conversion but also that of the cross-phase modulation among the multi-color waves. As is discussed in the previous paragraphs, the cross-phase modulation is a key process to generate short wavelengths. The third point is the detection scheme for the generated pulses. In the above mentioned references, only electro-optic sampling was used to detect the generated pulses. However, the frequency detectable with electro-optic sampling is limited by the duration of the reference pulse [
40]. For example, reference pulses as short as 5 fs are necessary to detect an MIR wave at 3
μm in reasonable accuracy. Such short pulses were never used in the above mentioned references. In such situation, even they generated MIR components, it is not possible to detect them. We also performed electro-optic sampling to detect our infrared pulses. The experimental results and the discussion about the detection range is shown in the next section.
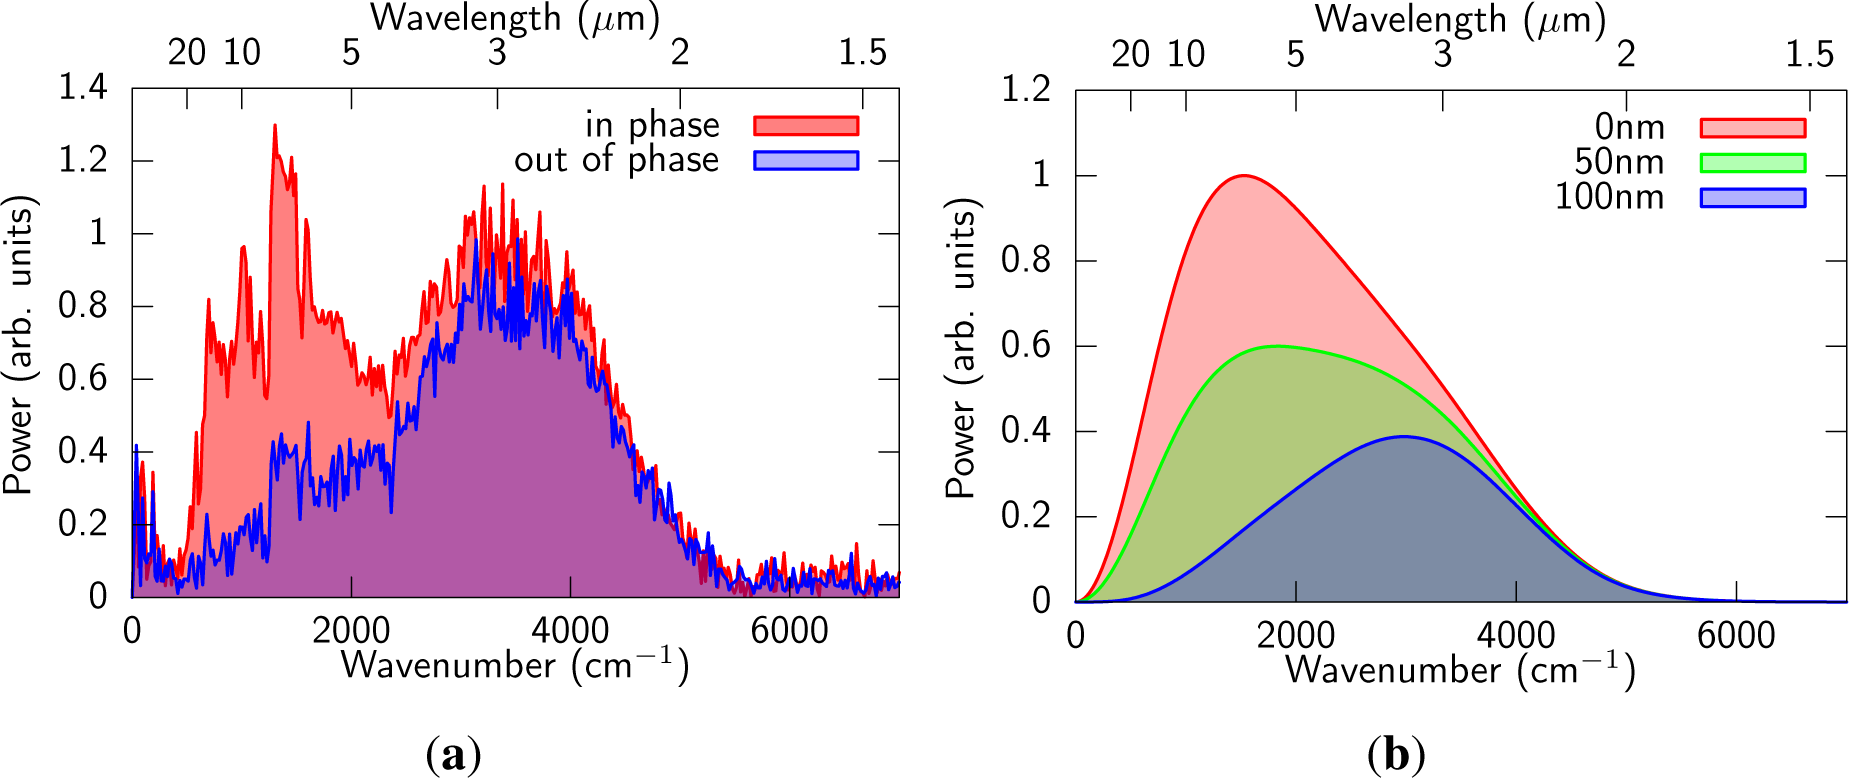
The intensity of the MIR pulse was very sensitive to the distance between the fundamental and SH pulses. The intensity changed with the period of ~200 nm of the distance. This phenomenon was also observed at THz generation with gas plasma [
30,
41]. At the THz generation, the depth of the modulation was almost 100%. However, this was not the case in our experiment. The comparison of the spectra of the in-phase and out of phase cases is shown in
Figure 3(a). It is obvious that the phase dependence was stronger for low frequency components (<2500 cm
−1) whereas the high frequency components (>2500 cm
−1) were much less sensitive to the phase.
We performed a simple simulation of the MIR pulse generation to explain this phenomenon. The MIR electric field,
Ẽ0(
ω), was calculated with a convolution of the fundamental and SH spectra (
Ẽ1(
ω) and
Ẽ2(
ω), respectively) after the filament (shown in
Figure 2),
where
τ is a relative delay between the fundamental and SH. We assumed no chirp for the both pulses in the simulation. An important point is that two different conversion processes should be considered, in other words,
ω2 −
ω1 −
ω1 →
ω0 components should be added to
ω1 +
ω1 −
ω2 →
ω0 components with certain phase relation. The result is shown in
Figure 3(b). By changing the relative distance between the two input pulses, the low frequency components of the MIR pulse changes very much whereas the high frequency components does not change. The period of the change was 200 nm, which was the same as the experimental result. Physical meaning of the modulation of the spectrum can be explained as interference between the two opposite parametric processes,
ω1 +
ω1 −
ω2 →
ω0 and
ω2 −
ω1 −
ω1 →
ω0. The phase of each component changes with the period of 400 nm, but to opposite direction. Therefore, the period of the interference is 200 nm, which is half of 400 nm.
The delay dependence of the MIR spectrum was also observed in our previous experiment [
22] but not so pronounced as the current experiment. The reason is that the spatial mode matching is much better in the current experiment. In the previous experiment the fundamental and SH pulses were separated once and the the polarization of one beam was rotated by 90° by using a periscope to match that of the other beam. In this case, the spatial mode matching is not as good as the current experiment. As a result, the interference effect becomes much smaller.
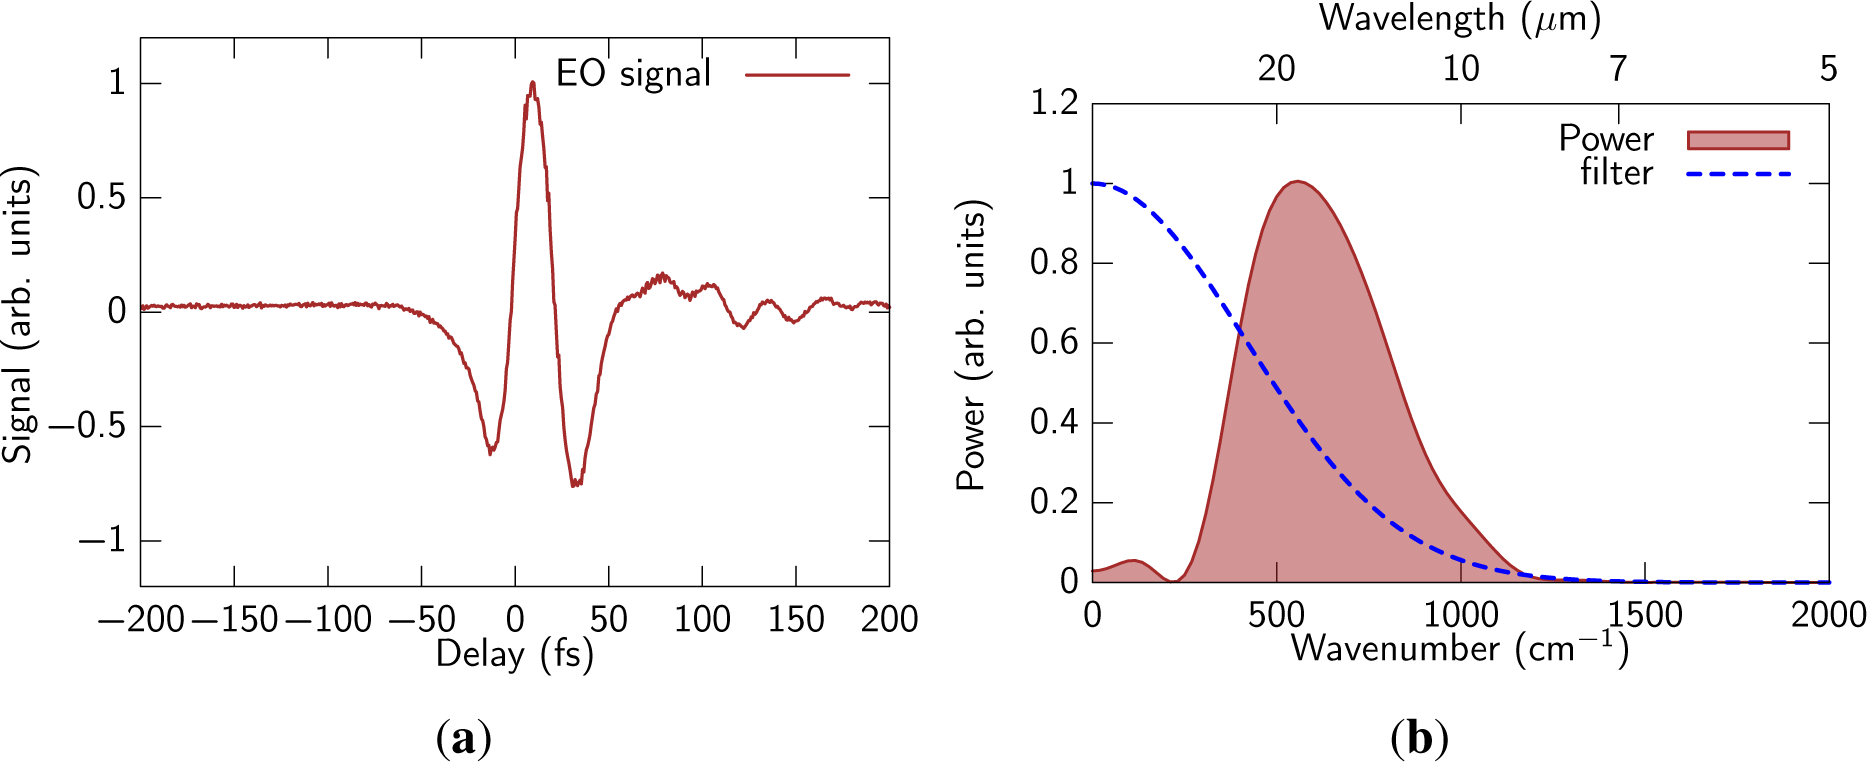
4. Electro-Optic Sampling
Although the power measured with our Fourier-transform spectrometer in the frequency region lower than 500 cm−1 is not so reliable since the beam splitter in the Michelson-type interferometer was designed for >500 cm−1, it is very likely that the generated spectrum has significant intensity in the low frequency region.
Electro-optic sampling [
42] is effective to detect low frequency components (<1000 cm
−1). We performed an air-biased coherent detection scheme [
43] for the electro-optic sampling. The schematic of the system is shown in
Figure 1(b). A small portion (~15
μJ) of the fundamental 30-fs pulse was used as a reference pulse. The reference pulse and the MIR pulse (test pulse) were combined through a mirror with a hole and focused into nitrogen with an aluminum-coated parabolic mirror (
f = 150 mm). The polarizations of the reference pulse and the MIR pulse were perpendicular to each other, and the polarization of the generated FWM signal was parallel to the MIR pulse and perpendicular to the reference pulse. To produce SH of the reference pulse, a bias field was applied to Rogowski-type electrodes with a distance of 3 mm [
44] by two high voltage amplifiers (HEOPS-5B6, Matsusada) with an amplitude of ±4 kV and a frequency of 500 Hz, which is synchronized with the 1 kHz repetition rate of the laser pulse train. The direction of the electric field was parallel to the reference pulse, and the FWM signal and the bias induced SH have polarizations perpendicular to each other. Polarization of the generated blue beam was controlled with a half-wave plate. The beam subsequently passed through a polarizer and a bandpass filter centered at 400 nm (10 nm FWHM). The beam was detected with a photomultiplier tube (H10721-210, Hamamatsu) by scanning the delay time between the reference pulse and the MIR test pulse. Interference between the SH and FWM signals was detected through a lock-in amplifier (SR830, Stanford Research).
The experimental results are shown in
Figure 4. We obviously observe components down to 250 cm
−1, which corresponds to the wavelength of 40
μm. On the other hand, high frequency components were filtered out due to rather long reference pulse duration. A small oscillating tail was observed due to absorption of residual water vapor.
The filtering effect can be quantitatively evaluated by describing the electro-optic sampling signal with formulas. The bias induced SH (
Eshg) and the FWM (
Efwm) signals are given as follows,
where
τ is the delay between the reference pulse and the test pulse.
Ebias is a bias field.
and
are the third-order tensors [
45] with the four subscripts corresponding to polarizations of the FWM (or SH), MIR (or bias field), fundamental, and fundamental beams, respectively. These signals were mixed with a half wave plate and one polarization component was selected with a polarizer. The intensities of the selected component (horizontal polarization in this experiment),
I(
τ), is given as follows[
46]:
Since the intensity of the SH signal is much weaker than that of the FWM signal, we only detect the heterodyne signal (the third term in
Equation (5)) with the lock-in amplifier. The detected signal becomes as follows by substituting
Equations (2) and
(3),
which is the full information of the test pulse field (ℜ{
Etest(
t)}) convoluted with
. The Fourier-transform of the signal is written as
Ẽtest(
ω)
Ĩshg(
ω), where
Ẽtest(
ω) and
Ĩshg(
ω) are the Fourier-transform of
Etest(
t) and
, respectively. The obtained power spectrum is written as |
Ẽtest(
ω)|
2|
Ĩshg(
ω)|
2, which is the spectrum filtered with the function of |
Ĩshg(
ω)|
2. The filtering function is also shown as a dashed curve in the
Figure 4(b). It is clear that the high frequency cut off of the spectrum at around 1300 cm
−1 is due to the filtering effect.
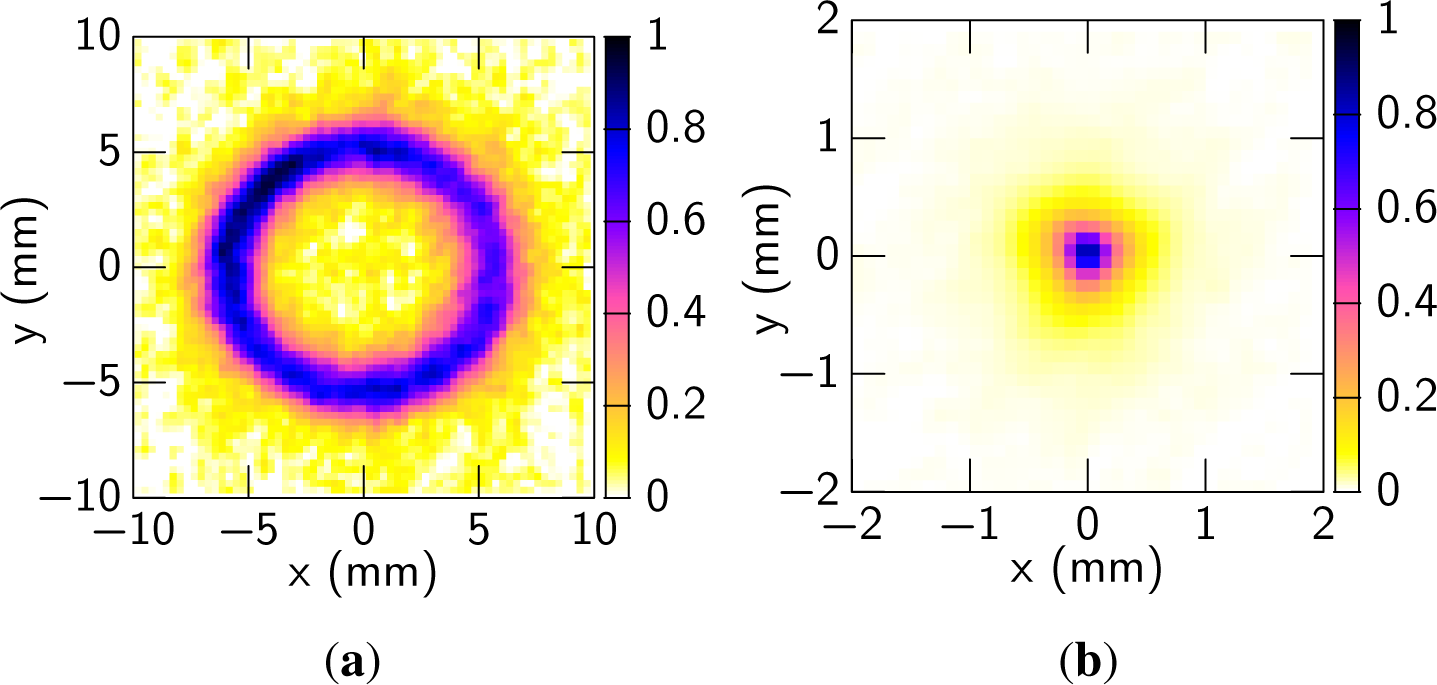
5. Beam Profile
The beam profile of the MIR beam after a Ge (
t = 0.5 mm) filter measured with a pyroelectric camera (Pyrocam III, Spiricon) is shown in
Figure 5(a). The shape of the beam was a ring and the angle of the cone was estimated to be about 3°. The cone angle of the MIR beam can be explained by phase matching condition based on a straightforward integration of the FWM response over the beam overlap region [
12]. The angle is similar to that of the previous experiment with argon [
22] since the dispersions of argon and nitrogen are almost the same and the differences in the phase matching conditions between the two cases is negligible. Symmetry of the ring pattern becomes much better than the previous experiment [
22]. In the previous experiment, a periscope was used to align the polarizations of the input pulses. In contrast, a dual wave plate was used in the current experiment. As a result, the mode matching between the two input pulses has improved and the symmetry of the beam became much better.
As is the previous experiment [
22], the generated MIR pulse has basically pure one-direction linear polarization (>40:1) in the entire cross-section of the beam as the input pulses, which was confirmed with a wire grid polarizer (NT62-774, Edmund Optics). This suggests that the generation process of the MIR pulse is different from Cherenkov emission through which THz pulses were generated in [
47] with their polarization perpendicular to the emission cone surface. The ~12 mm diameter beam was focused down to 0.9 mm (at 1
/e2) with a concave mirror (
r = 2 m), indicating a reasonable focusability for a ring-shaped spatial mode. The beam profile at the focal point is shown in
Figure 5(b).
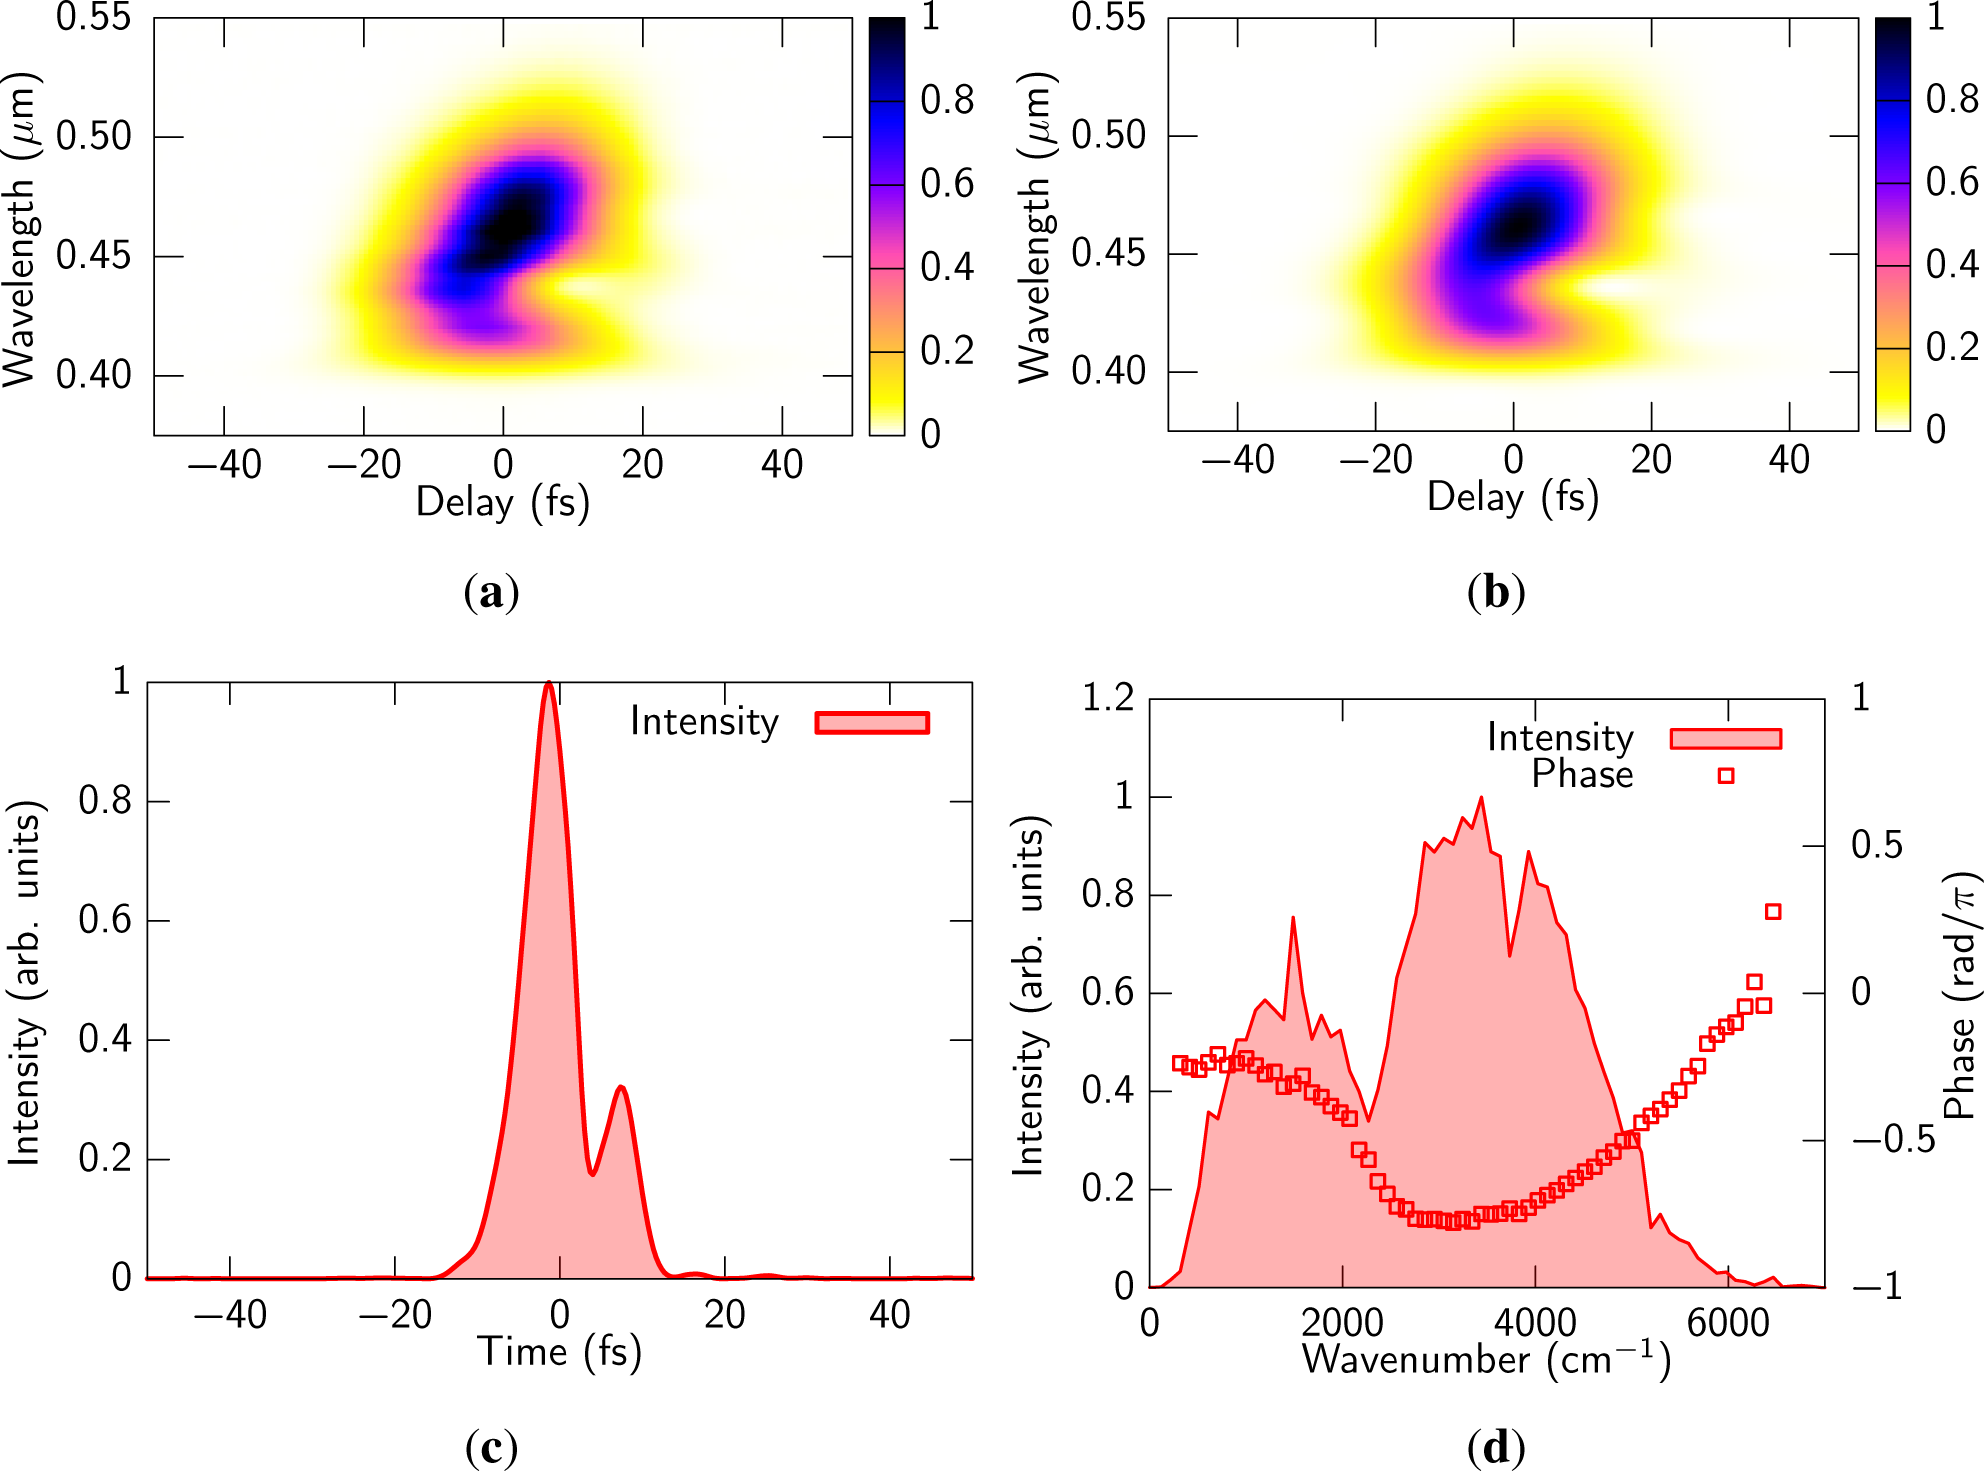
6. Cross-Correlation Frequency-Resolved Optical Gating
In order to quantitatively evaluate the temporal shape of the generated MIR pulse, we measured cross-correlation frequency resolved optical gating (XFROG) [
48]. In this experiment we used nitrogen as a nonlinear medium and used an FWM process (
ω1 +
ω1 −
ω0 →
ω2) as the nonlinear interaction between the test pulse (MIR pulse,
Etest(
t)) and the reference pulse (
Eref(
t)) in the same way as our previous experiment [
22]. The scheme is free from spectral filtering caused by phase mismatch in the nonlinear interaction. The system for the XFROG measurement is also shown in
Figure 1(c). Small portion (~15
μJ) of the fundamental 30-fs pulse was used as a reference pulse. The reference pulse and the MIR pulse (test pulse) were combined through a mirror with a hole and focused into nitrogen with an aluminum-coated parabolic mirror (
f = 50 mm). The generated blue spectra (centered around 440 nm) were measured with a spectrometer (USB2000+, OceanOptics) by scanning the delay time between the reference pulse and the MIR test pulse. The reference pulse was independently characterized with SHG-FROG, and the result was used for retrieving the MIR pulse.
The XFROG signal
IFROG(
ν, τ) is written as follows,
where
τ is a delay time between the reference pulse and the test pulse, and
Eref(
t),
Etest(
t), and
Efwm(
t, τ), are the electric fields of the reference pulse, the test pulse, and the FWM signal, respectively.
The measured and retrieved XFROG traces are shown in
Figure 6(a) and (b). We used a retrieval program by Femtosoft (FROG 3.2.4). We chose DFG (r–t) as the nonlinear interaction and used square of
Eref(
t) as the reference pulse. The FROG error was 0.0030 with 512 × 512 grid, which indicates the result is very reliable. The retrieved time and frequency domain pictures are shown in
Figure 6(c) and (d), respectively. The pulse duration was estimated to be 6.9 fs which is 0.63 cycles for 3.3
μm carrier wavelength. The retrieved spectrum was nearly identical to the spectrum measured with the Fourier-transform spectrometer, as is shown in
Figure 6(d). This indicates that the whole MIR spectral components were well focused and overlapped with the fundamental beam.
It is obvious that there is a phase shift around 2200 cm
−1. We believe that the phase shift is due to interference between two parametric processes,
ω1 +
ω1 −
ω2 →
ω0 and
ω2 −
ω1 −
ω1 →
ω0 because the phase dependence of the intensity becomes significant in the frequency region lower than 2200 cm
−1 (see
Figure 3(a)).
The phase difference could not be compensated with any delay between the fundamental and SH. The reason is that the residual chirp of the light source is significant, then the phase cannot be compensated in the whole frequency range. We can also observe the direction of the chirp is opposite in high and low frequency components, which is consistent with the fact that the two parametric processes must have the opposite chirp.
We did not observe such chirp and phase shift in our previous experiment [
22]. The important difference is that the chirp difference between fundamental and SH can be minimized with the previous scheme since the two beams were separated and the chirp of each pulse can be controlled. However, such independent control of two color pulses is not possible with the inline configuration. If one can provide some very complicated chirped mirrors that can add some chirp to the two color pulses with certain ratio, they are helpful to achieve flat phase in the whole spectral region.
7. Carrier-Envelope Phase
In theory, the carrier-envelope phase (CEP) of the generated MIR pulse is passively stabilized in the present scheme [
22,
49]. Following the expression of the CEP in frequency conversion processes described in [
49,
50], the phase of the generated MIR pulse produced through the process,
ω1+
ω1−
ω2 →
ω0, is given by
ϕ0 =
π/2 +
ϕ1 +
ϕ1 −
ϕ2, where
ϕ0,
ϕ1, and
ϕ2 are the phases of
ω0,
ω1, and
ω2 components, respectively. Since
ω2 wave was produced through SH of
ω1 wave, the phase of the
ω2 wave is given by
ϕ2 =
π/2 + 2
ϕ1. Therefore,
ϕ0 must be 0, which fact means that the CEP of the MIR pulse is automatically stabilized even without CEP stabilization of the input pulse. This feature makes the scheme highly attractive since the CEP is a very important physical property of sub-single cycle pulses. However, it is important to check the CEP stability experimentally since the fluctuation of the delay between the fundamental and SH pulses and some noise of the input pulse can affect the CEP stability [
26,
51,
52].
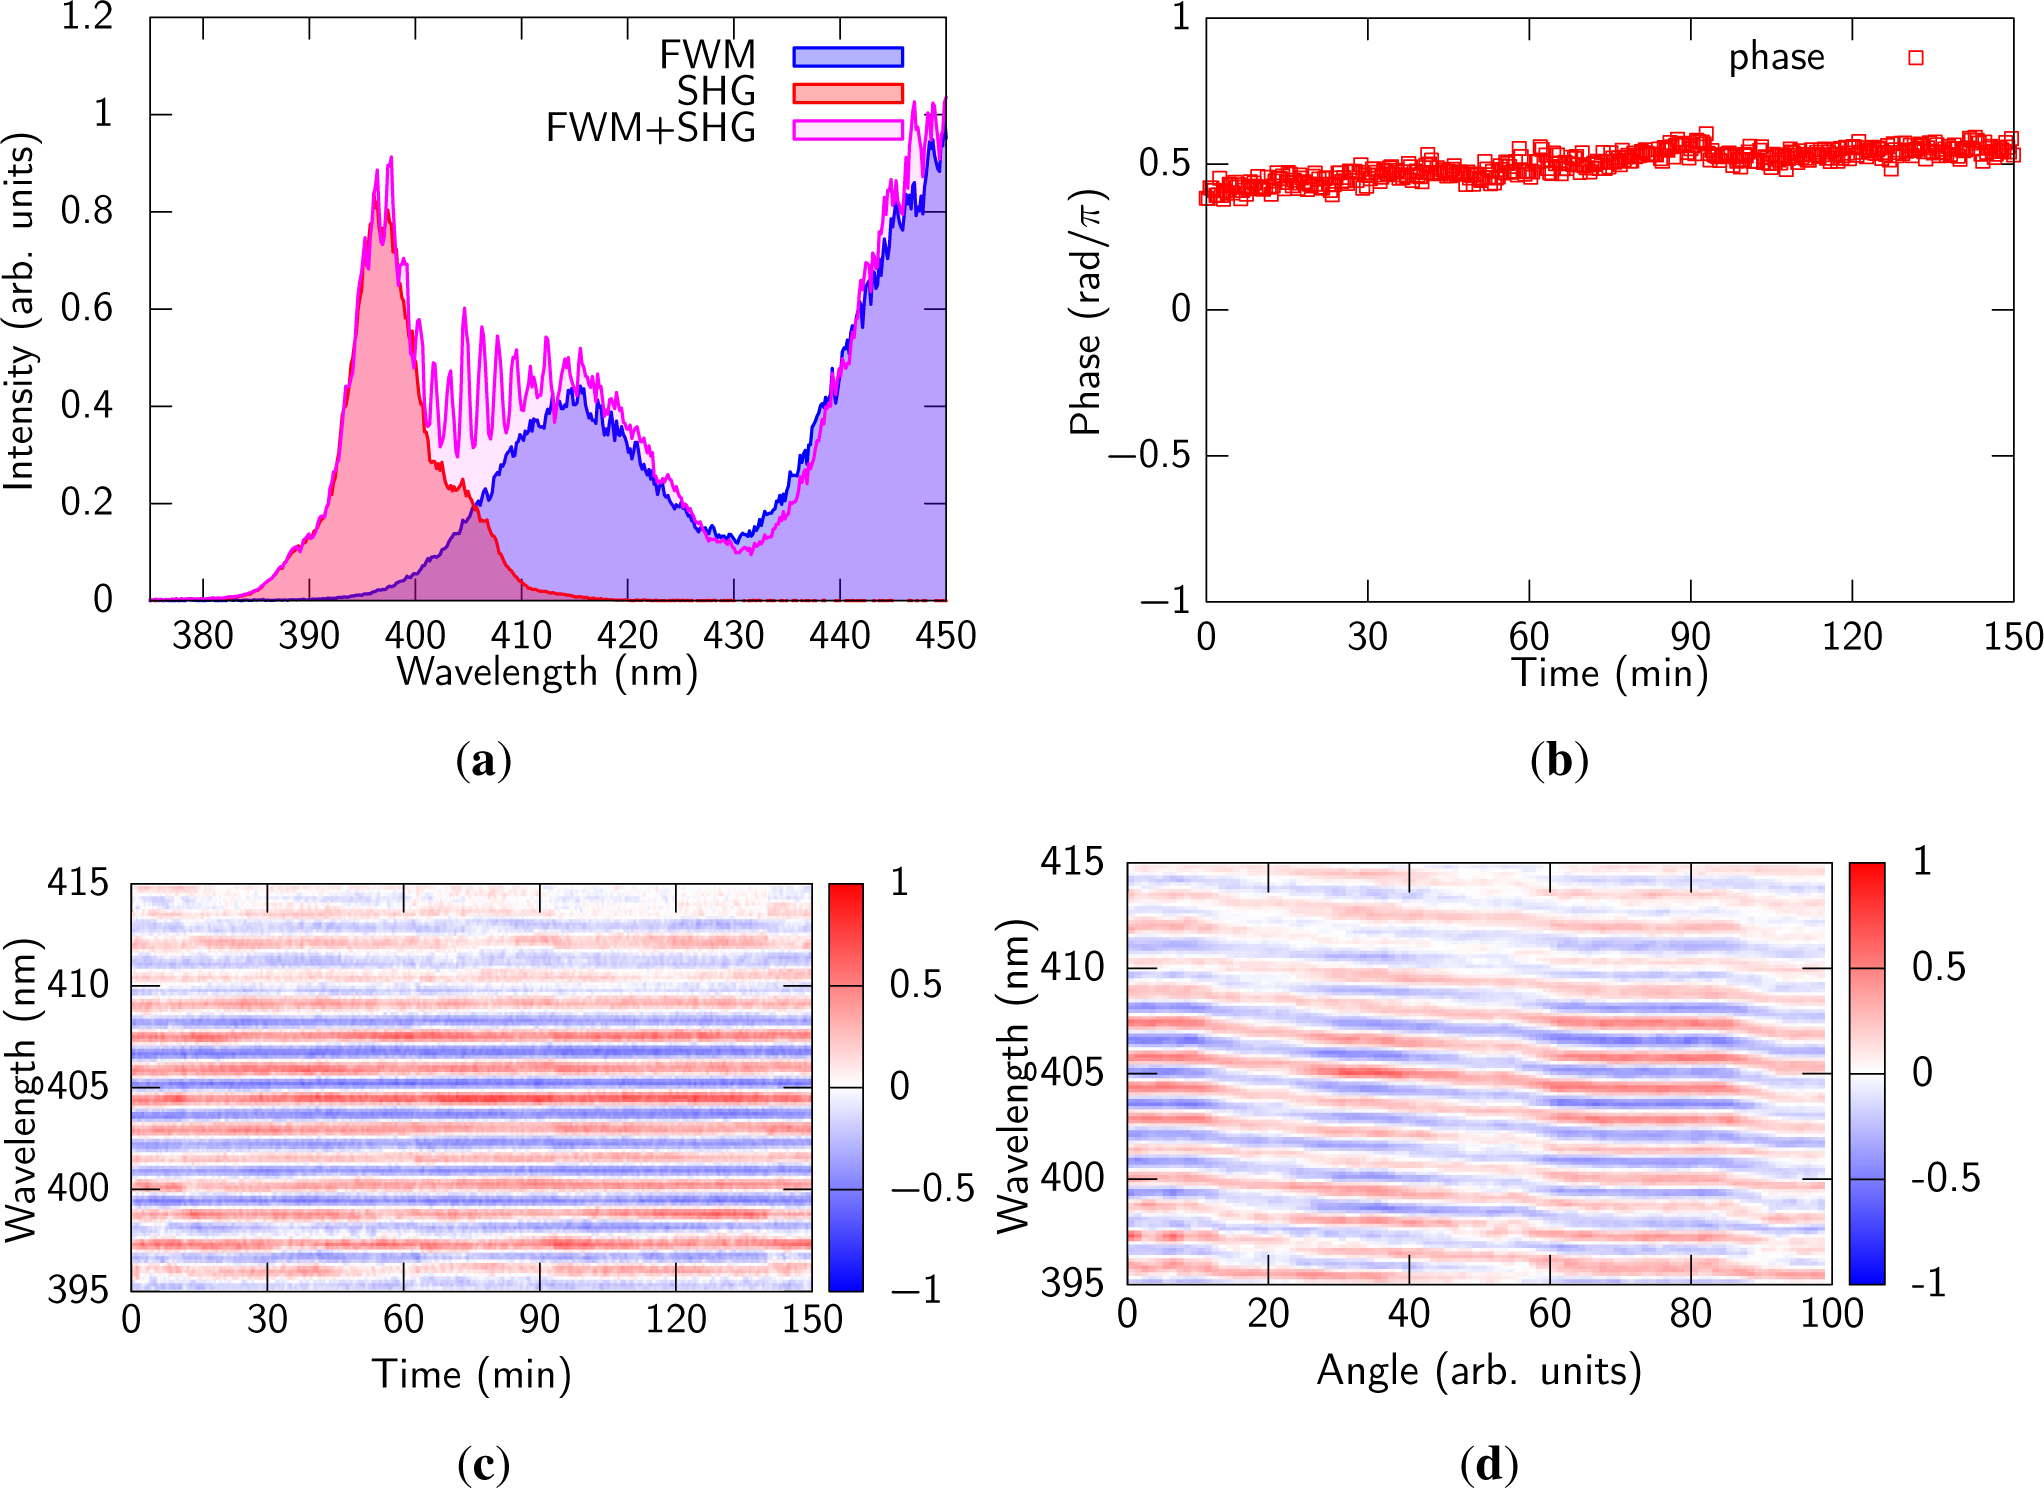
The CEP stability measurement of the MIR pulses was carried out by measuring the interference between the SH of the reference pulse
and the FWM signal
, which was used for the XFROG measurement. The interference signal is explained as a cross-term of |
Eshg(
t) +
Efwm(
t)|
2, namely,
. The phase of the interference signal is written as −
ϕshg +
ϕfwm = − (
π/2 + 2
ϕref) + (
π/2 + 2
ϕref −
ϕtest) = −
ϕtest, where
ϕx denotes the CEP of
Ex for each subscript. From the equation, it is clear that the phase drift of the interference signal reflects that of the CEP of the MIR test pulse. This scheme is essentially the same as that described in [
53].
The experimental setup is shown in
Figure 1(d). A
β-barium borate crystal (BBO,
θ = 29°,
t =50
μm) on a 2-mm thick fused silica substrate was inserted behind the focus where the FWM signal was generated as is shown in
Figure 1(d). The crystal was placed in a way that the pulses enter from the back side,
i.e., from the substrate side. This way, the FWM signal is delayed by ~300 fs relative to the reference pulse due to the group delay difference in the substrate before entering the BBO crystal. A half-wave plate and a calcite polarizer were inserted behind the crystal to optimize the intensity ratio between the SH and FWM signals. In
Figure 7(a) the observed interference fringe is shown. The fringe spacing was about 3 THz, which corresponds to the expected delay between the reference pulse and the FWM signal. The phase of the fringe was reasonably stable for hours without any feedback loop. The results of the phase measurements are shown in
Figure 7(b) and (c). The instability of the phase was estimated as 78 mrad rms with 100 shots (in 0.1 s) and 154 mrad rms for 2.5 h. Thanks to the inline configuration, the phase stability was improved by a factor of four compared to the previous experiment [
22].
Due to the long wavelength cut off of the SH spectrum, the fringes were clear up to ~415 nm, which corresponded to ~900 cm−1 of the MIR pulse. Although it is rather a tiny component of the whole spectrum, it is safe to say that the fringe corresponds to the CEP of the pulse since the spectral phase retrieved from the XFROG results were well connected in the whole spectral region.
To demonstrate control of the CEP, the delay between fundamental and SH was scanned by tilting the delay plate shown in
Figure 1(a) and the fringe was monitored (
Figure 7(d)). The period of the change of the fringe was estimated as ~400 nm, which is similar situation as [
53,
54], and same as the previous experiment [
22]. It was easy to control the CEP from 0 to 20
π by changing the delay by 13 fs.
8. Conclusions
In conclusion, ultrabroadband coherent MIR spectrum which covers the entire MIR region was generated through two-color filamentation. The spectrum spread from 400 to 5500 cm−1, which corresponds to more than 3.5 octave with full width at tenth maximum. The duration of the MIR pulses was measured as short as 6.9 fs with XFROG, which corresponds to nearly half cycles of 3.3 μm center wavelength. The generated pulse contained frequency components as low as ~250 cm−1, which was observed by using electro-optic sampling technique.
The inline configuration scheme allowed us to generate MIR pulses with higher spatial symmetry and higher stability than those from the previous scheme [
22]. The instability of the CEP was estimated as 154 mrad rms in 2.5 h.
We also found that the efficiency of the MIR pulse generation was very sensitive to the delay between the fundamental and SH pulses. It was revealed that the delay dependence of the efficiency comes from the interference between two opposite parametric processes, ω1 +ω1 −ω2 → ω0 and ω2 −ω1 − ω1 → ω0. Significant phase shift at around 2200 cm−1 could also be explained by the phase difference between the signals from the two parametric processes, where the two signals have opposite chirp with each other.
