3.1. Surface Morphology Examination
The thermal oxidation of the samples in the different oxidizing gas mixtures generated various oxide surface morphologies on the C84400 substrate. These different morphologies are as shown in
Figure 2.
Figure 2.
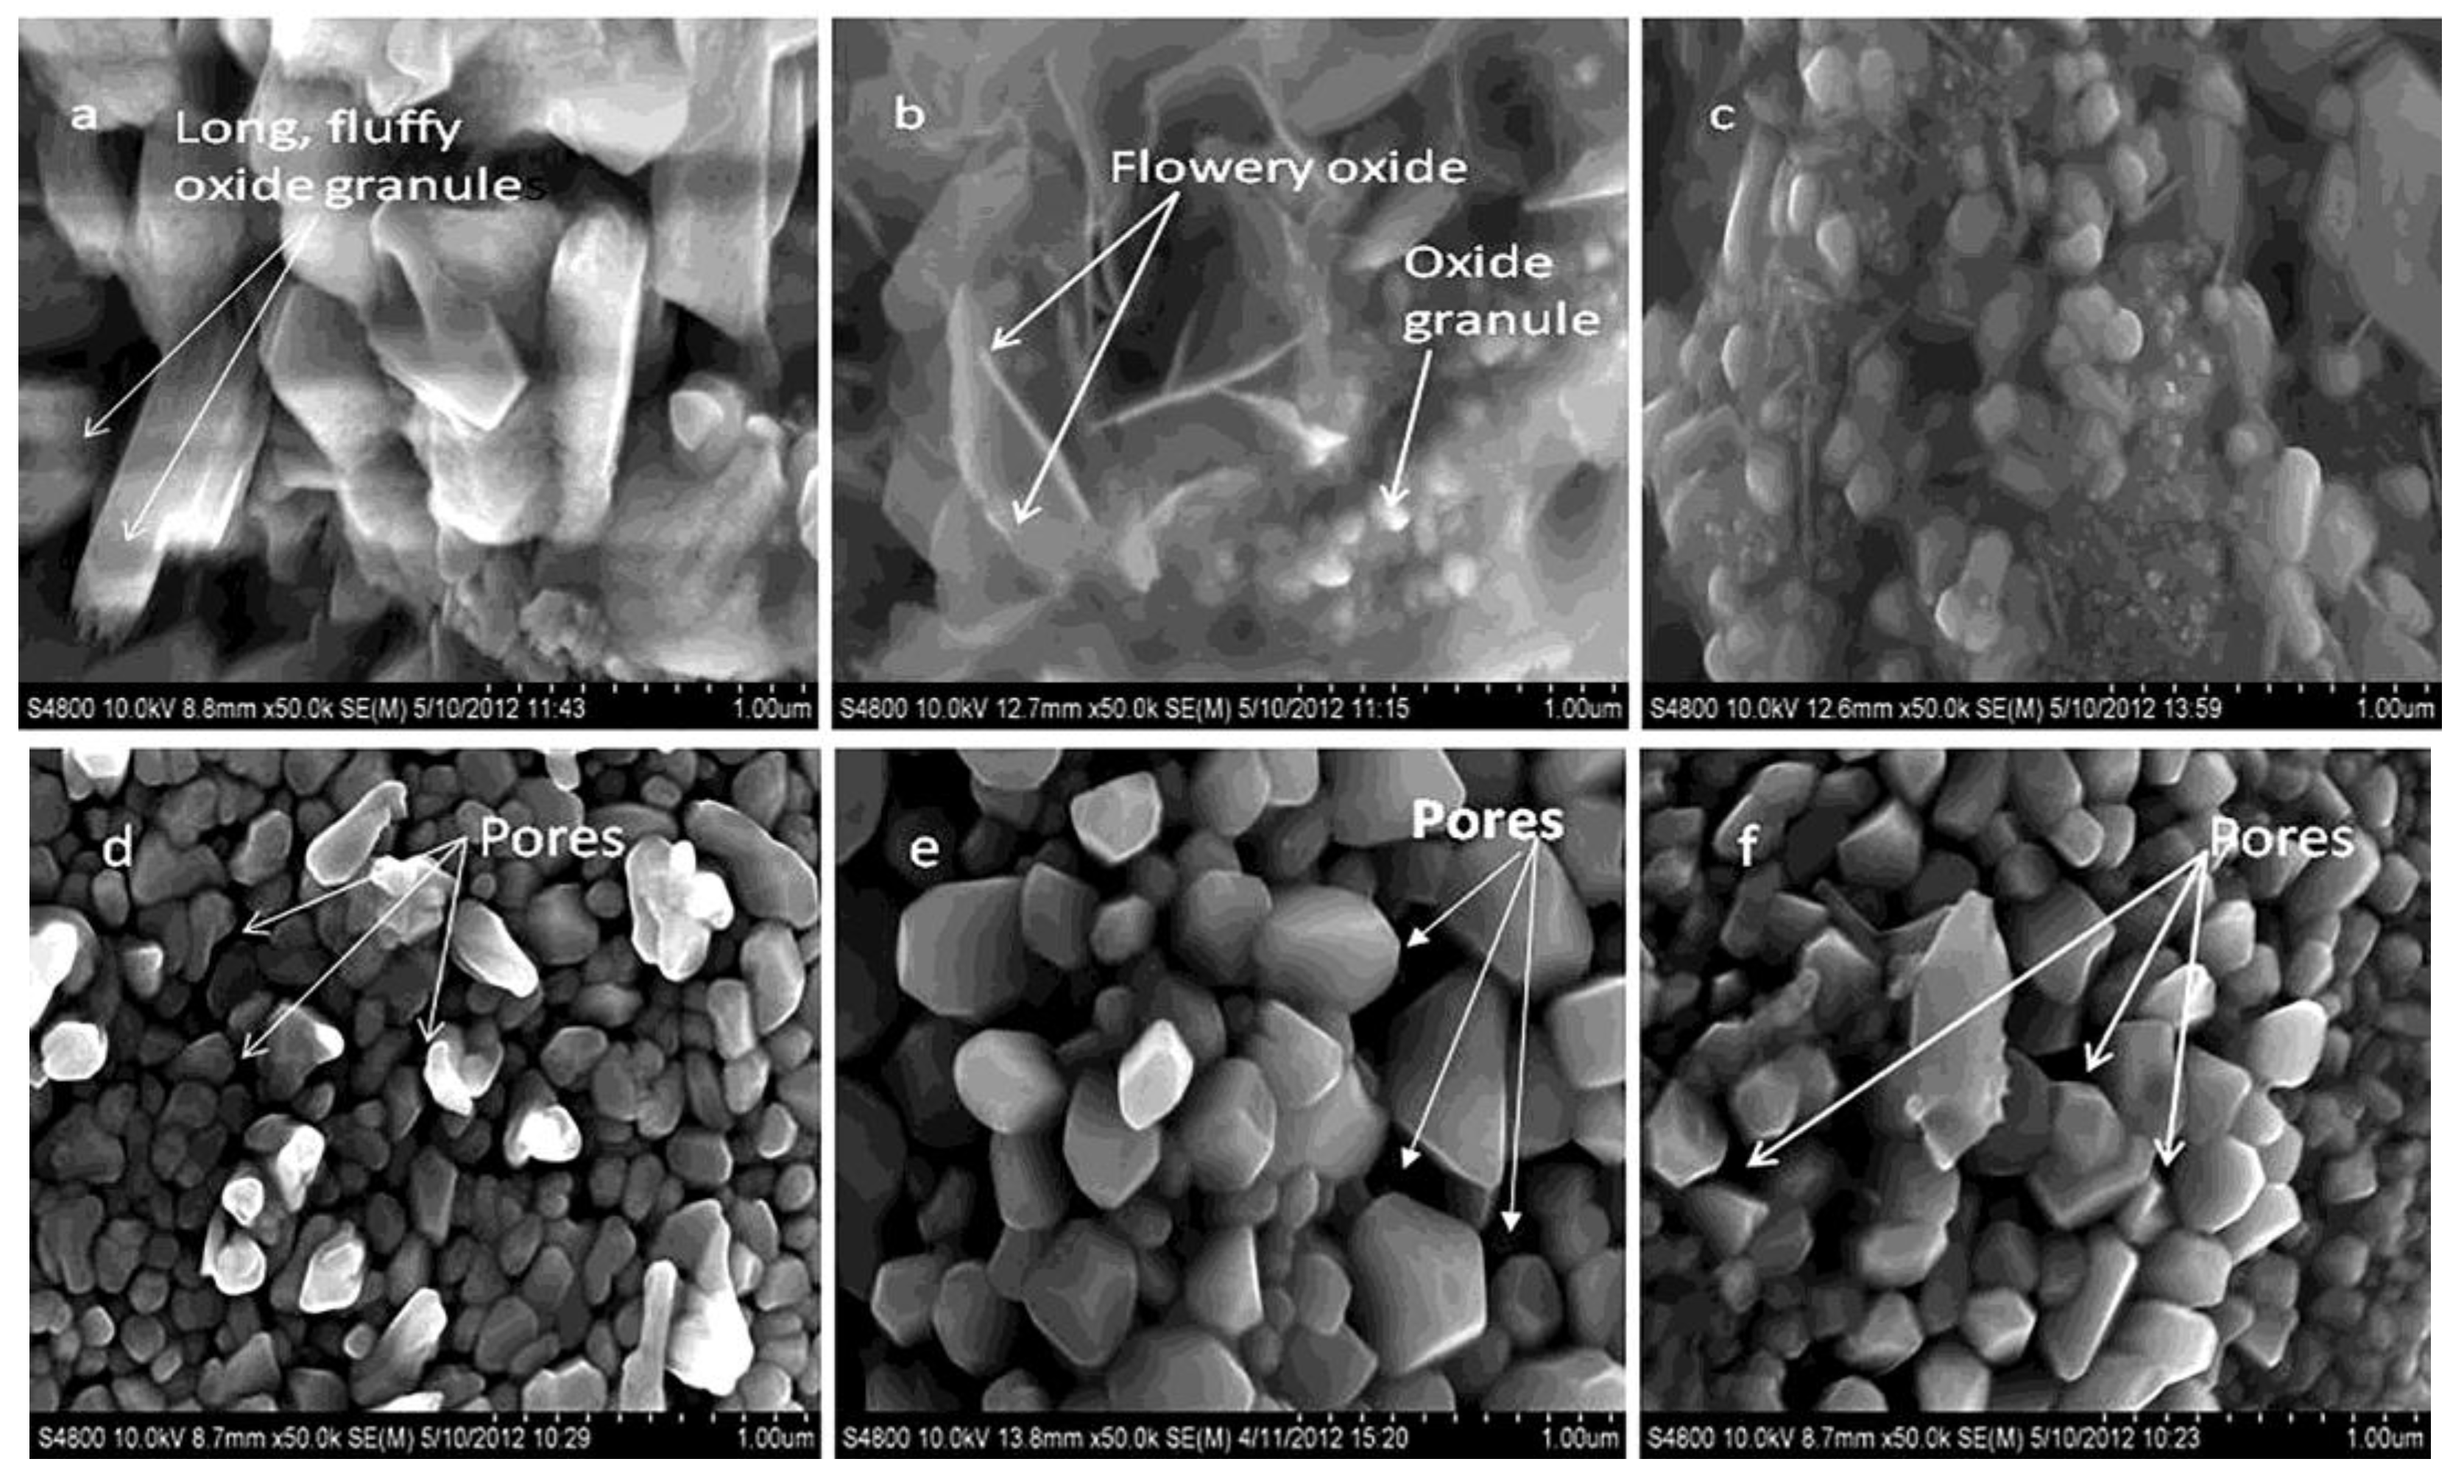
Scanning electron microscope (SEM) images of thermally oxidized C84400 in different oxidizing atmospheres: (a,b,c) 1, 2, 3 h in N2-0.75 wt.% O2; and (d,e,f ) 1, 2 and 3 h in N2-5 wt.% O2 gas mixtures, respectively, at 650 °C.
Figure 2.
Scanning electron microscope (SEM) images of thermally oxidized C84400 in different oxidizing atmospheres: (a,b,c) 1, 2, 3 h in N2-0.75 wt.% O2; and (d,e,f ) 1, 2 and 3 h in N2-5 wt.% O2 gas mixtures, respectively, at 650 °C.
From the observed morphologies, the shapes of the various oxides formed were irregular in nature, as the nucleation and growth process were affected by the thermal oxidation conditions. Long, fluffy oxide granules were formed after 1 h of thermal oxidation in the N2-0.75 wt.% O2 gas mixture. At 2 h of thermal oxidation, the morphology of the oxidized surface layer showed flowery oxide features interspersed with spherically-shaped oxide granules. This morphology can be understood, since low oxygen partial pressure to a certain range is expected to decrease the oxide nucleation rate. Under such conditions and with fewer nucleation sites, due to the low amount of oxygen, the oxides grew laterally into these flowery forms. The measured width of the flowery oxides formed was an average of 85 ± 9 nm in thickness. However, more defined oxide granules were formed after the 3 h of the thermal oxidation process, with an average oxide granule size of 110 ± 40 nm.
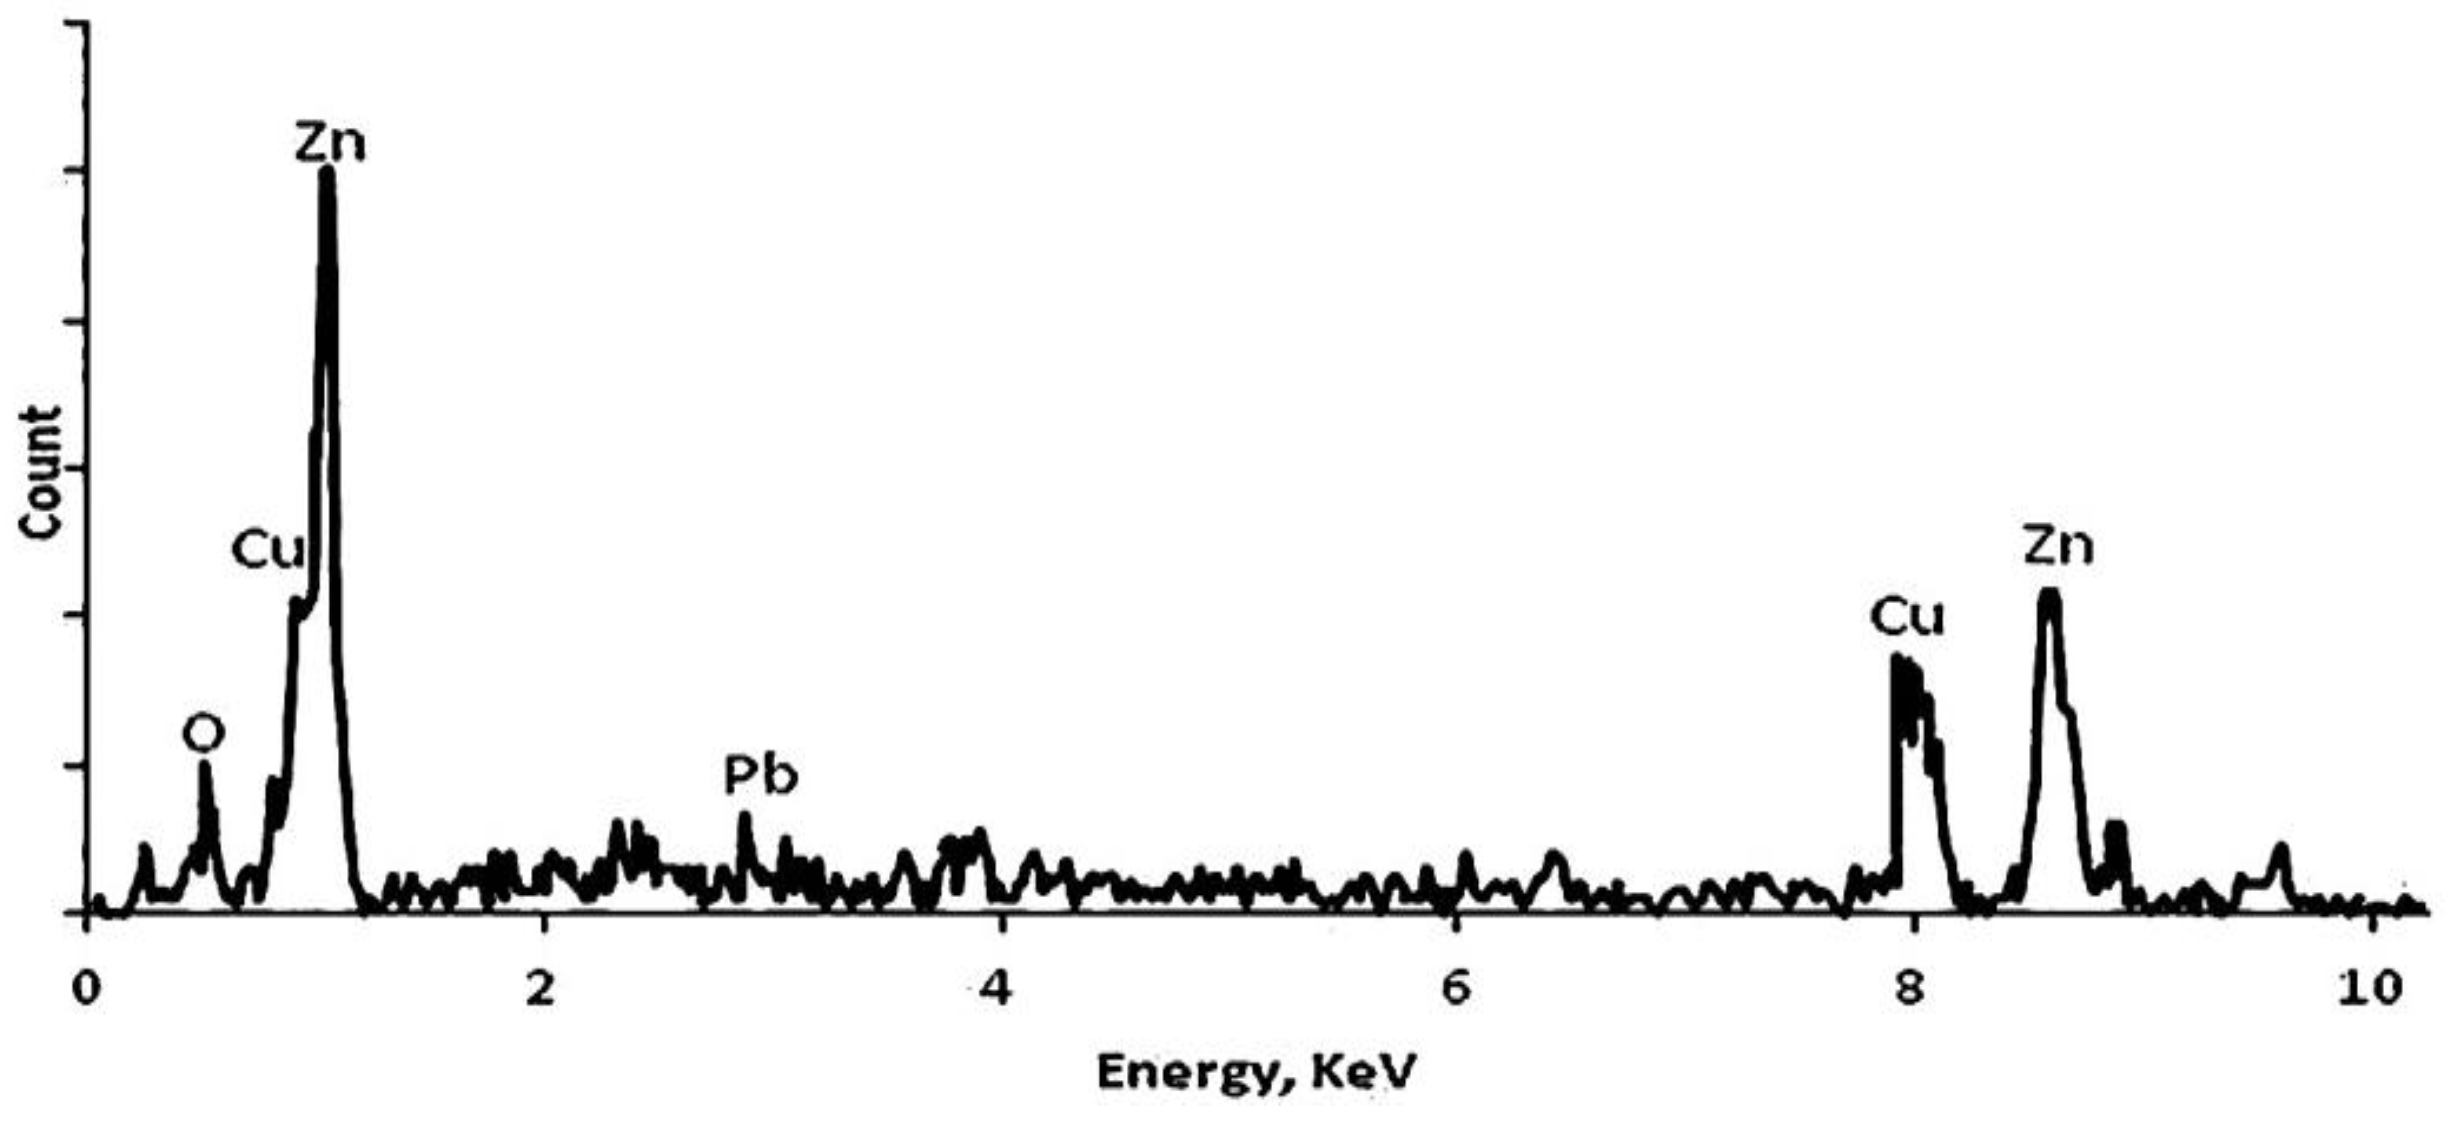
An appraisal of the chemical composition of these flowery oxides formed after 2 h of thermal oxidation in the N
2-0.75 wt.% O
2 gas mixture by energy dispersive X-ray analysis showed that they consisted of zinc, lead, copper and oxygen in the weight percentage of 34.75 wt.%, 33.38 wt.%, 6.40 wt.% and 11.78 wt.%, respectively. This chemical composition showed that these flowery oxides were essentially formed from merged thin oxide flakes of zinc, copper and lead. The EDX spot analysis is shown in
Figure 3.
Figure 3.
Energy dispersive X-ray analysis of the flowery oxides formed on the thermal oxidation of C84400 copper alloy in the N2 0.75 wt.% O2 gas mixture for 2 h.
Figure 3.
Energy dispersive X-ray analysis of the flowery oxides formed on the thermal oxidation of C84400 copper alloy in the N2 0.75 wt.% O2 gas mixture for 2 h.
In the N
2-5 wt.% O
2 gas mixture, the oxide granules on the surfaces of the samples were more consistent in form and size. The increase in the weight percentage of oxygen caused an increase in the number of nucleation sites, which resulted in a more regular and consistent morphology. No flowery oxide morphology was formed on the samples oxidized in the gas mixture with five weight percent of oxygen. The sizes of the oxide granules formed were consistent and comparable in the range of 70 ± 22 nm to 130 ± 15 nm, with the oxide granules progressively becoming smaller as the time for the thermal oxidation increased. The sizes of these oxide granules formed in the N
2-O
2 gas mixtures are stated in
Table 1.
Table 1.
The average oxide granule size, α; the fractional surface area, fso; the estimated pore size, D; and the calculated oxide layer porosity, φ.
Table 1.
The average oxide granule size, α; the fractional surface area, fso; the estimated pore size, D; and the calculated oxide layer porosity, φ.
| N2-O2 gas mixture | Time (h) | Average granule size, α (nm) | Fractional surface area of oxide, fso | Estimated pore size, D (µm) | Calculated porosity, φ |
|---|
| N2 0.75 wt.% O2 | 1 | 750 ± 50 | 0.74 | 0.19 ± 0.05 | 0.06 |
| 2 | 130 ± 15 | 0.67 | - | - |
| 3 | 110 ± 40 | 0.58 | 0.09 ± 0.03 | 0.27 |
| N2 5 wt.% O2 | 1 | 134 ± 45 | 0.61 | 0.517 ± 0.13 | 0.49 |
| 2 | 101 ± 43 | 0.32 | 0.587 ± 0.10 | 0.58 |
| 3 | 70 ± 14 | 0.11 | 0.509 ± 0.23 | 0.64 |
Further appraisal of the surfaces showed a wide distribution of pores in the oxidized surface layers. These pores were quite conspicuous on the samples surfaces that were thermally oxidized in the N
2-5 wt.% O
2 gas mixture. The sizes of the pores were measured from the scanning electron microscope and are stated in
Table 1. The distribution of the pores was quite insignificant in the samples that were oxidized in the N
2-0.75 wt.% O
2 gas mixture. The SEM images in
Figure 2 show these randomly distributed pores present on the oxide layers of the C84400 copper alloy samples after they were thermally oxidized in the in the N
2-5 wt.% O
2 gas mixture
. 3.2. X-ray Diffraction Phase Analyses
The phase analyses of the surfaces of the samples of the C84400 copper alloy, thermally oxidized in the N
2-O
2 gas mixtures at 650 °C, showed also the presence of various diffraction planes of the oxides formed, as presented in
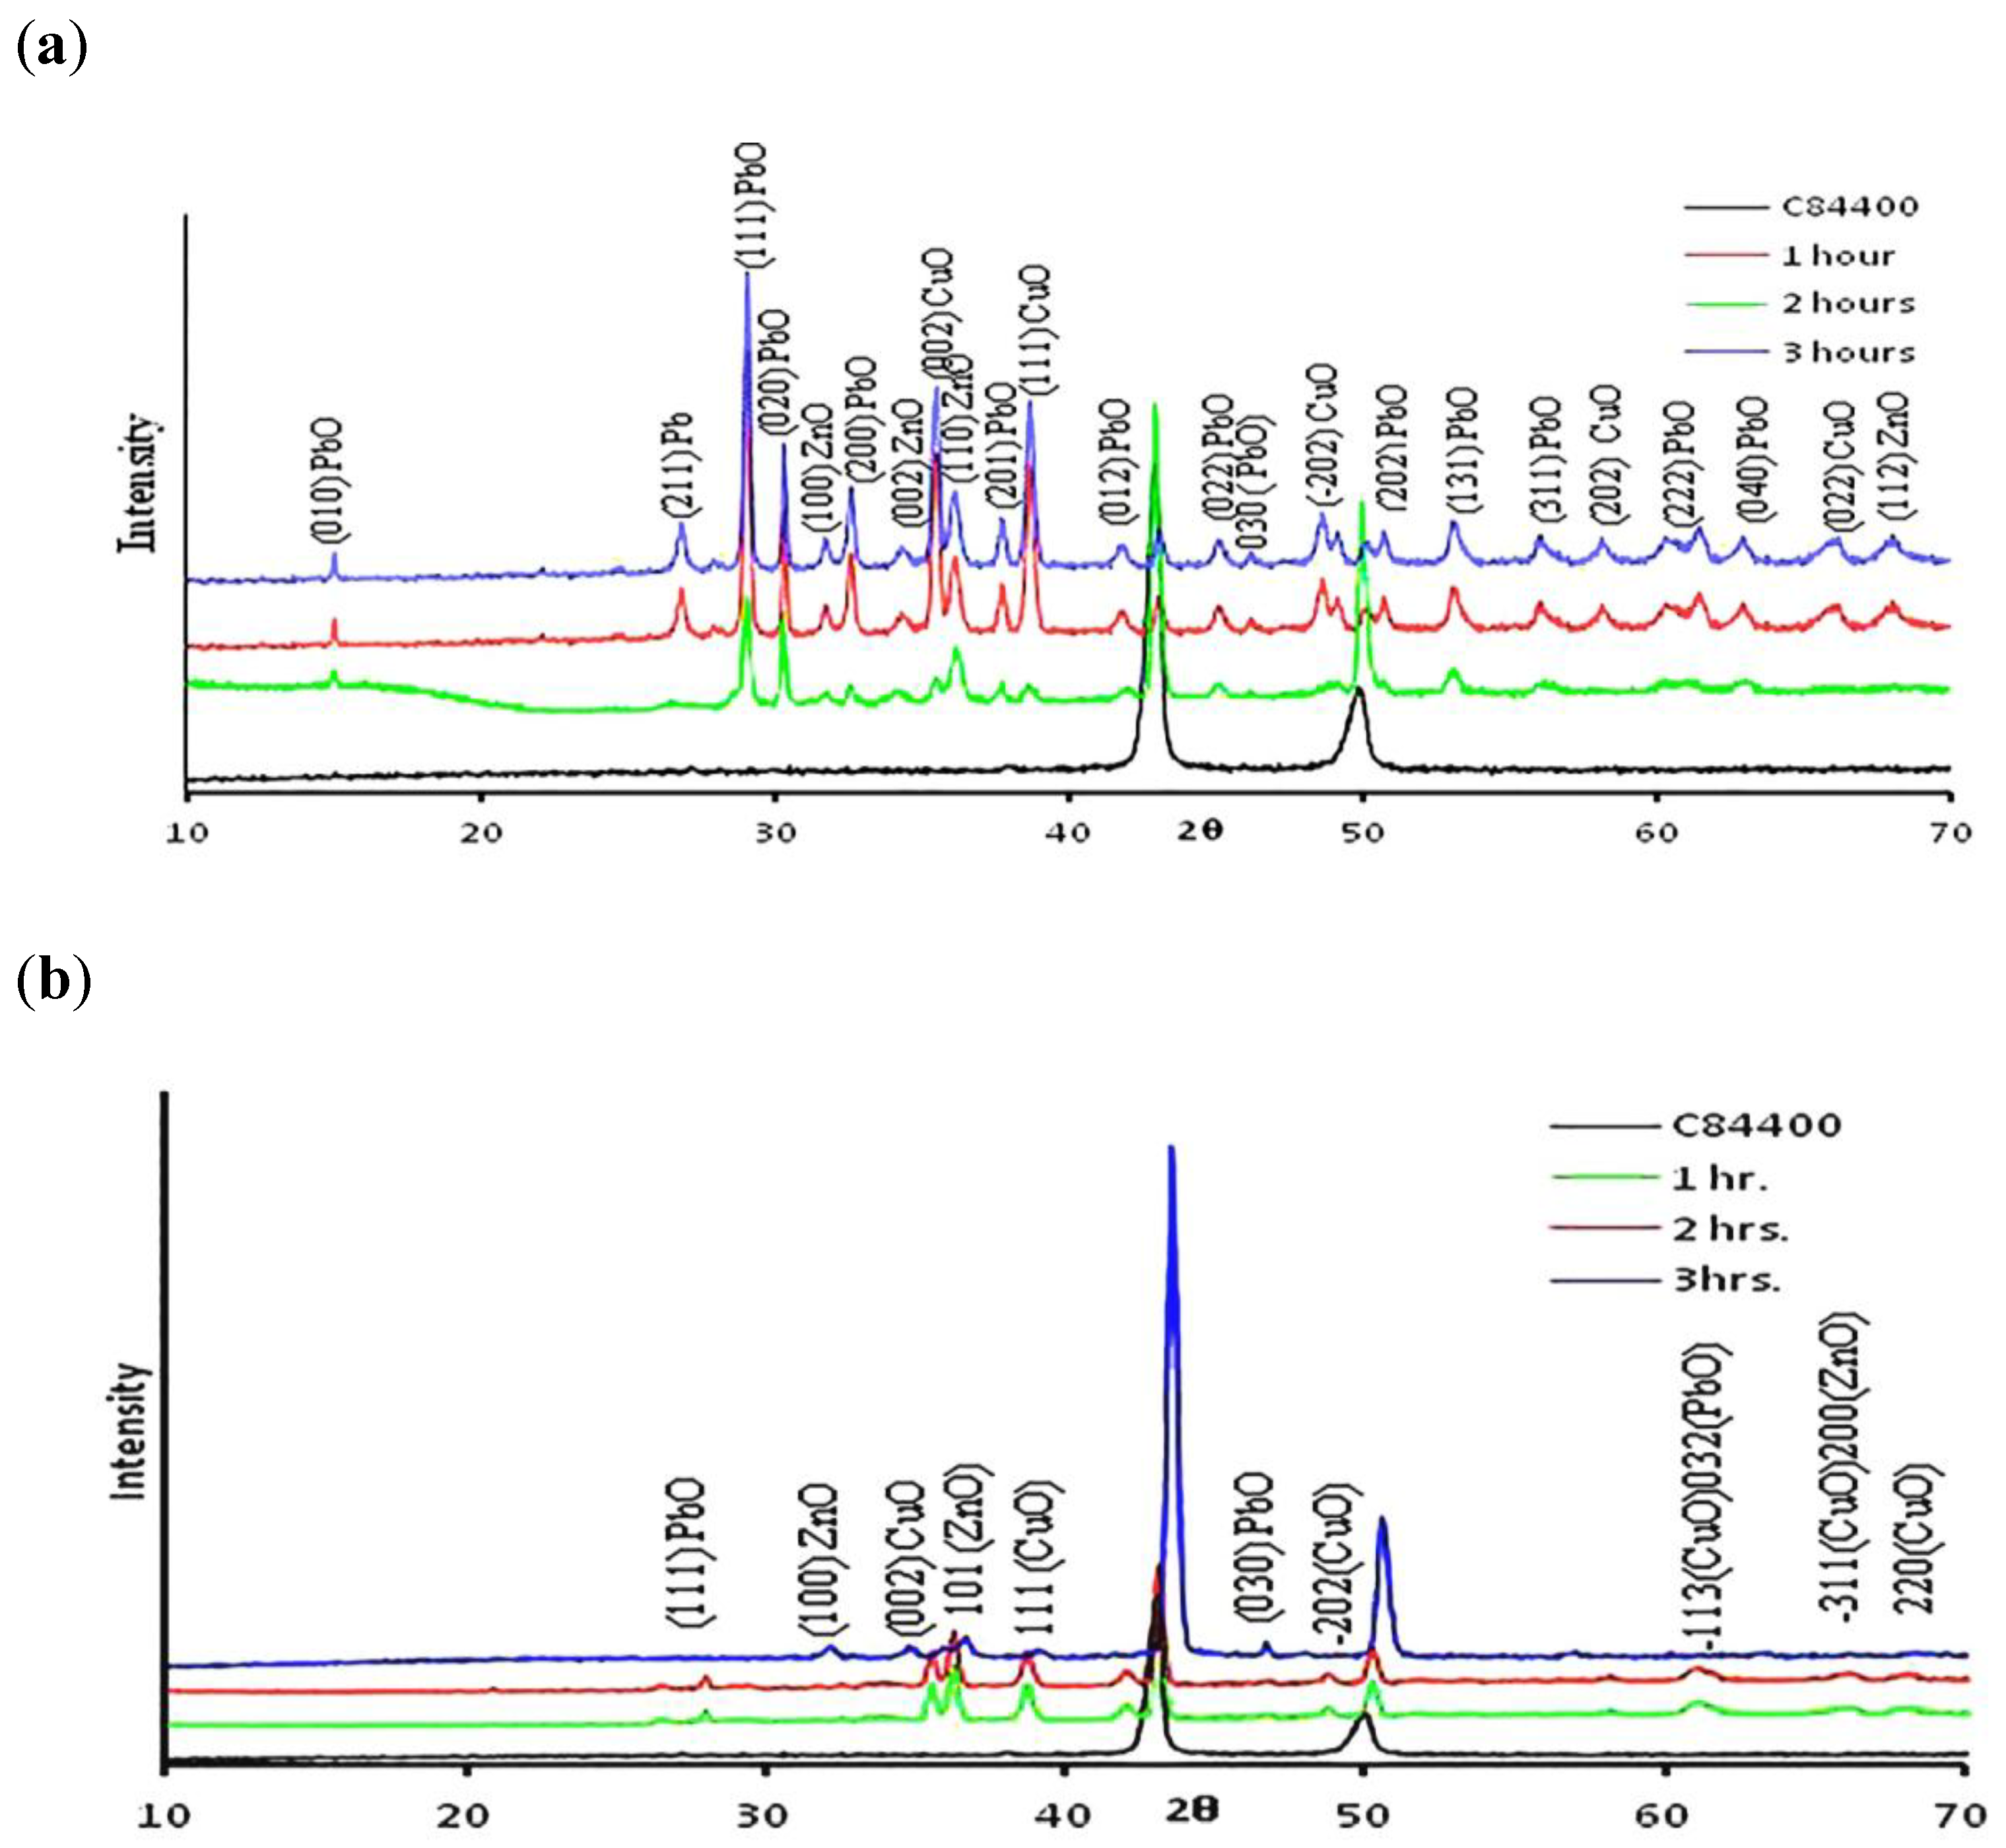
Figure 4. The diffraction peaks corresponded to the (002), (111), (022), (220), (−202), (202), (−113) and (−311) planes of CuO; the (100), (002), (110),(101), (200) and (112) planes of ZnO; and the (010), (020), (201), (012), (022), (202), (131), (111), (311), (222), (032) and (040) planes of PbO. These identified planes confirmed the presence of monoclinic CuO, hexagonal ZnO and orthorhombic PbO on the oxidized surfaces, based on Powder Diffraction File (PDF) cards numbers 80–1917, 36–1451 and 38–1477 for PbO, CuO and ZnO, respectively.
Figure 4.
(a) X-ray diffraction pattern of thermally oxidized C84400 copper alloy samples in N2-0.75 wt.% O2; (b) X-ray diffraction pattern of thermally oxidized C84400 copper alloy samples in N2-5 wt.% O2.
Figure 4.
(a) X-ray diffraction pattern of thermally oxidized C84400 copper alloy samples in N2-0.75 wt.% O2; (b) X-ray diffraction pattern of thermally oxidized C84400 copper alloy samples in N2-5 wt.% O2.
From the X-ray analyses presented in (
Figure 4a,b), it is observed that a lesser number of the oxide planes diffracted the X-rays in samples oxidized in N
2-5 wt.% O
2 compared to those oxidized in N
2-0.75 wt.% O
2 over the same time period. The X-ray diffraction peaks were broad, due to the very small sizes of the oxides formed. Based on the XRD data, no Cu
2O was formed on the oxide layers in both N
2-O
2 gas mixtures used. All the copper oxide exists in the form of CuO. The miller-indexed (002) and (111) reflections for CuO have the highest intensities, indicating that these were the preferred crystal planes of the oxides in the samples that were thermally oxidized in the N
2-0.75 wt.% O
2 gas mixture. The preferred planes for the PbO and ZnO equally formed during the thermal oxidation of the samples in N
2 0.75 wt.% O
2 gas mixture were (111) and (110) Miller-indexed reflections, respectively. In the N
2 5 wt.% O
2, the faster oxidation rate resulted in a faster nucleation and growth of the oxide layer, causing lesser oxide planes to occur.
The Gibb’s free energy of formation, Δ
G, of ZnO, CuO and PbO shows that the formation of ZnO is the most energetically favorable at the process temperature of 650°. In copper alloys, there is a critical zinc concentration above which only the oxidation of the zinc will occur. This critical concentration estimated by Wagner [
14] is 15 at.% Zn. The concentration of zinc in the C84400 copper alloy is 8.9 at.% (9 wt.%), which is lower than the critical concentration for the formation of only ZnO from the oxidation of zinc. Hence, CuO was equally oxidized from Cu
2O during the thermal oxidation. Lead has a very low melting point (327.3 °C) [
15]. To this extent, the lead particles in the alloy microstructure melted quickly in the process of thermal oxidation and segregated to the surface, where it was easily oxidized to PbO, as noted by the X-ray diffraction analysis.
3.3. Oxidation and Mechanism of Growth of the Oxide Layer
The cross-sectional thicknesses of the oxide layers grown on these substrates at 650 °C were examined with the Hitachi S-4800 scanning electron microscope, as shown in
Figure 5. The well-defined oxide layers for the samples that were oxidized in N
2 0.75 wt.% O
2 and N
2 5 wt.% O
2 showed some cracks of the layers from the substrate surface, in some cases. These cracks were found at the interfaces between the substrates and the oxide layer. At a temperature of 650 °C, the differences in the thermal expansivities between the oxides forming in the oxide layer and the C84400 copper alloy substrate induce stresses and cracks. In this instance, the coefficient of thermal expansion (CTE) of the ZnO, CuO and PbO are 4.0 × 10
−6/°C, 4.3 × 10
−6/°C and 9.4 × 10
−6/°C [
16,
17], respectively, and are quite lower than the linear expansivity of the C84400 copper alloy, which has a value of 18.8 × 10
−6/°C [
18]. The oxide layer experienced compressive stresses, as the C84400 copper alloy expanded faster at the high temperature used in the oxidation, thus causing the cracks observed. Equally, some of the observed cracks may be due to the effect of wear during the polishing of the cross-sections for SEM examination.
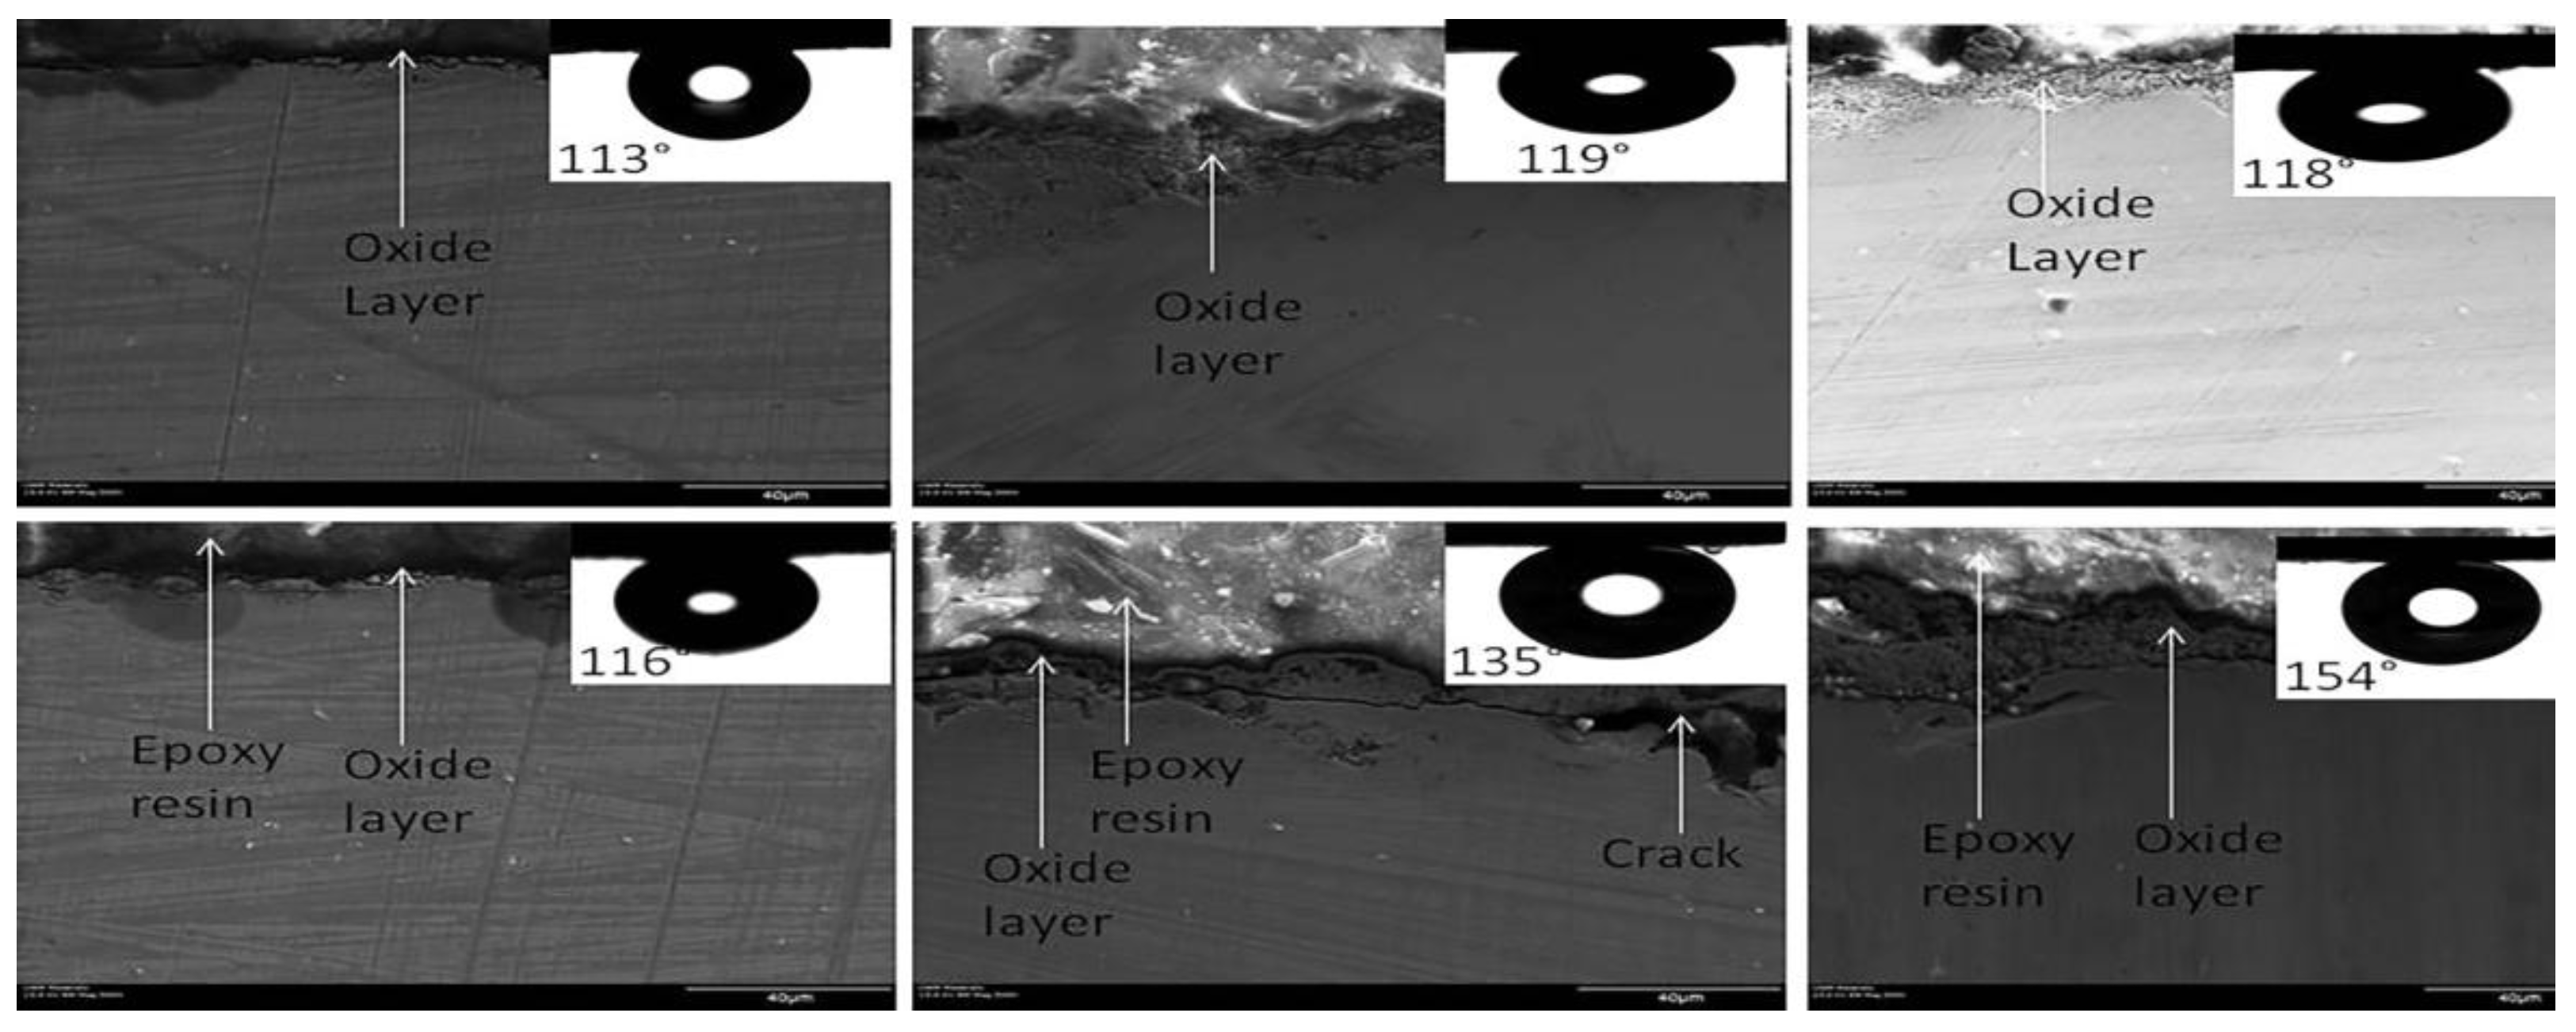
The values of the average oxide layer thickness, measured from the SEM images in
Figure 5, are stated in
Table 2. The oxidation rate at which these various oxides were formed was evaluated based on the oxide layer thickness as a function of the thermal oxidation time at 650 °C using the parabolic relation [
19] in Equation (1).
Figure 5.
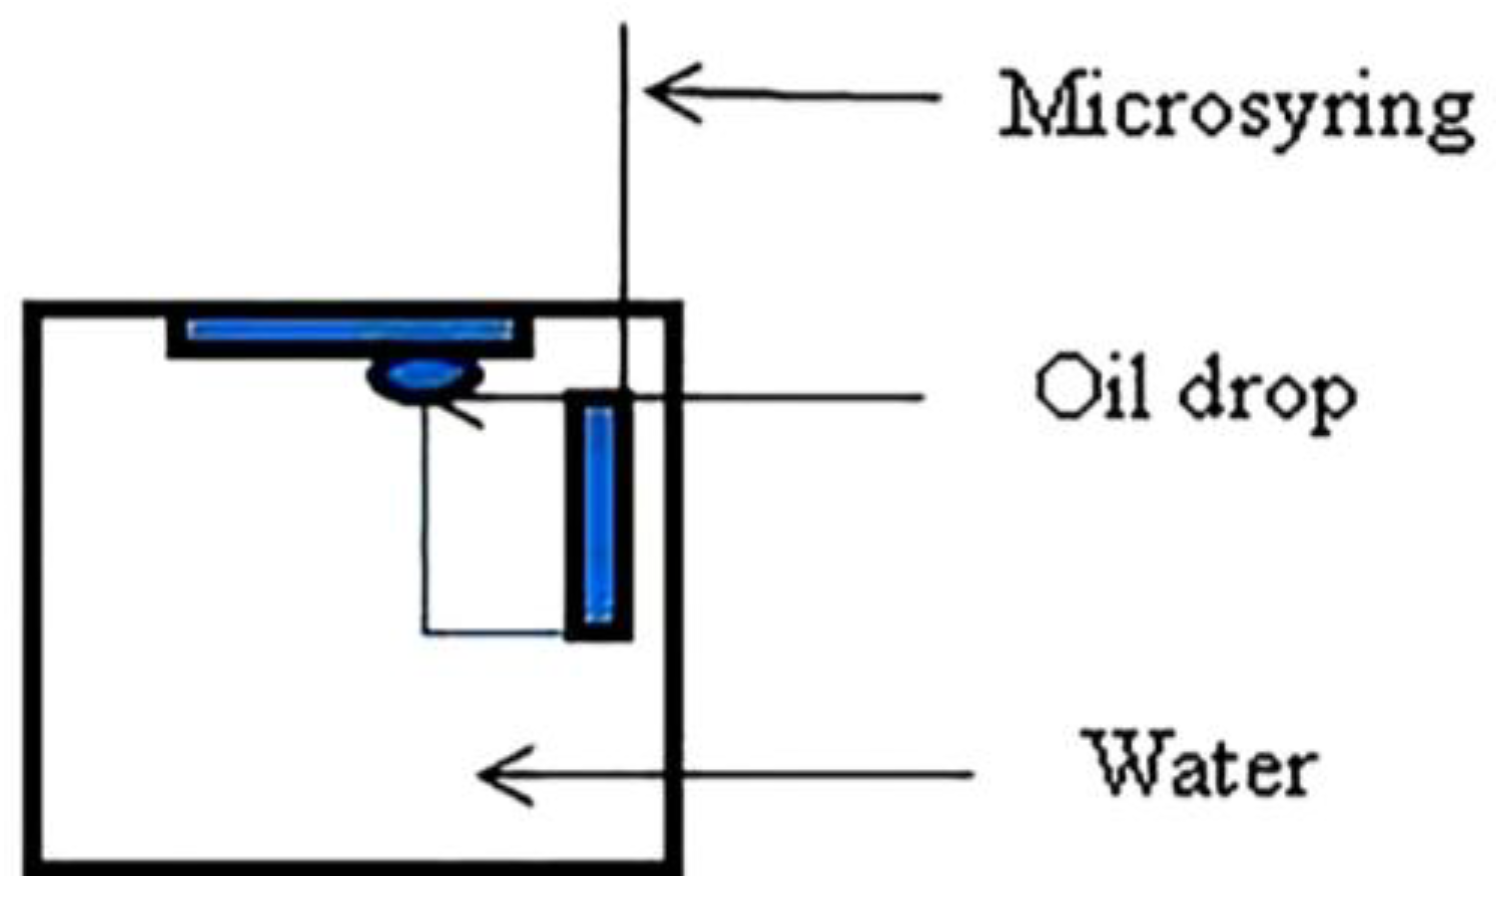
SEM images showing the oxide layer thickness and the measured oil contact angles under water. (a–c) Oxidized in the N2 0.75 wt. % O2 gas mixture; (d–f) oxidized in the N2 5 wt.% O2 gas mixture. The insert is the underwater contact angle of oil.
Figure 5.
SEM images showing the oxide layer thickness and the measured oil contact angles under water. (a–c) Oxidized in the N2 0.75 wt. % O2 gas mixture; (d–f) oxidized in the N2 5 wt.% O2 gas mixture. The insert is the underwater contact angle of oil.
Table 2.
The oxide layer thickness, average oxide granule sizes and underwater oil contact angle on C84400 copper alloy samples oxidized in different N2-O2 gas mixtures.
Table 2.
The oxide layer thickness, average oxide granule sizes and underwater oil contact angle on C84400 copper alloy samples oxidized in different N2-O2 gas mixtures.
| N2-O2 gas mixture | Oxidation time
(t in hours) | Average surface roughness (Ra in µm) | Oxide layer thickness
(λ in µm) | Underwater oil contact angle (θo) |
|---|
| Polished | 0 | 0.1 | - | 54° ± 2° |
| N2-0.75 wt.% O2 | 1 | 1.13 | 2.52 ± 0.90 | 113° ± 9° |
| 2 | 1.88 | 11.94 ± 3.23 | 119° ± 4° |
| 3 | 2.15 | 14.37 ± 2.07 | 118° ± 3° |
| N2-5 wt.% O2 | 1 | 0.96 | 4.38 ± 1.63 | 116° ± 4° |
| 2 | 1.11 | 10.72 ± 5.03 | 135° ± 3° |
| 3 | 2.08 | 25.69 ± 9.14 | 154° ± 1° |
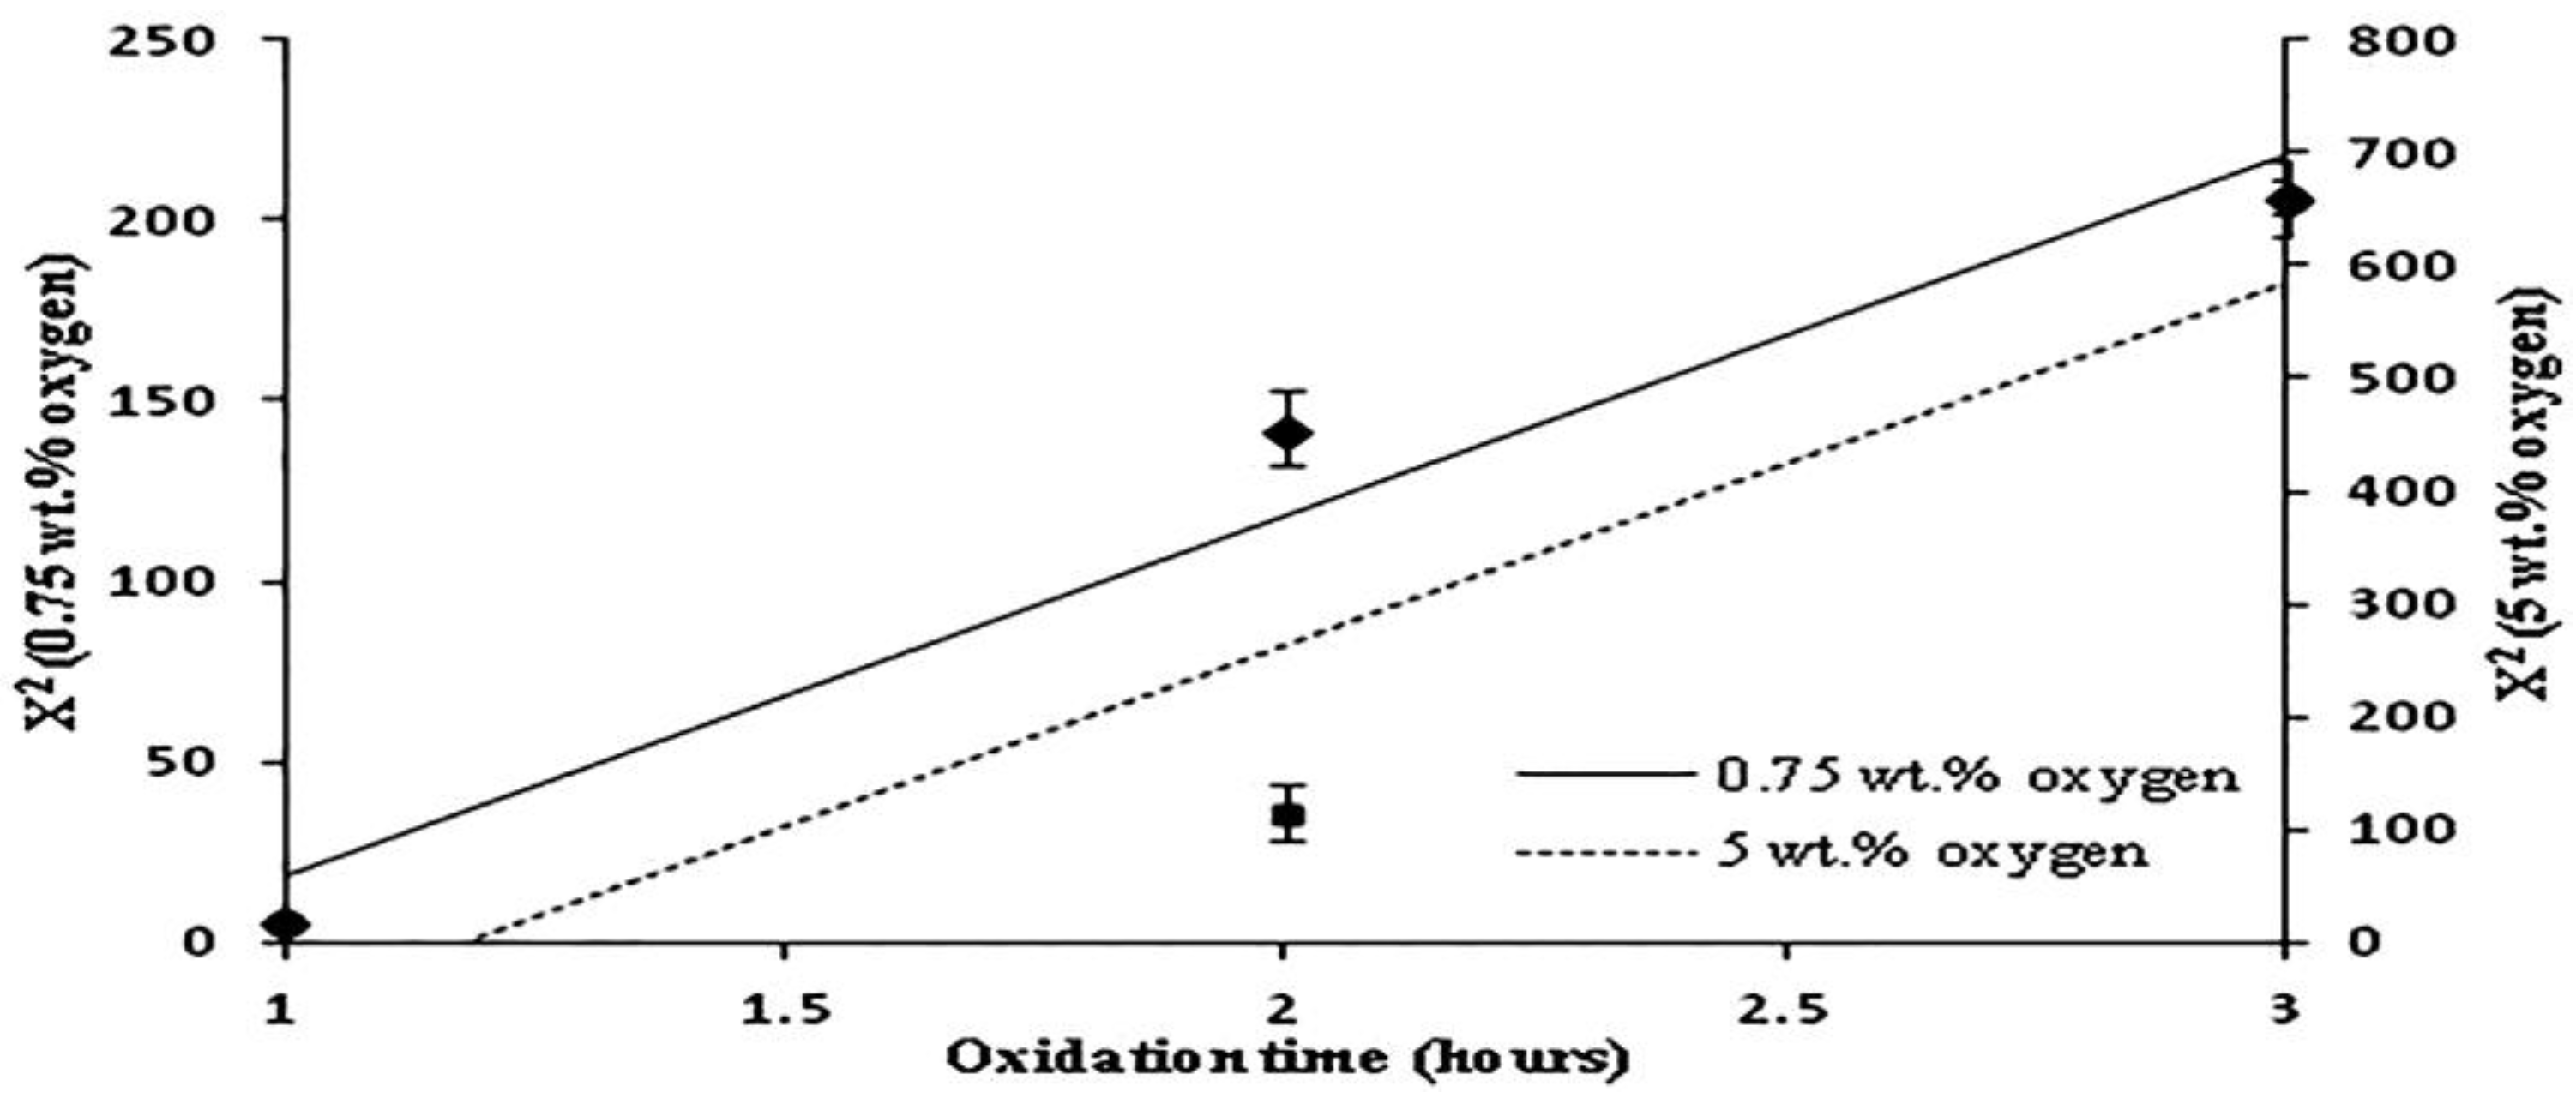
In the parabolic equation,
X,
Kp and
t are the oxide layer thickness, the oxidation rate constant and the oxidation time, respectively. The resulting oxidation kinetic plots for the growth of the oxide layers are shown in
Figure 6.
Figure 6.
Plot of the square of the oxide layer thickness against oxidation time.
Figure 6.
Plot of the square of the oxide layer thickness against oxidation time.
The rate constant from the curves, 3.0 × 10⁻⁴ µm2 s−1 and 8.0 × 10⁻⁴ µm2 s−1, were calculated for the samples oxidized in the N2 0.75 wt.% O2 and N2 5 wt.% O2 gas mixtures, respectively, through the slopes of the plots. This confirms that by increasing the weight percentage of oxygen in the N2-O2 gas mixture, the rate of the oxidation process, through the growth of the oxide layer, increased remarkably.
The thermal oxidation and the growth of the CuO, ZnO and PbO granules sufficiently modified the surface morphology and increased the average surface roughness of the surface. The values of the average surface roughness,
Ra, of these thermally oxidized samples were comparable irrespective of the N
2-O
2 gas mixture used in the experiments, as stated in
Table 2. The maximum
Ra values of 2.10 µm and 2.08 µm were obtained after 3 h of the thermal oxidation in the N
2-0.75 wt.% O
2 and N
2-5 wt.% O
2 oxidizing gas mixtures, respectively. This increase in the values of the average surface roughness and the resulting rough surfaces of the samples are due to the irregular packing, as well as the morphologies of the various oxides that have been formed during the thermal oxidation.
3.4. Underwater Oil Contact Angle Behavior
The polished surface of the C84400 was oleophilic, with an oil contact angle of 54° ± 2°. However, after the thermal oxidation process in the N2-O2 gas mixtures, the surfaces became oleophobic, with the underwater oil contact angles showing superoleophobicity with an increase in the thickness of the oxide layers. The contact angle of the oil (θo) increased and peaked at 154° ± 1° after 3 h of thermal oxidation in the N2 5 wt. % O2 gas mixture.
The roughness of the thermally oxidized surfaces, as well as the surface tension at the oil-oxide interface causes the oleophobicity of the oil contact angles on the samples when placed under water. The oxide layers act as low energy surfaces under water, due to surface tension. The average roughness values, Ra, of the surfaces were comparable irrespective of the N2-O2 gas mixture used. Therefore, the increase in the underwater oil contact angles is dependent on other factors beyond the surface roughness and surface tension effects.
To this end, the underwater oil contact angles, as well as the resultant underwater superoleophobicity can be explained from two perspectives, namely: the low fractional surface area of surfaces, due to the surface morphology of the oxide granules, as well as the porosity of the thermally grown oxide layer of varying thicknesses. Based on the Cassie-Baxter model [
20] as stated in Equation (2), the fractional surface area of the oxide granules (
fso) in contact with the oil must be small for the surface to exhibit high oil contact angles and superoleophobicity.
Using the Cassie-Baxter model, with θ equal to the underwater oil contact angle on the polished C84400 copper alloy surface (θ = 54° ± 2°) and θ
o equal to the measured underwater oil contact angle values on the thermally oxidized surfaces, the fractional surface areas of the oxide granules were calculated. The calculated values of
fso were within the range of 0.32–0.39 and 0.06–0.35 for the C84400 copper alloy samples oxidized in the N
2-0.75 wt.% O
2 and N
2-5 wt.% O
2 gas mixtures, respectively, as stated in
Table 1. The nano-sized oxides generated hierarchical surface layers, as can be seen in the SEM images, due to their irregular parking and size differences. The small granules of CuO, PbO and ZnO provided a very small surface area for wetting by the oil.
Beyond the small fractional surface area of the oxide granules, the porosity of the oxide layers aided in the increment of the underwater oil contact angles into the superoleophobic region. As stated earlier, there is a pronounced distribution of pores in the samples that were oxidized in the N
2-5 wt.% O
2 gas mixture, as shown by the SEM images in
Figure 2e–f. The distribution of the pores was insignificant in the samples that were thermally oxidized in the N
2-0.75 wt.% O
2 gas mixture, due to the morphology of the oxides and the thinness of the oxide layers.
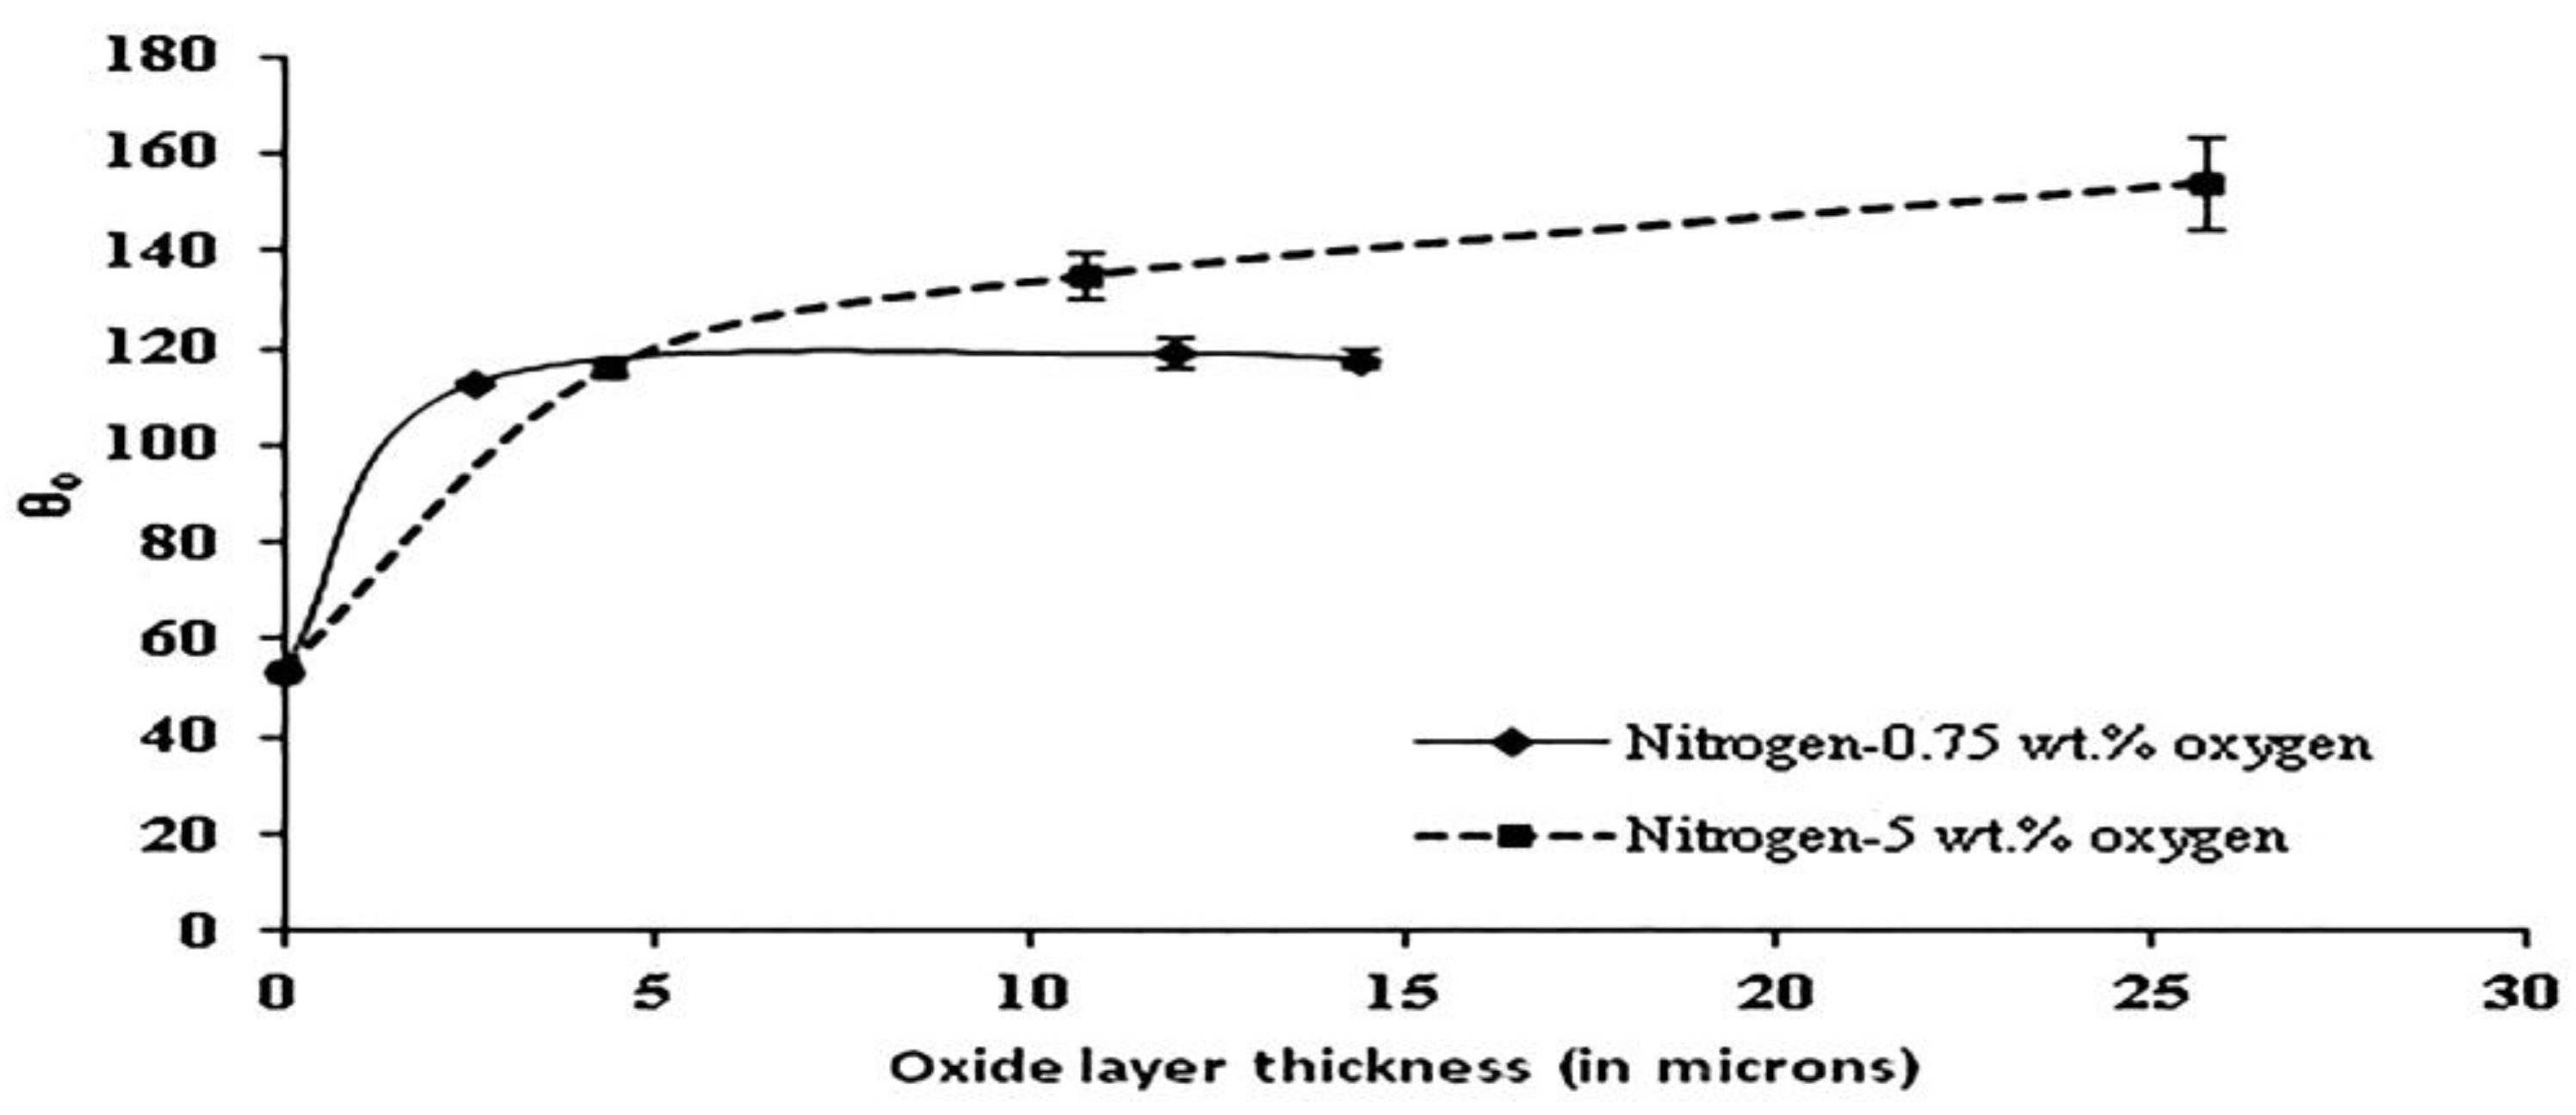
As the thickness of the oxidized surface layer increased to 25.69 ± 9.14 µm, the underwater oil contact angles on the surfaces shifted from oleophobicity to superoleophobicity. This dependence of the underwater oil contact angles with the oxide layer thickness is shown in
Figure 7.
Figure 7.
Plot of the underwater oil contact angle as a function of the oxide layer thickness.
Figure 7.
Plot of the underwater oil contact angle as a function of the oxide layer thickness.
As can be noted in the plot, the samples oxidized in the N
2-5 wt.% O
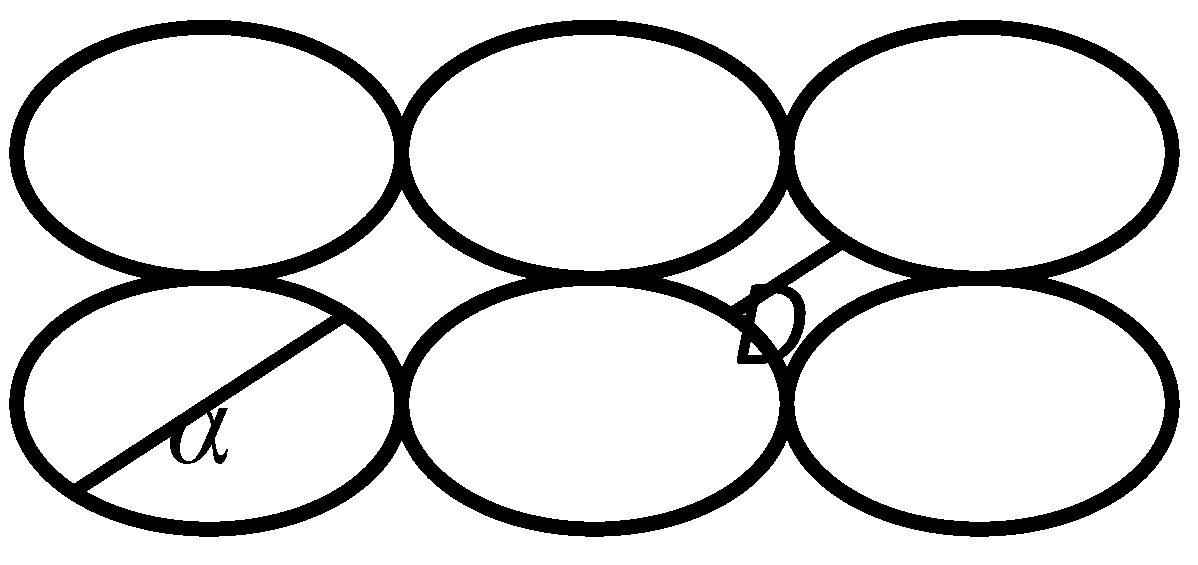
2 gas mixture showed underwater superoleophobicity on the thicker oxide scales formed after the 3 h of thermal oxidation. To effectively explain this trend, the porosities of the oxide layers are estimated based on the effective sizes of the pores, D, and the average sizes of the oxide granule, α. In this case, the porosity of the oxide layers formed after the thermal oxidation of the samples is the ratio of the pore size (D) to the sum of the pore size and the sizes of the adjoining oxide granules that creates the pore, as represented below in
Figure 8. The oxide granules are assumed to be spherical in shape.
Figure 8.
A simple 2D model of the spherical oxide granules of size α and pore sizes, D.
Figure 8.
A simple 2D model of the spherical oxide granules of size α and pore sizes, D.
Based on the above model, the porosity of the oxide layers, φ, is given as:
k is the statistical average of the number of oxide granules adjoining a pore. Thus, φ is given by Equation (4), with k equal to four.
The values of experimentally determined
D and α, as well as the calculated porosities, φ, are stated in
Table 1.
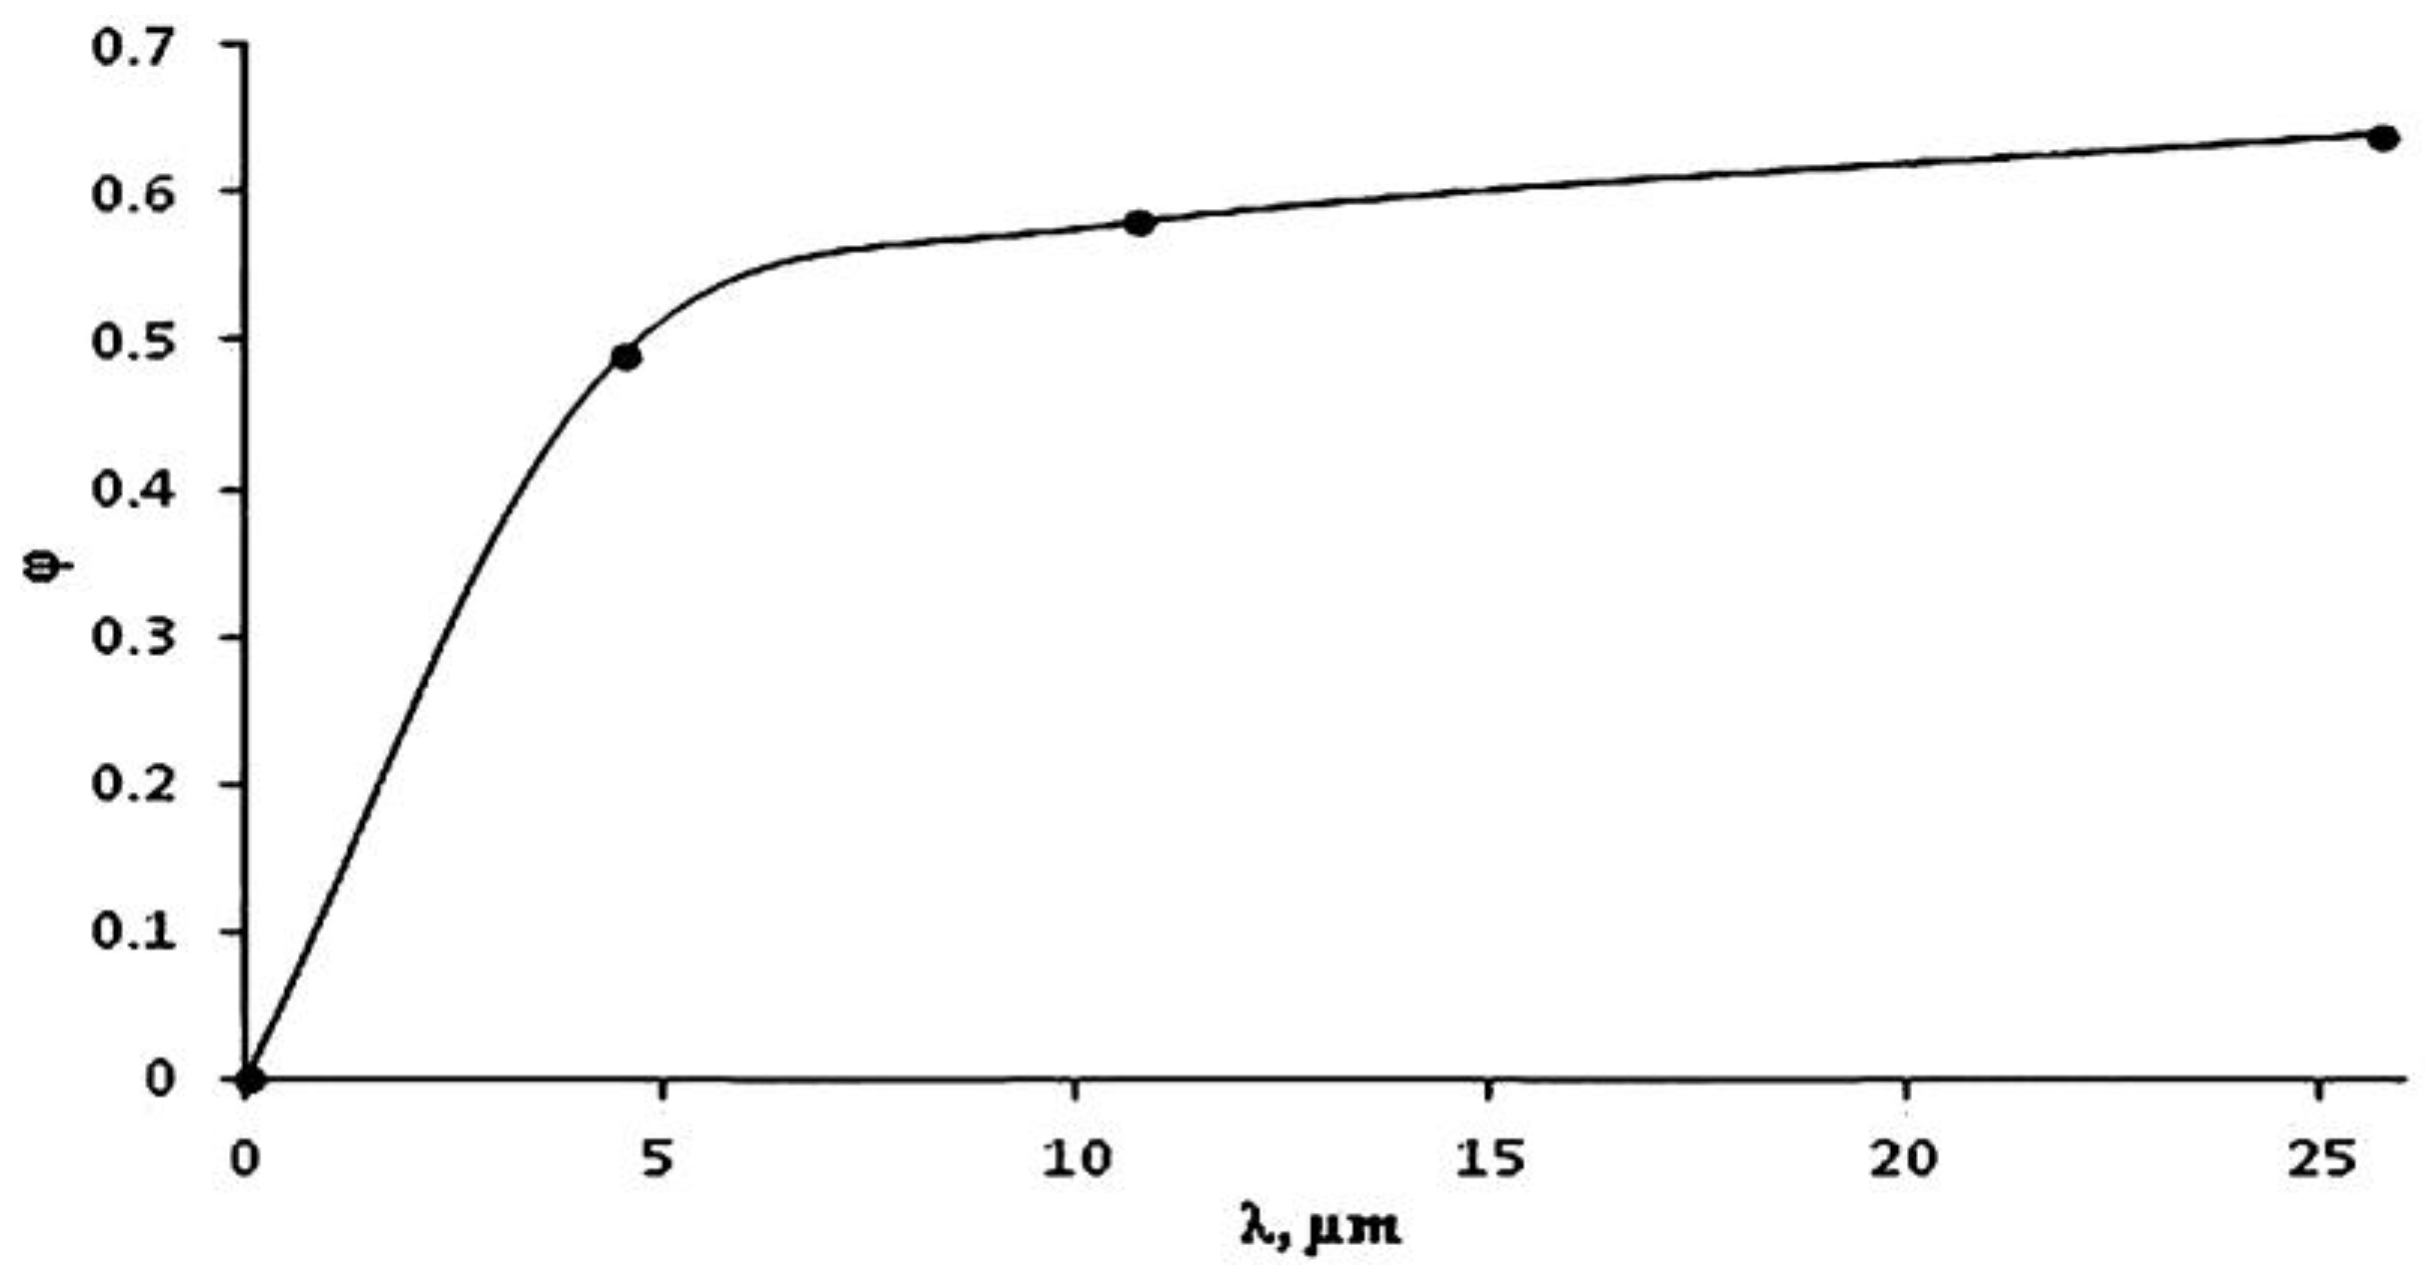
The calculated oxide layer porosities increased with the thickness of the oxide layers. This variation of the porosity, φ, with the oxide layer thickness of the C84400 copper alloy samples that were oxidized in the N
2-5 wt.% O
2 gas mixture is shown in
Figure 9.
Figure 9.
The plot of the variation of the calculated porosity, φ, against the average oxide layer thickness, λ, for samples thermally oxidized in the N2-5 wt.% O2 gas mixture.
Figure 9.
The plot of the variation of the calculated porosity, φ, against the average oxide layer thickness, λ, for samples thermally oxidized in the N2-5 wt.% O2 gas mixture.
The generally well-defined, small oxide granules formed in the N2-5 wt.% O2 gas mixture contribute significantly to the porosity, which is stabilized at higher oxide thicknesses. This is not the case with the oxide layer formed during the thermal oxidation in the N2-0.75 wt.% O2 gas mixture, where the estimated porosities were very low. This increase in porosity causes more infiltration and trapping of water in the thicker oxide layers, which is necessary to sustain a stable Cassie-Baxter state, needed for underwater superoleophobicity. The spontaneous invasion of these pores takes place through the capillary phenomenon, and the thicker oxide layers, therefore, show underwater superoleophobicity.


