Article

Diffraction Focal Position and Vector Diffraction Theory for Micro Holographic Storage Systems

1
School of Mechanical Engineering, Yonsei University, 262 Seoungsanno, Seodaemun-gu, Seoul 120-749, Korea
2
Center for Information Storage Device, Yonsei University, 262 Seoungsanno, Seodaemun-gu, Seoul 120-749, Korea
*
Author to whom correspondence should be addressed.
Appl. Sci. 2014, 4(1), 57-65; https://doi.org/10.3390/app4010057
Submission received: 18 November 2013 / Revised: 12 February 2014 / Accepted: 18 February 2014 / Published: 13 March 2014
(This article belongs to the Special Issue Optical Memory)

Abstract

:
In this study, we proposed a method to determine the optimal focal position for micro-holographic storage systems, using vector diffraction theory; the theory provides exact solutions when the numerical aperture (NA) exceeds 0.6. The best diffraction focus was determined by the position and wavelength corresponding to minimal spherical aberration. The calculated refractive index modulation, polarization illumination, and boundary conditions at the interface of different media were analyzed. From the results of our analysis, we could confirm the size of micrograting as a function of NA and wavelength, based on vector diffraction theory, compared with scalar diffraction theory which defines the micrograting by λ/(2NA). To demonstrate our analysis, we adapted an optical alignment method using a Twyman-Green interferometer, and could obtain good agreement between analysis and experimental results.

1. Introduction

A micro holographic storage system (MHSS) is one of the best candidates for next-generation high density optical memories [1,2]. Data bits are represented by microscopic-size holograms formed by the interference of two tightly focused counter-propagating beams, with each bit consuming a small amount of the entire volume [3,4]. The main advantage of the micro holographic data storage (MHDS), compared with conventional optical storage technologies, originates from use of the entire volume of the storage medium and multi-layer/wavelength multiplexing methods [5,6]. Each recorded hologram bit size should be reduced for high density recording. To satisfy this requirement, the optical system is required to short wavelength and high numerical aperture (NA) lenses. The micrograting created in a photopolymer is commonly analyzed by two counter-propagating beams using scalar diffraction theory [1,7,8]. However, the scalar diffraction theory is not considered polarization illumination and transmission and reflection of the propagating beam. Moreover, as the NA increases, the full width at half maximum (FWHM) size in the recording layer is changed; its value is dependent on the analysis method used [9]. Inaccuracies in the analysis method result in spherical aberration (SA), reduction of beam quality, and cross-talk between the recording layers. The finite element method (FEM) and finite different time domain (FDTD) method have been used to better resolve the FWHM; however, heavy computation loads can be time-consuming [10,11]. In the field of MHSSs, it is difficult to achieve superposition of two counter-propagating beams in the same location. The increment of micrograting size, reduction of beam quality, and SA are caused by misalignment of the z-axis.
In this paper, we propose a method to determine the optimal focal position using vector diffraction theory for MHSS;the method provides exact solutions when the NA exceeds 0.6. In Section 2, we describe the refractive index grating created by the interference of two counter-propagating Gaussian beams in the photopolymer using vector diffraction theory. To obtain maximum diffraction efficiency, we determined the optimal focal position for minimum hologram size and SA. In this section, we also present an analysis of the micrograting size as a function of NA and wavelength, based on vector diffraction theory; the results from this analysis were compared with the micrograting size defined by λ/(2NA)and in scalar diffraction theory. In Section 3, we demonstrate our precise optical alignment method using a Twyman-Green interferometer (TGI); good agreement was achieved between the analysis results and experimental results. The proposed method was then applied to determine the reflected power and diffraction efficiency of recorded microgratings. Section 4 provides concluding remarks.

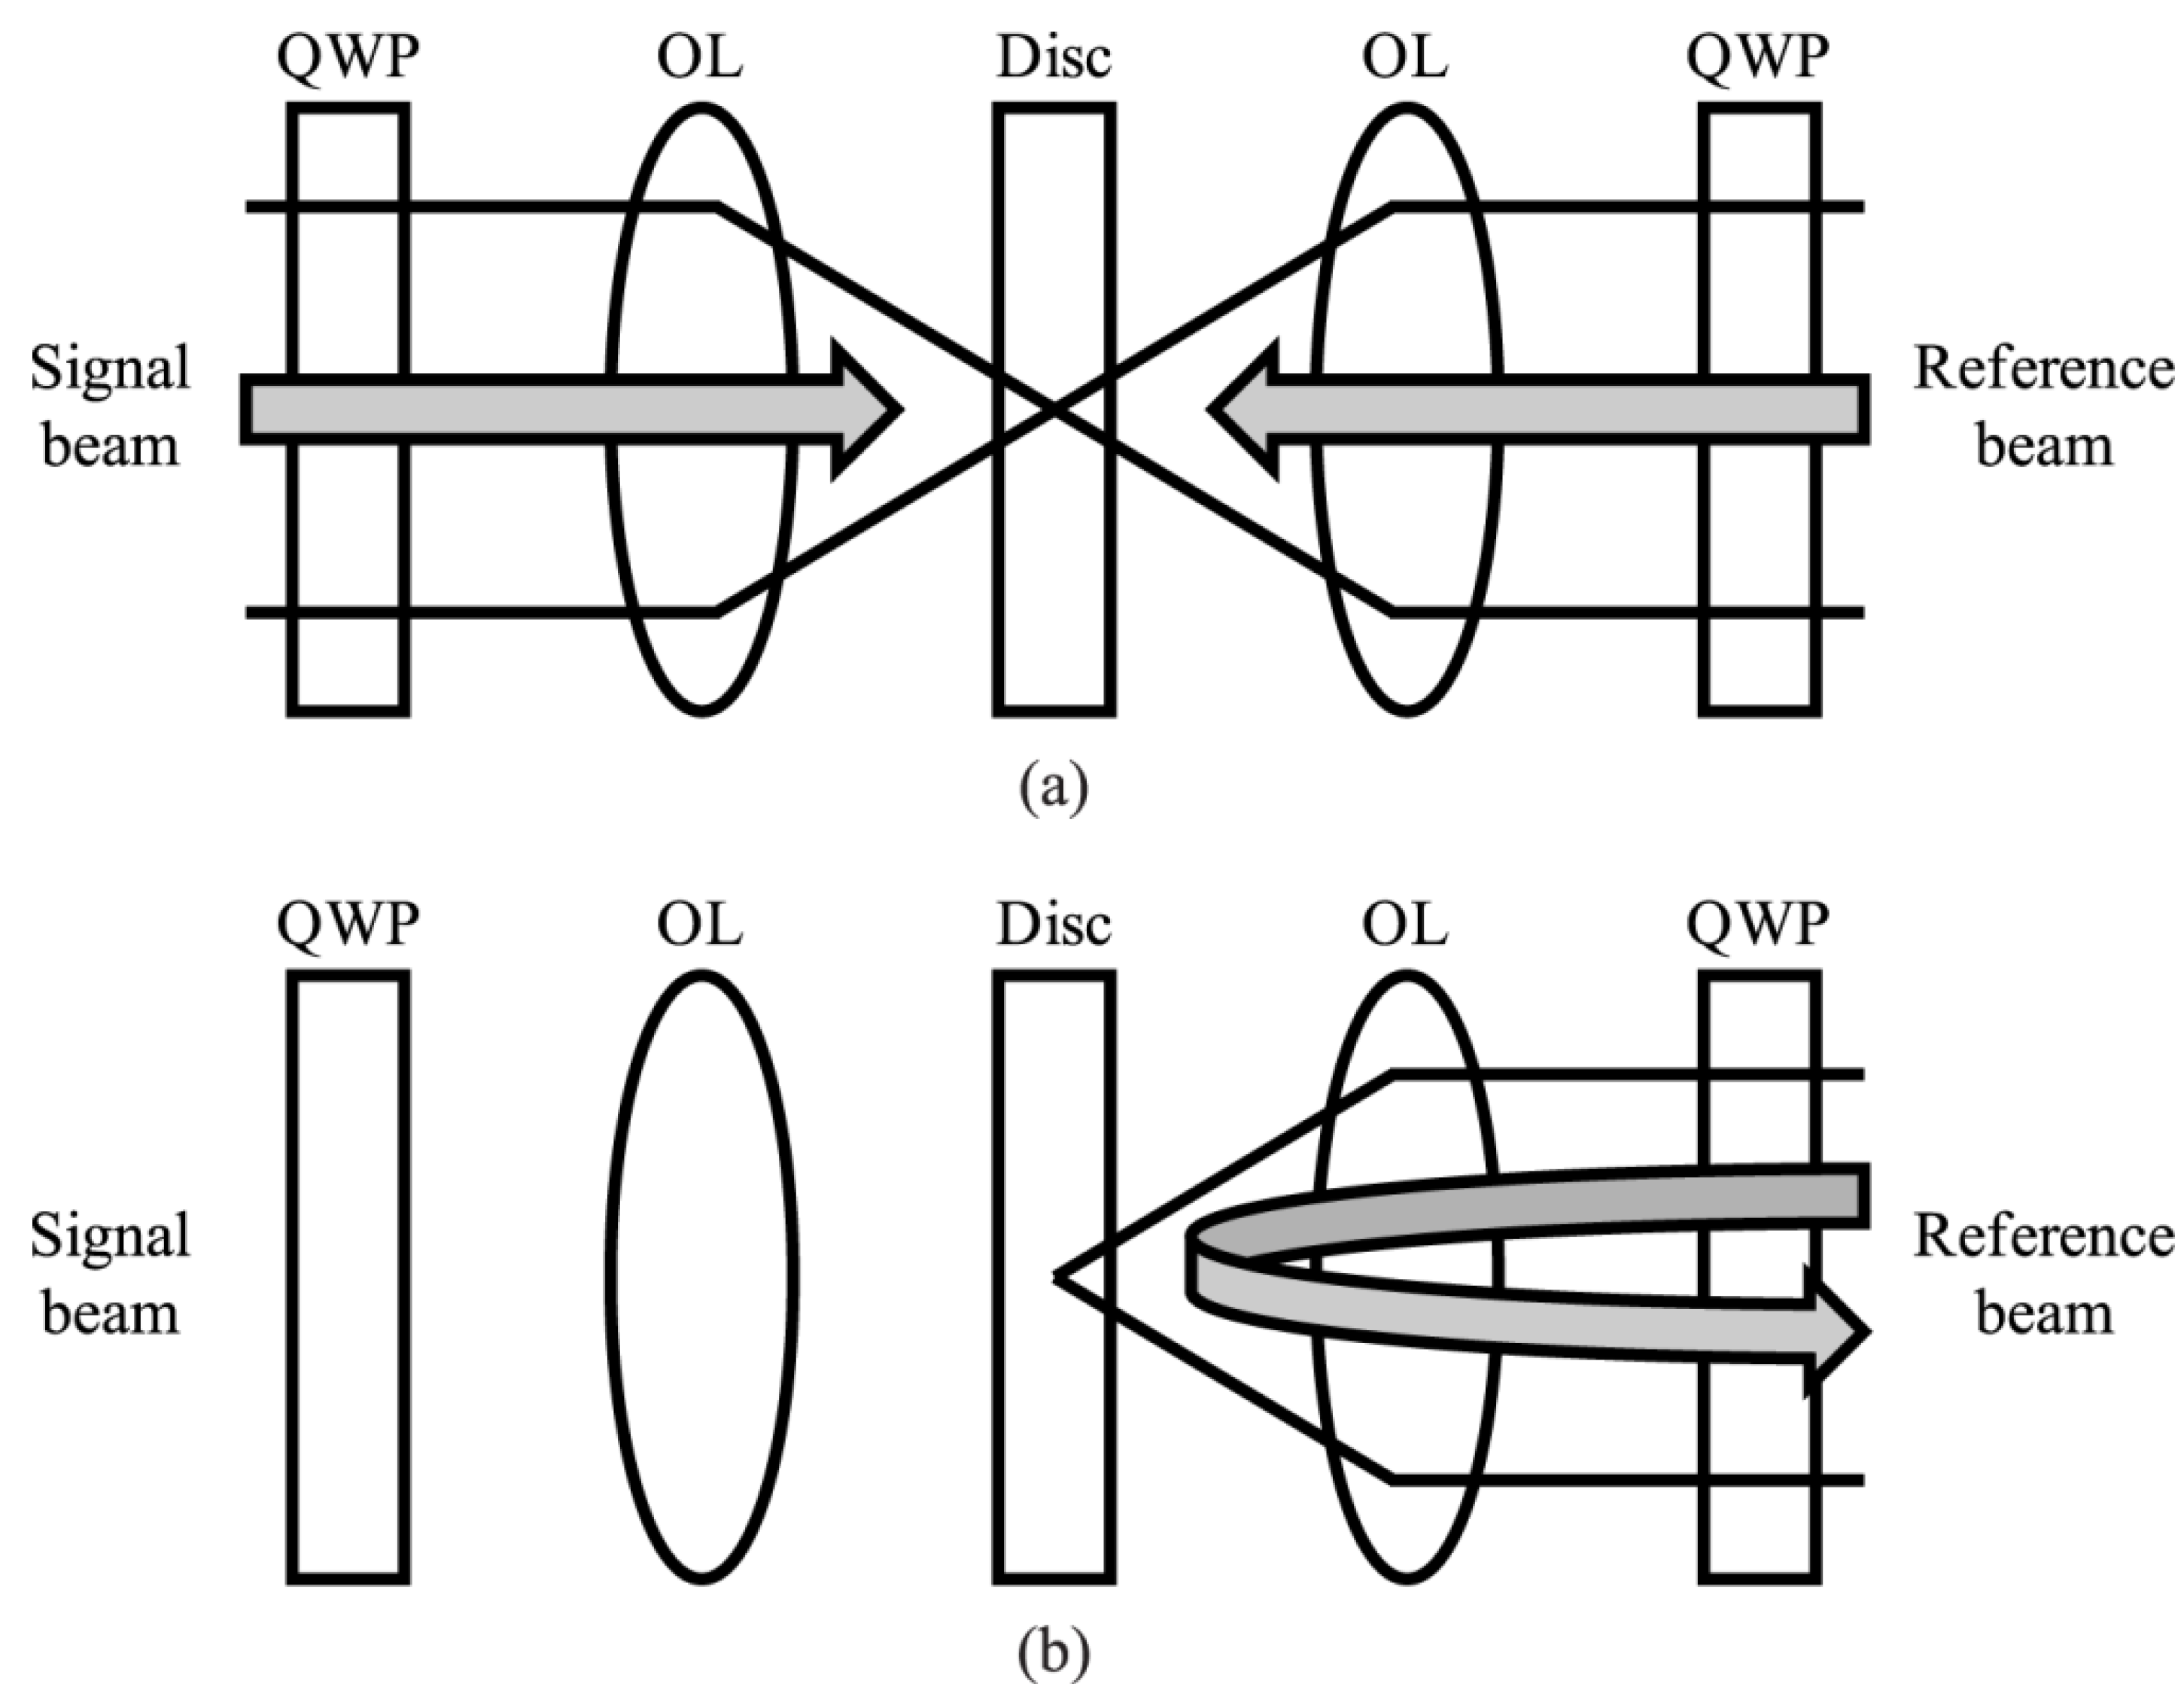
2. Micrograting of a Micro Holographic Storage System

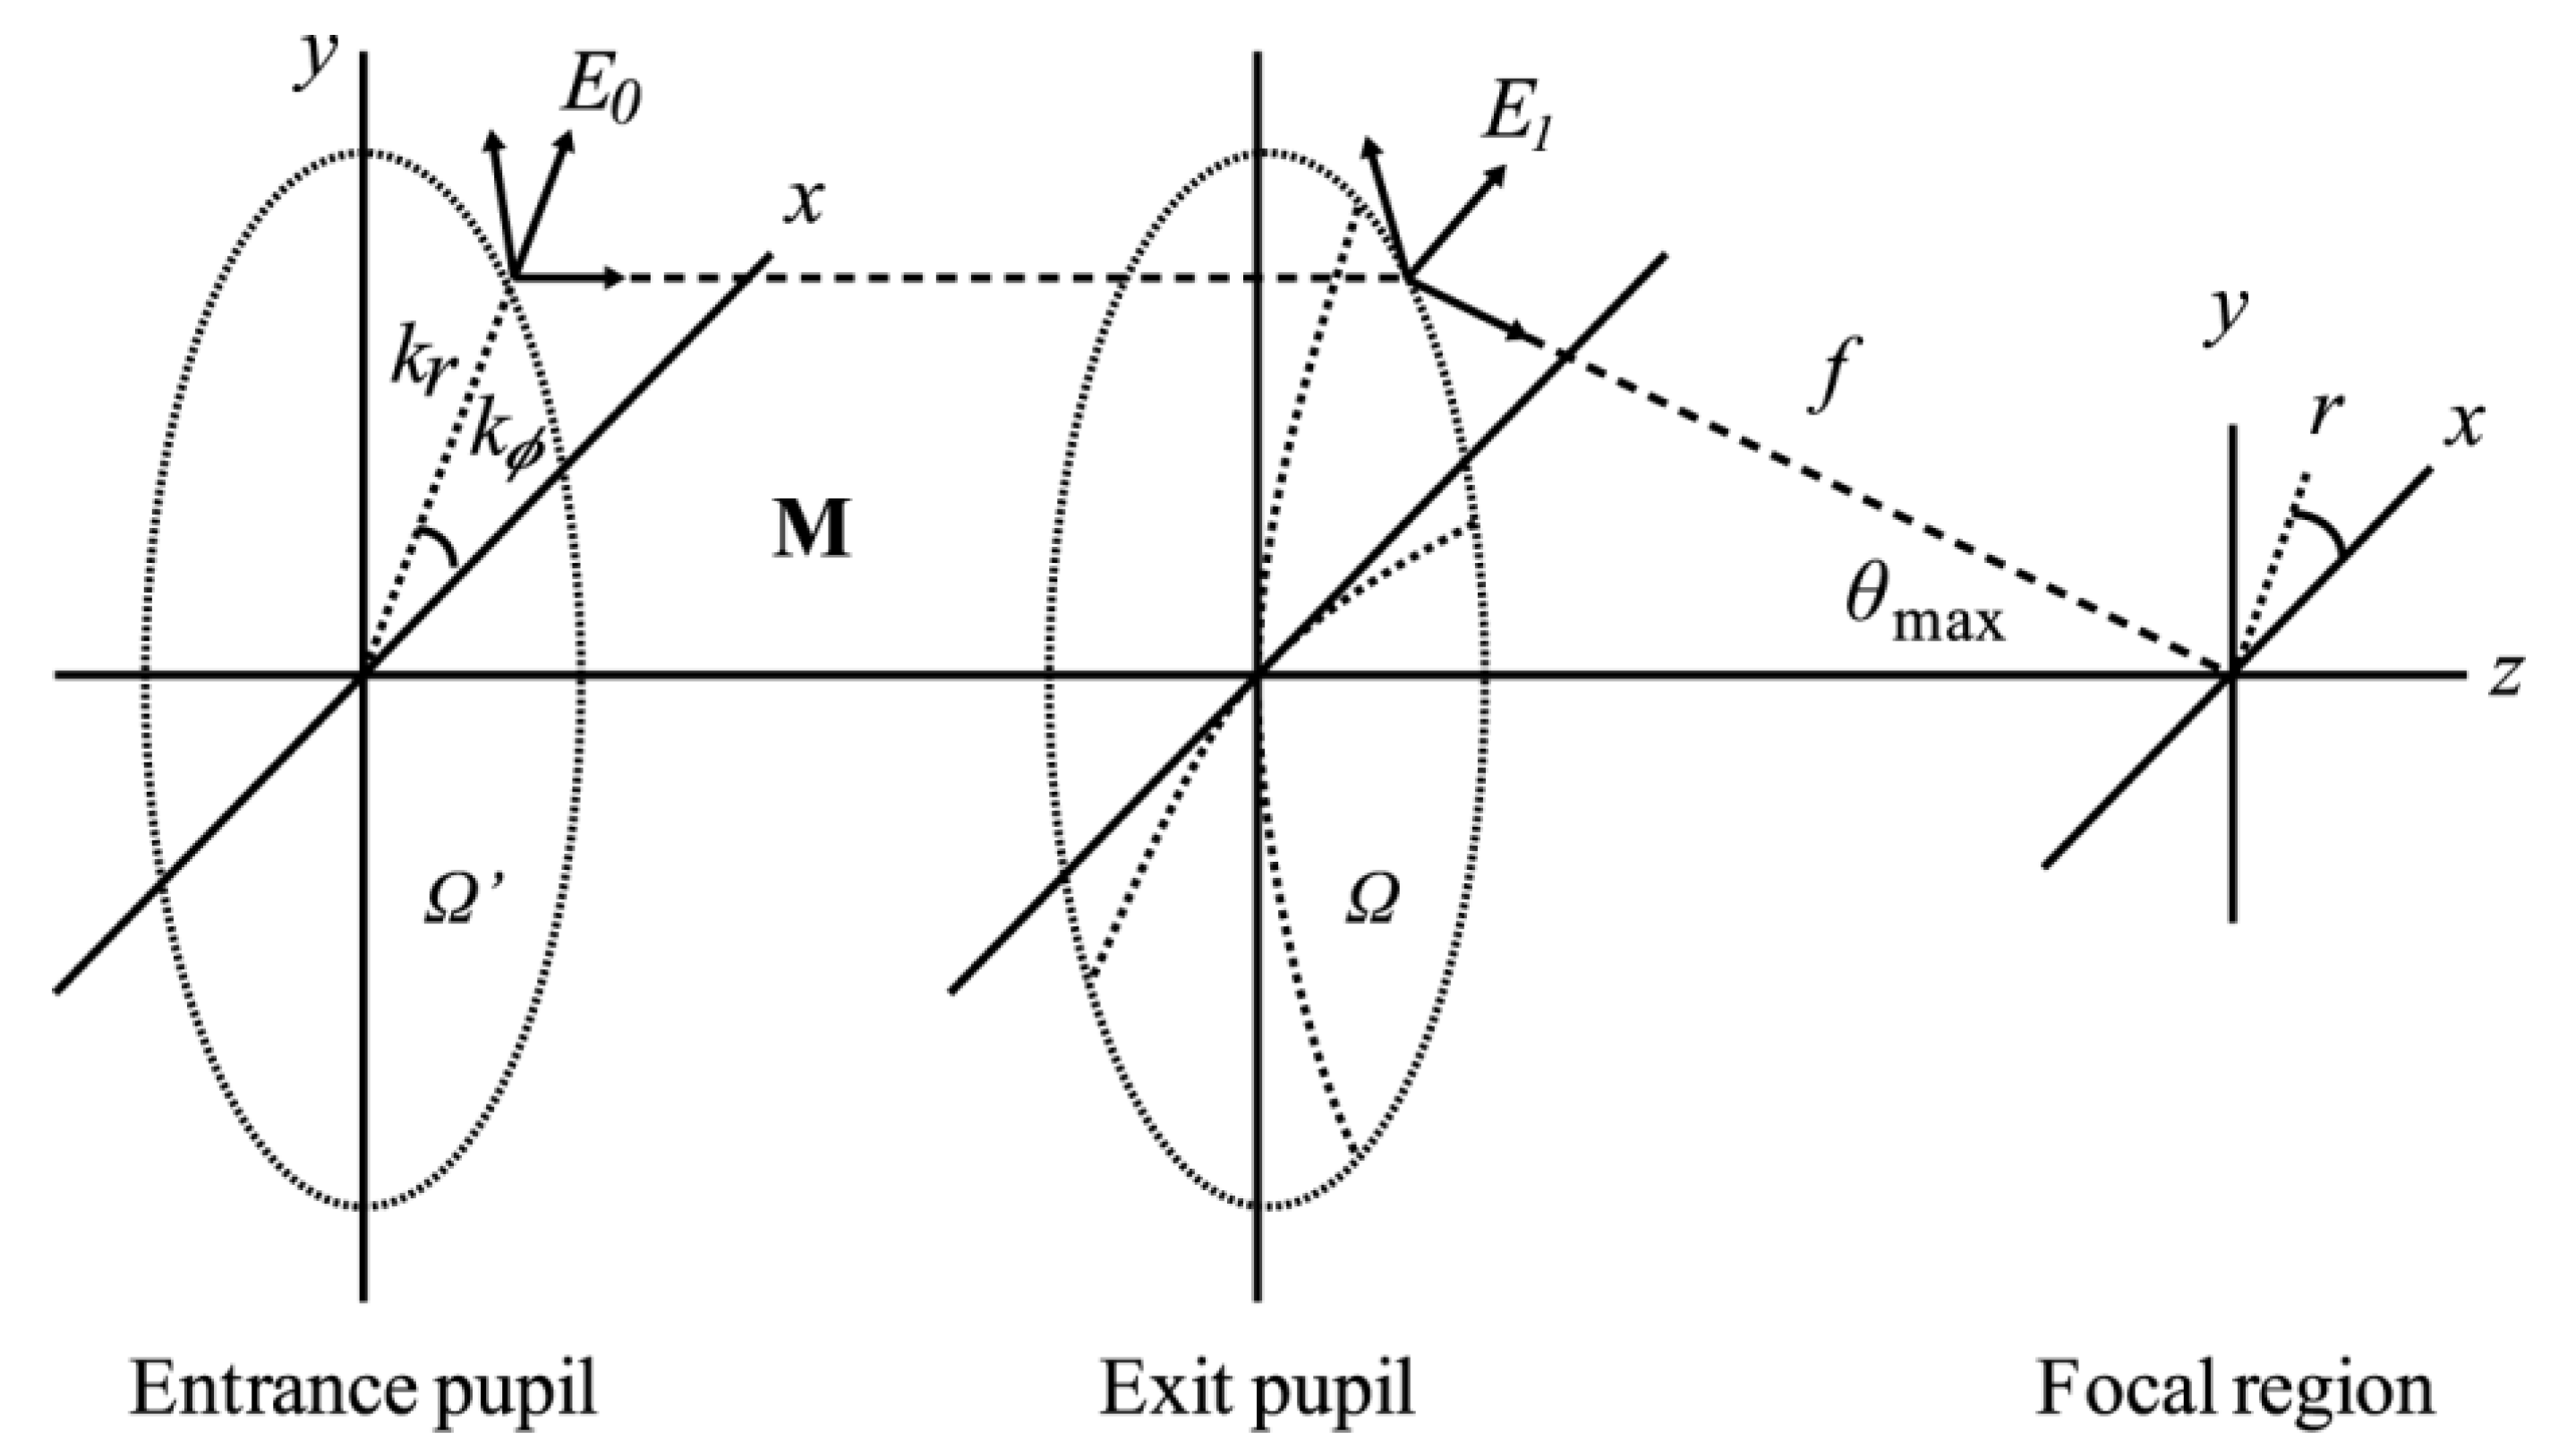
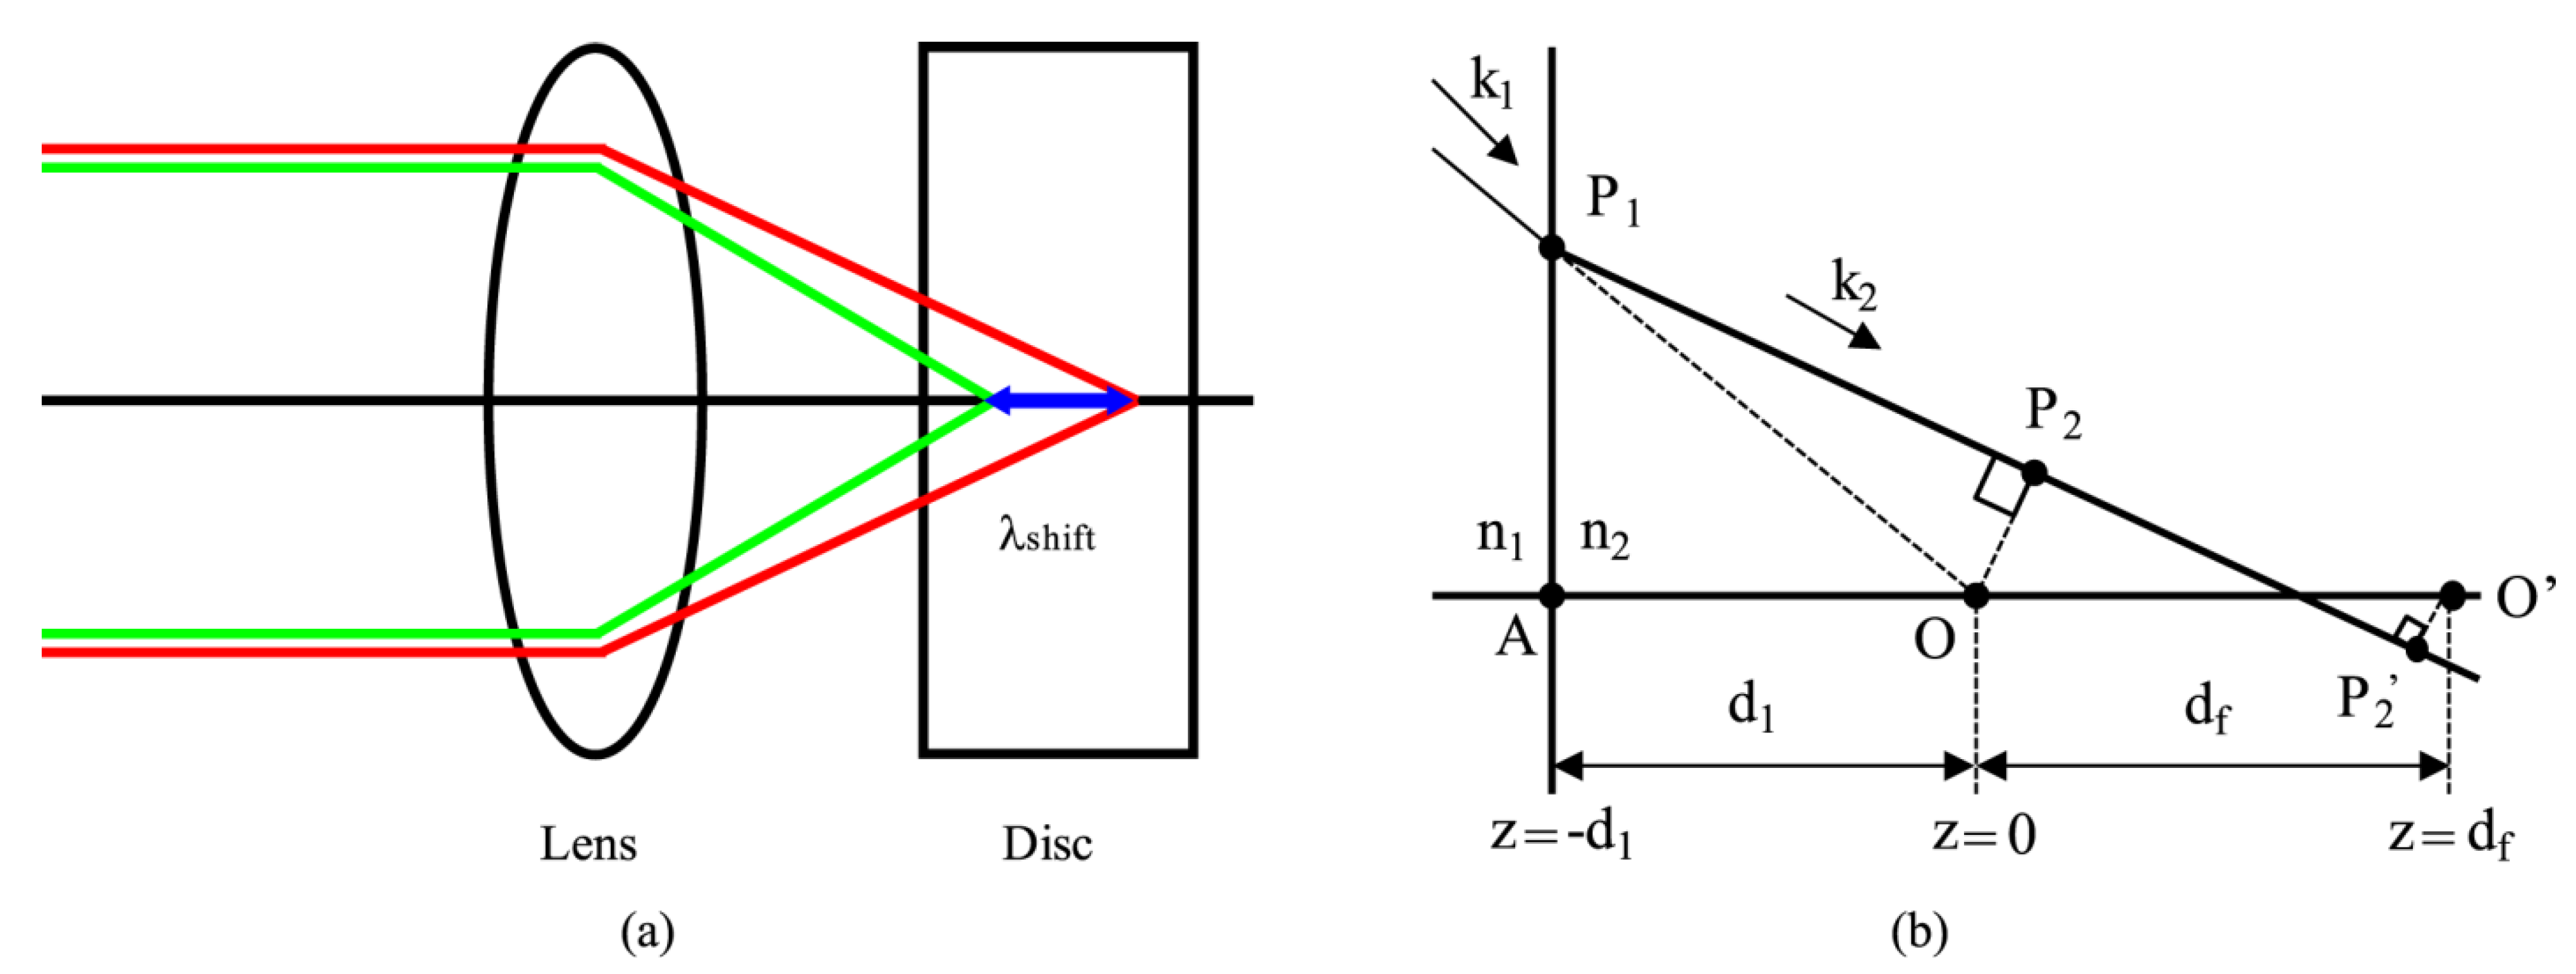
2.1. Vector Diffraction Theory for Micrograting

Figure 1 shows a schematic diagram of the MHSS to demonstrate recording and reading principles. As shown in Figure 1a, two counter-propagating beams of circularly polarized light are focused onto a photopolymer using a quarter wave plate (QWP). The micrograting is created by interference between the signal and reference beams. In Figure 1b, the reading of the recorded micrograting is carried out by the reflection of reference beam. Using this micrograting configuration, we assume that the signal and reference beams have the same amplitude and waist, i.e., Esig = Eref and wsig = wref [7]. To calculate the electric field in the photopolymer, we introduce vector diffraction theory which accounts for polarization illumination and the boundary conditions of multi-layer system such as lens-air-photopolymer configuration [12].Vector diffraction theory approaches the limits of the validity of scalar theory used to describe the illumination; additionally, this theory provides an exact solution when the NA exceeds 0.6 [12,13,14,15]. For accurate treatment of a high NA MHSS, it is necessary to use a theoretical description based fully on vector diffraction theory.
Figure 1. Recording and reading principles of micro holographic storage system (MHSS): (a) recording and (b) reading. The recording and reading beams propagate along the z-axis. The incident beam is circular polarized light.
Applsci 04 00057 g001
Figure 2. Notation scheme for the field vectors and coordinates of the optical system.
Applsci 04 00057 g002
The electric field structure of the optical system is given by Equation 1, the well-known diffraction integral. Note that the notations used for the field vectors and coordinates of the system are illustrated in Figure 2.
Applsci 04 00057 i001
where the integration takes place over the exit pupil of the optical system, in terms of the spatial-frequency coordinates kx and ky. The electric field at the exit pupil is effectively decomposed into plane waves having frequencies of kx, ky, and kz12 = k12kx2ky2. The relationship of the field distribution between the exit pupil and the entrance pupil is given by Applsci 04 00057 i002 with f corresponding to the focal length of the lens system, and the general lens matrix incorporating possible layer transitions, as derived and summarized in reference [12].
The MHDS should be considered exact focal point shift due to dual wavelengths (green: recording and reading beams; red: focusing beam) and the refractive index of the photopolymer. Figure 3a,b demonstrate the focal shift associated with different wavelengths and differing refractive indices, respectively. Figure 3b shows the free space ray and refracted ray of the beam that is virtually focused at point O. The exit pupil of the focusing system is situated in the first medium with a refractive index of n1. At z = z1, the beam is transmitted through an abrupt transition to a semi-infinite second medium with refractive index n2 that leads to a focal shift df. To find the optimal focal position, we will use the Stallinga’s theory for maximum diffraction efficiency and beam quality/minimum SA and micrograting size [16].
Figure 3. Scheme of focal shift associated with (a) wavelengths and (b) refractive indices.
Applsci 04 00057 g003

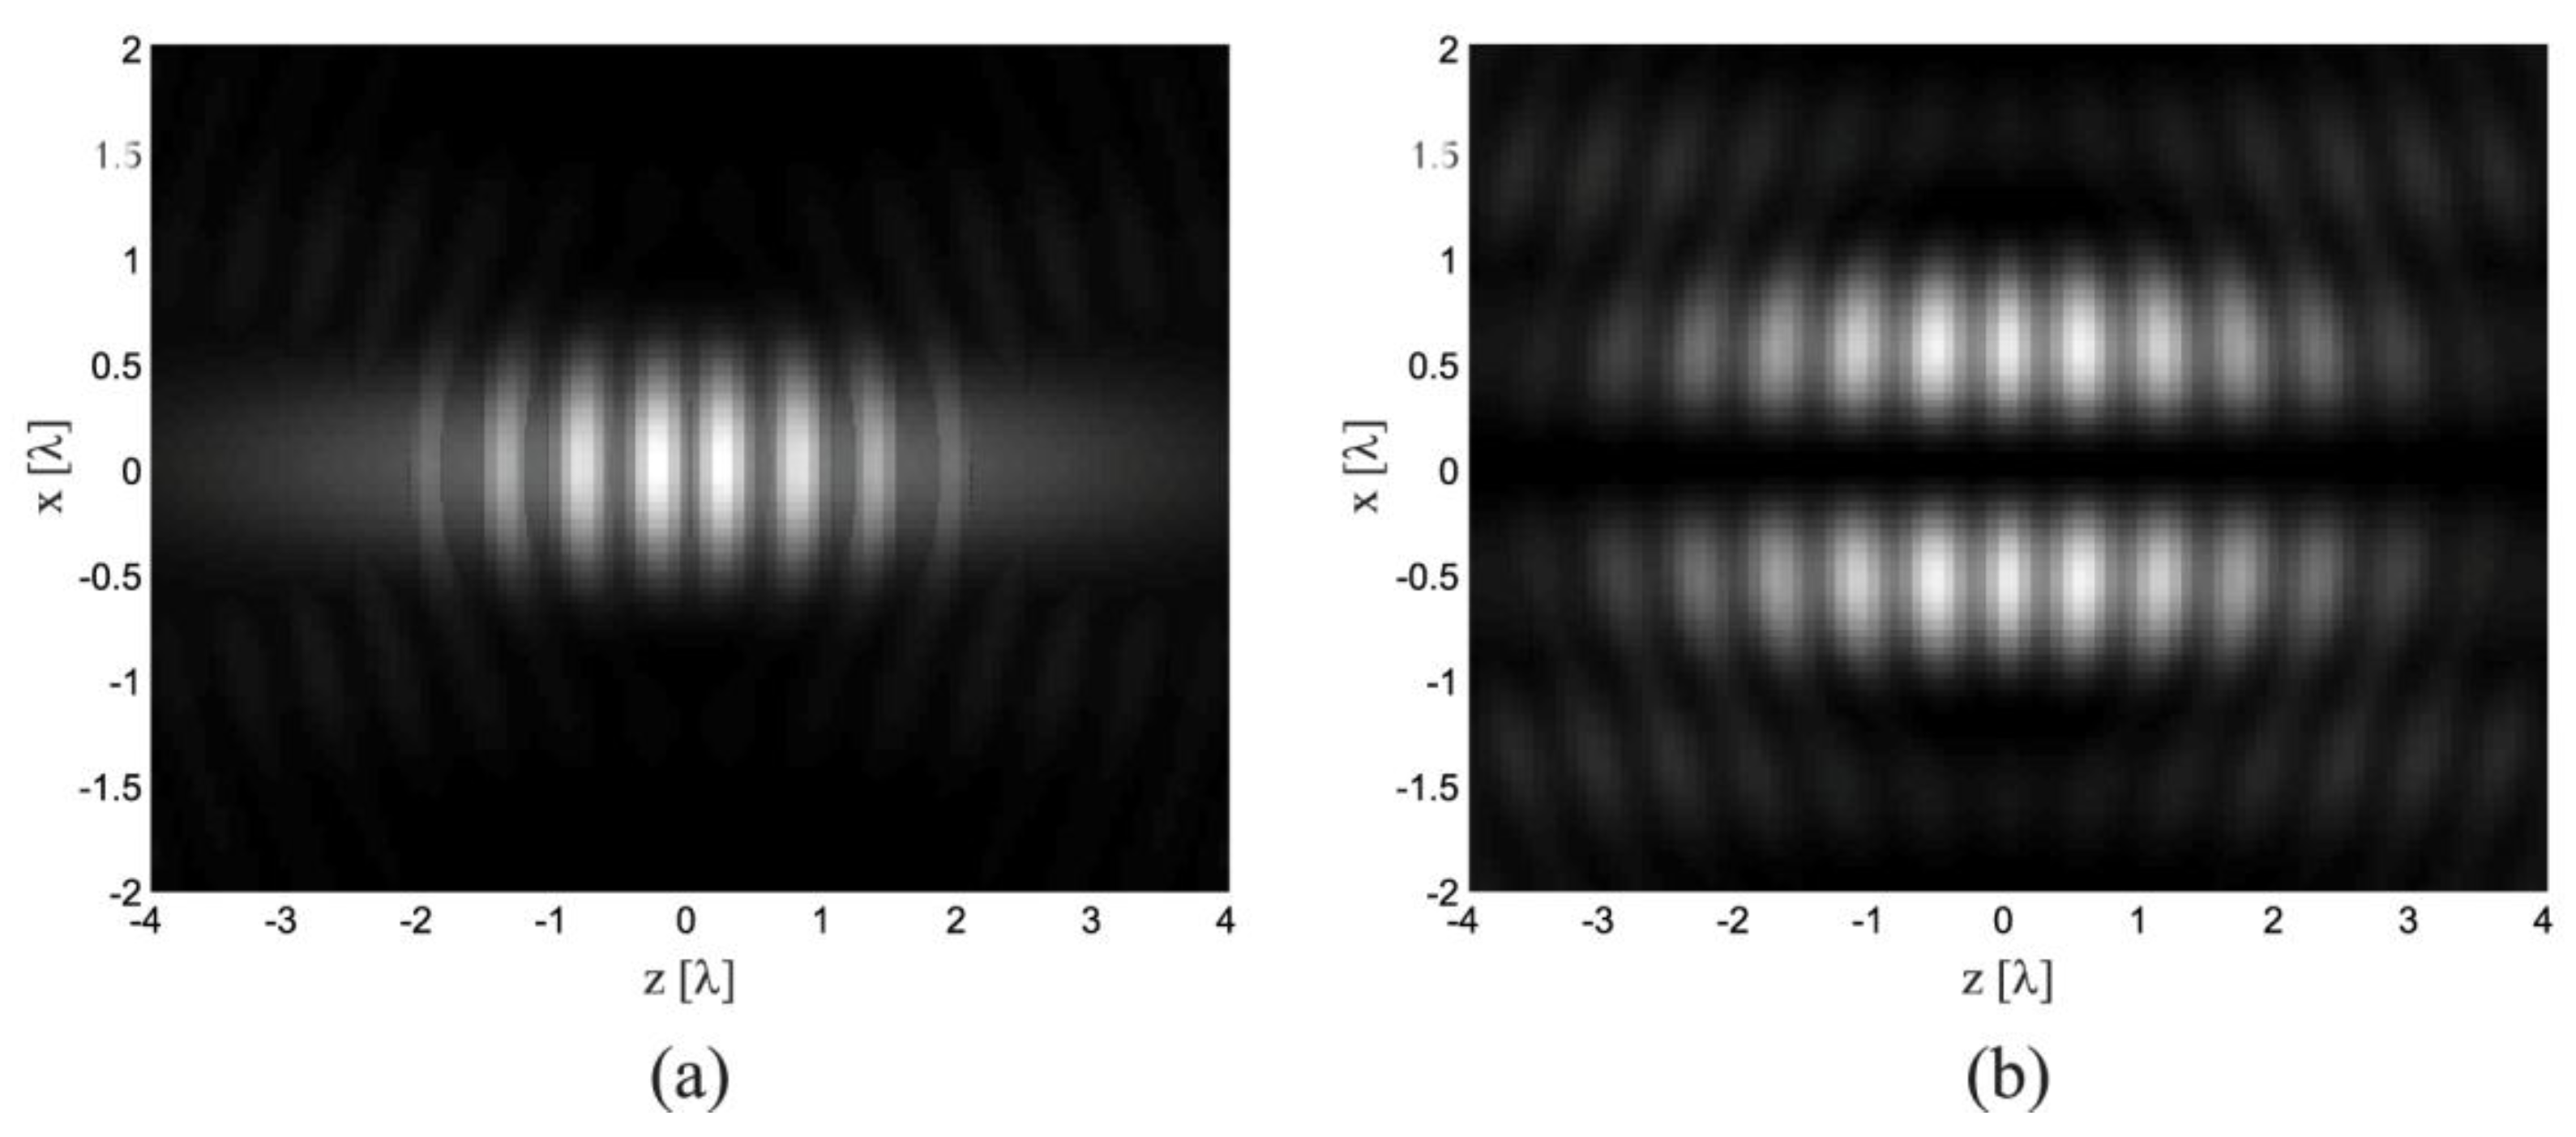
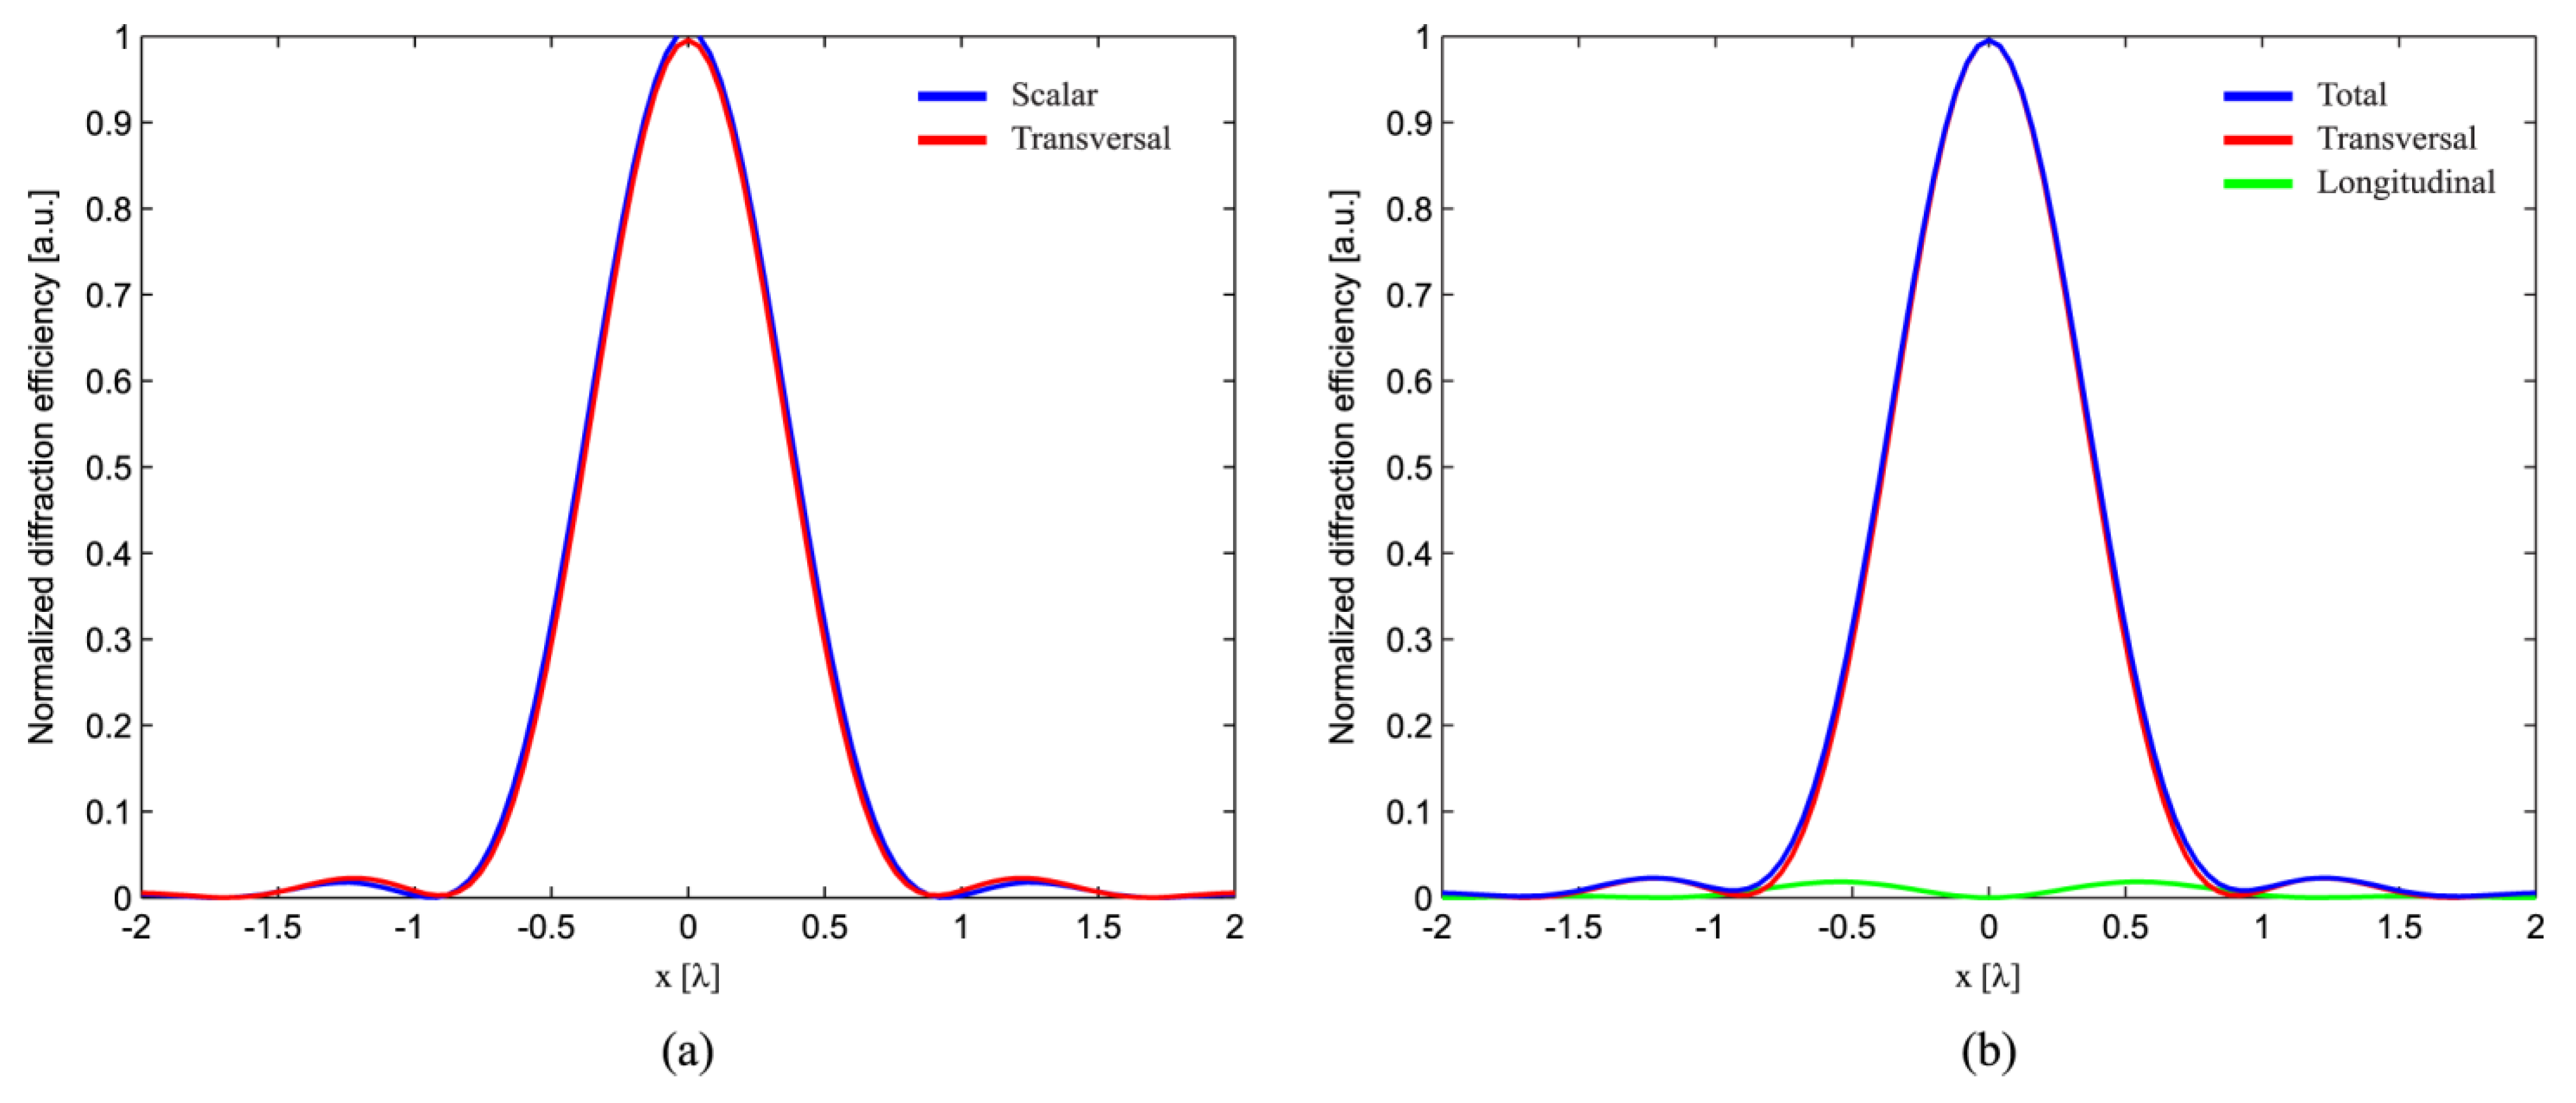
2.2. Numerical Results for Micrograting

Figure 4 shows the spatial refractive index modulation of a micrograting induced by the interference of two focused counter-propagating beams using vector diffraction theory.
In this paper, the micrograting was modulated by 532 nm wavelength, objective lens (OL) of 0.65 NA, and photopolymer. The micrograting pattern of the two beams was created by the corresponding spatial modulation of the complex refractive index in the photopolymer. The modulation range of the micrograting, created by focused Gaussian beams, was approximately confined to the double Rayleigh range, 2zR. The modulation range of the refractive index rapidly decreased with increasing distance z from the center of the micrograting. The micrograting in the recording region consisted of both transversal and longitudinal components. To investigate the effects of vector diffraction theory, we carried out a comparison of the resulting micrograting size for the various NAs and wavelengths, as summarized in Table 1.
Figure 4. Calculated refractive index modulation of a grating induced by two counter-propagating beams. The intensity pattern created using vector diffraction theory: (a) transverse and (b) longitudinal components. The gray scale indicates an increment of refractive index modulation, and the axis scale is calculated in terms of wavelength unit.
Applsci 04 00057 g004
Table 1. Optical parameters for numerical simulation model.
Effective NA0.6/0.7/0.8
PolarizationCircular
MediaRecordingPhotopolymer n = 1.53, Thickness = 400 μm
SubstrateGlass n = 1.53, Top = 600 μm, Bottom = 600 μm
Wavelength405/532/633 nm
For comparison, we calculated the FWHM by the λ/(2NA) to compare scalar and vector diffraction theories. The calculated micrograting size in the focal region is shown in Table 2.
Table 2. Comparison of micrograting size using scalar diffraction theory and vector diffraction theory analyses.
λ (nm)NAλ/(2NA) (nm)Scalar (nm)Vector (nm)
TransverseTotal
5320.6443457444458
0.7380390405422
0.8332342325349
4050.6337348338349
0.7289297308321
0.8253260248266
In the case of scalar diffraction theory, the recorded micrograting size was equal to 0.514 λ0/NA, and could be expressed as the FWHM of Airy ring pattern rAiry = 0.610 λ0/NA. As the NA increased, the FWHM given by vector diffraction theory was larger size. The micrograting, as calculated with scalar theory was almost equal to the transversal component. The difference in the calculated size is attributed to the side-lobe of the longitudinal component, as shown in Figure 5. In Figure 5b, the transversal component has circular shape (i.e., TEM00-mode) and strong intensity strength; in contrast, the longitudinal component has a doughnut shape and weak intensity strength.
Figure 5. Comparison of the full width at half maximum (FWHM) in the photopolymer for scalar and vector diffraction theory: (a) scalar and transversal component in vector diffraction theory and (b) the total, transversal, and longitudinal component in vector diffraction theory.
Applsci 04 00057 g005

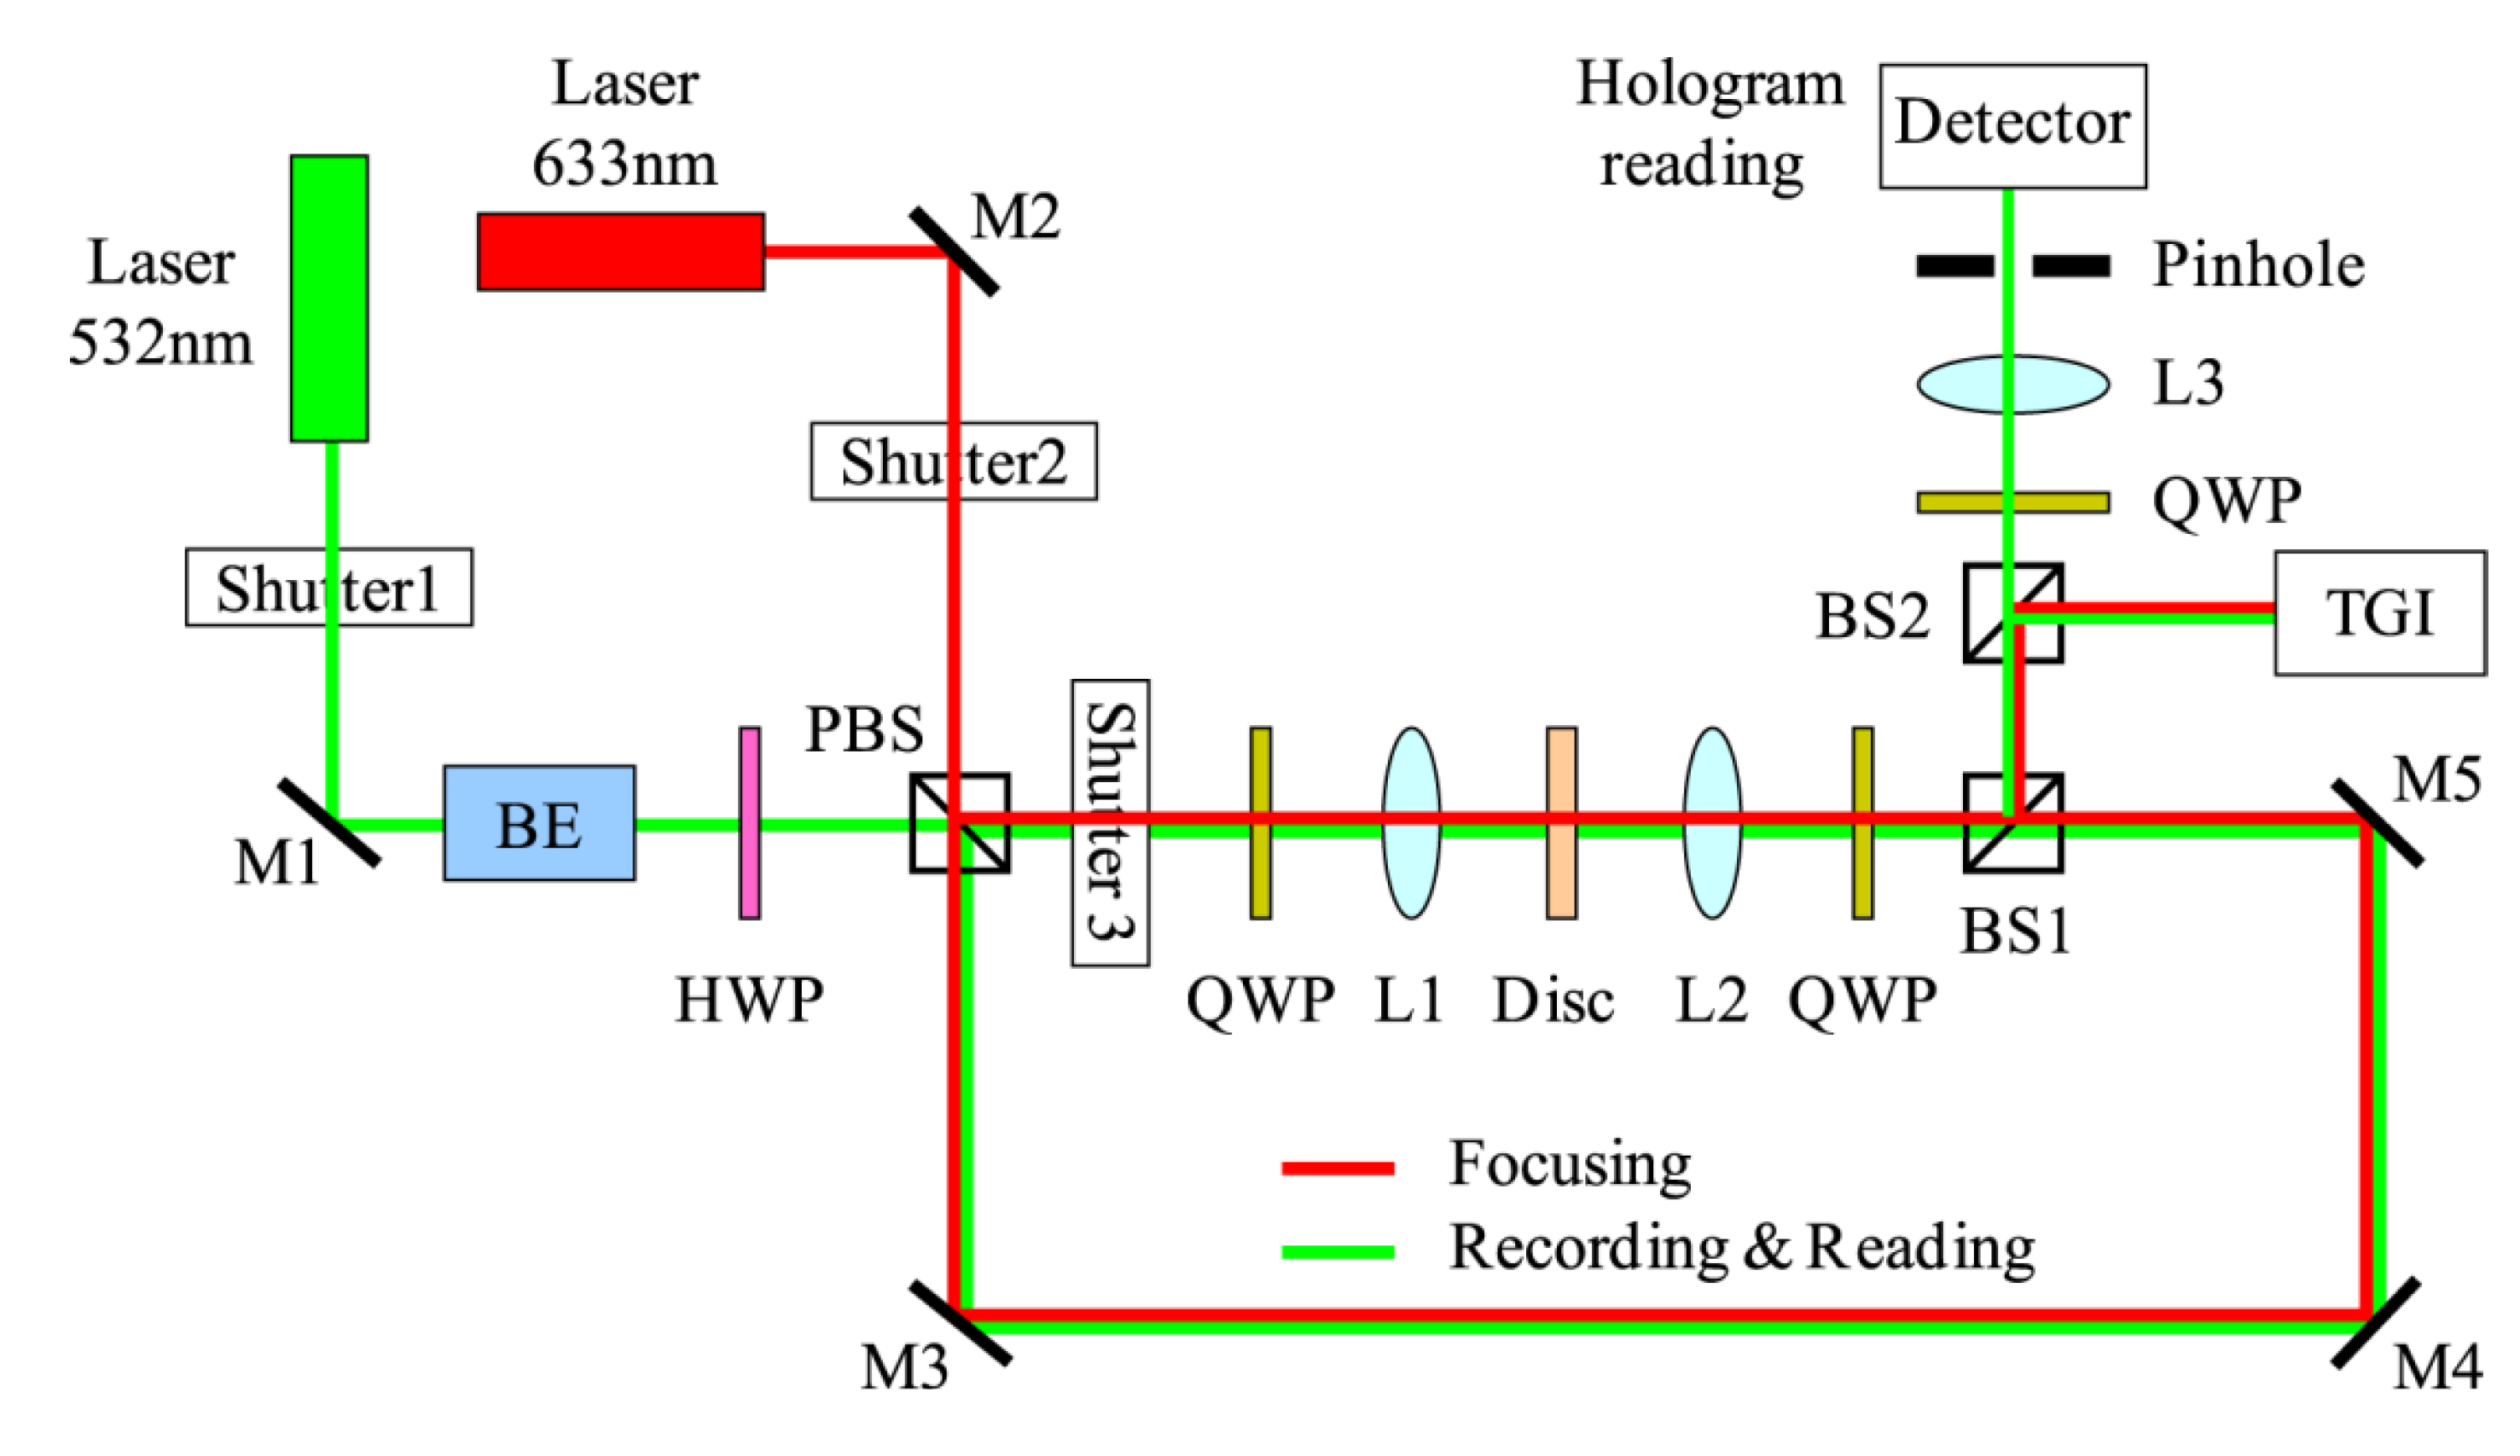
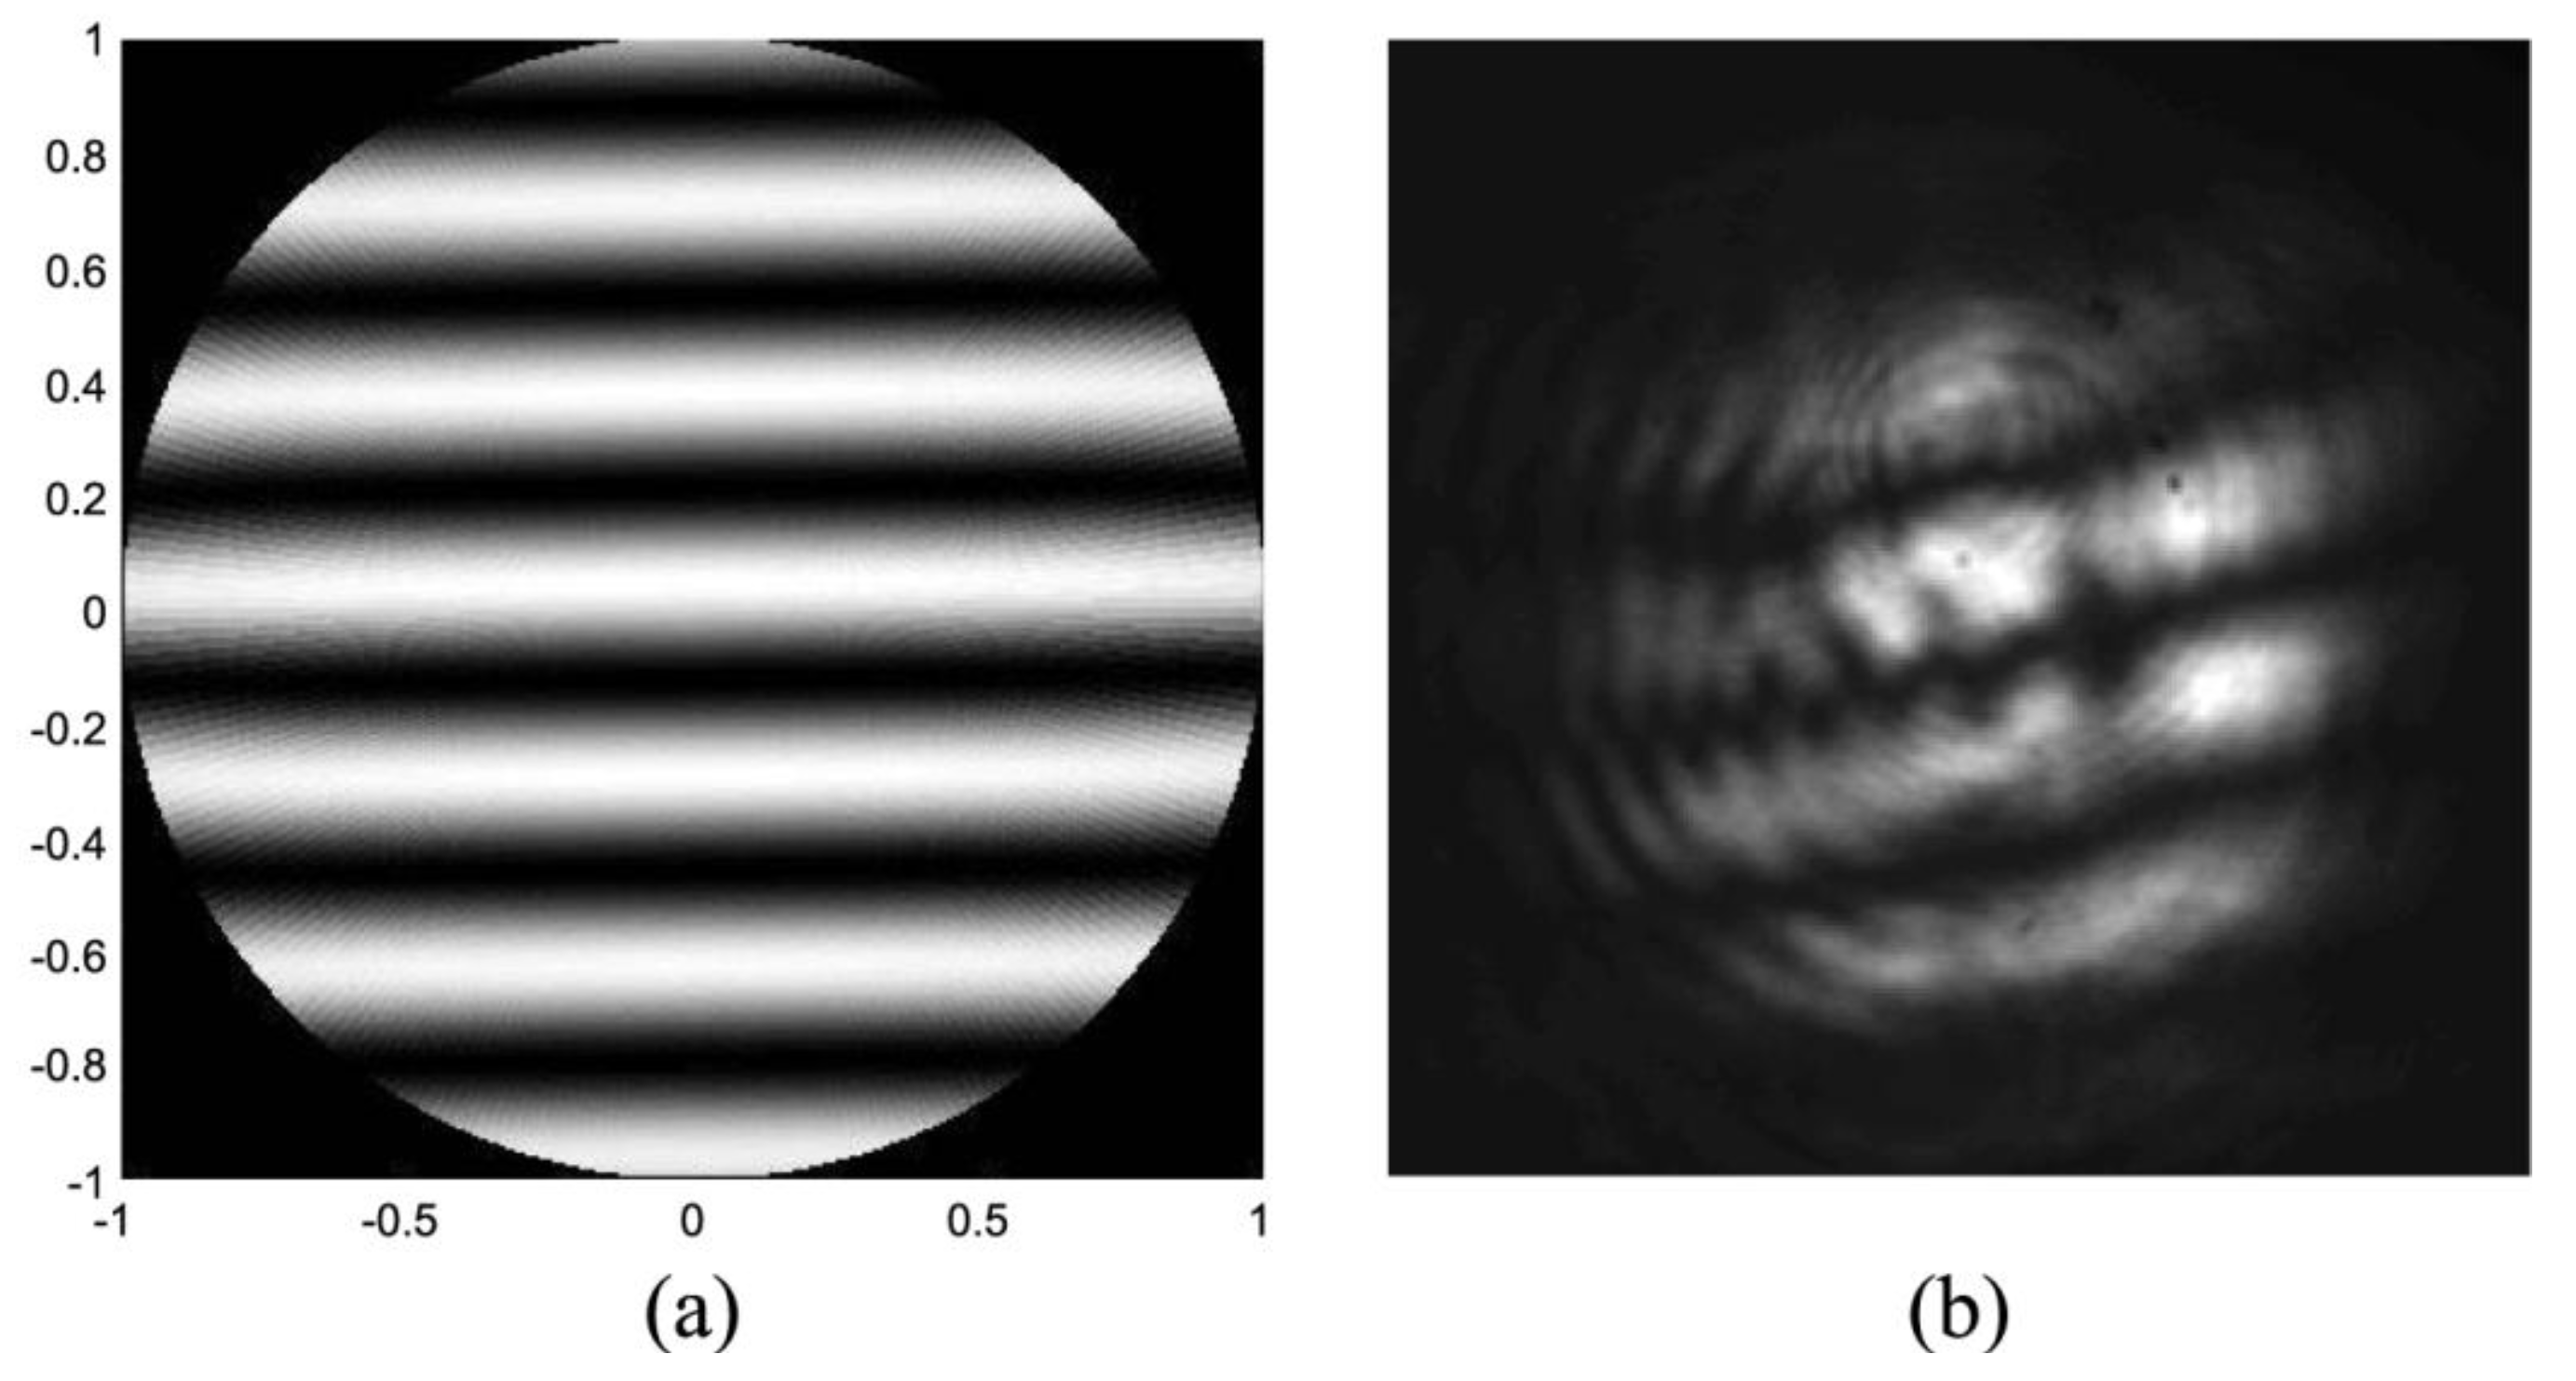
3. Experimental Section

Figure 6 shows the experimental set-up for recording and reading of the micrograting. The photopolymer was not sensitive to red wavelength; thus, a He-Ne laser (633 nm) was used for the exact focusing and optical alignment. A Nd:YAG laser (532 nm) was used for recording and reading of the micrograting. The beam was split into signal and reference beams using a polarization beam splitter (PBS). Shutter 2 was open during alignment with the red laser. Shutter 3 was open during the recording of two counter-propagating beams, and closed during the reading of the recorded micrograting. The incident plane waves were converted into circularly polarized light using a QWP. To obtain a high quality reading signal, a confocal filter was used to remove the noise and cross-talk of the adjacent recording layer. An OL mounted to a precision linear stage provided 17 nm/1 pulse resolution.
Figure 6. Experimental set-up for MHSS. BE: beam expander, M, mirror; L, lens; BS, beam splitter; PBS, polarization beam splitter; HWP, half wave plate; QWP, quarter wave plate. Green, recording and reading beam; Red, guide beam for optical alignment.
Applsci 04 00057 g006
The TGI shown in Figure 7 was designed to find the exact focal position and optical alignment. In Figure 7, the entrance pupil signal shows the micrograting in the focal region. The TGI set-up allows high resolution for good optical imaging quality, enabling the detection of defocus, astigmatism, coma, and SA resulting from the interference of the object beam and tilt of the reference beam. The exact optical focusing and alignment can be checked using the interference fringe pattern; a straight-line pattern indicates good optical alignment. In Figure 8, we confirmed the optical alignment by comparing the numerical results with those obtained experimentally.
Figure 7. Proposed experimental set-up: Twyman-Green interferometer (TGI) for exact focusing and optical alignment.
Applsci 04 00057 g007
To verify the recording and reading of the micrograting, OL of 0.65 NA is used. The OL was an aspherical, aberration free lens, commonly used for high diffraction efficiency and quality. The Aprilis photopolymer (HMC-050-G-06) was used for the recording and reading of MHDS. The thickness of the photopolymer was 400 μm, and the two glass substrates had thickness of 600 μm. The shutter had an exposure time of 100 ms. The recording energy (for are cording power signal of 240 μW and reference beam of 240 μW) was 24 μJ. During the reading process, a reflected power of 2 μW was detected. The calculated diffraction efficiency was 0.83%; note that this value is calculated by confined volume of the micrograting and limitations of the optical system (NAlens < nphotopolymer).
Figure 8. Interferogram results obtained from (a) numerical analysis and (b) experiment.
Applsci 04 00057 g008

4. Conclusions

In conclusion, we proposed a method to obtain the optimal focal position for MHSS using vector diffraction theory. The optimal focal position corresponded to minimal SA. We analyzed the micrograting size in the photopolymer for different wavelengths and NAs, based on vector diffraction theory, and compared the results defined by λ/(2NA) in scalar diffraction theory. A TGI was used to locate the exact focus of two counter-propagating beams, within 1% diffraction efficiency. Our results indicated that this method could be used to obtain the appropriate micrograting size for areal and z-direction multiplexing in MHSSs.

Acknowledgments

This work was supported by the National Research Foundation of Korea (NRF) grant funded by the Korea government (MEST) (No. 2013-016979).

Conflicts of Interest

The authors declare no conflict of interest.

References

  1. Eichler, H.J.; Kuemmel, P.; Orlic, S.; Wappelt, A. High-density disk storage by multiplexed microholograms. IEEE J. Sel. Top. Quantum Electron. 1998, 4, 840–848. [Google Scholar] [CrossRef]
  2. Boden, E.P.; Chan, K.P.; Dylov, D.V.; Kim, E.M.; Lorraine, P.W.; McCloskey, P.J.; Misner, M.J.; Natarajan, A.; Ostroverkhov, V.; Pickett, J.E.; et al. Recent progress in micro-holographic storage. In Proceedings of NLO & ISOM/ODS 2011 The Optical Society (OSA), Kauai, HI, USA, 17–22 July 2011.
  3. Ostroverkhov, V.; Lawrence, B.L.; Shi, X.; Boden, E.P.; Erben, C. Micro-holographic storage and threshold holographic recording materials. Jpn. J. Appl. Phys. 2009, 48, 03A035. [Google Scholar]
  4. Mikami, H.; Osawa, K.; Tatsu, E.; Watanabe, K. Experimental demonstration of optical phase multilevel recording in microhologram. Jpn. J. Appl. Phys. 2012, 51, 08JD01. [Google Scholar] [CrossRef]
  5. Jallapuram, R.; Naydenova, I.; Martin, S.; Howard, R.; Toal, V.; Frohmann, S.; Orlic, S.; Eichler, H.J. Acrylamide-based photopolymer for microholographic data storage. Opt. Mater. 2006, 28, 1329–1333. [Google Scholar] [CrossRef]
  6. Mikami, H.; Osawa, K.; Watanabe, K. Optical phase multi-level recording in microhologram. Proc. SPIE 2010, 7730. [Google Scholar] [CrossRef]
  7. Orlic, S.; Ulm, S.; Eichler, H.J. 3D bit-oriented optical storage in photopolymers. J. Opt. A. 2001, 3, 72–81. [Google Scholar] [CrossRef]
  8. McLeod, R.R.; Daiber, A.J.; McDonald, M.E.; Robertson, T.L.; Slagle, T.; Sochava, S.L.; Hesselink, L. Microholographic multilayer optical disk data storage. Appl. Opt. 2005, 44, 3197–3207. [Google Scholar] [CrossRef]
  9. Wang, H.; Yuan, G.; Tan, W.; Shi, L.; Chong, T. Spot size and depth of focus in optical data storage systems. Opt. Eng. 2007, 46, 065201. [Google Scholar] [CrossRef]
  10. Wei, X.; Wachters, A.J.H.; Urbach, H.P. Finite-element model for three-dimensional optical scattering problems. J. Opt. Soc. Am. A 2007, 24, 866–881. [Google Scholar]
  11. Kelly, J.V.; Gleeson, M.R.; Close, C.E.; O’Neill, F.T.; Sheridan, J.T. Temporal analysis of grating formation in photopolymer using the nonlocal polymerization-driven diffusion model. Opt. Express 2005, 13, 6990–7004. [Google Scholar] [CrossRef]
  12. Van de Nes, A.S.; Braat, J.J.M.; Pereira, S.F. High-density optical data storage. Rep. Prog. Phys. 2006, 69, 2323–2363. [Google Scholar] [CrossRef]
  13. Flagello, D.G.; Milster, T.; Rosenbluth, A.E. Theory of high-NA imaging in homogeneous thin films. J. Opt. Soc. Am. A 1996, 13, 53–64. [Google Scholar] [CrossRef]
  14. Van Haver, S.; Braat, J.J.M.; Dirksen, P.; Janssen, A.J.E.M. High-NA aberration retrieval with the extended Nijboer-Zernike vector diffraction theory. J. Eur. Opt. Soc. 2006, 1, 06004. [Google Scholar] [CrossRef]
  15. Van Haver, S.; Braat, J.J.M.; Dirksen, P.; Janssen, A.J.E.M. High-NA aberration retrieval with the Extended Nijboer-Zernike vector diffraction theory: Erratum. J. Eur. Opt. Soc. 2007, 2, 07011e. [Google Scholar] [CrossRef]
  16. Stallinga, S. Compact description of substrate-related aberrations in high numerical-aperture optical disk readout. Appl. Opt. 2005, 44, 849–858. [Google Scholar] [CrossRef]

