Review

Intra- and Interlayer Electron-Phonon Interactions in 12/12C and 12/13C BiLayer Graphene

by
Daniela L. Mafra
1 and
Paulo T. Araujo
2,*
1
Department of Electrical Engineering and Computer Sciences, Massachusetts Institute of Technology, Cambridge, MA 02139-4307, USA
2
Department of Physics and Astronomy, The University of Alabama, Tuscaloosa, AL 35487, USA
*
Author to whom correspondence should be addressed.
Appl. Sci. 2014, 4(2), 207-239; https://doi.org/10.3390/app4020207
Submission received: 12 March 2014 / Revised: 8 April 2014 / Accepted: 8 April 2014 / Published: 29 April 2014
(This article belongs to the Special Issue Towards Applications of Graphene)

Abstract

:
This review focuses on intra- and interlayer (IL) electron-phonon interactions and phonon self-energy renormalizations in twisted and AB-stacked bilayer graphene (2LG) composed either only of 12C or a mixing of 12C and 13C isotopes. A simple way to imagine a 2LG is by placing one monolayer graphene (1LG) on top of another 1LG. The orientation of one of the layers with relation to the other may originate a twisted 2LG system (known as turbostratic) as well as a AB-stacked system, also known as Bernal stacking. By rotating the layers of a 2LG one can departure from a fully misoriented system to achieve the AB-stacked configuration and their IL interactions can be dramatically different being close to zero in a fully misoriented system and maximum in an AB-stacked system. Interlayer interactions are expected to slightly perturb the intralayer phonons and they also govern the low-energy electronic and vibrational properties, which are of primary importance to phenomena such as transport, infrared (IR) optics and telecommunication bands in the IR range. Therefore, a comprehensive discussion combining intra- and interlayer phenomena is necessary and addressed throughout the text.

1. Introduction

Why do electron-phonon (e-ph) interactions matter? This question is undoubtedly the start-point to understand many fundamental phenomena in solids. Usually, the states of matter are principally studied in terms of electronic degrees of freedom in materials. However, the coupling of the electronic degrees of freedom to lattice degrees of freedom is crucial to understanding materials properties. This coupling is usually described by interactions between the electronic excitations and phonons, and is responsible for many interesting effects in a crystal, such as the formation of polarons, formation of Cooper pairs and the superconductivity, the Peierls transition and the Kohn anomaly, an abrupt softening of phonon energies [1].
Electron-phonon interactions can be observed in a diversity of materials. This review focuses on the study of intra- and interlayer e-ph interactions, as well as their consequences, in bilayer graphene (2LG) systems, which have been shown as ideal platforms to observe, for example, the Kohn anomaly effect mentioned above [1]. Graphene is a special material due to its fascinating electrical, mechanical, optical and thermal properties [25]. This strictly two-dimensional material exhibits exceptionally high crystal and electronic quality, in which charge carriers can travel thousands of interatomic distances without scattering [5,6], and has revealed a great deal of new physics and potential technological applications. Particular interest has been turned to single layer graphene (1LG) due to the unique nature of its charge carriers, that make it a promisor material for photonics, optoelectronics and organic electronics such as in solar cells, light-emitting, touch screen and photodetctors devices [2,7,8]. Here, the authors will discuss mostly 2LG, which is also a zero gap semiconductor and it is a highly desired material for the development of graphene-based electronics such as field effect transistor [5,6], since it becomes a tunable band gap semiconductor under the application of an electric field perpendicular to the layers composing system [9,10]. Recently, advances in chemical vapor deposition (CVD) allowed the realization of twisted and AB-stacked 2LG in which top and bottom layers are compose solely of either 13C or 12C. This opens up a completely new route to combine phonons and electrons in this layered systems. Because 13C and 12C are isotopes, these hybrid bilayer systems keep the same electronic behavior observed for 12/12C 2LG although the phonons can behave quite differently [11].
The 2LG systems are bound together by means of weak interlayer (IL) interactions mediated by van-der-Waals (vdW) forces. These IL interactions are sensitive to the number of layers and stacking order and are important to technological applications of these systems [1218]. Namely, the IL interactions govern the low-energy electronic and vibrational properties, which are of primary importance to phenomena such as transport, infrared optics and telecommunication bands in the infrared (IR) range [1214]. In 2LG, although the effects of the IL interactions on the electronic properties are well understood [19,20], it was only recently that the understanding of IL-related vibrational properties, electron-electron (e-e), phonon-phonon (ph-ph), and electron-phonon (e-ph) interactions started being developed [2125]. Such development has already impact this research field, by opening a route to understanding IL interactions in similar, but more complex 2D-layered materials, such as MoS2, WSe2, oxides and hydroxides [2629].
In this manuscript, the use of gate-modulated Raman spectroscopy to characterize 2LG and to have information about their IL interactions is discussed. Traditionally, e-ph interactions are investigated through chemical doping, in which the charge carrier density is varied by the introduction of impurities [30]. However, the appliance of electrical fields to control carriers in materials (so-called the electrical field effect) is an alternative method for effectively changing the charge carrier density in low dimensional systems. Here, it is discussed the combination of both, the electric field effect and Raman spectroscopy to study the e-ph coupling in graphene-like systems. In Section 2 we describe how the electronic and vibrational properties of graphene are influenced by IL interactions; in Section 3 we present the theoretical formalism for e-ph coupling; Section 4 describes how the inversion symmetry affects the electronic and vibrational structure of graphene; in Section 5 we discuss relevant experimental results.

2. Interlayer Interactions

In condensed matter physics, most materials are ruled by the Schrödinger equation, this usually being sufficient to describe their electronic properties. Single layer graphene (1LG) is an exception and its charge carriers mimic relativistic particles and are more easily and naturally described by the Dirac equation [31]. The electronic structure of 1LG has a linear dispersion around the K point of the Brillouin zone and it is a zero gap semiconductor (see Figure 1).
The atomic orbitals in graphene are in a sp2 hybridization, in which the carbon atoms are bounded covalently to each other forming a 120° angle. There are three in-plane σ orbitals and one out-of-plane π orbital. The electronic structure of 1LG can be described by tight-binding calculations considering in-plane interactions with just first neighbors (γ0) [32]. 1LG is a zero gap semiconductor, where the valence π and conduction π* bands touch each other at the K point, and this is where the Fermi level is located. Close to the K point of the Brillouin zone, the electronic dispersion of 1LG can be described as a linear dispersion with massless Dirac fermions and is given by [32]:
E ( k ) = v F k
where v F = 3 γ 0 a / 2 is the Fermi velocity of the electrons near the Dirac point and is close to 1 × 10⁶ m/s, and γ0 = 3.0 eV [5].
Since 1LG has two carbon atoms per unit cell, its vibrational structure is composed of six phonon branches, three of them optical (one in-plane longitudinal mode-LO, one in-plane transverse mode-TO and one out-of-plane transverse mode-ZO) and three of them acoustic (one in-plane longitudinal mode-LA, one-in plane transverse mode-TA and one out-of-plane transverse mode-ZA). The LO and TO modes are degenerated at the Γ point and give rise to the famous G band and the TO mode at the K point gives rise to the G′ band. Figure 2a shows the phonon dispersion for 1LG [33,34] and Figure 3 shows the Raman spectra for both (a) 12C and (b) 13C 1LG.

2.1. AB Stacked Bilayer Graphene

Since the unit cell of Bernal AB stacked 2LG is the same as that of graphite (four atoms per unit cell), we can model the 2LG electronic structure using the tight-binding model for graphite [35] by adapting the Slonczewski-Weiss-McClure (SWM) parametrization [36,37], using γ0 and the interlayer (IL) nearest-neighbor hopping parameters, γ1, γ3 and γ4 (shown in Figure 4c). After solving the 4 × 4 tight-binding Hamiltonian [38], we find that the electronic structure of 2LG has two valence bands (π1 and π2) and two conduction bands π1* and π2*, as can be seen in Figure 4a. One valence band touch one conduction band at the K point and the other two bands have a gap of 2γ1. 2LG is also a zero gap semiconductor but the electronic dispersion is no longer linear around the K point, but it has a hyperbolic dependence with k [38]. The IL interaction in 2LG with regular AB stacking modifies the linear dispersion of 1LG into the quadratic dispersion, where an electron behaves now as a massive particle [39].
The γ3 and γ4 IL parameters have interesting consequences in the electronic structure. γ3 gives rise to a trigonal warping effect in the low energy spectrum, where the equienergies curves have triangular shape, while γ4 is related to the electron-hole asymmetry in 2LG [38]. Figure 4a,b show, respectively, the 2LG band structure near to the K point with γ3 and γ4 equal to zero and with γ3 = 0.3 eV and γ4 = 0.15 eV.
Regarding the vibrational structure, the micro-mechanical cleavage of bulk graphite (so-called Scotch-tape method) gives 2LG graphene samples with mostly 12/12C AB-stacked structures and the strongest IL interactions. For this reason, the 2LG system obtained from exfoliation is, so far, the best system to provide the fundamental physics behind the IL related phonon self-energy renormalizations. Another commonly used method is the chemical vapor deposition (CVD), and has been proven to grow 2LG in which top and bottom layers are compose solely of either 13C or 12C resulting in a hybrid 12/13C 2LG. The method also grows 2LG in which both layers are composed of 12C, namely 12/12C 2LG [11,41,42]. Through the CVD method, in general, the 2LG systems result in twisted layers (see Figure 3c,e for the twisted t-2LG Raman spectra). Recently, however, selected area electron diffraction (SAED) and Raman scattering have been used to show that the resultant 2LG systems grown by CVD methods can also be 12/12C and 12/13C AB-2LG [11,41,42]. Figure 3d,f show the Raman spectra for the AB-2LG systems. Indeed, the Raman G′(2D)/G intensity ratio (1) for the CVD grown 12/12C AB-2LG system agrees well with the Scotch-tape sample and also the G′-band linewidth (60 cm−1) is similar. In fact, the lineshape for the G′ band can be interpreted in terms of four peaks whose frequencies (ranging from 2640 to 2715 cm1) and linewidths (30 cm1) are basically the same as the ones found for the Scotch-tape sample. However, the G′ lineshape, which is determined by the Raman cross-sections of each of the four peaks, is slightly different mainly because the little shoulder around 2645 cm1 observed for the Scotch-tape samples [43] is not evident in the CVD grown samples. This suggests that the IL interactions from AB-stacked CVD samples might be different from that in AB-stacked scotch-tape samples.
The Raman spectrum in Figure 3e for twisted 12/13C t-2LG can be seen as a superposition of two non-interacting 1LG systems, one made of 12C and another made of 13C. The relation between the frequencies coming from the 12C and from the 13C is given by: ω ( 13 C ) = 12 / 13 ω ( 12 C ) and this explains why two peaks are seen in the G-band and for the G′ band regions. Note that the lower peaks correspond to vibrations coming from the 13C 1LG. For the 12/13C AB-2LG system, we will still observe two G band features, which are now a symmetric and antisymmetric combination between the LO and TO phonon modes from the top and bottom layers (a more detailed explanation is given later in the text). However, for the G′ band the situation is slightly different. Due to the differences in the 12C and 13C masses, the TO modes from the top and bottom layers are no longer unique at the K point. However, similar to what happens for the 12/12C AB-2LG system, the electronic dispersion is still a hyperbolic dispersion with two different sub-bands-π1 and π2-(around the K point, as shown in Figure 4), since in this isotopic system, opposite to what happens to the vibrational properties, the electronic properties are maintained. Therefore, instead of four resonances with the TO mode, we could observe up to eight different resonances (note that in the 12/13C AB-2LG systems the inversion symmetry is maintained for electrons but broken for phonons).
Note that the IL interactions are quite similar for both production methods but not exactly the same and further studies are clearly needed to explain these small differences in detail. Finally, Figure 2b shows the phonon dispersion for a 12/12C AB-stacked 2LG. Since the unit cell of a 2LG contains 4 atoms, we expect to observe 12 phonon branches (3 acoustic phonons and 9 optical phonons). The major difference in comparison to the 1LG dispersion is the appearance of a layer breathing mode (LBM) (ZO′ mode in Figure 2b) in which the layers in the 2LG system vibrates up and down out of phase [33,34]. A calculation for the phonon dispersion in 12/13C AB-2LG systems is still elusive.

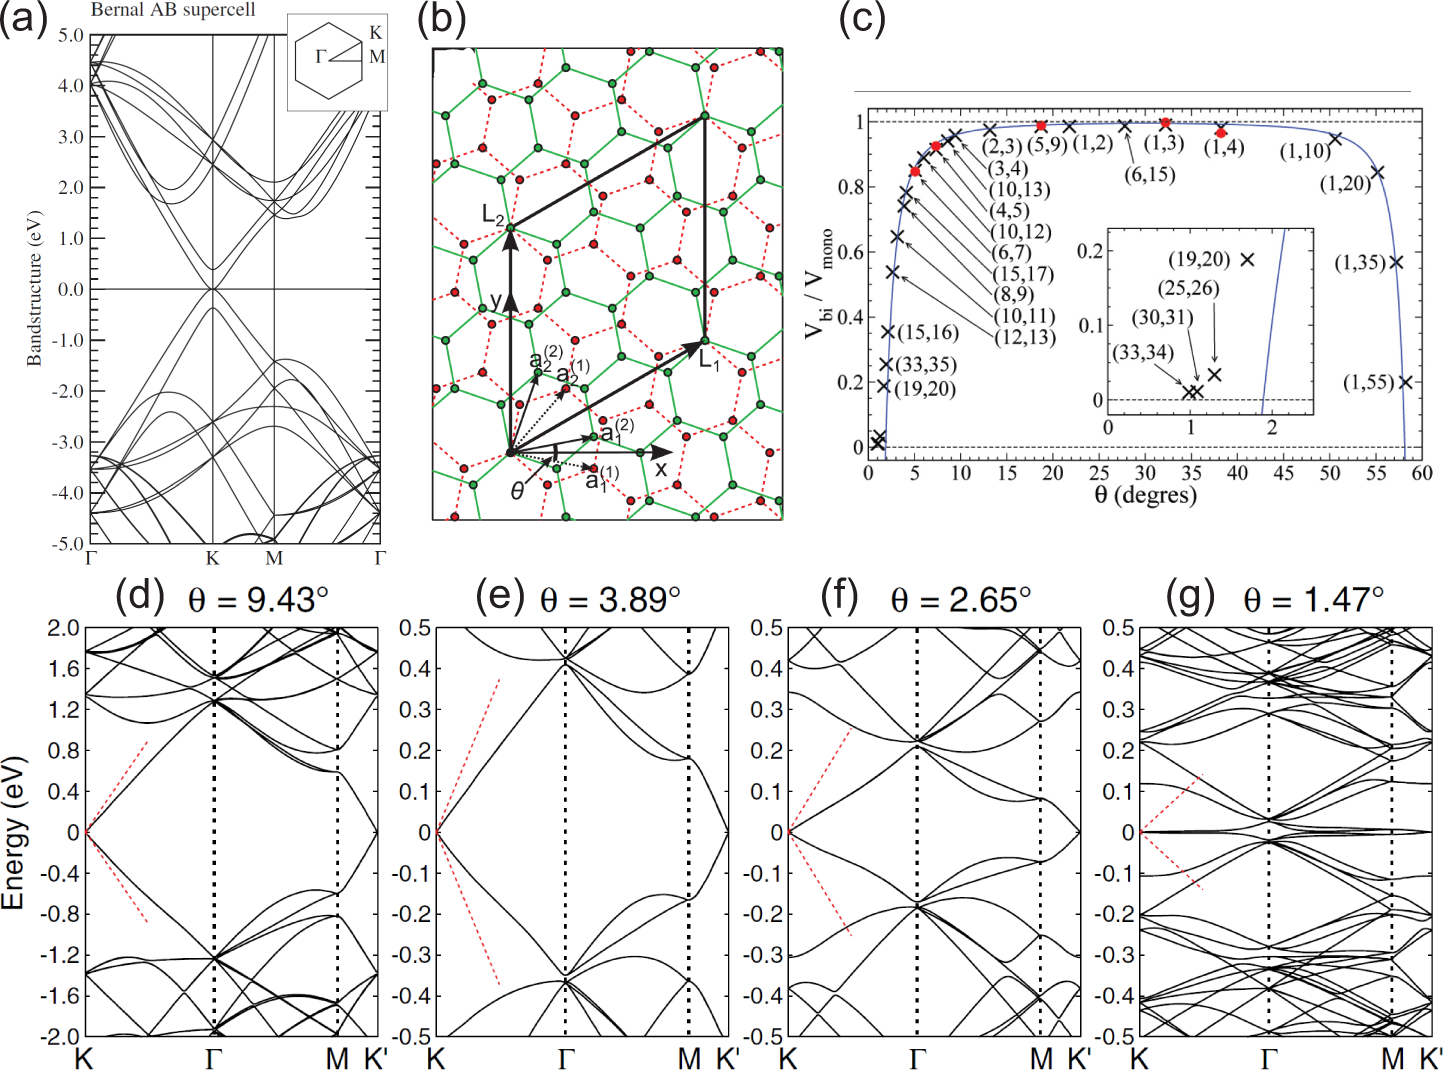
2.2. Twisted Systems

The misorientation of a few stacked graphene layers can affect the electronic structure of the carbon system. The rotation between the graphene layers has been receiving a lot of attention recently [4450]. This has been stimulated by the observation of Hass et al. [47] that graphene grown epitaxially on SiC ( 000 1 ¯ ) contains a high density of twist boundary faults, i.e., layers with a relative rotation. The same authors [47] demonstrated that 2LG structure with the relative rotation frequently observed in experiment (θ = 30° ± 2.20°) manifests an apparent electronic decoupling. Namely, ab initio calculations showed that both layers displayed the Dirac cone and Fermi velocity characteristic of 1LG [47]. This remarkable result has inspired a number of subsequent theoretical and experimental works [44,48,49]. In Reference [44], bilayer and trilayer twist boundary systems were investigated by ab initio calculations, and in both cases layers with a relative rotation were found to display apparent 1LG behavior. On the other hand, Reference [48] considered the θ → 0 limit of the rotated 2LG in a continuum approximation, with the result that the layers exactly decoupled but with the Fermi velocity of the Dirac cone suppressed as compared to 1LG. This latter result is in contrast to ab initio calculations [44,48] for finite rotation angles where a Fermi velocity exactly equal to that of 1LG is found [50].
In a twisted (or turbostratic) bilayer graphene (t-2LG) two layers are stacked with a random rotation angle (see Figure 5b). When stacking these two supercells, we obtain a bilayer structure with short-range incommensurability, then the unit-cell area of t-2LG can be more than 1000 times as large as that of 1LG, due to slightly misoriented lattice vectors of two layers. The electronic structure of t-2LG shows a linear band dispersion near Dirac points [44,48,50,52] rather than the massive dispersion of AB-2LG, and this is due to the relatively weak IL interaction. In t-2LG the superposition of the two honeycomb lattices generates a Moiré pattern with longer period. The two Dirac electron gases are then coupled by a periodic interaction, with a large supercell, which can restore a Dirac linear dispersion, but with a Fermi velocity substantially reduced with respect to 1LG (see Figure 5c). In Figure 5d–g, we show examples of band structures of t-2LG with rotation angles of 9.43°, 3.89°, 2.65° and 1.47°, respectively [51]. Dashed (red) slopes around the K point indicate the monolayer’s band dispersion. Note that the scale of wave number (horizontal axis) reduces as the rotation angle decreases. Dirac point energy is set to zero [51]. It is important to note that the changes in the electronic dispersion due to different twisting angles are expected to be maintained to 12/13C t-2LG systems. However, similar calculations to those for 12/12C t-2LG, which are necessary to confirm the expectations, are still elusive.
Recently, it was explained and experimentally demonstrated that for small rotation angles (θ around 13° or less) the electronic overlap (coupling) of the Dirac cones from the twisted layers give rise to van Hove singularities (vHs) in the electronic dispersion of the twisted system [5356]. It was shown that the vHs play an important role to changing, for example, the resonance conditions of Raman spectral features such as the G band and G′ band [53,56]. Also, in twisted 2LG there is a static potential dependent on the superlattice periodicity which is responsible for scattering electrons and, therefore, for the rise of new Raman features in the twisted 2LG spectrum. Theses features, which appear at low frequencies (ranging from 30 cm−1 to 200 cm−1) and high frequencies (ranging from 1300 cm−1 to 1700 cm−1), have their frequencies dependent on the twisting angle and, therefore, may work as a convenient avenue to predicting those angles [57,58].

3. Electron-Phonon Interactions: Theoretical Background

We think of a metal as composed of a lattice of positively charged ions embedded in a sea of nearly free conduction electrons. We must suppose that in a vibrational wave in a metal, the local variations in charge density, due to the motion of the positively charged ions, are screened by the motion of the conduction electrons (see Figure 6). This influx of negative charge reduces the restoring force on the ions, and so the frequency of the oscillation is drastically reduced [1]. The residual electric field that was not screened by the electron gas acts on the electrons and that gives rise to the electron-phonon (e-ph) interaction. In this section we shall consider some of the consequences of the interaction of phonons with electrons.

3.1. The Fröhlich Hamiltonian

This model takes for granted the concept of screening and it assumes that the ions interact with each other and with the electrons only through a short-range screened potential (dashed line in Figure 6) and it treats the electrons themselves as independent fermions. Also it neglects electron-electron interactions. For a Bravais lattice the unperturbed Hamiltonian, where the electrons and phonons are treated separately, is [1]:
H 0 = k ε k c k c k + q , s ω q , s a q , s a q , s
where c k ( c k ) is the creation (annihilation) operator for the electrons with energy εk and momentum k, and a q ( a q ) is the creation (annihilation) operator for the phonons with energy ħωq, momentum q and direction of polarization s. If it happens that s is parallel to q, we say that it is a longitudinally polarized phonon in the crystal. If s·q = 0, the phonon is transversely polarized. To the unperturbed Hamiltonian, we add the interaction H1 of the electrons with the screened ions:
H 1 = k , k , l k | V ( r l y l ) | k c k c k
where |k⟩ and |k′⟩ are the initial and final electronic state, respectively. Here, it is assumed that at any point the potential V (r l yl) due to a particular ion depends only on the distance from the center of the ion, where yl is the ion displacement from the equilibrium position l. We can use the Fourier transform of the potencial, and Equation (3) can be written as:
H 1 = k , k , l e i ( k k ) ( l + y l ) V k k c k c k
If we assume that the displacement yl of the ion is sufficiently small that (k′ k) · yl ≪ 1, we can separate H1 into two parts, H1 = HBloch + Heph. The first term
H Bloch = k , k , l e i ( k k ) l V k k c k c k
is independent of the lattice displacements. The second term can be written as:
H e ph = i N 1 / 2 k , k ( k k ) y q V k k c k c k
where q = k k′. The displacement yq can be written in the harmonic approximation as a function of the phonon creation and annihilation operators [1] and the Heph then becomes:
H e ph = i k , k , s N 2 M ω k k , s ( k k ) s V k k ( a k k , s + a k k , s ) c k c k
For simplicity we shall assume the phonon spectrum to be isotropic, so that the phonons will be either longitudinally or transversely polarized. Then, only the longitudinal modes, for which s is parallel to k′ k, will enter Heph. Also, since the HBloch is not dependent of the displacement, we shall neglect its effects for the e-ph interaction. With these simplifications we are left with the Fröhlich Hamiltonian:
H = k ε k c k c k + q ω q a q a q + k , k M k , k ( a q + a q ) c k c k
where the electron-phonon matrix element is defined by:
M k , k = i N 2 M ω q | k k | V k k
The interaction Heph can be considered as being composed of two parts - terms involving a q c k c k and terms involving a q c k c k . These terms may be represented by the diagrams shown in Figure 7a,b, respectively. In the first diagram an electron is scattered from k′ to k with the emission of a phonon with momentum (k′ k). The second diagram represents the electron being scattered from k′ to k with the absorption of a phonon with momentum (k k′).

3.2. Phonon Frequencies and the Kohn Anomaly

To calculate the effect of the e-ph interaction on the phonon spectrum, we may use perturbation theory to calculate the total energy ε of the system described by the Fröhlich Hamiltonian (Equation (8)) to second order in Heph:
ε = ε 0 + Φ | H e l p h | Φ + Φ | H e l p h ( ε 0 H 0 ) 1 H e l p h | Φ
with ε 0 = ε k c k c k + ω q 0 a q a q being the unperturbed energy of the state Φ having nq phonons in the longitudinally polarized mode q and nk electrons in state k. Since the components of Heph act on Φ either to destroy or create one phonon, the first-order term vanishes from this expression because the resulting wavefunction must be orthogonal to Φ. In second order there is a set of nonvanishing terms, as the phonon destroyed by the first factor of Heph to act on Φ can be replaced by the second factor of Heph, and vice versa. We then find the contribution of the second-order terms ε2 to be
ε 2 = Φ | k , k | M k , k | 2 [ ( a q a q ) c k c k c k c k ( ε 0 H 0 ) + ( a q a q ) c k c k c k c k ( ε 0 H 0 ) ] | Φ
all other terms having zero matrix element since the resulting wavefunction will be orthogonal to Φ. The first term in the brackets in Equation (11) can be represented as in Figure 8a. An electron is first scattered from k to k′ with the absorption of a phonon with momentum q = k′k. The factor (ε0H0)−1 measures the amount of time the electron is allowed by the Uncertainty Principle to stay in the intermediate state k′ and can be written as the energy difference between the initial and intermediate states, ( ε k + ω q 0 ε k ) 1. The electron is then scattered back into its original state with the re-emission of the phonon. We can represent the second term in Equation (11) by Figure 8b, and then, we find an energy denominator of ε k ω q 0 ε k .
We can write the creation and annihilation operators in terms of occupation numbers (nk or nq). For fermions (electrons) we have:
c k c k = n k
c k c k = 1 n k
and for bosons (phonons):
a q a q = n q
a q a q = 1 + n q
Rearranging the creation and annihilation operators in Equation (11) into the form of number operators and assuming that ωq = ωq, and hence that in equilibrium ⟨nq⟩ = ⟨nq⟩, and ⟨nqnknk′⟩ = 0 by symmetry, the total energy of the system is then given by:
ε = ω q 0 n q + k , k | M k , k | 2 n k [ 2 n q ( ε k ε k ) ( ε k ε k ) 2 ( ω q 0 ) 2 + 1 n k ( ε k ε k ω q 0 ) ]
The effect of the e-ph interaction on the phonon spectrum is contained in the term proportional to ⟨nq⟩ in Equation (16). Now the perturbed phonon energy ω q p is the energy required to increase ⟨nq⟩ by unit
ω q p = ε n q = ω q 0 + k | M k , k | 2 2 n k ( ε k ε k ) ( ε k ε k ) 2 ( ω q 0 ) 2
If we neglect the phonon energy in the denominator in comparison with the electron energies we have
ω q p = ω q 0 k 2 | M k , k | 2 n k ( ε k ε k ) 1
One may picture the origin of this change in phonon frequency by Figure 8a, in which the first interaction is represented as the creation of an electron-hole (e-h) pair by the absorption of a phonon. One can then say that it is the fact that the phonon spends part of its lifetime (in the order of picoseconds) in the form of an e-h pair that modifies its energy.
One interesting consequence of Equation (18) occurs in metals when q has a value close to the diameter of the Fermi surface 2kF. In this case, the states k and k′ =k q are connected by q in the same Fermi surface, which causes a logarithmic divergence in Equation (18), and thus a kink in the phonon dispersion is observed. This divergence when q = 2kF is the so-called Kohn anomaly [1].
For graphene, the Fermi surface is formed by the six K points. There are two possible phonon wavevectors that can connect two electronic states at the Fermi surface, q = Γ and for q = K, as shown in Figure 9a,b, respectively. In fact, Piscanec et al. [59] show that the Kohn anomaly occurs in graphene for the LO phonon mode around the Γ of the Brillouin zone and for the iTO phonon mode around the K point. The Kohn anomaly gives rise to interesting effects in the Raman spectrum of 1LG and 2LG and can be studied by changing the Fermi level of the system.

3.3. Consequences of the Kohn Anomaly in Graphene

Hereafter, this review discusses phonons in 2LG that occur either, around the Γ point or around the K point. As a reminder, there are two types of e-ph interactions, namely intra-valley (AV) (Figure 10a,c) and inter-valley (EV) (Figure 10b,d) processes [6064]. For an AV process, the initial and final states both occur within the region close to a K [K′] point, while for inter-valley processes, K is connected to K′ in a different valley by a q ≠ 0 phonon. Thus the AV (EV) process corresponds to Γ (K) point phonons. The phonon wavevector q for AV (EV) processes are measured from the Γ (K) points with both q = 0 and q ≠ 0 possible [6064].
The phonon self-energy renormalization will happen any time the matrix element Mk,k′ is different of zero. Gate-modulated Raman and electrochemistry Raman are the most used techniques to observe such renormalization effects. In gate-modulated Raman, the 2LG flake is deposited over a silicon (Si) substrate with a 300 nm thick layer of SiO2. Next, lithography followed by liftoff is required to place contacts on the flake so that gate voltages (Vg) can be applied to the device in a backgate configuration, as illustrated in Figure 11a. Then, for each Vg value, Raman spectrum is taken and analyzed using Lorentzian line-shapes from which frequencies and decay widths are extracted [6064]. Note that resonance Raman spectroscopy provides information about both the electronic and vibrational structures, while the Vg variation allows for control of the Fermi level energy (EF) of the 2LG. In electrochemistry Raman, the device preparation is done in the very same way as described above. However, instead of applying Vg in a backgate configuration, an electrochemical polymer is utilized to topgating the devices. Then, instead of varying Vg, the electrode potential is varied (see Figure 11b). Likewise Vg, the electrode potential also allows for control of EF.
Starting with the case q = 0, the insets of Figure 10e,f, give the results illustrated for the renormalization of the phonon frequencies (ωq) and linewidth (γq), respectively. From these insets, we observe that when 2|EF| < ħωq, real e-h pairs can be created (annihilated), which leads to a stronger electron-ion interaction screening. As a consequence, the phonon mode softens [6066]. However, when 2|EF| ħωq the production of real e-h pairs becomes forbidden due to the Pauli principle. This leads to a phonon mode hardening where the phonons are not damped any more (they are now long lived) [6066]. If 2|EF| = ħωq, the phonon mode softening shows its highest values, which represent two singularities, as shown by the black solid curve in the inset of Figure 10e. Due to a broadening (comparable to the phonon energy) in |EF| due to thermal excitations (relaxations) and non-uniformity in the density of carriers (due to foreign chemical species and charge traps in the substrate), these singularities are usually observed at low temperatures (77 K or less) [65,66]. As an example of phonon renormalization when q = 0 for the AV process (see Figure 10a), the ωG and γG variations of the G band Raman feature are shown in Figure 10e,f, respectively, as |EF| is varied due to different Vg values. The experimental results (Figure 10e,f) are in good agreement with theory [6066], which shows a ωG hardening and γG narrowing when Vg increases.
For the q ≠ 0 AV/EV processes, in contrast to the observed for the G band (q = 0), by observing Figure 10g, which brings the G′ band as an example, it is seen that ωq is softened, and that the ωq softening is accompanied by a broadening of γq with increasing |EF| (increasing |Vg|). Now, instead of the Pauli exclusion principle, the electronic and vibrational density of states (together with energy and momentum conservation requirements) are determining if the e-h pair creation (annihilation) due to a q ≠ 0 phonon absorption (emission) will happen or not. In a previous work [60], the authors explained that the behavior observed is common to Raman modes that come from an AV or EV process with q ≠ 0 and is opposite to the behavior observed for the Γ point q = 0 phonons, such as for ωG. Namely, for the q ≠ 0 cases, when the Fermi level is around zero (see top diagrams in Figure 10b–d), either no e-h pair can be created by the absorption of a phonon (for an AV process) or the probability of an e-h pair creation is very small (for an AV process) because the density of states vanishes at the Dirac point. However, when |EF| increases, the renormalization of the phonon energy occurs by the creation of an e-h pair through the absorption of a phonon (bottom diagrams in Figure 10b through Figure 10d), then a softening of ωq and a broadening of γq are observed, in contrast to what happens for q = 0 phonons. The inset in Figure 10g brings an illustrative prediction for the q ≠ 0 phonon renormalization case.

4. Inversion Symmetry in 2LG Systems

One major intriguing feature of 2LG is a band structure that can be tuned with external fields, such as electric or magnetic fields. Ohta et al. [67] used angle resolved photoemission to show that 2LG has a gap that can be tuned from 0 to up to 200 meV. Fundamentally, the gap opening in bilayer graphene originates from the breaking of inversion symmetry, that can be achieved, for example, by applying an electric field perpendicular to the layers. This creates an asymmetry between the two layers that lowers the whole symmetry of the bilayer system, consequently opening an electronic band gap at the K point.
For 12/12C AB-2LG, at q = 0 the E2g phonon mode (G band) of monolayer graphene splits into two double degenerated modes, associated with the in-phase (Eg) and out-of-phase (Eu) displacements of the atoms in the two layers [68]. The Eu mode is not Raman active, but, as in 1LG, the Eg mode can be seen as one peak in the Raman spectrum, known as G band at 1582 cm1. Moreover, since there are two valence (π1 and π2) and two conduction (π1* and π2*) bands in this material, phonons can couple with e-h pairs produced by interband or intraband transitions. Interbands transitions are those were the hole is in the valence band and the electron in the conduction band. The intraband transitions occur when both the electron and the hole are in the conduction or in the valence band.
T. Ando [69] calculated the dependence of the self-energy for the in-phase (IP) and for the out-of-phase (OP) phonons as a function of Fermi energy. The phonon renormalization effect in 2LG is understood by considering the selection rules for the interaction of the IP and OP phonon modes with the interband or intraband e-h pairs. The e-ph interaction can be described by a 2 × 2 matrix for each phonon symmetry given by [69]:
Φ j j E g ( k ) = 1 2 ( sin 2 ψ cos 2 ψ cos 2 ψ sin 2 ψ ) , Φ j j E u ( k ) = 1 2 ( 0 1 1 0 )
where each matrix element gives the contribution of e-h pairs involving different electronic sub-bands πj or πj*. The diagonal terms are responsible for the interband e-ph coupling, while the out-of-diagonal terms give the intraband coupling.
For the IP lattice vibration, all matrix elements are different from zero, and this phonon can interact with both interband or intraband e-h pairs (see Figure 12). When EF = 0, there is a couple of the phonon with the interband e-h pair, giving rise to the phonon energy renormalization. However, for the OP phonon mode, the diagonal terms of the matrix are null, showing that there is no e-ph interactions for interband transitions. Therefore, no Kohn anomaly is expected for the antisymmetric phonon mode when the Fermi level is at the K point. The frequency of the out-of-phase vibration is, then, higher then the frequency of the in-phase vibration for EF = 0.
If the Fermi energy is now moved away from the K point, the intraband e-h pairs can be produced by phonons (see Figure 12). In this case, the OP phonons also have their energies renormalized, giving rise to the Kohn anomaly and lowering the frequency of the phonons. Figure 13a,b show, respectively, the frequency shift (solid lines) and the line width broadening (dashed lines) of the IP and OP phonon modes as a function of the Fermi energy calculated by T. Ando [69]. The δ parameter is due to disorder in the crystal. The frequency of the IP mode undergoes a hardening with increasing EF and exhibit a logarithmic singularity at EF = ħω/2, while a narrowing of the line width is observed. The renormalization for this phonon mode is analogous to the case of 1LG [30]. For the OP phonons, with the increase of EF, the intraband transitions contributes now to the phonon self-energy, and the frequency of this mode gradually decreases, and a small broadening of the line width can be observed.
Special care must be taken when analyzing the results for 2LG e-ph coupling. The results showed in Figure 13a,b are valid only if you change the Fermi level position but keep the inversion symmetry between the two layers. When there is an asymmetry between the two layers (for example, an electric field perpendicular to the layers induced by the application of an external gate voltage), the inversion symmetry of bilayer graphene is broken, lowering the symmetry of the system, that now belongs to the C3v point group [70], and opening an electronic band gap at the K point. As a consequence, the in-phase and the out-of-phase lattice vibrations are no longer eigenstates os the system, but the resulting eigenstates can be regarded as superpositions of the IP and OP displacements [71,72]. Since the Raman active mode (in-phase) is now present in both resulting modes, there will be two peaks in the Raman spectrum: one with lower frequency G and another with higher frequency G+.
The Raman spectrum can be quantitatively analyzed using a simple coupled-mode description [72]
| E E IP g g E E OP | = 0
where EIP = ħωIP − iγIP, EOP = ħωOPOP (γ is the line width), and g is the coupling between the IP-OP modes. Solutions to Equation (20) are given by [72]
E ± = E IP + E OP 2 ± ( E IP E OP 2 ) 2 + g 2
so that the real and imaginary parts of E±, respectively, describe the energy and broadening of the G+ and G modes. The behavior of the relative intensities, the width broadening and the frequency shift of the G+ and G peaks as a function of the charge concentration and Fermi energy is shown in Figure 14a–c, respectively [72]. The peak intensity is determined by the size of EIP content within each mode. At EF = ±200 meV, the two peaks in the Raman spectrum have the same intensity as shown in Figure 14a because the coupling partitions of the Raman active Eg mode is equally distributed to the G+ and G peaks. Away from EF = ±200 meV, the relative intensities of the G+ and G reverse, reflecting the fact that G (G+) is dominated by the IP vibration at low (high) charge concentration.
It is important to note that the 12/12C AB-2LG systems, without any electric field applied to them, have the inversion symmetry present naturally for both electrons and phonons. However, the 12/13C AB-2LG systems have the inversion symmetry only for electrons. Phonons do not have the inversion symmetry because the atoms in the top layer have different masses from those in the bottom layer. In other words, the unit cell in 12/13C AB-2LG systems do not have inversion symmetry for phonons and what we naturally see in the G band of such systems (see Figure 3f) are two peaks active in Raman resulting from the combination between the IP and OP phonons (G+ and G). Therefore, without any electric field, while the 12/12C AB-2LG system is fully describe by the D3d point group, the 12/13C AB-2LG must be described by direct product between the point groups C3v (describing phonon symmetries) and D3d (describing electron symmetries). Note that, if an electrical field perpendicular to the 12/13C AB-2LG is applied, the inversion symmetry is broken for electrons too and the system becomes equivalent to the 12/12C AB-2LG explained previously where the whole system belongs to the C3v point group.

5. Intra- and Inter-Layer Phonon Energy Renormalizations

5.1. Interlayer-Related Phonons in 2LG

One of the most important consequences of the interlayer (IL) interactions in 2LG is the rise of IL vibrational modes. C. H. Lui et al. [14] were pioneers to studying the out-of-plane optical (ZO′) phonon mode (with frequency ωzo′ = 90 cm1 predicted at the Γ-point, as shown in Figure 2b. The ZO′ mode is also known as the IL breathing mode-LBM. They also studied the combination mode LOZO′ predicted at the Γ-point showing that this combination occurs in the range for ωLOZO′ from 1600 to 1800 cm1 for multilayer graphene (MLG) with up to 6 layers [14]. The other IL-related combination modes present in 2LG are the LOZA combination mode (ZA is the IL out-of-plane acoustic mode whose frequency ωZA is zero at the Γ-point, as shown in Figure 2b) and the 2ZO overtone (ZO is the out-of-plane tangential optical mode with frequency ωZO = 885 cm1 predicted at the Γ-point, as shown in Figure 2b) demand a more detailed analysis, which is still elusive. All these features involve q ≠ 0 intravalley (AV) processes, therefore occurring around the Γ-point in the Brillouin zone. However, only the 2ZO overtone presents two possible forward (q ≈ 0) and backward (q ≈ 2k) scattering mechanisms [21]. Note that both the ZA and ZO modes are not Raman active at the Γ-point. In spite of recent advances in the study of these interlayer modes, their phonon self-energies and e-ph interactions for these IL-dependent modes have hardly been discussed. It is worth saying that, these modes ranging from 1600 to 1800 cm1 are spectroscopic signatures for 2LG and by understanding them in detail, we can understand the vdW-related phonon-dependent phenomena associated with these systems.
Figure 15f shows the phonon combination modes and overtones observed in 2LG in the spectral range 1600 to 1800 cm1. The insets give the phonon vibration symmetries for the LOZA (P1) and the two LOZO′ (P2) peaks (upper box in Figure 15f), and the two 2ZO (P3) peaks (lower box in Figure 15f). The LOZA mode comes from a q ≈ 2k intravalley phonon scattering process (q ≈ 2k AV) showing a frequency dispersion ∂ωLOZA/∂EL = 26.1 cm1/eV. By looking at the feature P2 in Figure 15f, we observe that the LOZO′ mode (q ≈ 2k AV process) splits into two peaks, LOZO′ (+) and LOZO′ (), whose frequency dispersions are ∂ωLOZO′(+)/∂EL = 55.1 cm1/eV and ∂ωLOZO′()/∂EL = 34.2 cm1/eV, respectively [63]. As schematized in Figure 15c, the two P2 peaks do not arise from the phonon dispersion but rather, they come from different resonant regimes of the LOZO′ combination mode with the two electronic valence bands (π1 and π2) and the two electronic conduction bands ( π 1 *and π 2 *) of 2LG. The LOZO′(+) comes from a resonance process involving the π1( π 1 *) bands, while the the LOZO′() comes from a resonance process involving the π2( π 2 *) bands. These resonance conditions (see Figure 15c) require the phonon momentum q for the LOZO′(+) mode to be larger than that for the LOZO′ () mode (qLOZO′ (+) > qLOZO′ ()). As a consequence the phonon energies are such that ħωLOZO′ (+) > ħωLOZO′(). For the two 2ZO features, Sato et al. [21] predicted through tight-binding calculations that, in 2LG systems, the 2ZO overtone should be observed for forward (q ≈ 0) and backward (q ≈ 2k) AV scattering, where the q ≈ 2k mode presents a negative frequency dispersion. Although some information for the 2ZO (q ≈ 0) mode was reported by C. H. Lui et al. [14], the existence of the 2ZO (q ≈ 2k) mode remained elusive. Here we report the 2ZO (q ≈ 2k) mode which was found to show a negative frequency dispersion ∂ω2ZO(q≈2k)/∂EL = 48.1 cm1/eV [63].
The IL interactions in 2LG rely on the interlayer hopping among equivalent and inequivalent carbon atoms and, therefore, will be directly related to the phonon self-energy and to the e-ph coupling regarding the ZO, ZO′ and ZA modes [3,40]. It is, however, important to note that the LO mode is dependent on the intralayer hopping between two inequivalent carbon atoms, and the LO mode remains essentially unchanged when changing the IL interactions [14,1925]. As depicted in the inset of Figure 15c, the LOZO′ combination mode relates to a q ≈ 2k AV process. Note that, Figure 15a,b show, respectively, the EF dependence of ωLOZO′(+) and ωLOZO′(−) when Vg is varied. Both, ωLOZO′(+) and ωLOZO′(−) soften with increasing |EF|. Correspondingly, as shown in the insets of Figure 15a,b, the phonon line widths γLOZO′(+) and γLOZO′() broaden with increasing |EF|. Analogously, Figure 16a shows that ωLOZA (γLOZA) softens (broadens) with increasing |EF|, while for the 2ZO overtone, a negligible dependence on Vg is observed for both ω2ZO and γ2ZO. This behavior is opposite to what happens to the q = 0 phonons at the Γ-point [60], as is the case of the G-band feature. In order to quantify the ZO′ phonon self-energy corrections, we measured the Vg dependence of ω2LO and γ2LO for the 2LO overtone (see Figure 15d), which is known as the 2D′ band around 3244 cm1. In analogy to the LOZO′ combination mode about the Γ-point, the 2LO overtone is a q ≈ 2k AV double resonant process and is a fruitful choice for unraveling the two-phonon self-energy contributions that are merged in the LOZO′ combination mode.
The Raman scattering process involving overtone or combinations of phonon modes will conserve both the frequency and momentum, so that in our case ωs = ωL (ωLO + ωj) and ks = kL (qLO + qj), where ωs(ks) is the frequency (momentum) of the stokes scattered light, ωL(kL) is the frequency (momentum) of the incident light, ωLO(qLO) is the frequency (momentum) of the LO phonon mode and ωj(qj) is the frequency (momentum) of the ZO, ZO′ or ZA phonon modes. Since the electron is vertically excited from the valence to the conduction band by the absorption of a photon, we have ks = kL and, therefore, the phonon momenta will be such that qLO qj. This scattering process is understood as follows: the electron is first scattered by one of the phonons, let us say the LO phonon, and then the electron is scattered again by a second phonon (LO, ZO, ZO′ or ZA). On top of this, the renormalization will happen independently for each phonon, so that, as a first approximation for a combination mode or overtone, the renormalization will be Π(ωLO+j, EF) = Π(ωLO, EF) + Π(ωj, EF), where j can be a LO, ZO, ZO′ or ZA phonon mode. Moreover, the IL interactions governing the ZO, ZO′ and ZA modes will not change the intralayer dependent LO mode [14,1921]. Therefore, what we are observing in the gate-modulated Raman experiment for overtone and phonon combination modes is, indeed, the summation of the individual phonon self-energy corrections of each phonon participating of the scattering process [1]. The phonon self-energy renormalization strengths will be quantified by the difference between the frequencies ω q 0 at Vg = 0 and ωq for Vg ≠0. As explained above, ω q 0 at Vg = 0 describes the system with no renormalizations that are associated with e-h pair formation.
By inspecting Figure 15a,b, we find that ΔωLOZO′(+) = 9 cm1 and ΔωLOZO′() = 7 cm1, respectively. On the other hand, by looking at Figure 15d we see that Δω2LO = 5 cm1, which means that the LO frequency renormalization for this AV process is ΔωLO 2.5 cm1. The self-energy corrections regarding the LO mode will be the same for the LO contribution for both the LOZO′ (+) and LOZO′ () features. Therefore the phonon self-energy correction ΔωZO′(+) for the ZO′ (+) mode will be given by ΔωLOZO′(+) ΔωLO = 6.5 cm1 while the phonon self-energy correction ΔωZO′() for the ZO′ () mode will be given by ΔωLOZO′ () ΔωLO = 4.5 cm1. From the analysis above and remembering that, the larger the self-energy corrections Δωq, the stronger are the e-ph couplings, we deduce that the IL e-ph coupling mediating the renormalizations for the ZO′ mode is stronger than the renormalization for the LO mode. It is noteworthy that the self-energy renormalizations for LOZO′ (+) and LOZO′ () are different even though they involve the same LO phonon. We understand these differences as follows: the phonon self-energy corrections for q ≠ 0 phonons rely on the density of electron and phonon states [40]. The density of phonons states will be the same because the same phonon is involved. However, as shown in Figure 15e, for energies smaller than |2| eV, the density of electronic states for π 2 ( π 2 * ) is always smaller than that for π 1 ( π 1 * ). This means that the phonon self-energy corrections are weaker for the ZO′ () in comparison to that for the ZO′ (+) not due to a different e-ph coupling symmetry, but because the density of electronic states for π 2 ( π 2 * ) is smaller in comparison to that for π 1 ( π 1 * ). By following the same strategy, we could also estimate the phonon self-energy corrections for the ZA mode, whose LOZA combination mode frequency (linewidth) also hardens (broadens) as expected for q ≠ 0 AV processes. As shown in Figure 16a, ΔωLOZA = 8 cm1. Therefore, the ZA mode self-energy corrections ΔωZA = 5.5 cm1. It is interesting to note that, the renormalization for the ZA mode is similar to that ruling the ZO ′ mode [63].
Interestingly, the results in Figure 16b,c show that, for both cases, the phonon self-energy corrections to the phonon frequency Δω2ZO and to the line width Δγ2ZO, are weak and as a consequence, the ω2ZO and γ2ZO renormalizations show a constant behavior with increasing |EF|. The reason behind the weak renormalization observed for the ZO mode is due to the lack of a phonon momentum q such that q = k k′, and this lack prevents any resonant renormalization from happening. This is confirmed by symmetry arguments since the deformation potential mediating the e-ph coupling related to the ZO mode, which is an anti-symmetric IL vibration, is expected to allow coupling of orthogonal electronic states since its vibration breaks the lattice symmetry. It is worth to notice that these results are obtained from exfoliated samples which means a perfect stacking between the two layers forming the 2LG system, but we still cannot assert how the results will apply for twisted 2LG. Careful experiments relating the twisting angles (which determines the strength of IL in twisted 2LG) and phonon self-energy renormalizations are still required.

5.2. Isotopes

One of the challenges regarding few layers graphene systems is the difficulty to address and probe individual layers. This problem can be promptly solved by isotope labeling of individual layers, as has been recently demonstrated [7375]. One can easily tune the frequency of the phonons by an exchange of the 12C isotope with a 13C isotope with essentially no change to the electronic structure. In this context, while isotopic labeling tunes the phonon properties (tuning, therefore, a gas of Bosons in the system), electronic doping provides an important tool to tune the electronic properties of graphene (tuning, therefore, a gas of Fermions in the system) [65,76,77].
The changes in the vibrational structure can be observed directly by Raman spectroscopy [74,78]. Although the doping of 2LG [79,80] and FLG [81] has been reported, the results are difficult to interpret, since it is not clear how the doping charge is distributed in between the various graphene layers. This problem can be overcome for turbostratic 2LG (t-2LG), since a special 2LG sample can be prepared by sequential transfer of 12C and 13C graphene layers onto, for example, a SiO2 substrate, so that the Raman features of the top and bottom layers could be resolved and analyzed separately [73]. In these samples, one can determine the doping charge associated with each individual layer independently when both layers were similarly doped, as reported in Reference [73].
Recently, CVD synthesis was used to obtain AB stacked 2LG [11] regions where the add-layer is synthesized from 13C and the continuous layer (primary 1LG) is synthesized from the 12C isotope, as shown in Figure 17a. In such a sample, we are able to address individual layers by Raman spectroscopy, follow the effect of phonon self-energy renormalizations for each individual layer separately and further understand how the interlayer (IL) interactions work in these isotopic systems. In the sample from Reference [75], a small central area is composed only from the 12C isotope and the border area is composed of the 13C isotope. The continuous layer that formed first is composed of the 12C isotope [82]. Figure 17a shows a photograph of the resulting graphene sample obtained using an optical microscope after transfer of the so-called 2LG thus prepared onto a SiO2/Si substrate. The hexagonal shaped darker region (delimited by the black dotted line) in Figure 17a corresponds to the 2LG, while the rest of the area (the background area) of the imaged spot is covered by 1LG. Figure 17b shows a 2D Raman map plotting the G′ (2D) spectral linewidth. The G′ (2D) lineshape is very sensitive to the 2LG stacking order as well as to the isotopic composition of the layers [11]. In Figure 17b it is possible to localize the 12C 1LG, the 12/12C AB-2LG as well as the 12/13C AB-2LG.
As showed in Section 2 in Figure 3, the Raman spectrum of the 13C 1LG sample exhibits the same Raman features as the Raman spectrum of the 12C 1LG except for a downshift of all the Raman bands for the 13C 1LG sample relative to the 12C graphene sample [73]. Figure 18b shows the Raman spectra of 12/13C AB-2LG at different electrode potentials separated by 0.1 V. Interestingly, the behavior of the Raman spectra for 12/13C AB-2LG (Figure 18b) is strongly different from that of 12/13C t-2LG (Figure 18a). The Raman features in Figure 18a,b both present two G modes; one with higher frequency (HG mode) and one with lower frequency (LG mode). At first glance, one may identify some similarity between the potential dependent behavior of the HG modes for the 12/13C AB-2LG and t-2LG systems. However, the behavior of the LG mode for the 12/13C AB-2LG is completely different from both G mode lineshapes, that is, different from both the HG and LG modes of the 12/13C t-2LG. Namely, for the LG mode of the 12/13C AB-2LG, we observe small changes in the G mode frequency during negative doping, when compared to 12/13C t-2LG (and has an opposite direction). For positive electrochemical potentials, we observe a larger shift for the LG mode in AB-2LG, as seen in Figure 17b, but this frequency change is still smaller than in the case of the LG mode in t-2LG.
In charged graphene, the frequency shift of the G mode, which is a first-order Raman mode around the Γ-point whose phonon momentum is null (q = 0), is related to both, the change in the C–C bond strength and the renormalization of the phonon self-energy associated with many-body effects [80]. As discussed before, changes on the electrode potential lead to a renormalization of the phonon energy, the phonon lifetime and consequently the energy of the carriers, that is, for both electrons and holes [62,83]. Observing Figure 18c,d, the different dependence on electrode potentials suggest that different mechanisms are ruling the doping of 12/13C AB-2LG in comparison to the 12/13C t-2LG at the same applied electrode potential. Indeed, the t-2LG EF will depend on the charge concentration n as |EF(1LG)| = ħ|vF|(πn)1/2, since the weakly interacting layers composing the t-2LG system keep the 1LG properties, while EF for the AB-2LG will obey | E F ( AB 2 LG ) | = [ γ 1 + ( 4 π 2 v F 2 n + γ 1 2 ) 1 / 2 ] / 2, where γ1 = 0:35 eV. By inspecting both, |EF(1LG)| and |EF(AB2LG)| relations, we see that, for a given change, in n, EF for the t-2LG changes more than the EF for the AB-2LG [65,80]. Consequently, the frequency variations for the t-2LG G modes are expected to be larger than the frequency variations for the AB-2LG.
Besides the different charging of the layers in both, 12/13C AB-2LG and 12/13C t-2LG, which changes the magnitude of the phonon self-energy renormalizations, the observed experimental results for the G mode frequency and linewidth shifts are quite distinct for both samples, as observed in Figure 18c,d. The behavior observed for both the LG and HG modes for the 12/13C t-2LG agrees well to the corresponding behavior observed for 1LG in which the frequency (linewidth) hardens (narrows) with increasing |EF| (see Section 3). Indeed, as expected for t-2LG systems, the results in Figure 18a,c reflect that the two layers, 12C and 13C layers, are fully decoupled and the differences in the phonon renormalization magnitudes are due to different charging of each layer constituting the t-2LG. The renormalizations observed are related to IP (Eg) modes of each 13C (the LG mode in Figure 18a) and 12C (the HG mode in Figure 18a), separately. At this point, we must note that for the case of the 12/13C AB-2LG we do not observe the standard behavior expected for the dependence of the G mode as a function of EF. For the 12/13C AB-2LG, in spite of the inhomogeneous charging of the 12C and 13C, to be able to explain the different magnitudes for the frequency change, it cannot fully explain the results in Figure 18b if we consider that the LG and HG modes are originating from the IP modes from the top and bottom layers separately. Moreover, the results in Figure 18b,d are also not fully consistent with other results observed for 12/12C AB-2LG available in the literature [72,79]. This inconsistency is expected since the phonon renormalizations strongly depend on the charge concentration of each of the layers in an AB-2LG.
In previous experiments, both the top and bottom layers of the AB stacked 2LG were contacted by an electrode [79], and, for this reason, one can assume that |EF| of both layers in the present case will be initially at the same potential. In Reference [75], the device is formed by the add-layer (the 13C layer) which is located next to the continuous graphene layer, but only the continuous graphene layer is contacted to the electrode (in this situation the two layer are at two different potentials). We must therefore consider a potential barrier due to the different position of |EF| in the top layer relative to the bottom layer [84,85]. Therefore the doping of the 13C graphene layer would depend on the efficiency of the charge transfer from the 12C continuous layer to the 13C add-layer. In our case, the add-layer is at the bottom, as commonly expected for CVD-based 2LGs [41,86]. Therefore, this add-layer is electrically shielded by the top layer, and one can understand the latter observation, in which a smaller amount of charge is located on the add-layer. This is consistent with previous calculations by Das et al. [80] and experiments by Fang et al. [11]. We also note that a similar situation happens in the case of double wall carbon nanotubes where both outer and inner tubes are metallic and only the outer tube is contacted by the electrode [87].
In order to understand the results obtained here for the LG and HG modes in 12/13C AB-2LG, we must, as stated earlier in the text, recall that the inversion symmetry in 12/13C AB-2LG is naturally broken due to the different 12C and 13C masses. As a result, what we are observing in Figure 18b is, indeed, a S and AS mixing of the IP (Eg) and OP (Eu) modes distinctly observed only when the inversion symmetry exists, like is the case for 12/12C AB-2LG. Indeed, this mass-related symmetry breaking is confirmed by the electrochemistry measurements. As reported by Gava et al. [10] a signature of the IP and OP mixing is that the intensity ratio (IHG/ILG) between the HG (G+ in Section 4) (an anti-symmetric combination of IP and OP) and the LG (G in Section 4) modes (a symmetric combination of IP and OP) must increase with increasing |EF|. This signature is confirmed by the experimental results, as shown in the insets of Figure 18c,d.
Based on Gava et al. [10] and noting that due to conventions related to electrochemistry experiments, positive (negative) electrode potentials means that the EF is decreasing (increasing), Araujo et al. [75] concluded that nbottom > ntop. Based on this conclusion, the authors [75] discuss the existence of an off-set in the change of the LG (G in Section 4) and HG (G+ in Section 4) mode frequencies in their dependence on electrode potential, as observed for the 12/13C AB-2LG. This is, in particular, clear for the case of positive doping. As one can see from Figure 18b, there is a small increase in the frequency of the LG (or G) mode and almost no changes in the frequency of the HG (or G+) mode up to an electrode potential of +1 V. Then, for the potentials above +1 V, the G mode frequencies are gradually increased and seem to saturate from the potential +1.3 V on. This behavior is in contrast to 1LG or t-2LG (Figure 18a) where the frequency starts to change even at very low positive and negative applied potentials (±0.1 V). Besides the competition for the corrections in the phonon frequency between both phenomena, phonon self-energy renormalizations and changes in the chemical C–C bonds (excess of holes hardens the C–C bonds while excess of electrons softens the C–C bonds) [30], in AB-2LG, one should also consider subsequent filling (emptying) of the second electronic band in the conduction band π2* (of the second electronic band in the valence band π2) at higher electrode potentials. This band filling (emptying) is important to decide which phenomena will dominate and rule the frequency changes. In particular, it has been shown that the filling of π2* may lead to a kink in the dependence of the Raman frequency on electrode potential [80] and this observation is consistent with a sudden change of the slope of the frequency/potential dependence (δωG/δV) during hole doping (positive potentials) as seen in Figure 18b [80]. Indeed, when EF is at zero, real e-h pairs involving the π1 and π1* bands are being created all time, which contributes to decreasing the phonon frequency. At the same time, virtual e-h pairs are being created between π1 and π2 bands (in the valence band, which contributes to an increase in frequency) while no e-h pairs are being created between π1* and π2* in the conduction band. Note that, because it is a resonant effect, e-h pairs involving the π1 and π1* bands will dominate the virtual processes. Nothing is happening to the bonds since the system is not doped yet.
When the system is doped with holes, in a first stage (electrochemical potential between 0 and 1 V), the real e-h pair formation involving the bands π1* and π1 will be halted (since EF is decreasing) and the e-h pairs involving the bands π1 and π2 will change their status from virtual to real e-h pairs. Therefore the phonon self-energy renormalizations will decrease the frequency (broaden the linewidth), since the real e-h pair formation will favor the frequency changes, while the C–C bonds will harden hence increasing the frequency. On average, no (or a small) change in frequency is expected, in accordance with the observations. When the 2LG system is doped with electrons, the virtual e-h pairs created (annihilated) due to phonon absorption (emission) involving the π1 and π2 bands will always exist, which contributes to increase the frequency. Again, in a first stage (electrochemical potential between 1 V and 0), a competition between real and virtual e-h pair formations involving the π1 and π1* bands and the π1 and π2 bands, respectively, will occur. When EF continues to increase, eventually the e-h pair formations involving the π1 and π1* bands and the π1 and π2 bands will be virtual and real e-h pairs involving the π1* and π2* bands start occurring. The net consequence is that the real electron hole pair formation together with the softening of C–C bonds will be dominating. The net result is a decrease in the frequency, as shown in Figure 18d. As we progress to the second stage (electrochemical potential <−1 V), all the e-h pair formations involving all the π1, π2, π1* and π2* will be virtual. However, this virtual e-h pair formation will be a small perturbation favored by the C–C bonds softening. The net effect is still a decrease in the phonon frequency.
The explanations above do not fully explain the behavior of the LG (or G) mode for the 12/13C AB-2LG in the range from 0 to 1 V, which requires a bandgap effect to be fully understood. In fact, since the graphene is on the substrate which is known to dope graphene, we can consider this situation as a device with a fixed voltage at the bottom gate and variable voltage at the top gate, which is realized by changing the applied electrode potential. Since we gradually increase the gate voltage in our experiment, the bandgap should be opened in the 12/13C AB-2LG electronic structure and, in principle, the charge carriers are no longer injected into the graphene sample, until EF exceeds the band gap magnitude. The gap opening should therefore be reflected in the Raman spectra of the doped AB-2LG. The situation can be analogous to a semiconducting SWCNT, where one can find an offset in doping which is equal to half the energy of the bandgap [88]. It is important to remember that since one of the layers is being kept at a constant potential, the opening of a band gap is accompanied by the respective change of EF. The changes of the Raman G mode features are related to the creation (annihilation) of e-h pairs due to phonon absorption (emission) which hardens (narrows) the Raman band frequency (linewidth) and it is directly connected to the lifetime of the e-h pair. Indeed, we discussed that any time the condition Eph < 2|EF| (Eph stands for the phonon energy) is satisfied, the formation of real e-h pairs will be halted and as a consequence the G mode frequency will increase and the respective linewidth will decrease. Alternatively, the formation of real e-h pairs can be prevented by opening a bandgap, since the real e-h pair formation will be halted every time the band gap energy (Egap) is larger than Eph. In this case, any change in frequency will be more likely related to changes in the C–C bonds since they major any contribution involving virtual e-h pair creations related to the band-gap. In other words, if the Eph > Egap condition is satisfied, e-h pairs will be formed and the hardening (narrowing) of the G mode frequency (linewidth) should be observed independently of the Egap value.
The bandgap opening, in fact, reflects spectral changes in the positive electrochemical potential values in the LG (or G) modes due to the applied gate potential, as shown in Figure 18d. In Figure 18c, which shows the data for the 12/13C t-2LG, the frequency hardening followed by a saturation at around 1 V for the LG and HG modes is evident and means that the phonon self-energy renormalization is taking place and is a major effect between 1 V and 0 and from 1 V on, the doping-related changes in the C–C bonds, which decrease the phonon frequency, is a major effect. No band gap is introduced since the 2LG in question is turbostratic. Now, as shown in Figure 18d, the LG (or G) and HG (or G+) frequencies decrease for the 12/13C AB-2LG, which means that the changes in the C–C bonds are the major changes, as explained above. For negative electrochemical potentials, in which electrons are being injected to the system, EF will be in the conduction band before the condition Eph < Egap occurs [20]. This means that the band gap will not play an important rule for negative potentials. For the range from 0 to +1 V, the frequency is roughly constant for the HG (or G+) mode in Figure 18d and slightly increases for the LG (or G) mode. This suggests that the bandgap is likely affecting the LG (or G) mode which is halting the phonon renormalization, since when EF decreases, the electrons supposedly going from the π1 band to the π1* band will eventually fall into the band gap. During the time this happens, the C–C bond changes will be the major effect in the frequency changes. Additionally, we believe that the inhomogeneous charging of the top and bottom layers in AB-2LG could explain why the band gap almost does not affect the HG (or G+) mode [80]. Finally, at high positive potentials above 1 V, the explanations given above are enough to explain the frequency changes since the gap will not affect the system anymore. Moreover, since the t-2LG system does not open a band gap, its frequency behavior with the electrochemical potential is totally explained within the phonon self-energy formalism and together with C–C bond changes.

6. Final Remarks

In this review we discussed intra- and interlayer-related interactions in twisted and AB-stacked bilayer graphene (2LG) systems. As discussed, even though IL interactions are weak by nature (they are related to van-der-Waals force between the constituent layers of the 2LG), they are strong enough to dramatically change the vibrational and the electronic properties when departing from a fully misoriented twisted system to an AB-stacked one. For example, thanks to these IL interactions, it is possible to open up a bandgap in AB-stacked bilayers. The IL interactions also play a fundamental role to mediating charge transfers between the constituent layers and are responsible for the origin of IL-related phonons, which influence directly transport and infrared related phenomena in these bilayers. It was seen that through chemical vapor deposition (CVD) method, one can synthesize either twisted or AB-stacked 12/12C 2LG and 12/13C 2LG. This opens up a brand-new route for 2LG applications in which through backgate or electrochmical doping one can control the electrons and through isotopic decoration of the layers one can control the phonons in such 2LG systems. Even though a comprehensive discussion was addressed about electron-phonon (e-ph) interactions and phonon self-energy renormalizations related to the IL interactions and its combination with the intralayer phonons, the authors agree that a fully understanding of the mechanism ruling such interactions and renormalizations is still elusive and many more experiments are required. From a gate-modulated Raman point of view, there is still plenty of physics to be discussed mainly related to the twisted systems and to the isotopically labeled systems in, for example, low-temperature regimes. These 2LG can serve as a convenient platform to understanding fundamental phenomena related to IL interactions, which can be extrapolated to a whole class of new two-dimensional materials such as transition metal dicalchogenides and topological insulators.
Finally, like stated throughout the text, the e-ph interactions and IL-interactions are of major importance on transport and optical phenomena and several experimental efforts have been carried along these lines. The authors would like to bring attention to some of these efforts. Namely, Yan et al. [15] observed, recently, the phenomenon of phonon-induced transparency (PIT) in AB-2LG nanoribbons, in which light absorption due to the plasmon excitations are strongly suppressed due to their coupling with the infrared active Γ-point optical phonon. This PIT in 2LG is actively tunable by electrostatic gating and is usually accompanied by strong distortion in light dispersion, leading to a strong slow light effect [15]. This phenomenon is important for several different applications, e.g., various applications in few-photon non-linear optics, slow light devices, and biological sensing, without external optical pumping and at room temperature. Additionally, Fano resonances, that are continuously tunable by means of electrical gating, in 2LG have also been reported [1618]. Fano resonances are features in absorption, scattering or transport spectra resulting from the interaction of discrete and continuum states (usually manifested by the interactions of phonons with a continuum of free electrons). Tang et al. [16] show that due to the many-body Fano resonance and to the unique tunable bandgap and strong e-ph interactions, 2LG offer the possibility of a phonon laser, which can be easily appreciated from the analogy to its photon counterpart as in semiconductor lasers. Also, Kuzmenko et al. [17] observed that the in-plane antisymmetric phonon mode Eu (with energy 0.2 eV) has a pronounced Fano-like asymmetry. This phonon shows a strong increase of the infrared intensity and a frequency softening in bilayer graphene as a function of the gate-induced doping. To conclude, Low et al. [18] demonstrated AB-2LG as a new and very interesting plasmonic material, showing plasmonic frequency higher than that predicted by the classical derivation. The finding by Low et al. opens routes for applications of 2LG in engineered metamaterials, resonant heat transfer processes and many others.

Acknowledgments

Daniela L. Mafra acknowledges the financial support from the Brazilian agency CNPq and Paulo T. Araujo acknowledges the financial support from the NSF-DMR 10-04147 grant.

Conflicts of Interest

The authors declare no conflict of interest.

References

  1. Heinonen, O.; Taylor, P.L. A Quantum Approach to Condensed Matter Physics; Cambridge University Press: Cambridge, UK, 2002. [Google Scholar]
  2. Bonaccorso, F.; Sun, Z.; Hasan, T.; Ferrari, A.C. Graphene photonics and optoelectronics. Nat. Photon. 2010, 4, 611. [Google Scholar]
  3. Neto, A.H.C.; Guinea, F.; Peres, N.M.R.; Novoselov, K.S.; Geim, A.K. The electronic properties of graphene. Rev. Mod. Phys. 2009, 81, 109–162. [Google Scholar]
  4. Stankovich, S.; Dikin, D.A.; Dommett, G.H.B.; Kohlhaas, K.M.; Zimney, E.J.; Stach, E.A.; Piner, R.D.; Nguyen, S.T.; Ruoff, R.S. Graphene-based composite materials. Nature 2006, 442, 282. [Google Scholar]
  5. Novoselov, K.S.; Geim, A.K.; Morozov, S.V.; Jiang, D.; Katsnelson, M.I.; Grigorieva, I.V.; Dubonos, S.V.; Firsov, A.A. Two-dimensional gas of massless Dirac fermions in graphene. Nature 2005, 438, 197. [Google Scholar]
  6. Zhang, Y.; Tan, Y.W.; Stormer, H.L.; Kim, P. Experimental observation of the quantum hall effect and Berry’s phase in graphene. Nature 2005, 438, 201. [Google Scholar]
  7. Kim, K.S.; Zhao, Y.; Jang, H.; Lee, S.Y.; Kim, J.M.; Ahn, J.H.; Kim, P.; Choi, J.Y.; Hong, B.H. Large-scale pattern growth of graphene films for stretchable transparent electrodes. Nature 2009, 457, 706. [Google Scholar]
  8. Bae, S.; Kim, H.; Lee, Y.; Xu, X.; Park, J.S.; Zheng, Y.; Balakrishnan, J.; Lei, T.; Kim, H.R.; Song, Y.I.; et al. Roll-to-roll production of 30-inch graphene films for transparent electrodes. Nat. Nanotechnol. 2010, 5, 574. [Google Scholar]
  9. Kuzmenko, A.B.; van Heumen, E.; van der Marel, D.; Lerch, P.; Blake, P.; Novoselov, K.S.; Geim, A.K. Infrared spectroscopy of electronic bands in bilayer graphene. Phys. Rev. B. 2009, 79, 115441. [Google Scholar]
  10. Gava, P.; Lazzeri, M.; Saitta, A.M.; Mauri, F. Ab initio study of gap opening and screening effects in gated bilayer graphene. Phys. Rev. B. 2009, 79, 165431. [Google Scholar]
  11. Fang, W.J.; Hsu, A.L.; Caudillo, R.; Song, Y.; Birdwell, A.G.; Zakar, E.; Kalbac, M.; Dubey, M.; Palacios, T.; Dresselhaus, M.S.; et al. Rapid identification of stacking orientation in isotopically labeled chemical-vapor grown bilayer graphene by Raman spectroscopy. Nano Lett 2013, 13, 1541–1548. [Google Scholar]
  12. Lemme, M.C.; Koppens, F.H.L.; Falk, A.L.; Rudner, M.S.; Park, H.; Levitov, L.S.; Marcus, C.M. Gate-activated photoresponse in a graphene p-n junction. Nano Lett 2011, 11, 4134–4137. [Google Scholar]
  13. Lui, C.H.; Li, Z.; Mak, K.F.; Cappelluti, E.; Heinz, T.F. Observation of an electrically tunable band gap in trilayer graphene. Nat. Phys. 2011, 7, 944–947. [Google Scholar]
  14. Lui, C.H.; Malard, L.M.; Kim, S.; Lantz, G.; Laverge, F.E.; Saito, R.; Heinz, T.F. Observation of out-of-plane vibrations in few-layer graphene. Nano Lett 2012, 12, 5539–5544. [Google Scholar]
  15. Tunable Phonon-Induced Transparency in Bilayer Graphene Nanoribbons. Available online: http://arxiv.org/abs/1310.4394 accessed on 14 April 2014.
  16. Tang, T.; Zhang, Y.; Park, C.; Geng, B.; Girit, C.; Hao, Z.; Martin, M.C.; Zettl, A.; Crommie, M.F.; Louie, S.G.; et al. A tunable phonon-exciton Fano system in bilayer graphene. Nat. Nanotechnol. 2010, 5, 32–36. [Google Scholar]
  17. Kuzmenko, A.B.; Benfatto, L.; Cappelluti, E.; Crassee, I.; van der Marel, D.; Blake, P.; Novoselov, K.S.; Geim, A.K. Gate tunable infrared phonon anomalies in bilayer graphene. Phys. Rev. Lett. 2009, 103, 116804. [Google Scholar]
  18. Low, T.; Guinea, F.; Yan, H.; Xia, F.; Avouris, P. Novel midinfrared plasmonic properties of bilayer graphene. Phys. Rev. Lett. 2014, 112, 116801. [Google Scholar]
  19. Zhang, L.M.; Li, Z.Q.; Basov, D.N.; Fogler, M.M.; Hao, Z.; Martin, M.C. Determination of the electronic structure of bilayer graphene from infrared spectroscopy. Phys. Rev. B. 2008, 78, 235408. [Google Scholar]
  20. Kuzmenko, A.B.; Crassee, I.; van der Marel, D.; Blake, P.; Novoselov, K.S. Determination of the gate-tunable band gap and tight-binding parameters in bilayer graphene using infrared spectroscopy. Phys. Rev. B. 2009, 80, 165406. [Google Scholar]
  21. Sato, K.; Park, J.S.; Saito, R.; Cong, C.; Yu, T.; Lui, C.H.; Heinz, T.; Dresselhaus, G.; Dresselhaus, M.S. Raman spectra of out-of-plane phonons in bilayer graphene. Phys. Rev. B. 2011, 84, 035419. [Google Scholar]
  22. Kitipornchai, S.; He, X.Q.; Liew, K.M. Continuum model for the vibration of multilayered graphene sheets. Phys. Rev. B. 2005, 72, 075443. [Google Scholar]
  23. Saha, S.K.; Waghmare, U.V.; Krishnamurthy, H.R.; Sood, A.K. Phonons in few-layer graphene and interplanar interaction: A first-principles study. Phys. Rev. B. 2008, 78, 165421. [Google Scholar]
  24. Yan, J.-A.; Ruan, W.Y.; Chou, M.Y. Phonon dispersions and vibrational properties of monolayer, bilayer, and trilayer graphene: Density-functional perturbation theory. Phys. Rev. B. 2008, 77, 125401. [Google Scholar]
  25. Jiang, J.-W.; Tang, H.; Wang, B.-S.; Su, Z.-B. Raman and infrared properties and layer dependence of the phonon dispersions in multilayered graphene. Phys. Rev. B. 2008, 77, 235421. [Google Scholar]
  26. Zhao, Y.; Luo, X.; Li, H.; Zhang, J.; Araujo, P.T.; Gan, C.K.; Wu, J.; Zhang, H.; Quek, S.Y.; Dresselhaus, M.S.; et al. Interlayer breathing and shear modes in few-trilayer MoS2 and WSe2. Nano Lett. 2013, 13, 1007. [Google Scholar]
  27. Osada, M.; Sasaki, T. Two-dimensional dielectric nanosheets: Novel nanoelectronics from nanocrystal building blocks. Adv. Mater. 2012, 24, 210. [Google Scholar]
  28. Geim, A.K.; Grigorieva, I.V. van der Waals heterostructures. Nature 2013, 499, 419. [Google Scholar]
  29. Chakraborty, B.; Bera, A.; Muthu, D.V.S.; Bhowmick, S.; Waghmare, U.V.; Sood, A.K. Symmetry-dependent phonon renormalization in monolayer MoS2 transistor. Phys. Rev. B. 2012, 85, 161403(R). [Google Scholar]
  30. Lazzeri, M.; Mauri, F. Nonadiabatic Kohn anomaly in a doped graphene monolayer. Phys. Rev. Lett. 2006, 97, 266407. [Google Scholar]
  31. Geim, A.K.; Novoselov, K.S. The rise of graphene. Nat. Mater. 2007, 6, 183. [Google Scholar]
  32. Dresselhaus, M.S.; Saito, R.; Dresselhaus, G. Physical Properties of Carbon Nanotubes; Imperial College Press: London, UK, 1998. [Google Scholar]
  33. Yan, J.; Ruan, W.Y.; Chou, M.Y. Phonon dispersions and vibrational properties of monolayer, bilayer, and trilayer graphene: Density-functional perturbation theory. Phys. Rev. B. 2008, 77, 125401. [Google Scholar]
  34. Michel, K.H.; Verberck, B. Theory of the evolution of phonon spectra and elastic constants from graphene to graphite. Phys. Rev. B. 2008, 78, 085424. [Google Scholar]
  35. Wallace, P.R. The band theory of graphite. Phys. Rev. 1947, 71, 622. [Google Scholar]
  36. McClure, J.W. Band structure of graphite and de haas-van alphen effect. Phys. Rev. 1957, 108, 612. [Google Scholar]
  37. Slonczewski, J.C.; Weiss, P.R. Band structure of graphite. Phys. Rev. 1958, 109, 272. [Google Scholar]
  38. Partoens, B.; Peeters, F.M. From graphene to graphite: Electronic structure around the K point. Phys. Rev. B. 2006, 74, 075404. [Google Scholar]
  39. McCann, E. Asymmetry gap in the electronic band structure of bilayer graphene. Phys. Rev. B. 2006, 74, 161403. [Google Scholar]
  40. Malard, L.M.; Nilsson, J.; Elias, D.C.; Brant, J.C.; Plentz, F.; Alves, E.S.; Neto, A.H.C.; Pimenta, M.A. Probing the electronic structure of bilayer graphene by Raman scattering. Phys. Rev. B. 2007, 76, 201401(R). [Google Scholar]
  41. Wu, Y.P.; Chou, H.; Ji, H.; Wu, Q.; Chen, S.; Jiang, W.; Hao, Y.; Kang, J.; Ren, Y.; Piner, R.D.; et al. Growth mechanism and controlled synthesis of AB-stacked bilayer graphene on Cu-Ni alloy foils. Acs Nano 2012, 6, 7731–7738. [Google Scholar]
  42. Liu, L.; Zhou, H.; Cheng, R.; Yu, W.J.; Liu, Y.; Chen, Y.; Shaw, J.; Zhong, X.; Huang, Y.; Duan, X. High-yield chemical vapor deposition growth of high-quality large-area AB-stacked bilayer graphene. Acs Nano 2012, 6, 8241–8249. [Google Scholar]
  43. Malard, L.M.; Pimenta, M.A.; Dresselhaus, G.; Dresselhaus, M.S. Raman spectroscopy in graphene. Phys. Rep. 2009, 473, 51–87. [Google Scholar]
  44. Latil, S.; Meunier, V.; Henrard, L. Massless fermions in multilayer graphitic systems with misoriented layers: Ab initio calculations and experimental fingerprints. Phys. Rev. B. 2007, 76, 201402(R). [Google Scholar]
  45. Trambly de Laissardière, G.; Mayou, D.; Magaud, L. Localization of dirac electrons in rotated graphene bilayers. Nano Lett 2010, 10, 804–808. [Google Scholar]
  46. Luican, A.; Li, G.; Reina, A.; Kong, J.; Nair, R.R.; Novoselov, K.S.; Geim, A.K.; Andrei, E.Y. Single-layer behavior and its breakdown in twisted graphene layers. Phys. Rev. Lett. 2011, 106, 126802. [Google Scholar]
  47. Hass, J.; Varchon, F.; Millan-Otoya, J.E.; Sprinkle, M.; Sharma, N.; de Heer, W.A.; Berger, C.; First, P.N.; Magaud, L.; Conrad, E.H. Why multilayer graphene on 4HSiC(000 1 ¯ ) behaves like a single sheet of graphene. Phys. Rev. Lett. 2008, 100, 125504. [Google Scholar]
  48. Lopes dos Santos, J.M.B.; Peres, N.M.R.; Neto, A.H.C. Graphene bilayer with a twist: Electronic structure. Phys. Rev. Lett. 2007, 99, 256802. [Google Scholar]
  49. Varchon, F.; Mallet, P.; Magaud, L.; Veuillen, J.-Y. Rotational disorder in few-layer graphene films on 6H-SiC(000-1): A scanning tunneling microscopy study. Phys. Rev. B. 2008, 77, 165415. [Google Scholar]
  50. Shallcross, S.; Sharma, S.; Pankratov, O.A. Quantum interference at the twist boundary in graphene. Phys. Rev. Lett. 2008, 101, 056803. [Google Scholar]
  51. Moon, P.; Koshino, M. Energy spectrum and quantum hall effect in twisted bilayer graphene. Phys. Rev. B. 2012, 85, 195458. [Google Scholar]
  52. Morell, E.S.; Correa, J.D.; Vargas, P.; Pacheco, M.; Barticevic, Z. Flat bands in slightly twisted bilayer graphene: Tight-binding calculations. Phys. Rev. B. 2010, 82, 121407(R). [Google Scholar]
  53. Kim, K.; Coh, S.; Tan, L.Z.; Regan, W.; Yuk, J.M.; Chatterjee, E.; Crommie, M.F.; Cohen, M.L.; Louie, S.G.; Zettl, A. Raman spectroscopy study of rotated double-layer graphene: Misorientation-angle dependence of electronic structure. Phys. Rev. Lett. 2012, 108, 246103. [Google Scholar]
  54. Brihuega, I.; Mallet, P.; Gonzalez-Herrero, H.; de Laissardiere, G.T.; Ugeda, M.M.; Magaud, L.; Gomez-Rodriguez, J.M.; Yndurain, F.; Veuillen, J.-Y. Unraveling the intrinsic and robust nature of van Hove singularities in twisted bilayer graphene by scanning tunneling microscopy and theoretical analysis. Phys. Rev. Lett. 2012, 109, 196802. [Google Scholar]
  55. Yan, W.; Liu, M.; Dou, R.-F.; Meng, L.; Feng, L.; Chu, Z.-D.; Zhang, Y.; Liu, Z.; Nie, J.-C.; He, L. Angle-dependent van hove singularities in a slightly twisted graphene bilayer. Phys. Rev. Lett. 2012, 109, 126801. [Google Scholar]
  56. Sato, K.; Saito, R.; Cong, C.; Yu, T.; Dresselhaus, M.S. Zone folding effect in Raman G-band intensity of twisted bilayer graphene. Phys. Rev. B. 2012, 86, 125414. [Google Scholar]
  57. Carozo, V.; Almeida, C.M.; Ferreira, E.H.M.; Cancado, L.G.; Achete, C.A.; Jorio, A. Raman signature of graphene superlattices. Nano Lett. 2011, 11, 4527. [Google Scholar]
  58. He, R.; Chung, T.; Delaney, C.; Keiser, C.; Jauregui, L.A.; Shand, P.M.; Chancey, C.C.; Wang, Y.; Bao, J.; Chen, Y.P. Observation of low energy Raman modes in twisted bilayer graphene. Nano Lett. 2013, 13, 3594. [Google Scholar]
  59. Piscanec, S.; Lazzeri, M.; Mauri, F.; Ferrari, A.C.; Robertson, J. Kohn anomalies and electron-phonon interactions in graphite. Phys. Rev. Lett. 2004, 93, 185503. [Google Scholar]
  60. Araujo, P.T.; Mafra, D.L.; Sato, K.; Saito, R.; Kong, J.; Dresselhaus, M.S. Phonon self-energy corrections to nonzero wave-vector phonon modes in single-layer graphene. Phys. Rev. Lett. 2012, 109, 046801. [Google Scholar]
  61. Mafra, D.L.; Kong, J.; Sato, K.; Saito, R.; Dresselhaus, M.S.; Araujo, P.T. Using the G′ Raman cross-section to understand the phonon dynamics in bilayer graphene systems. Nano Lett. 2012, 12, 2883. [Google Scholar]
  62. Mafra, D.L.; Kong, J.; Sato, K.; Saito, R.; Dresselhaus, M.S.; Araujo, P.T. Using gate-modulated Raman scattering and electron-phonon interactions to probe single-layer graphene: A different approach to assign phonon combination modes. Phys. Rev. B. 2012, 86, 195434. [Google Scholar]
  63. Araujo, P.T.; Mafra, D.L.; Sato, K.; Saito, R.; Kong, J.; Dresselhaus, M.S. Unraveling the interlayer-related phonon self-energy renormalization in bilayer graphene. Nat. Sci. Rep. 2012, 2, 1017. [Google Scholar]
  64. Saito, R.; Sato, K.; Araujo, P.T.; Mafra, D.L.; Dresselhaus, M.S. Gate modulated Raman spectroscopy of graphene and carbon nanotubes. Solid State Commun 2013, 175–176, 18–34. [Google Scholar]
  65. Yan, J.; Zhang, Y.; Kim, P.; Pinczuk, A. Electric field effect tuning of electron-phonon coupling in graphene. Phys. Rev. Lett. 2007, 98, 166802. [Google Scholar]
  66. Yan, J.; Henriksen, E.A.; Kim, P.; Pinczuk, A. Observation of anomalous phonon softening in bilayer graphene. Phys. Rev. Lett. 2008, 101, 136804. [Google Scholar]
  67. Ohta, T.; Bostwick, A.; Seyller, T.; Horn, K.; Rotenberg, E. Controlling the electronic structure of bilayer graphene. Science 2006, 311, 951. [Google Scholar]
  68. Malard, L.M.; Guimaraes, M.H.D.; Mafra, D.L.; Mazzoni, M.S.C.; Jorio, A. Group-theory analysis of electrons and phonons in N-layer graphene systems. Phys. Rev. B. 2009, 79, 125426. [Google Scholar]
  69. Ando, T. Anomaly of optical phonon in bilayer graphene. J. Phys. Soc. Jpn. 2007, 76, 104711. [Google Scholar]
  70. Malard, L.M.; Elias, D.C.; Alves, E.S.; Pimenta, M.A. Observation of distinct electron-phonon couplings in gated bilayer graphene. Phys. Rev. Lett. 2008, 101, 257401. [Google Scholar]
  71. Ando, T.; Koshino, M. Field effects on optical phonons in bilayer graphene. J. Phys. Soc. Jpn. 2009, 78, 034709. [Google Scholar]
  72. Yan, J.; Villarson, T.; Henriksen, E.A.; Kim, P.; Pinczuk, A. Optical phonon mixing in bilayer graphene with a broken inversion symmetry. Phys. Rev. B. 2009, 80, 241417(R). [Google Scholar]
  73. Kalbac, M.; Farhat, H.; Kong, J.; Janda, P.; Kavan, L.; Dresselhaus, M.S. Raman spectroscopy and in situ Raman spectroelectrochemistry of bi-layer 12c/13c graphene. Nano Lett 2011, 11, 1957–1963. [Google Scholar]
  74. Kalbac, M.; Kong, J.; Dresselhaus, M.S. Raman spectroscopy as a tool to address individual graphene layers in few-layer graphene. J. Phys. Chem. C. 2012, 116, 19046–19050. [Google Scholar]
  75. Araujo, P.T.; Frank, O.; Mafra, D.L.; Fang, W.; Kong, J.; Dresselhaus, M.S.; Kalbac, M. Mass-related inversion symmetry breaking and phonon self-energy renormalization in isotopically labeled AB-stacked bilayer graphene. Nat. Sci. Rep. 2013, 3, 2061. [Google Scholar]
  76. Kalbac, M.; Reina, A.; Farhat, H.; Kong, J.; Kavan, L.; Dresselhaus, M.S. The influence of strong electron and hole doping on the Raman intensity of chemical vapor-deposition graphene. Acs Nano 2010, 4, 6055–6063. [Google Scholar]
  77. Das, A.; Pisana, S.; Chakraborty, B.; Piscanec, S.; Saha, S.K.; Waghmare, U.V.; Novoselov, K.S.; Krishnamurthy, H.R.; Geim, A.K.; Ferrari, A.C.; et al. Monitoring dopants by raman scattering in an electrochemically top-gated graphene transistor. Nat. Nanotechnol. 2008, 3, 210. [Google Scholar]
  78. Rodriguez-Nieva, J.F.; Saito, R.; Costa, S.D.; Dresselhaus, M.S. Effect of C-13 isotope doping on the optical phonon modes in graphene: Localization and Raman spectroscopy. Phys. Rev. B. 2012, 85, 245406. [Google Scholar]
  79. Mafra, D.L.; Gava, P.; Malard, L.M.; Borges, R.S.; Silva, G.G.; Leon, J.A.; Plentz, F.; Mauri, F.; Pimenta, M.A. Characterizing intrinsic charges in top gated bilayer graphene device by Raman spectroscopy. Carbon 2012, 50, 3435–3439. [Google Scholar]
  80. Das, A.; Chakraborty, B.; Piscanec, S.; Pisana, S.; Sood, A.K.; Ferrari, A.C. Phonon renormalization in doped bilayer graphene. Phys. Rev. B. 2009, 79, 155417. [Google Scholar]
  81. Bruna, M.; Borini, S. Observation of Raman G-band splitting in top-doped few-layer graphene. Phys. Rev. B. 2010, 81, 125421. [Google Scholar]
  82. Kalbac, M.; Frank, O.; Kavan, L. The control of graphene double-layer formation in copper-catalyzed chemical vapor deposition. Carbon 2012, 50, 3682–3687. [Google Scholar]
  83. Subramaniam, D.; Libisch, F.; Li, Y.; Pauly, C.; Geringer, V.; Reiter, R.; Mashoff, T.; Liebmann, M.; Burgdorfer, J.; Busse, C.; et al. Wave-function mapping of graphene quantum dots with soft confinement. Phys. Rev. Lett. 2012, 108, 046801. [Google Scholar]
  84. Castro, E.V.; Novoselov, K.S.; Morozov, S.V.; Peres, N.M.R.; Lopes dos Santos, J.M.B.; Nilsson, J.; Guinea, F.; Geim, A.K.; Neto, A.H.C. Biased bilayer graphene: Semiconductor with a gap tunable by the electric field effect. Phys. Rev. Lett. 2007, 99, 216802. [Google Scholar]
  85. Bandow, S.; Rao, A.M.; Sumanasekera, G.U.; Eklund, P.C.; Kokai, F.; Takahashi, K.; Yudasaka, M.; Iijima, S. Evidence for anomalously small charge transfer in doped single-wall carbon nanohorn aggregates with Li, K and Br. Appl. Phys. A. 2000, 71, 561–564. [Google Scholar]
  86. Li, Q.; Chou, H. Growth of adlayer graphene on Cu studied by carbon isotope labeling. Nano Lett 2013, 13, 486–490. [Google Scholar]
  87. Kalbac, M.; Green, A.A.; Hersam, M.C.; Kavan, L. Probing charge transfer between shells of double-walled carbon nanotubes sorted by outer-wall electronic type. Chem. Eur. J. 2011, 17, 9806–9815. [Google Scholar]
  88. Kalbac, M.; Farhat, H.; Kavan, L.; Kong, J.; Sasaki, K.-I.; Saito, R.; Dresselhaus, M.S. Electrochemical charging of individual single-walled carbon nanotubes. Acs Nano 2009, 3, 2320–2328. [Google Scholar]
Figure 1. The electronic structure of 1LG, which is a linear dispersion around the K point of the Brillouin zone. Note that the valence and the conduction bands touch each other, which makes 1LG a zero gap semiconductor.
Applsci 04 00207f1
Figure 2. (a) The phonon dispersion for 1LG and (b) 2LG. LO stands for in-plane optical longitudinal mode, TO stand for in-plane transverse optical mode, ZO stands for out-of-plane transverse mode, LA stands for in-plane longitudinal acoustic mode, TA stands for transverse acoustic mode and ZA stands for out-of-plane transverse. In (b), ZO′ is layer breathing mode (LBM), in which the layers of the 2LG vibrates up and down out of phase [33].
Applsci 04 00207f2
Figure 3. Raman spectra showing the G band and the G′ band of 12C 1LG and 13C 1LG (black), 12/12C turbostratic 2LG (dotted blue), 12/12C AB-stacked 2LG (solid blue), 12/13C turbostratic 2LG (dotted red) and 12/13C AB-stacked 2LG (solid red) [11].
Applsci 04 00207f3
Figure 4. Electronic structure of 2LG around the K point using (a) γ3 and γ4 equal to zero and (b) γ3 = 0.3 eV and γ4 = 0.15 eV [40]; (c)The intra- (γ0) and inter-layer (γ1, γ3 and γ4) tight-binding hoping parameters in 2LG.
Applsci 04 00207f4
Figure 5. (a) The 2D electronic band structures of Bernal AB 2LG [44]; (b) Atomic structure of t-2LG with rotation angle θ = 21.8°. Dashed (red) and solid (green) lines represent the lattices of layers 1 and 2, respectively [51]; (c) Velocity ratio V2LG/V1LG for a commensurate (n, m) bilayer cell versus rotation angle θ: circle, VASP; cross, tight-binding calculations. The line is the model of Lopez dos Santos et al. [48]: V 2 LG / V 1 LG = 1 9 [ t ˜ / ( V 1 LG K sin ( θ / 2 ) ) ] 2, with t ˜ = 0.11 eV and V1LGK = 2γ0π(31/2) = 9.8 eV [45]. Band structure of t-2LG with rotation angles (d) 9.43°; (e) 3.89°; (f) 2.65° and (g) 1.47°. Dashed (red) slopes around the K point indicate the monolayer’s band dispersion. Note that the scale of wave number (horizontal axis) reduces as the rotation angle decreases. Dirac point energy is set to zero [51].
Applsci 04 00207f5
Figure 6. The deep potential due to the displacement of the ions by a phonon is screened by the flow of electrons [1].
Applsci 04 00207f6
Figure 7. The Fröhlich Hamiltonian includes an interaction term in which an electron is scattered from k′ to k with either (a) emission or (b) absorption of a phonon. In each case the total momentum is conserved.
Applsci 04 00207f7
Figure 8. The Fröhlich Hamiltonian includes an interaction term in which an electron is scattered from k′ to k with either (a) emission or (b) absorption of a phonon. In each case the total momentum is conserved.
Applsci 04 00207f8
Figure 9. The two possible vector (a) q = Γ and (b) q = K that can connect two electronic states in the Fermi surface (red dots) in graphene.
Applsci 04 00207f9
Figure 10. (a) Possible (EF = 0) and not possible (EF ≠ 0) AV q = 0 processes for e-h pair creation (annihilation) due to phonon (with energy ħωq) absorption (emission); (b) possible (EF = 0 and EF ≠ 0) q = 0 (measured from the K point) EV processes; (c) not possible (EF = 0) and possible (EF ≠ 0) AV processes and (d) possible EV processes for electron-hole pair creation (annihilation) due to phonon (with energy ħωq) absorption (emission) when the phonon wave-vector is not zero (q ≠ 0). Eeh is the e-h pair energy and EKK′ is the energy required to translate an electron from K to K′; (e) The frequency ωG hardening and (f) decay width γG narrowing for the G band Raman feature as a function of gate voltage Vg. The insets in (e) and (f) are theoretical predictions of the EF dependence of ω q ω q 0 and γq for an AV q = 0 process; (g) The Vg dependence of the 2iTO (q = 2k) ωG′ and γG′. The inset in (g) shows illustrative predictions for the Vg-dependence of the phonon frequency correction ω q ω q 0 (black solid line) and the corresponding decay width γq (grey dashed line) when q ≠ 0, both as a function of EF. The ω q ω q 0 and γq values in (g) were normalized to illustrate the concept of ωq softening and γq broadening [60].
Applsci 04 00207f10
Figure 11. (a) Schematic view of the backgate graphene device. A variable voltage Vg can be applied between the graphene and the silicon substrate. The device is treated as a parallel plate capacitor where the silicon oxide layer is the dielectric medium; (b) Schematic view of topgate graphene devices using electrochemical polymers.
Applsci 04 00207f11
Figure 12. (a) When EF = 0, only interband electron-hole pair creation by the absorption of a phonon is allowed; (b) When EF ≠ 0, intraband electron-hole pair creation by the absorption of a phonon are also allowed [69].
Applsci 04 00207f12
Figure 13. Calculated frequency shift (full lines) and broadening (dashed lines) for the (a) in-phase and (b) out-of-phase lattice vibrations of bilayer graphene as a function of the Fermi energy for two different values of crystal disorder δ [69].
Applsci 04 00207f13
Figure 14. Inversion symmetry-breaking induced phonon mixing. Evolution of the G+ (full lines) and G (dashed lines) (a) relative intensity; (b) line width and (c) frequency with carrier concentration and Fermi energy. The vertical dotted lines indicate a special position of the Fermi level, 0.1 eV, that corresponds to half of the G-band energy. Figure adapted from Reference [72].
Applsci 04 00207f14
Figure 15. The Vg dependence of (a) ωLOZO′(+) and (b) ωLOZO′(); The insets show the Vg dependence of γLOZO′ (+) and γLOZO′ (); (c) The LOZO′ mode is resonant with both electronic bands; the π1( π 1 *), giving rise to the LOZO′(+) resonance and the π2( π 2 *) giving rise to the LOZO′() resonance; (d) The Vg dependence of ω2LO. The inset shows the Vg dependence of γ2LO; (e) Density of electronic states of 2LG for the valence bands π1 and π2 (black curves) and for the conduction bands π 1 * (red curve) and π 2 * (blue curve); (f) LOZA (P1) and LOZO′ (P2) combination modes and the 2ZO (P3) overtone as they appear in the Raman spectra taken with the 532 nm laser line. The solid lines are Lorentzian curves used to fit the spectrum. The upper and lower boxes show the lattice vibrations associated with each normal mode involved in the combination modes and overtones [63].
Applsci 04 00207f15
Figure 16. (a) and (b) show, respectively, the Vg dependence of ωLOZA, ω2ZO for the q ≈ 2k AV process and (c) shows Vg dependence of ω2ZO for the q ≈ 0 AV process. The insets show the Vg dependence of the line widths γLOZA, γ2ZO for the q ≈ 2k AV process ((a) and (b); respectively) and γ2ZO for the q ≈ 0 AV process (c).
Applsci 04 00207f16
Figure 17. (a) Optical image of the graphene with a 13C-based add-layer (darker hexagonal area delimited by the dotted line) on the SiO2/Si substrate. The diameter of the hexagon is about 10 μm. Note that the center (small area delimited by the gray dotted lines) of the add-layer forms a 12/12C AB-2LG structure, while the remaining area is formed by 13/12C AB-2LG; (b) G′ (2D) mode Full Width at Half Maximum (FWHM) identifying the 12C 1LG region (FWHM 30 cm1), the 12/12C AB-2LG region (FWHM 45 cm1) and the 12/13C AB-2LG region (FWHM 75 cm1) [75].
Applsci 04 00207f17
Figure 18. (a) In-situ Raman spectro-electrochemistry of the 12/13C t-2LG G modes and (b) In-situ Raman spectro-electrochemistry of the 12/13C AB-2LG G modes. The spectra are excited by 2.33 eV laser excitation energy and the electrode potentials range from 1.5 to 1.5 V vs. Ag/Ag+ (from bottom to top) in units of 0.1 V. The red dashed curves are guide to eyes. Note that, due to electrochemistry conventions, positive potentials are filling the system with holes while negative potential are filling the system with electrons; (c) and (d) Fitting analysis of the spectra showed in (a) and (b); (c) The frequency and linewidth behavior of the LG mode (left panel) and HG (right panel) in t-2LG as a function of the electrode potential; (d) The frequency and linewidth behavior of the LG mode (left panel) and HG (right panel) in AB-2LG as a function of the electrode potential. All insets present information on the intensity dependence with the electrode potential [75].
Applsci 04 00207f18

