
Hybrid Energy Scheduling in a Renewable Micro Grid

1
School of Electrical and Electronic Engineering, North China Electric Power University, Beijing 102206, China
2
School of Economics and Management, North China Electric Power University, Beijing 102206, China
*
Author to whom correspondence should be addressed.
†
These authors contributed equally to this work.
Appl. Sci. 2015, 5(3), 516-531; https://doi.org/10.3390/app5030516
Submission received: 14 July 2015
/
Revised: 25 August 2015
/
Accepted: 28 August 2015
/
Published: 8 September 2015
(This article belongs to the Special Issue Smart Grid: Convergence and Interoperability)
Abstract
:In this paper, we address the energy scheduling issue in a hybrid energy micro grid, which consists of photovoltaic (PV), wind power, combined heat and power (CHP), energy storage and electric vehicles (EVs). The optimal scheduling model of these power sources is presented with consideration of the demand response. The objective function is minimum total operation costs, including gas cost, electric power purchase from the main grid and storage and EV charging-discharging costs. In the process of optimization, multi-team particle swarm optimization (MTPSO) is proposed, which uses units, groups and swarm information to update the velocity (position) with faster and more stable convergence. With simulation analysis, it is found that the proposed model is effective, and the presented MTPSO has a better global search ability than PSO.
1. Introduction
1.1. Background
Among all of the severe problems confronting mankind in the 21st century, including the aggravation of human society’s dependence on energy, the exhaustion of fossil resources, climate change and environmental problems, the energy crisis, which had arisen in the 1970s, deserves priority concern. Seeking for new energy sources that are sustainable and clean and that can enhance the efficiency of energy utilization is an urgent mission [1,2].
A micro power grid, directly connecting distributed generation units, electric power network and end users in local area, can effectively optimize and improve the efficiency of energy utilization and provide flexibility, controllability and economic efficiency of power system operation. It is thus in rapid development and has become an effective way of distributed energy integration. There is vast solar and wind resource in the northern region of China, where thermal load demand is also great. The micro grid consisting of combined heat and power (CHP) generation and renewable energy, including wind and photovoltaic (PV) power, has a bright development prospect for its advantages in economic efficiency, applicability and reliability. By 2035, renewable energy will account for nearly half of global generation capacity growth, among which intermittent power supply based more on wind and PV is proportionally 45%. China will be the largest country in increments of the absolute amount of renewable energy generation, exceeding the total amount of the European Union, America and Japan, according to the International Energy Agency (IEA) World Energy Outlook 2013. With the rapid development of energy storage devices and electric vehicles (EVs), which can manage bidirectional energy flow between the power system and the vehicle, new requirements emerge for optimal scheduling of micro grid considering the demand side management (DSM) and EV connection.
Based on the power and heat supply of the CHP micro grid, the model of mixed energy integrated optimization scheduling considering EVs and DSM mode is constructed in this paper. In the model, the objective function is designed as minimum total operation costs, and the output of each distributed power source is set as an optimization variable. The multi-team particle swarm optimization (MTPSO) algorithm, which can improve the global search capability, is proposed, and a simulation study is conducted in a case system to show the feasibility of the proposed method.
1.2. Literature Review
So far, much research has been developed, mainly focusing on the optimal operation scheduling under different loading conditions and objectives. An IEMS (intelligent energy management system) is proposed for an optimal CHP-based micro grid in [3], and the IEMS aims to find the optimal set points of renewable distributed units, the CHP unit and energy storage systems. In [4], a hybrid PSO algorithm based on a CLS (chaotic local search) mechanism and FSA (fuzzy self-adaptive) structure is utilized to improve the optimization process. In [5], the author reported his work on microgrid operation at the UC Irvine campus during January 2009–December 2013. In [6], a DER-CAM (distributed energy resources customer adoption model) optimization technique is proposed to minimize the cost of a microgrid with CHP system.
The energy storage system (ESS) is designed to store energy when production exceeds demand and to make it available at the user’s request. Much research focusing on the modeling and scheduling of storage facility in microgrids has been carried out. In [7], a typical dispatch model is proposed to minimize the total operation cost of the microgrid. In [8], an energy management system for ESS in microgrids is presented. Furthermore, the optimal charging schedule of EVs has attracted much research attention. In [9], a closed-form solution is proposed for the stochastic optimization problem that is formulated to schedule EVs’ charging with uncertain departure times under hourly time-of-use pricing tariffs. In [10], a detailed review of vehicle-to-grid (V2G) technology in conjunction with various charging strategies of EVs is presented.
In microgrids, it is an existing challenge to adopt appropriate DSM programs to balance the power supply and demand effectively [11,12]. The benefits of DSM are quantified in terms of the ability of demand-responsive loads to relieve upstream network constraints and to provide ancillary services, i.e., operating reserve [13]. An energy management strategy from both the demand side and generation side to realize the objectives of meeting the electricity demand is addressed in [14].
The PSO algorithm is widely used in micro grid scheduling optimization.In [15], the PSO algorithm is employed for system optimization scheduling. In [16], Monte Carlo simulation of the particle swarm optimization (MCS-PSO) algorithm is employed to study the uncertainty of multidimensional network operation optimization scheduling. However, it is proven that the PSO algorithm is apt to fall into local optima in the optimization process. This paper proposes the MTPSO algorithm, which has a stronger global and local search ability, faster convergence and higher accuracy to solve the dispatch optimization issue in micro grid. The contribution of this paper is two-fold. First, we construct the approximate theoretical model of a micro grid system for scheduling optimization issue study. Second, we present a case study in areal micro grid located in North China to compare the performance of MTPSO and PSO in scheduling optimization and to prove the performance of the MTPSO algorithm.
2. Hybrid-Energy Micro Gird Modeling
2.1. Thermal System Modeling
CHP modeling: A micro gas turbine CHP system has two kinds of operation models, namelythe power load-based model and the heat load-based model. The former gives top priority for power load demand, while the latter firsts meet heat load demand. The CHP system is stable and economic, but the micro gas turbine (MT) has a strong ability to adapt to external load changes in the power load-based operation model. The mathematical model of the CHP system with a micro gas turbine can be expressed as follows [17]:
where RMT(u) is the gas turbine exhaust heat at time u; ηe(u) is the power generation efficiency of the gas turbine at time u; η1 is the heat loss coefficient of the gas turbine engine; Qe(u) is the output of the electric power of the gas turbine at time u; Rhe(u) is the heating capacity provided by the waste heat of flue gas from the gas turbine at time u; Lhe is the heat exchanger coefficient; WMT is the consumption of natural gas for the gas turbine; ∆u is the running time of the gas turbine; and M is the low calorific value of natural gas, taking a value of 9.7 kWh/m3.
Gas boiler modeling: The natural gas consumption of the gas boiler depends on the size of the thermal load with Qheat-load and the thermal efficiency of the boiler with ηboiler. The thermal efficiency is the key economic indicator in the design and operation of the boiler, which shows the improvement of boiler equipment technology and operation management level. In general, the thermal efficiency is taken as 0.88 [18]. Natural gas consumption Wboiler can be calculated as [18]:
where M is the calorific value of natural gas.
2.2. Renewable Generation Modeling
PV generation is affected by the intensity of solar radiation, so the output of PV is intermittent in nature. PV solar generation modeling: solar energy is the energy radiated by the Sun, which is harnessed by tapping light photons to generate electrons. The PV system consists of a photovoltaic array, which converts the light photons falling on it to electrons. This generates a DC current, which can be boosted with DC-DC converters and then inverted to deliver AC power to the loads. Usually, a silicon PV module output depends on many variables, including the type of material, temperature and solar radiance incident on the surface of the module. Its output can be expressed as follows [19]:
where Ppv is the output power of the PV cells; PSTC is the maximum test power of PV cells in standard test conditions (the light intensity is 1000 W/m2, and the environment temperature is 25 °C). k is the power-temperature coefficient, which is −0.47%/K. Tc is the working temperature of the solar panels. Tref is the reference temperature, which is set as 25 °C.GT is the light intensity. GSTC is the light intensity in standard text conditions, which is 1000 W/m2.
where Ta is ambient temperature (in °C), G is the global solar radiation incident on a horizontal plane (in kW/m2) and NOCT is the normal operating cell temperature, which is approximately 48 °C [18,19].
Wind power is influenced by wind speed, so the output of wind power is also intermittent in nature.A wind energy system is a structural energy arrangement to utilize the kinetic energy of blowing wind by using an aerodynamic machine. A wind turbine’s output power is determined by the area of the turbine blades, the wind speed and the wind density of the surrounding air. However, for a fixed location, the expression for the output power of a wind turbine can be related to the wind speed with the following function [20]:
where vci, vr and vco are the cut-in speed, rated speed and cut-off speed of the wind turbine (WT), respectively.
2.3. Storage Battery Modeling
The battery is the common form of energy storage in a micro network, and battery energy has the characteristics of bidirectional flow and fast power response, which make it a good frequency adjustment source in a micro grid to provide real-time dynamic balance. It has a positive significance for improving the power quality of the micro grid and ensuring stable operation.
This paper uses a lead-acid battery as the energy storage system. The battery charging state is an important technical parameter to reflect the remaining power. The value of SOC at time t + ∆t is related to the value of SOC at time t, and the charge and discharge power of the battery can be expressed as [21]:
where St and St + ∆t are the values of SOC at the moment of t and t + ∆t; Pbat − t is the battery power between t and t + ∆t; Cbat is the accumulator capacity.
The battery duration will be consumed in the process of charging and discharging. Thus, the battery duration loss costs ought to be considered in addition to charging and discharging costs. Different depths of charging and discharging have different effects on battery duration. When considering the battery type, the battery duration loss cost in a charge and discharge process can be expressed as:
The cycle times are related to the discharge depth of the lead-acid battery, which can be expressed as:
where N is the equivalent cycle number when the depth of discharge is DN; a1, a2, a3, a4 are correlation coefficient factors and are parameterized as −16.27, 2.679, 4110 and −1.85, respectively.
2.4. EV Modeling
As a new generation of vehicles, EVs have incomparable advantages compared to traditional cars in the aspects of energy conservation, emission reduction and reducing human’s reliance on traditional fossil energy. EVs have dual characteristics of “power” and “load”, as a storage battery connected to the power grid. Within the micro grid, EVs, which have signed a contract on demand management (scheduling), can be scheduled by the energy manager.
The charge cycle of an EV can be expressed as follows:
where CCEV is charge cycle; M is mileage; ec is the efficiency coefficient; and Md is the daily mileage of the EV.
EV charging and discharging power are related to the battery characteristics and charging state. Charging and discharging characteristics of EVs are assumed similar to an energy storage battery.
2.5. Load Demand Response Modeling
Demand management covers the whole range of demand-side resources, from direct load control to responsive demand based on dynamic pricing. Smart grid innovations are making demand management both technologically feasible and economically viable, and demand management is expected to play a key role in the value proportion of the future power grid.
The demand side response under the time-of-use (TOU) electricity price strategy is considered in this paper. According to different power demand management measures and in an interactive way, we define the “cross elasticity of demand” in the power load as the transferable load. The combined load model of the transferable load is:
where i = 0, 1, 2…23 refer to 24 h in a day; d(i) the electricity demand of power user; P(j) the price of electricity users; A(i) incentive allowance; E(i) cross-price elasticity.
3. Optimal Scheduling Modeling
3.1. Objective Functions
In the CHP hybrid energy system, the system’s operation costs mainly include fuel costs (gas turbine and gas boiler), system power purchase costs and the costs of charging and discharging (including the duration loss of energy storage batteries and EVs). Once wind and PV units are built, the operation and maintenance cost have a small impact on the running output. Without losing generality, we include operation and maintenance cost in the objective function. However, for simplicity, we ignore it in the case study. Hence, the case study is only a simplified representation of the theoretical model. The objective function is designed as follows:
where C is the total operation costs; Cep and Cgs are the costs for purchasing electricity and gas, respectively; Com is the operation and maintenance cost for generation units; Cso is the costs for storage and EV charging-discharging. The electricity purchase cost can be calculated as:
where H is the time number of the dispatching cycle; Ptgrid is the electricity quantity purchased from the power grid at time t = 1, 2,…H, which is negative when the system sells electricity to the power grid. Additionally, ctec is the electricity price at time t. The gas cost can be calculated as Equation (13):
In Equation (14), Cm is the initial total investment of generation units, Cs is the sunk costs and Cop is the operation and maintenance cost. In Equation (15), Cstorage and Cev are the costs for the storage battery and EV, which can be calculated according to Equation (7).
3.2. Constraints
(a) The electric power balance constraints:
where PD(t) is the micro grid power load demand at time t; PG(t) is the total power output of wind turbines, photovoltaic arrays and gas turbines; Pst(t) and PEV(t) are the charging and discharging power of the storage battery and EVs at the moment t, respectively; PGrid(t) is the micro grid injection or output power from/to the main grid at time t.
(b) Distributed generation constraints:
The distributed generators constraint:
Ramping constraints:
Start-off time constraints:
where PGi(t) is the class i generator output power in t time; PGi,min, PGi,max are the lower and upper generator output powers, respectively; Ridown, Riup are the ramping-down and ramping-up speeds of the generator i.
(c) Storage battery constraints:
Capacity constraints:
Charge and discharge power constraints:
where Est,max, Est,min are the upper and lower capacities of energy storage battery; Pch(t), Pdis(t) are the charge and discharge power, respectively; Pdis,max and Pch,max are the maximum limits of charging and discharging power.
(d) Thermal energy constraints:
The thermal power balance:
where QD(t) is the load demand at time t; Qbl(t) and QMT(t) are thermal outputting of the gas boiler and micro gas turbine at time t.
4. Hybrid Energy Optimization Scheduling Based on MTPSO
4.1. Multi-Organization Particle Swarm Optimization Algorithm
Particle swarm optimization (PSO) was first proposed by Kennedy and Eberhart in 1995 [22]. In order to find the optimal solution, social group behavior is simulated in the algorithm, and each individual modifies the group searching direction and speed by its speed, the individual and swarm optima in the iterative process.
As is known, in nature, the normal activity of humans or animals is to collaborate through various systems. The systems are composed of different levels of organizations, and the organization is composed of a large number of cells, the cell being the basic unit of life activities.
Based on this idea, we made the general particle swarm algorithm improvement as follows: a particle swarm is composed of a team including a number of certain particles. Each team has good autonomy and the right to control action or behavior on its own. What is more, they need no external organization intervention, and every organization and particle swarm has information interaction. In the process of optimization, in addition to the effect caused by the speed of its history, a particle should refer to the local optimal point (pbest), the particle swarm global optimal point (gbest) and the optimal point (tbest) of its organization.
Particle i in the k iteration, the d dimensional velocity and position update equation are as follows [22]:
where vidk, c1, c2, xidk, pbestidk, gbestdk have the exact same meanings as in [20]. c3 is the acceleration coefficient (or learning factor) to adjust the maximum step length that the current particle flies in the direction of the best particle. tbestidk is the optimal point of particle i in the d-th teams in the k-th iteration.
It is not hard to see through Formula (23) that, due to the introduction of the organization optimal point, to a certain extent, the optimization space of the particle group is increased and the group of “convergence” weakened. Therefore, the speed of a particle is determined by the speed of its history only when the group optimal point of particle group, the organization optimal point and the individual optimal point of each particle are the same or very close, and the particles will show the “convergence” of the group at this time. Although multi-organization particle group’s search ability has a certain improvement compared to the general one, it still possesses the characteristic of falling into local optima. In order to improve the global searching performance of the particle group further, this paper introduces the idea of mutation, gives the mutation operation of the “convergence” of the particle, ransoms the initialization of the optimal value of individuals, organizations and groups and expands the optimization space of the particles further, while determining whether two individuals “converge” by the Euclidean distance judgment of the two particles.
4.2. Hybrid Energy Optimization Scheduling Based on MTPSO
The output of wind and PV power generation, the charging and discharging power of energy storage batteries and EVs and the output of the micro gas turbine and gas boiler are taken as optimization variables in our model, and the grid power is determined by the balance of the unit output and load demand. Thermal power is determined by the electric power in the micro gas turbine, while the gas boiler output is determined by the thermal load and thermal output of the micro gas turbine.
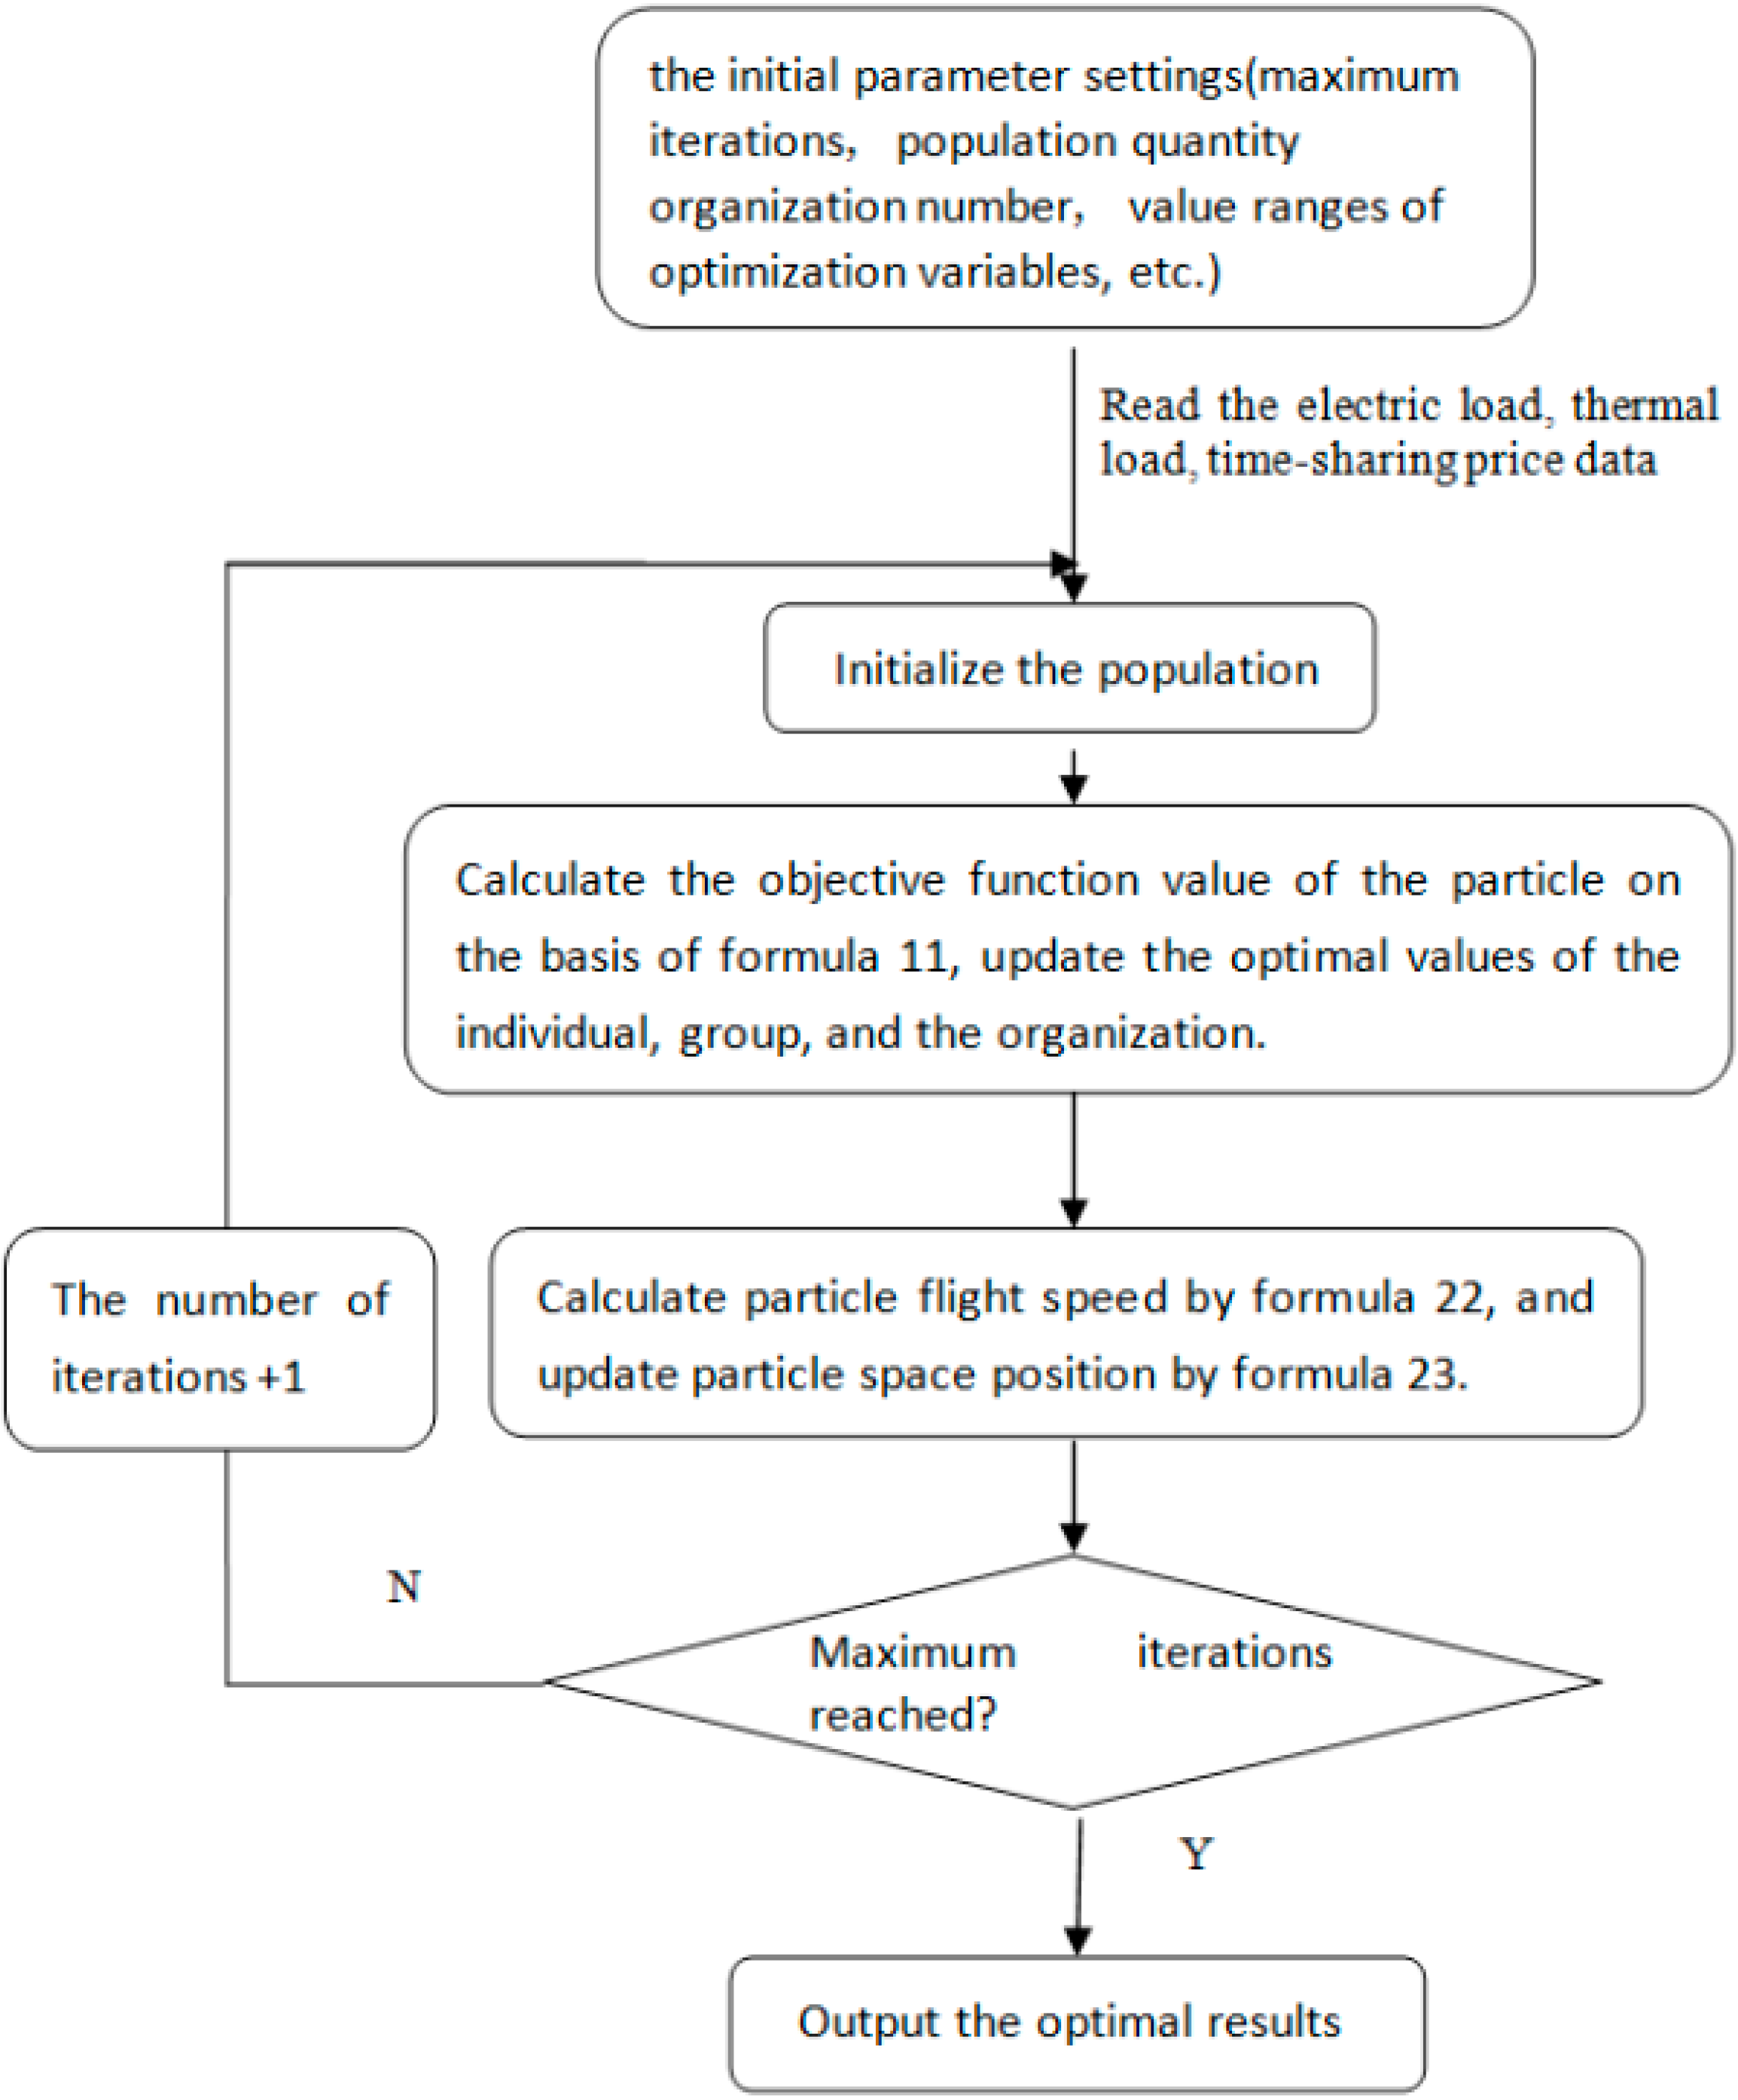
The calculation process of optimal scheduling based on MTPSO can be described as Figure 1.
Figure 1.
The flow chart of hybrid energy optimal scheduling.

5. Case Study
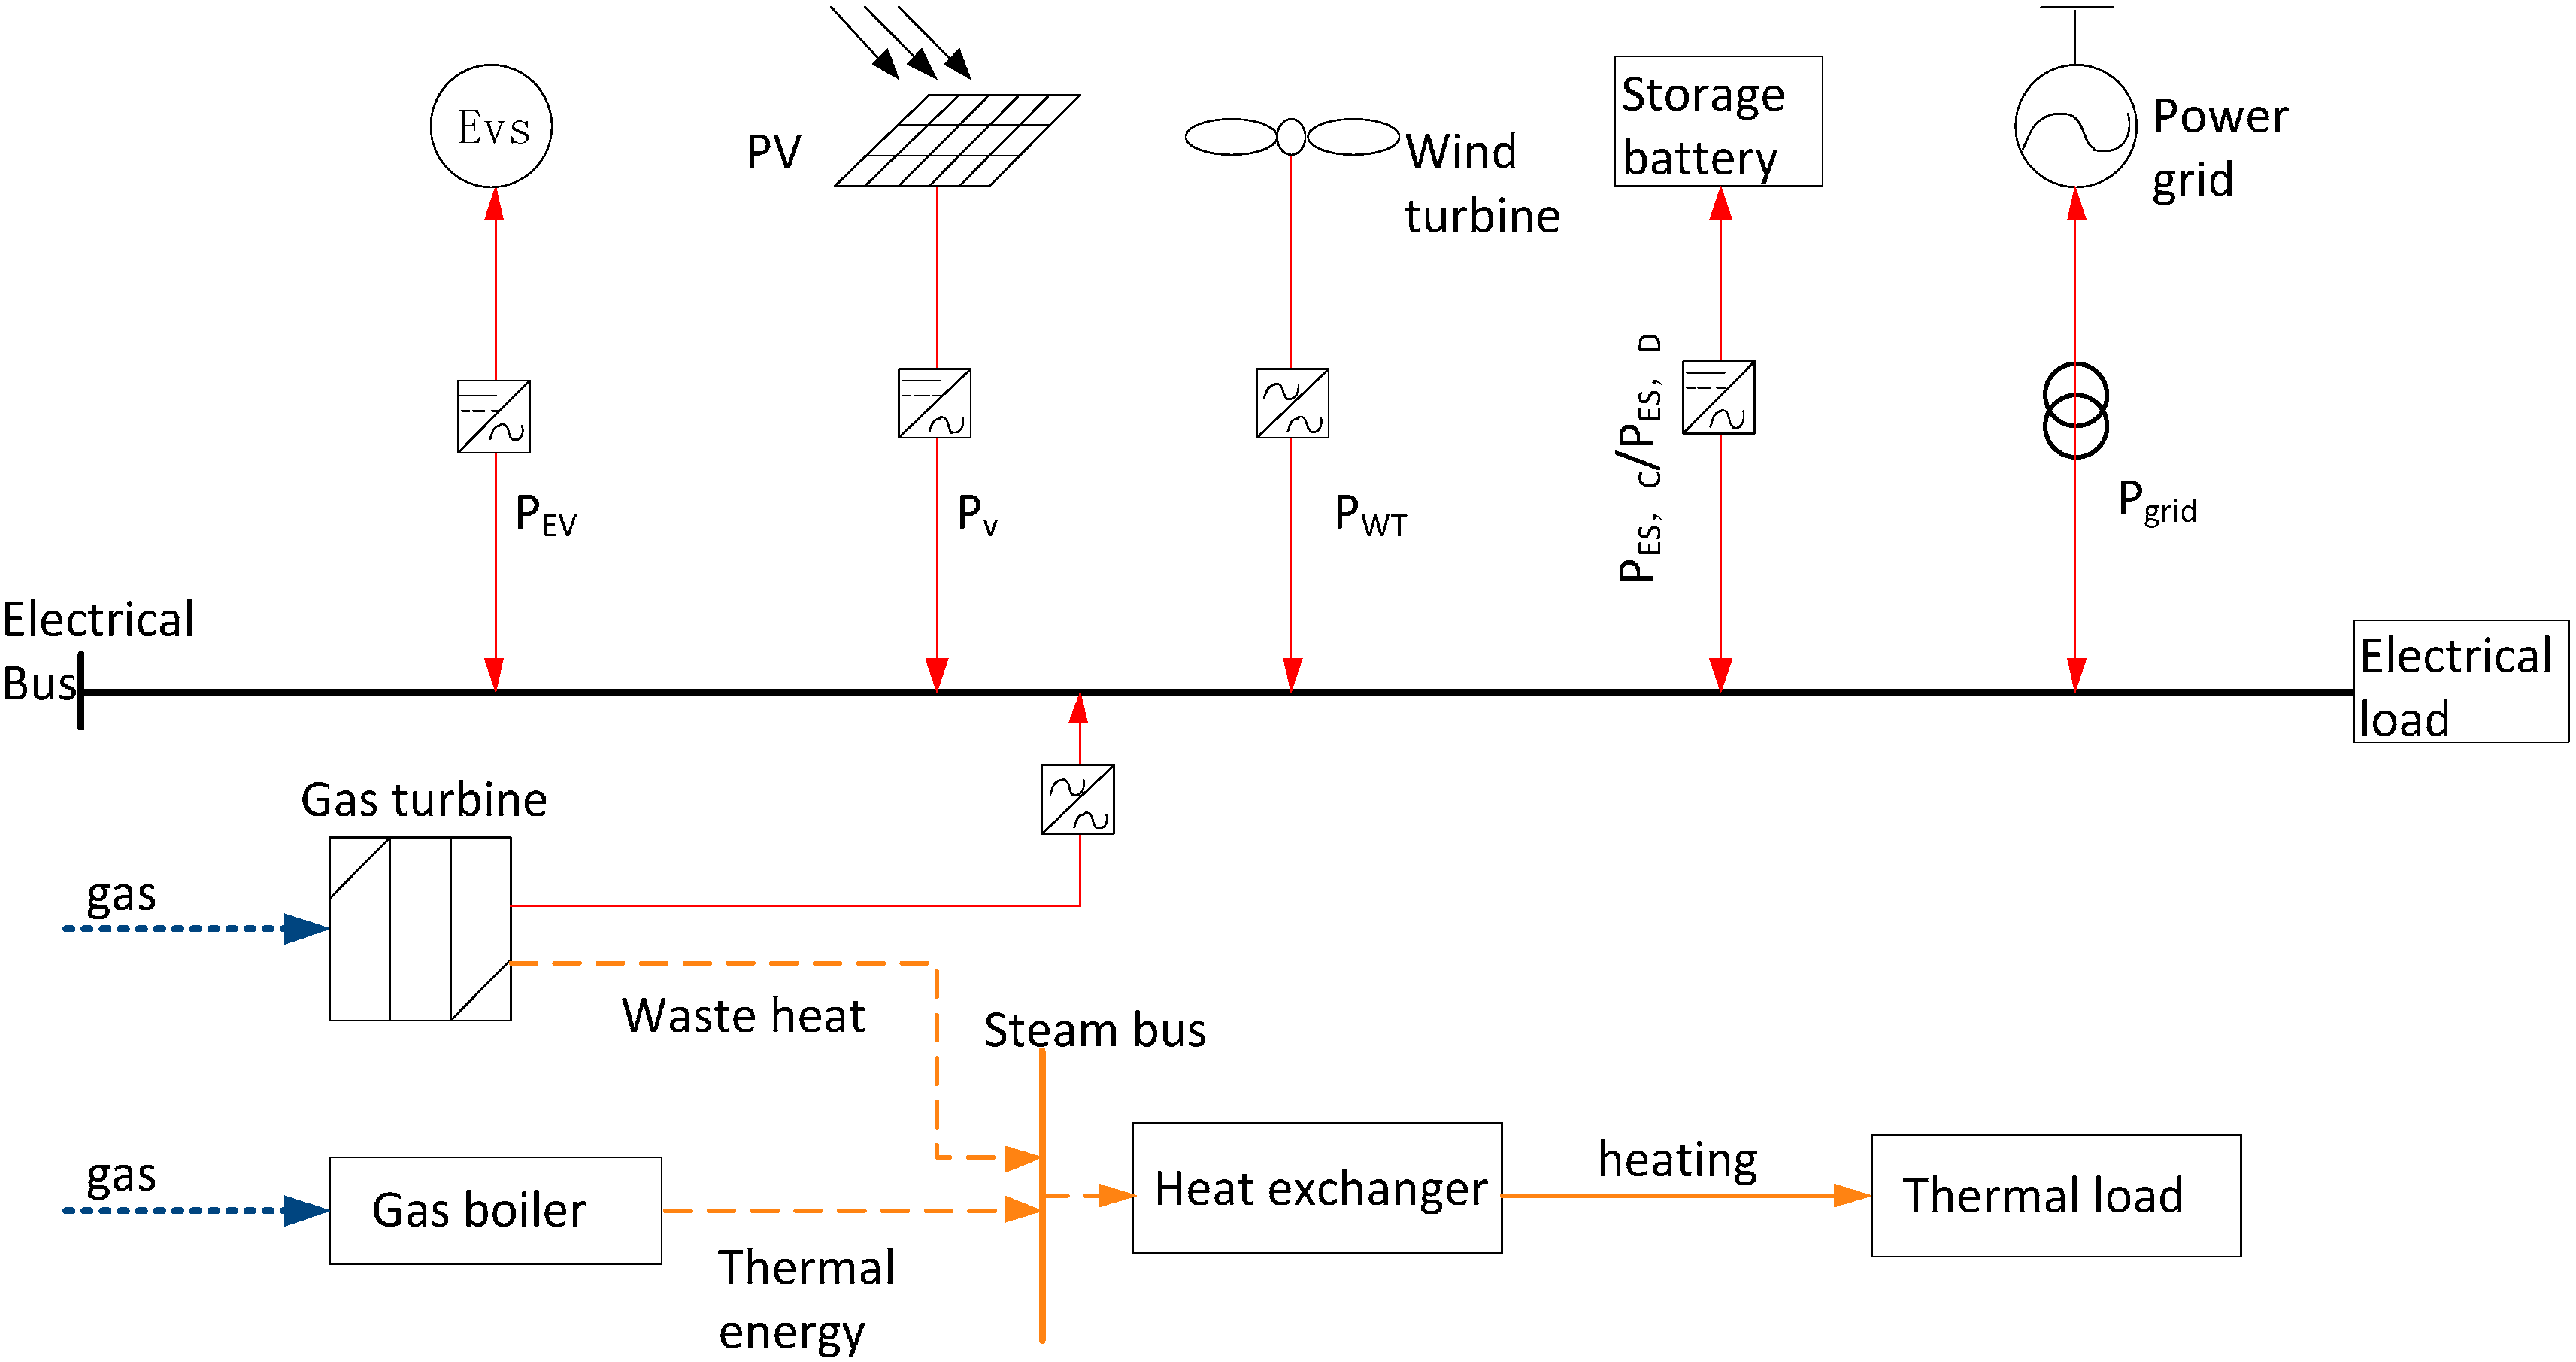
A micro grid in North China consists of a small factory, a market place and a residential building with 265-kW and 313-kW electric and thermal loads, respectively. The micro grid is provided by two C65 micro gas turbines, and the storage battery is made up of 60 cascaded 12-V/200-Ah VRL batteries with a maximum charging power of 20 kW and maximum discharging power of 40 kW. There are 20 EVs in the micro grid. Ten percent of EVs follow the schedulable contracts (charging-discharging), and the rest can be only charged. The distance per charge of an EV is 250 km, and the efficiency coefficient is set as 0.67. The travelled distance per day is 24.5 km, and the charging interval is seven days. Hence, there are two schedulable EVs per day and three EVs taken as the power load. The maximum power of the polycrystalline silicon PV array is 100 kW; the rated power of the micro wind turbine is 150 kW; and the rated power of the gas boiler is 300 kW. The topology of the micro grid system is illustrated in Figure 2.
Figure 2.
Hybrid energy microgrid system chart.
The unmet thermal load is balanced by the gas boiler (GB). The ramping constraint of the generator unit is presented in Table 1. The purchasing price and selling price of electricity of the microgrid in operation are presented in Table 2.

| Type | Pmin/kW | Pmax/kW | Rdown/(kW·min−1) | Rup/(kW·min−1) |
|---|---|---|---|---|
| MT | 5 | 65 | 5 | 10 |
| GB | 0 | 300 | 3 | 8 |
| WT | 0 | 150 | - | - |
| PV | 0 | 100 | - | - |
The original investment is much larger than operation costs. We did not take the initial investment costs into consideration and mainly focused on the operational cost difference in the five operation modes.
5.1. First Scenario (Mode1: Electric and Thermal Power Supplied Separately)
In this mode, the heat load is supplied by the gas boiler separately; wind and solar power ought to provide priority to supply loads in the micro grid, and the residual is supplied by system. The daily operating expenses of the system are 3204 RMB. The capacity of wind and PV power generation are 1787 and 720 kWh; the power consumption of the system is 1734 kWh; the cost is 1702 RMB; while the gas purchase volume is 501 m3,costing 1502 RMB.
| Pwt | Ppv | Pgt1 | Pgs2 | Pst | Pev | Pgd | PriceIn | PriceOut | Pload | |
|---|---|---|---|---|---|---|---|---|---|---|
| 1 | 71.4 | 0 | 62.8 | 62.8 | −20 | −15 | 0 | 0.4 | 0.36 | 130.3 |
| 2 | 71.5 | 0 | 56.8 | 56.8 | −20 | −15 | 0 | 0.4 | 0.36 | 100 |
| 3 | 66.8 | 0 | 52.6 | 52.6 | −20 | −15 | 0 | 0.4 | 0.36 | 90.2 |
| 4 | 68.1 | 0 | 40.5 | 40.5 | −20 | −15 | 0 | 0.4 | 0.36 | 86.4 |
| 5 | 67.9 | 0 | 47.5 | 47.5 | −20 | −15 | 0 | 0.4 | 0.36 | 96.9 |
| 6 | 82.1 | 0 | 41.4 | 41.4 | −20 | −15 | 0 | 0.4 | 0.36 | 98.4 |
| 7 | 62.1 | 3.2 | 51.4 | 51.4 | −20 | −15 | 0 | 0.4 | 0.36 | 100.8 |
| 8 | 62.3 | 3.8 | 53.4 | 53.4 | −20 | −15 | 0 | 0.8 | 0.72 | 116.6 |
| 9 | 71.9 | 18.9 | 48.7 | 48.7 | −20 | −15 | 0 | 0.8 | 0.72 | 145.5 |
| 10 | 70 | 67.2 | 15.8 | 15.8 | 0 | 0 | 0 | 1.2 | 1.08 | 172.7 |
| 11 | 69.5 | 95 | 10.0 | 10.0 | 0 | 0 | 0 | 1.2 | 1.08 | 198.8 |
| 12 | 60.8 | 96.9 | 10.0 | 10.0 | 0 | 0 | 0 | 1.2 | 1.08 | 203.9 |
| 13 | 71.5 | 96.7 | 10.0 | 10.0 | 0 | 0 | 0 | 1.2 | 1.08 | 204.7 |
| 14 | 70.1 | 95.8 | 10.1 | 10.1 | 0 | 0 | 0 | 1.2 | 1.08 | 216.1 |
| 15 | 87.7 | 89.5 | 10.3 | 10.3 | 0 | 0 | 0 | 1.2 | 1.08 | 218.7 |
| 16 | 94.9 | 64.9 | 20.1 | 20.1 | 0 | 0 | 0 | 1.2 | 1.08 | 222.1 |
| 17 | 71.1 | 49.7 | 45.2 | 45.2 | 0 | 0 | 0 | 1.2 | 1.08 | 232.2 |
| 18 | 76.4 | 34.4 | 45.7 | 45.7 | 20 | 6 | 0 | 1.2 | 1.08 | 243.3 |
| 19 | 82.3 | 3.7 | 50.6 | 50.6 | 40 | 12 | 0 | 1.4 | 1.26 | 255.8 |
| 20 | 80.4 | 0 | 56.5 | 56.5 | 40 | 12 | 0 | 1.4 | 1.26 | 265.6 |
| 21 | 86.4 | 0 | 46.2 | 46.2 | 40 | 12 | 0 | 1.4 | 1.26 | 248.9 |
| 22 | 78.2 | 0 | 41.1 | 41.1 | 40 | 12 | 0 | 1.2 | 1.08 | 221.2 |
| 23 | 91.2 | 0 | 49.6 | 49.6 | 0 | 0 | 0 | 0.8 | 0.72 | 200.9 |
| 24 | 72.2 | 0 | 50.2 | 50.2 | 0 | 0 | 0 | 0.8 | 0.72 | 170.5 |
5.2. Second Scenario (Mode 2: Hybrid Energy Supply, without Storage, EVs and DSM)
In this mode, the heat load is met by the micro gas turbine and gas boiler together, while wind and solar power ought to supply the power load of the micro grid. In this mode, daily operation costs are 2840 RMB. The purchased electricity from the system is 143 kWh with a cost at 177 RMB; the natural gas purchase is 1065 m3 with a cost of 2663 RMB.
5.3. Third Scenario (Mode3: Hybrid Energy Supply, Storage Batteries Included, without EVs and Demand Response)
In this mode, the heat load supply is the same as Mode 2; wind and solar power ought to supply load in the micro grid, while the residual is supplied by energy storage and the power grid system. In this mode, the daily operation cost is 2674 RMB; the purchase of electricity from the grid is 15.2 KWh, costing 19 RMB; the gas purchase volume is 1011 m3, costing 2527 RMB; and the cost of battery charge and discharge is 128 RMB.
5.4. Fourth Scenario (Mode4: Hybrid Energy Supply, Storage Batteries and EVs Included, the Demand Response Not Considered)
In this mode, the heat load supply is the same as Mode 2, and wind and solar power ought to supply the load to the micro grid. The residual is supplied by energy storage, EVs and the power grid system. The daily operation cost is 2674 RMB, but the purchase of electricity from the grid is not involved. The gas purchase volume is 1010 m3, costing 2626 RMB; the cost of battery charge and discharge is 128 RMB; the cost of EV charging and discharging is 28 RMB. As electric vehicles are connected to the micro grid system, the total system load has increased, followed by a slight increase of the system operating expenses compared to Mode 3.
5.5. Fifth Scenario (Mode5: Hybrid Energy Supply, All of the Factors Considered)
In this mode, heat load supply is the same as Mode 2, and wind and solar power ought to supply load in the micro grid, while the residual is supplied by energy storage, EVs and the power grid system, with demand response. At this time, the daily operation cost is 2625 RMB; the purchase of electricity from the grid is not involved; the gas purchase volume is 989 m3, costing 2470 RMB; the cost of battery charging and discharging is 128 RMB; and the cost of EV charging and discharging is 28 RMB. Due to the adoption of the DSM, the system load has been partly transferred, while the system operating expenses have decreased slightly. The system output is shown in Table 2.
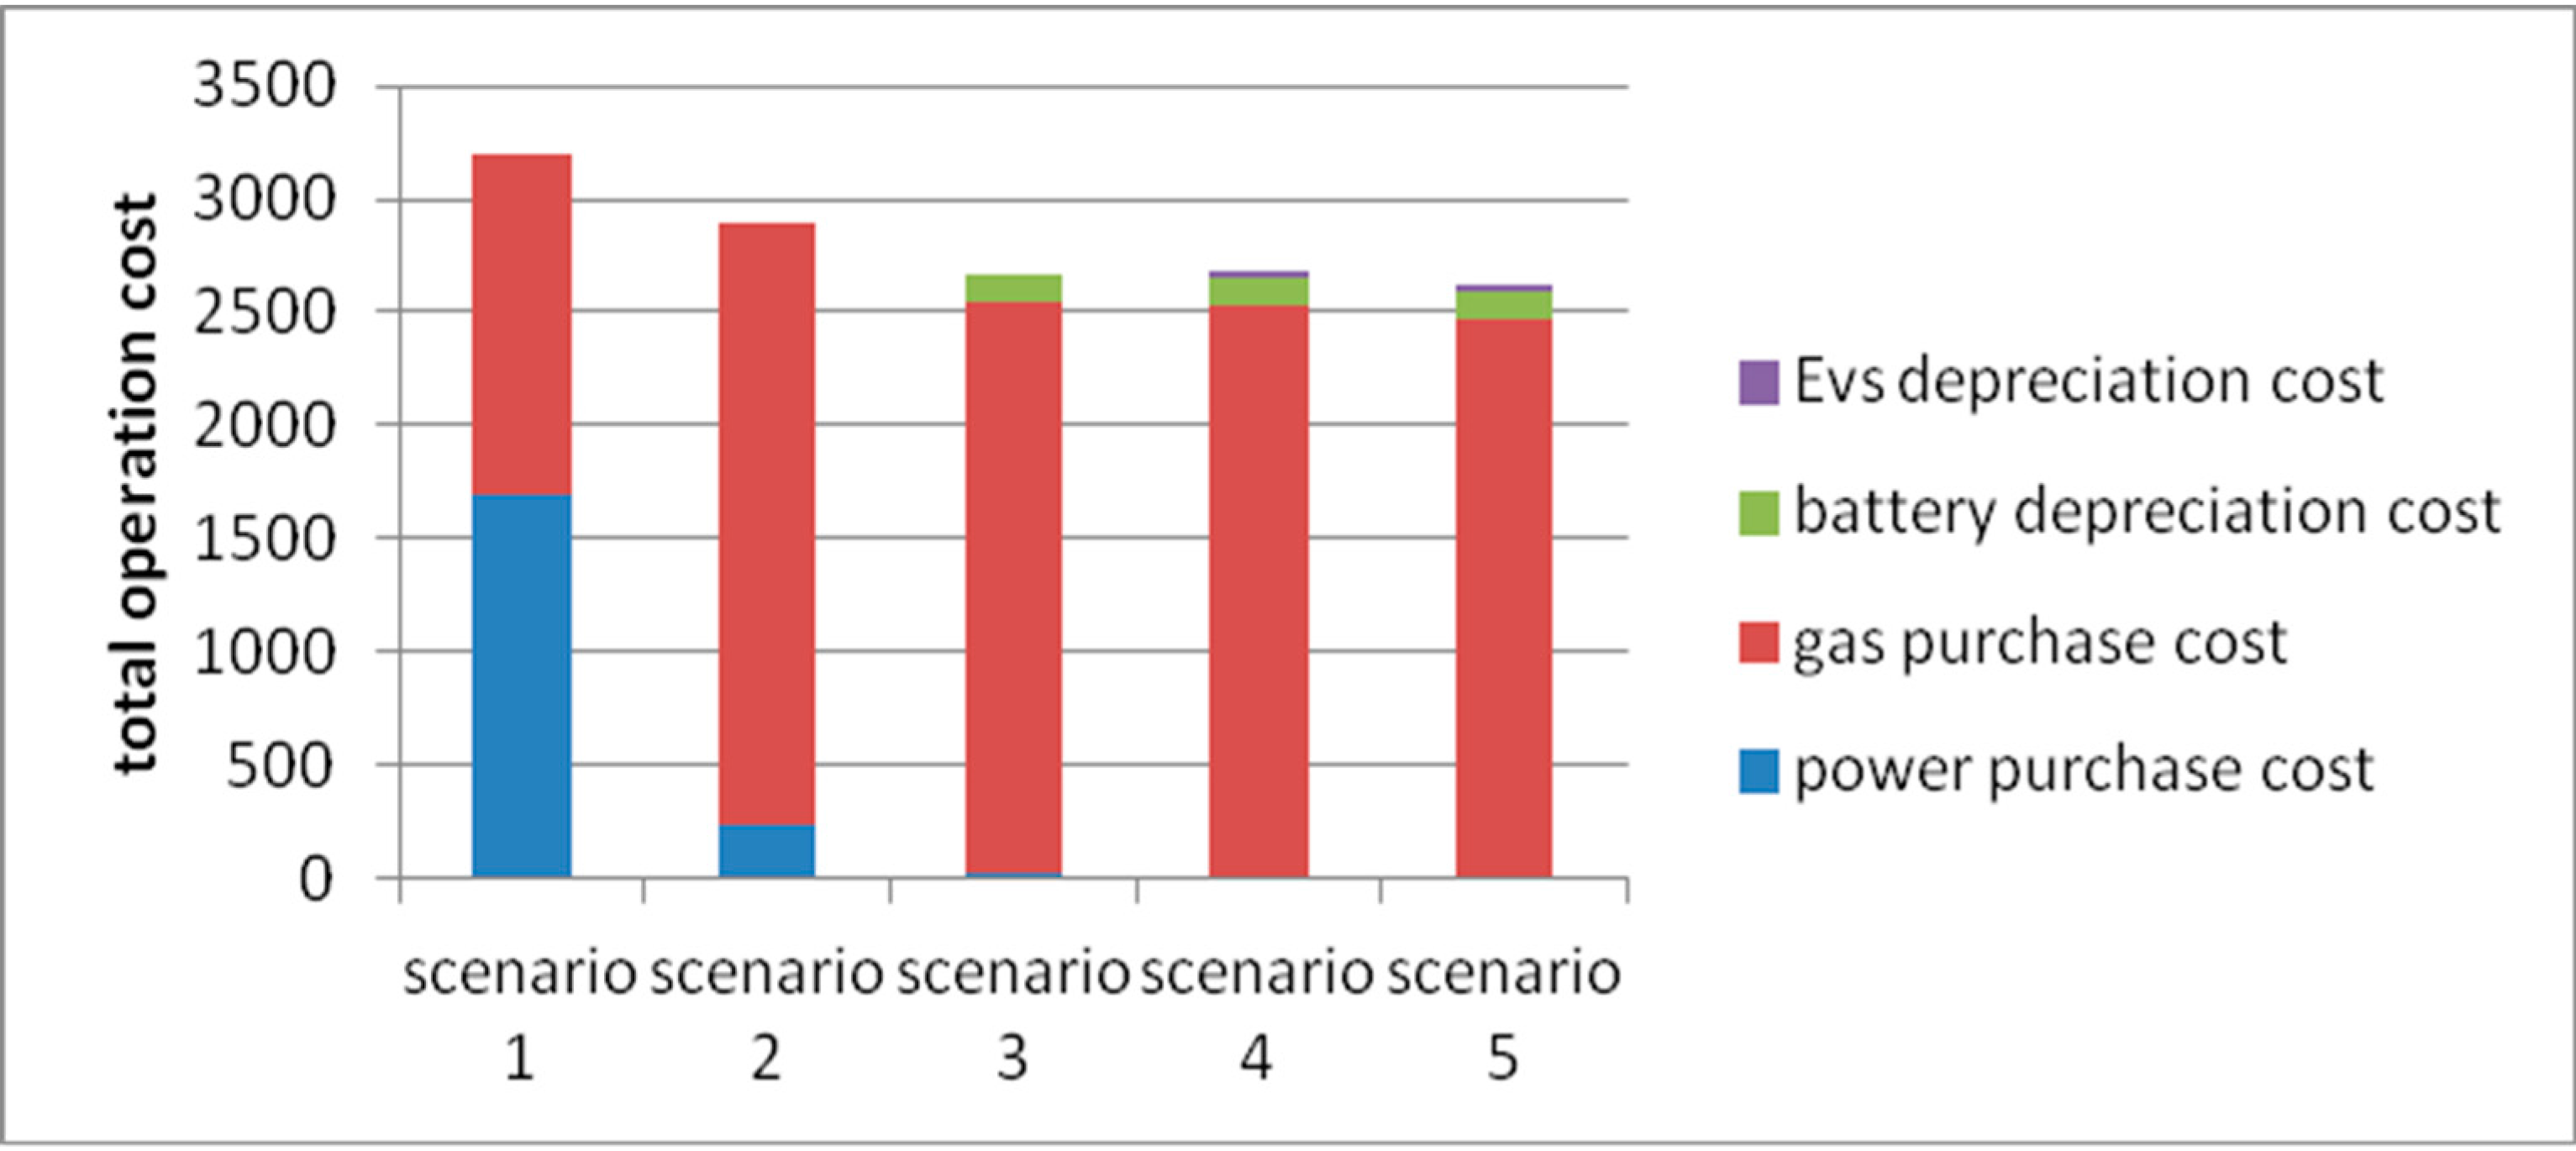
As is shown in the above results, the operation cost is unrelated to the operation mode in a micro grid system once DERs, including wind turbines and PV arrays, are constructed. Wind and solar power ought to be given the priority to supply loads in the micro grid. It can be seen from a comparison between the total operation cost of the cogeneration mode and the separate supply mode that the former has a better economic efficiency, while the efficiency of the hybrid supply system can be increased by 11.36%. The operation cost of the micro grid will be further reduced with the installation of energy-storing devices (Mode 3), yet the construction cost will be increased. Hence, the construction capacity of energy storing devices requires an integrated consideration of both economic efficiency and reliability. EVs that are not schedulable are essentially electric load when connected to the micro grid, while schedulable ones are essentially storage batteries. After taking the EV-connected micro grid operation mode (Mode 4), the operation cost increased by 8 RMB. It is worth noting that the electric demand increased by 27 kWh as three non-schedulable EVs are added to the grid, while the power supply cost of the system reduced from 0.63 RMB/KWh to 0.62 RMB/KWh with a decrease ratio of 1.6%. A part of the peak load is transferred to the valley load after DSM is taken into consideration. The peak-valley difference is reduced from 179.2 kW (a peak of 265 kW at 21:00 and a valley of 86.4 kW at 5:00) to 128.3 kW (a maximum of 242 kW at 21:00 and a minimum of 114 KW at 5:00). The operation cost is reduced to 2625 RMB, with a 2.2% decrease compared to Mode 4. The operation costs in all of the modes are shown in Figure 3.
Figure 3.
The micro grid operation costs in different modes.

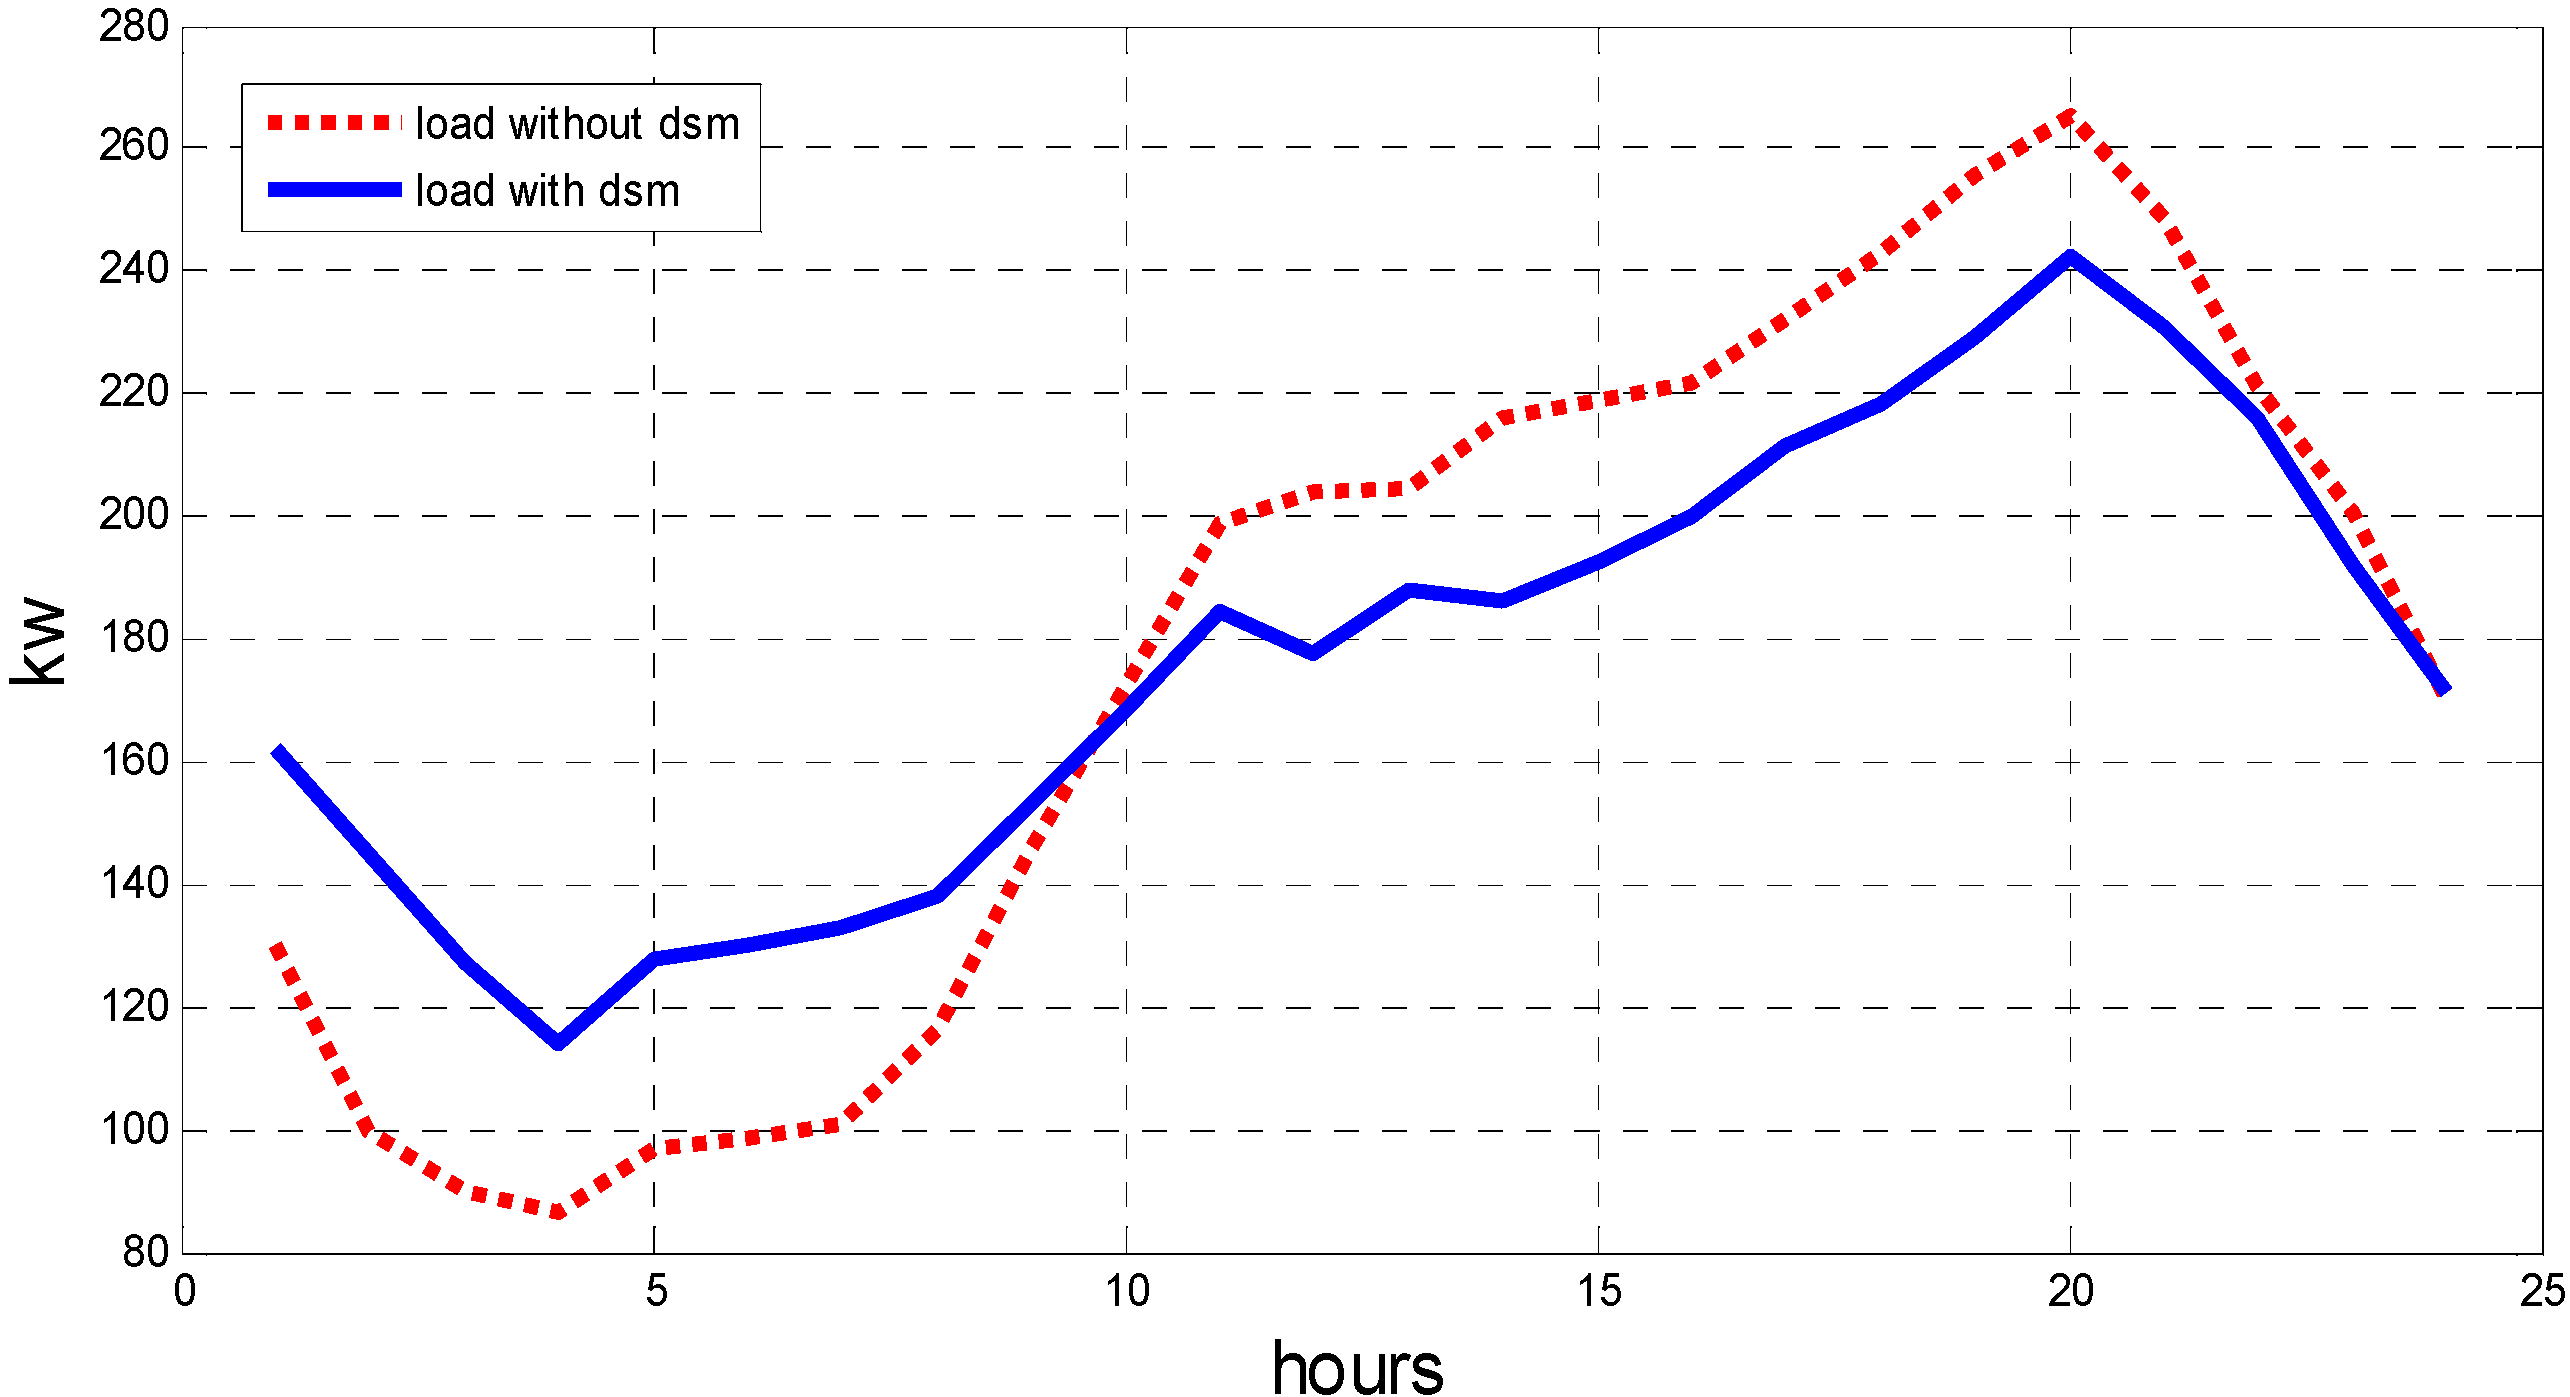
The operation profit of the power supplier in the micro grid under each operation mode is illustrated in Figure 4. The profit in Mode 2 is improved greatly over Mode 1 from 2761 RMB to 3270 RMB. In Mode 3, the system operation cost is reduced, and the system profit increases by 80 RMB, reaching 3350 RMB with a growth rate of 2.45%, because the added storage batteries efficiently adjust the peak-valley load ratio of the system. In Mode 4, the decreasing rate of operation costs is relatively low, since EVs have a much smaller capacity compared to the system load, and the system profit increases slightly by 28 RMB. In Mode 5, the system load is effectively transferred after the DSM is adopted, and the operation cost is further reduced. Since the peak load is reduced, the supplier profit is decreased under this mode. However, the users gain an obvious benefit, with the electricity bill decreasing from 4426 RMB to 4215 RMB. This indicates that the adoption of DSM provides the supplier in the micro grid with no profit from the operation perspective, but the storage device investment can be saved as the load is effectively transferred. The load profile with and without DSM is shown in Figure 5.
Figure 4.
The micro grid profits in different modes.

Figure 5.
Load profile with and without demand side management (DSM).

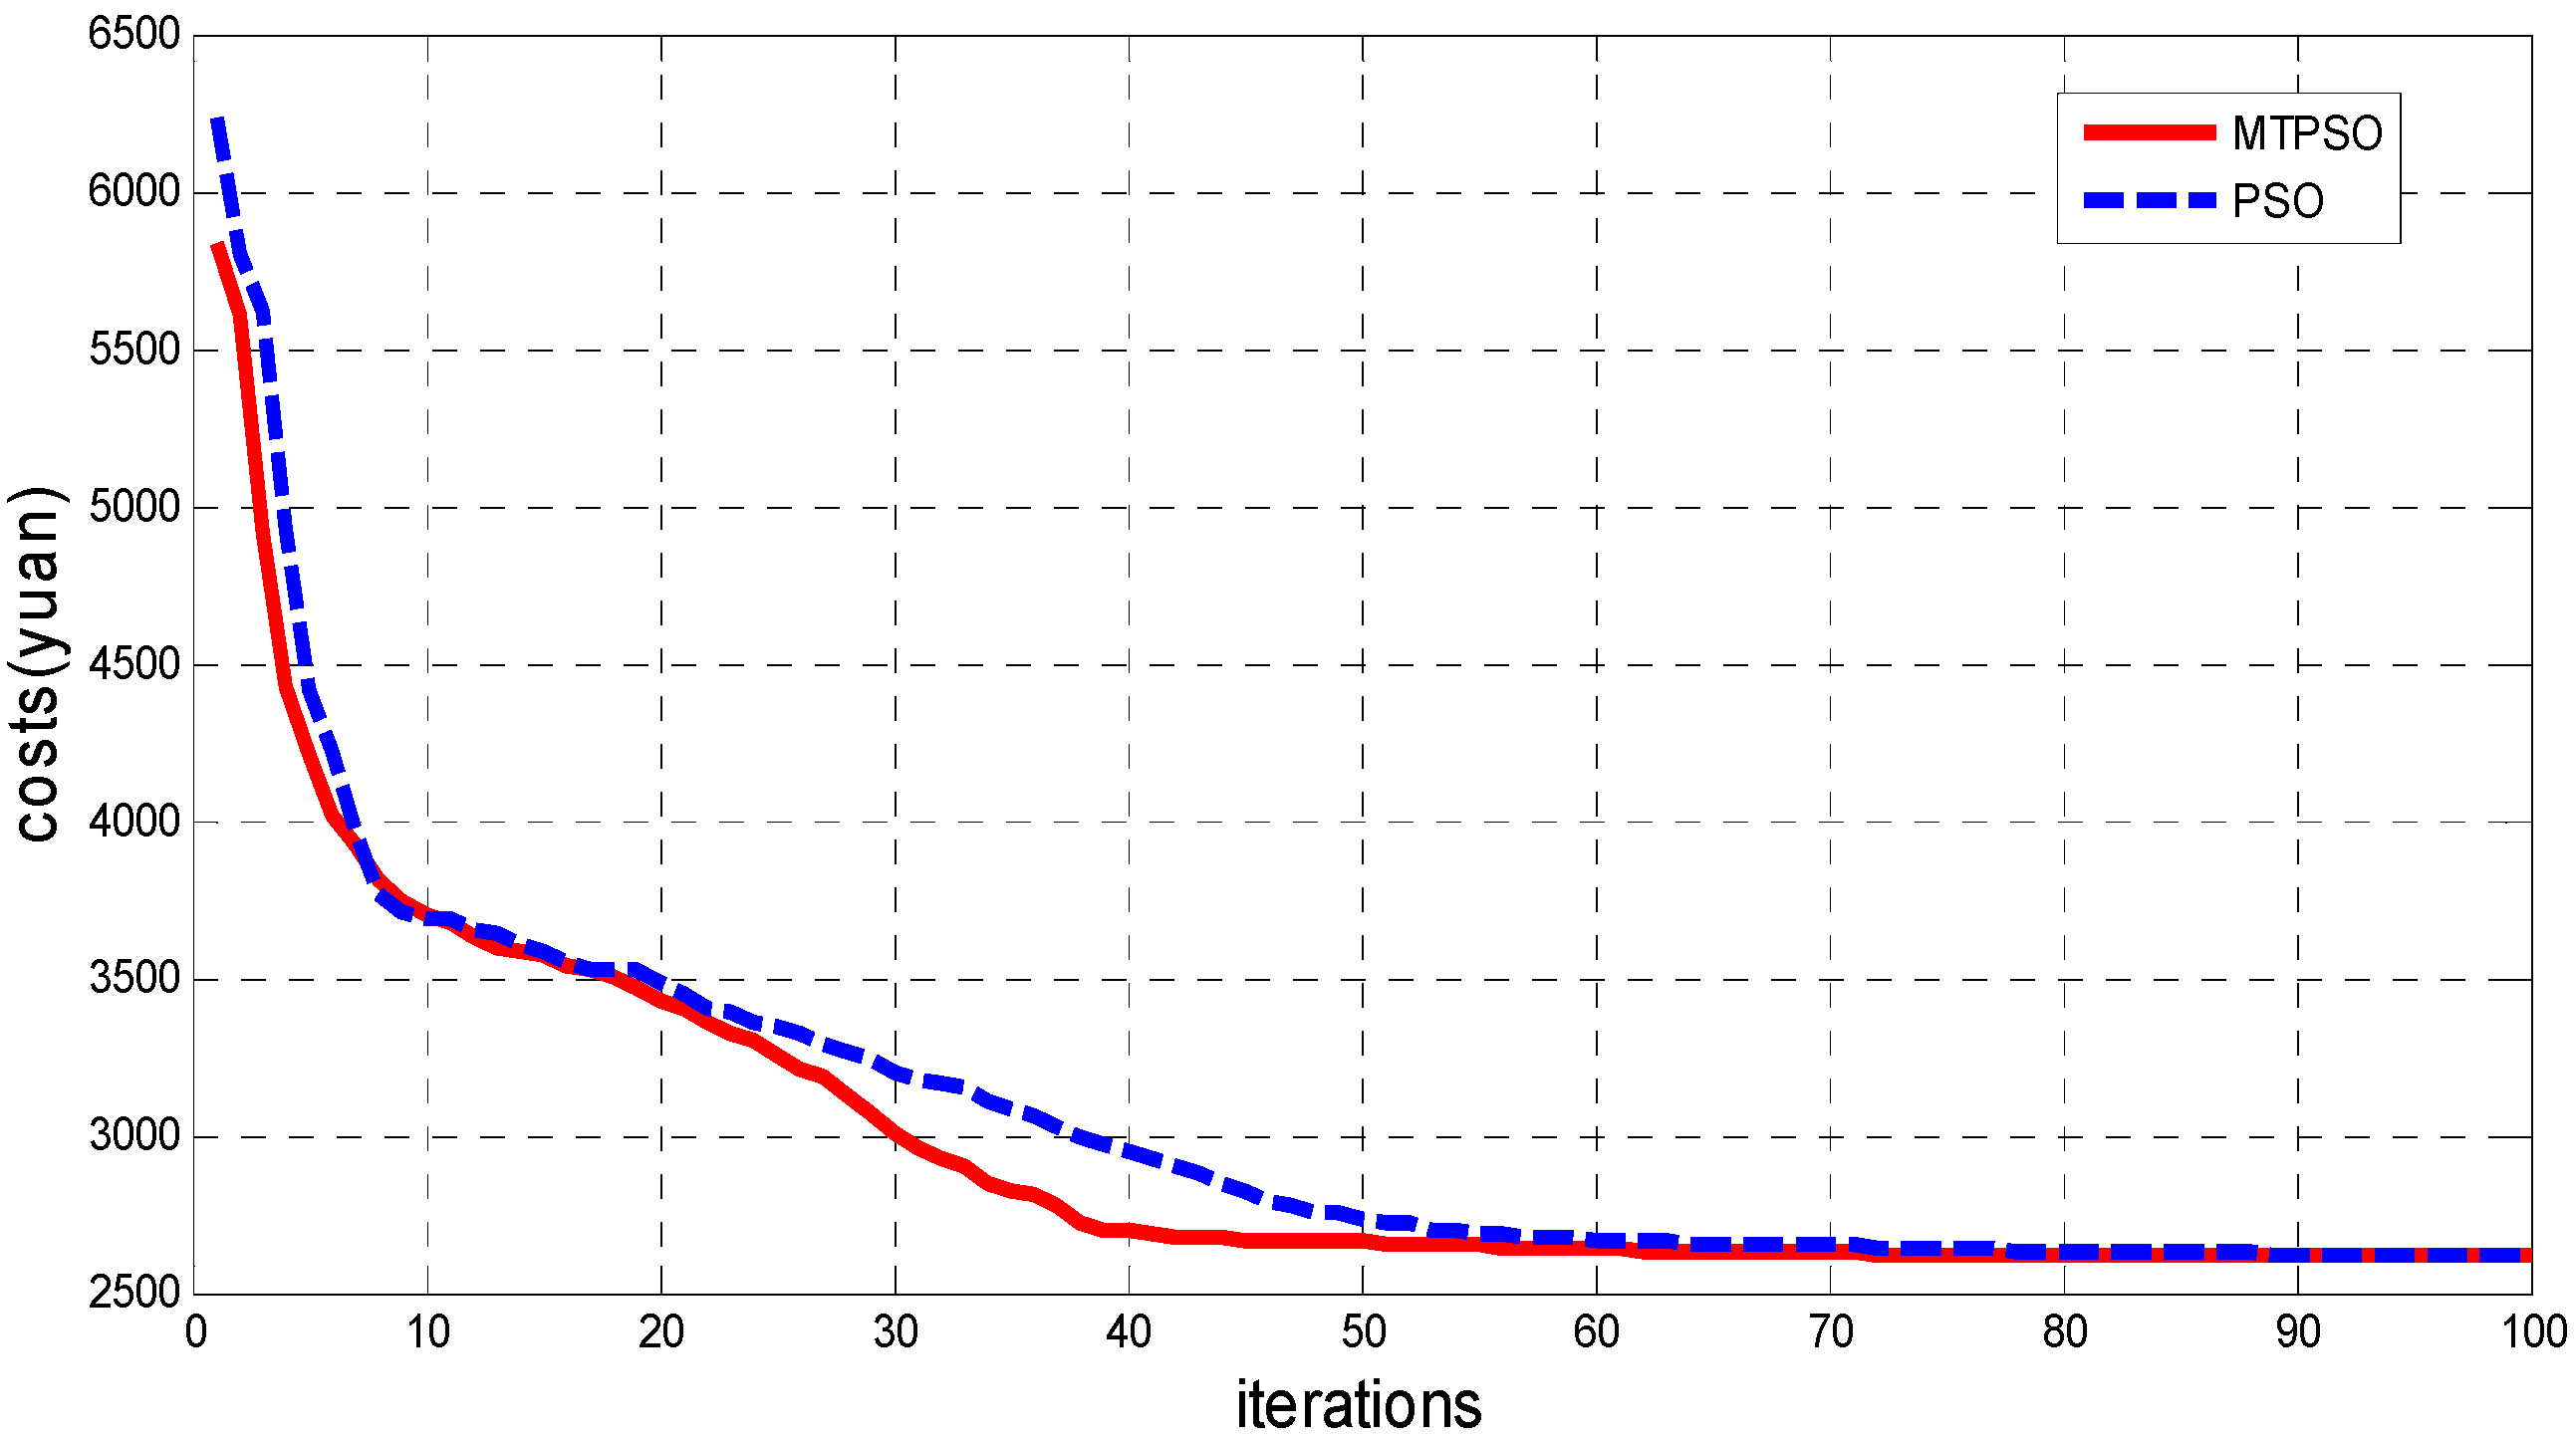
As to the solving of energy dispatch optimization, the MTPSO algorithm introduced in this paper has a better performance in optimizing capability than the ordinary PSO algorithm. The particle amount is set to 50, and maximum iterations are set to 100 in the calculation. The evolution curves are illustrated in Figure 6, which indicates that the two algorithms share similar characteristics and are basically the same in the speed of the evolution curves during the initial 20 iterations; but during 20–50 iterations, the MTPSO algorithm has better performance with the additional optimum information of the group and an enhanced optimizing capacity. Even though the MTPSO algorithm requires an extra step in calculation, both of the algorithms share a similar calculation speed in general. A 100-time running test on each algorithm with the same group population (50) and the maximum iteration is performed, and the numbers of times for each one to find the globally-optimal solution are 68 and 89, respectively. This indicates that the MTPSO algorithm has obviously enhanced global convergence ability, though it is unable to reach 100% success.
Figure 6.
Convergence characteristics of PSO and multi-team PSO (MTPSO).

6. Conclusions
The optimal scheduling model of a thermo-electric mixed micro grid with solar, wind and storage is established, and the least operation cost is taken as the objective function in this paper. A multi-team particle swarm algorithm (MTPSO) is proposed to solve the schedule problem. Through simulation and result analysis, the MTPSO, which has expanded the particle search information with the utilization of the organization global optimal solution shows better global optima searching ability than PSO.
The CHP running mode adopts energy cascade utilization. Its operating costs are lower compared to the separate power and heat supply mode. With the energy storage battery and EV integration into the micro grid, the peak and valley load of the system is effectively regulated, and the system operating cost is decreased even more. When DSM is adopted, the system operating cost, as well as the cost of purchasing power for users are further reduced. Further work can be carried out on different time-of-use tariff’s impact on DSM and on optimizing the schedule of electric power load and thermal load simultaneously including DSM.
Acknowledgments
The authors would like to appreciate the detailed comments of two anonymous reviewers and the kind help of the Editor, which significantly enhanced the quality of the paper. The work reported in the paper is funded by the Beijing Higher Education Young Elite Teacher Project (YETP0707) and the Fundamental Research Funds for the Central Universities. The usual caveats apply.
Author Contributions
Zifa Liu contributed to the research idea and the framework of this study. The other authors contributed equally to the study.
Conflicts of Interest
The authors declare no conflict of interest.
References
- Ding, J.X.; Somani, A. A Long-Term Investment Planning Model for Mixed Energy Infrastructure Integrated with Renewable Energy. In Proceedings of the Green Technologies Conference, Grapevine, TX, USA, 15–16 April 2010; pp. 1–10.
- Jin, C.R.; Sheng, X.; Ghosh, P. Energy efficient algorithms for Electric Vehicle charging with intermittent renewable energy sources. In Proceedings of the Power and Energy Society General Meeting (PES), Vancouver, BC, USA, 21–25 July 2013; pp. 1–5.
- Motevasel, M.; Seifi, A.R.; Niknam, T. Multi-objective energy management of CHP (combined heat and power)-based micro-grid. Energy 2013, 51, 123–136. [Google Scholar] [CrossRef]
- Moghaddam, A.A.; Seifi, A.; Niknam, T.; Pahlavani, M.R.A. Multi-Objective Operation Management of A Renewable Mg (Micro-Grid) with Back-up Micro-Turbine/Fuel Cell/Battery Hybrid Power Source. Energy 2011, 36, 6490–6507. [Google Scholar] [CrossRef]
- McLarty, D.; Sabate, C.C.; Brouwer, J.; Jabbari, F. Micro-grid energy dispatch optimization and predictive control algorithms; A UC Irvine case study. Int. J. Electr. Power Energy Syst. 2015, 65, 179–190. [Google Scholar] [CrossRef]
- Marnay, C.; Venkataramanan, G.; Stadler, M.; Siddiqui, A.; Firestone, R.; Chandran, B. Optimal Technology Selection and Operation of Microgrids in Commercial Buildings. In Proceedings of IEEE Power Engineering Society General Meeting, Tampa, FL, USA, 24–28 June 2007; pp. 1–7.
- Ye, Q.; Ma, T.; Gu, Y.; Wang, T.; Wang, D.; Bai, Y. Research on Dispatch Scheduling Model of Micro-grid with Distributed Energy. In Proceedings of the International Conference on Electricity Distribution, Shanghai, China, 10–14 September 2012; pp. 1–5.
- Tran, D.; Khambadkone, A.M. Energy Management for Lifetime Extension of Energy Storage System in Micro-Grid Applications. IEEE Trans. Smart Grid 2013, 4, 1289–1296. [Google Scholar] [CrossRef]
- Mohsenian-Rad, H.; Ghamkhari, M. Optimal Charging of Electric Vehicles with Uncertain Departure Times: A Closed-Form Solution. IEEE Trans. Smart Grid 2015, 6, 940–942. [Google Scholar] [CrossRef]
- Habib, S.; Kamran, M.; Rashid, U. Impact Analysis of Vehicle-to-grid Technology and Charging Strategies of Electric Vehicles on Distribution Networks—A Review. J. Power Sources 2015, 277, 205–214. [Google Scholar] [CrossRef]
- Su, H.Y.; Li, R.Q. Cost-benefit analysis model of DSM under smart grid infrastructure. Power Syst. Prot. Control 2012, 40, 69–73. [Google Scholar]
- Liu, W.F.; Gao, W.; Jia, J.G.; Shen, Y. Study of Rules,Standards and Incentive Mechanisms in Implement of Power Demand Side Management in China. Power Syst. Technol. 2006, s2, 636–641. [Google Scholar]
- Hayes, B.; Hernando-Gil, I.; Collin, A.; Harrison, G.; Djokić, S. Optimal Power Flow for Maximizing Network Benefits From Demand-Side Management. IEEE Trans. Power Syst. 2014, 29, 1739–1747. [Google Scholar] [CrossRef]
- Wang, X.; Palazoglu, A.; El-Farra, N.H. Operational Optimization and Demand Response of Hybrid Renewable Energy Systems. Appl. Energy 2015, 143, 324–335. [Google Scholar] [CrossRef]
- Liu, J.J.; Wang, Z.J.; Yuan, J.H. Optimized Dispatch of Wind/PV/Battery Microgrid Based on PSO Algorithm. East Chin. Electr. Power 2014, 42, 1534–1539. [Google Scholar]
- Zhou, Y.Z.; Wu, H.; Li, Y.N.; Xin, H.; Song, Y. Dynamic Dispatch of Multi-microgrid for Neighboring Islands Based on MCS-PSO Algorithm. Autom. Electr. Power Syst. 2014, 9, 204–210. [Google Scholar]
- Chen, J.; Yang, X.; Zhu, L.; Zhang, M.; Li, Z. Microgrid Multi-objective Economic Dispatch Optimization. Proc. CSEE 2013, 33, 57–66. [Google Scholar]
- Zhu, L.; Yang, X.; Fu, Y. Optimal Plan and Design for Microgridincluding Micro Turbine. East Chin. Electr. Power 2011, 39, 2037–2040. [Google Scholar]
- Yang, Y.H.; Pei, W.; Qi, Z.P. Planning Method for Hybrid Energy Microgrid Based on Dynamic Operation Strategy. Autom. Electr. Power Syst. 2012, 36, 30–36. [Google Scholar]
- Mao, M.Q.; Sun, S.; Su, J.H. Economic Analysis of a Microgrid with Wind/Photovoltaic/Storages and Electric Vehicles. Autom. Electr. Power Syst. 2011, 35, 30–35. [Google Scholar]
- Chen, J.; Wang, C.S.; Zhao, B.; Zhang, X.S. Economic Operation Optimization of a Stand-alone Microgrid System Considering Characteristics of Energy Storage System. Autom. Electr. Power Syst. 2012, 6, 25–31. [Google Scholar]
- Tang, J. Principle and Application of PSO Algorithm. Comput. Technol. Dev. 2010, 20, 213–216. [Google Scholar]
© 2015 by the authors; licensee MDPI, Basel, Switzerland. This article is an open access article distributed under the terms and conditions of the Creative Commons Attribution license (http://creativecommons.org/licenses/by/4.0/).
Share and Cite
MDPI and ACS Style
Liu, Z.; Chen, C.; Yuan, J. Hybrid Energy Scheduling in a Renewable Micro Grid. Appl. Sci. 2015, 5, 516-531. https://doi.org/10.3390/app5030516
AMA Style
Liu Z, Chen C, Yuan J. Hybrid Energy Scheduling in a Renewable Micro Grid. Applied Sciences. 2015; 5(3):516-531. https://doi.org/10.3390/app5030516
Chicago/Turabian StyleLiu, Zifa, Chiye Chen, and Jiahai Yuan. 2015. "Hybrid Energy Scheduling in a Renewable Micro Grid" Applied Sciences 5, no. 3: 516-531. https://doi.org/10.3390/app5030516