Article

Acoustic-Based Cutting Pattern Recognition for Shearer through Fuzzy C-Means and a Hybrid Optimization Algorithm

1
School of Mechatronic Engineering, China University of Mining & Technology, No.1 Daxue Road, Xuzhou 221116, China
2
Institute for Neural Computation, University of California, San Diego (UCSD), No.3950 Mahaila Ave, San Diego 92093, CA, USA
3
Collaborative Innovation Center of Intelligent Mining Equipment in Jiangsu Province, No.1 Daxue Road, Xuzhou 221116, China
*
Author to whom correspondence should be addressed.
Appl. Sci. 2016, 6(10), 294; https://doi.org/10.3390/app6100294
Submission received: 1 August 2016 / Revised: 9 September 2016 / Accepted: 8 October 2016 / Published: 12 October 2016
(This article belongs to the Section Acoustics and Vibrations)

Abstract

:
As the conventional cutting pattern recognition methods for shearer are huge in size, have low recognition reliability and an inconvenient contacting measurement method, a fast and reliable coal-rock cutting pattern recognition system is always a baffling problem worldwide. However, the recognition rate has a direct relation with the outputs of coal mining and the safety quality of staff. In this paper, a novel cutting pattern identification method through the cutting acoustic signal of the shearer is proposed. The signal is clustering by fuzzy C-means (FCM) and a hybrid optimization algorithm, combining the fruit fly and genetic optimization algorithm (FGOA). Firstly, an industrial microphone is installed on the shearer and the acoustic signal is collected as the source signal due to its obvious advantages of compact size, non-contact measurement and ease of remote transmission. The original sound is decomposed by multi-resolution wavelet packet transform (WPT), and the normalized energy of each node is extracted as a feature vector. Then, FGOA, by introducing a genetic proportion coefficient into the basic fruit fly optimization algorithm (FOA), is applied to overcome the disadvantages of being time-consuming and sensitivity to initial centroids of the traditional FCM. A simulation example, with the accuracy of 95%, and some comparisons prove the effectiveness and superiority of the proposed scheme. Finally, an industrial test validates the practical effect.

1. Introduction

Shearer is one of the key pieces of equipment in a fully-mechanized coal mining workspace. It is of great significance to guarantee long-term and steady operation of the shearer for avoiding safety incidents and improving the output of coal mining. Many scholars pointed that recognizing whether the shearer was cutting coal seams, hard rock or coal seam gripping gangue, defined as cutting pattern recognition in this paper, was the precondition for secure and efficient coal mining [1]. However, because of the harsh working environment and complicated geological condition during the coal mining process, online recognition was always a technological bottleneck, and the identification rate was directly affected by the signal source during the recognition process.
Since the cutting pattern recognition was proposed in the 1970s, great academic achievements have scored. More than 20 types of signals were researched in the past several decades, such as γ-ray concentration [2], cutting image [3], cutting temperature [4], vibration of the shearer [5], etc. All of these methods promoted the theory and experimental developments of the cutting pattern recognition, but also encountered some common problems during practical application. In [3], texture features of cutting images in multiple scales were collected to identify the cutting pattern automatically. Similar to the γ-ray detector, the high-resolution image receiver had the disadvantages of huge size and power consumption. Some special treatments were needed to satisfy the safety standards of the coal mining explosion-proof electric apparatus. Recently, Si et al. fused the temperature information of the shearer through an improved D–S evidence theory and artificial neural network to predict the coal rock distribution [4]. In order to recognize the coal-rock interface in the top coal caving, the vibration signals of the tail beam of the hydraulic support were investigated in [5], while the temperature and vibration signals could be collected only by contact measurement, which was not convenient for installation and maintenance. Manual guidance was necessary and unmanned coal mining was still unachievable in mining production. Through the embedded analysis and thoughts on the working field, it was found that the cutting acoustic signal, formed by the collision of the cutting part of the shearer and the coal-rock, had a relation with the cutting pattern [6]. Moreover, the sound collector had obvious superiorities of small size, low-power and non-contact measurement. The acoustic-based cutting pattern recognition system is actually excavating effective information and then classifying the real-time signal series into some patterns. It is essentially a process of clustering.
Clustering involves the discovery of a data structure in multivariate information and divides a data set into several subsets without providing prior knowledge [7,8]. The clustering process is often regarded as the important first step for data exploration. The most widely applied clustering methods can be divided into hard partitioning algorithms and soft partitioning algorithms [9,10]. Typical hard partitioning solutions, such as K-means [11,12,13] and K-medoids clustering [14], assign each pattern into a cluster according to its nearest centroid. Then, positions of the centroids are iteratively adjusted according to their corresponding members in order to minimize the sum of the squared error. Fuzzy C-means (FCM) algorithm is a kind of representative soft partitioning approach, which allows each individual to belong into all clustering centers according to the degree of membership [15]. In practical application, many scholars point out that FCM often performs better than the hard partitioning algorithm. In addition, it is widely applied in fault diagnosis [16], state recognition [17], image segmentation [18], et al. However, clustering centers of traditional FCM are optimized according to gradient descent algorithm, which has the disadvantage of being time-consuming [19] and sensitive to initial centroids [20]. Moreover, many problems have no priori knowledge on the number of clusters in practice. In these circumstances, the optimization may fall into local extremum, rather than a global optimal solution. In [21], in order to improve the calculation efficiency of FCM, a random sampling plus extension FCM (rseFCM) algorithm was proposed to cluster big data. On the basis of rseFCM, geometric progressive FCM (GPFCM) and minimum sample estimate random FCM (MSERFCM) were designed in [22]. To search global optimal centroids, many intelligent iterative optimization algorithms were applied. In [20], a genetic algorithm (GA) was integrated to optimize the membership functions and centroids in the FCM model. The experimental tests are conducted to verify the effectiveness of the proposed approach. The traffic volume data collected at different temporal scales were treated as the testing dataset, and three different indicators, including root mean square error, correlation coefficient, and relative accuracy, were utilized to quantify the imputation performance compared with some conventional methods. In [23], particle swarm optimization FCM (PSO–FCM) was applied for image segmentation, and the results of the experiments showed that the accuracy and the calculation time were, respectively, 97.86% and 15.7419 s for the composite image. A hybrid algorithm, unsupervised ant colony optimization (UACO), was proposed by combining FCM and ant colony optimization (ACO) for medical image segmentation in [24]. It can be summarized from the literature that improvements on FCM mainly focus on reducing the calculation time and avoiding falling into local optimal clustering centers.
Since the 1960s, many meta-heuristic intelligent optimization algorithms have been proposed to solve multi-object extremum, such as GA [25], particle swarm optimization (PSO) [26], artificial bee colony (ABC) [27], tabu search [28], differential evolution algorithm [29], et al. A considerable number of them are inspired by natural behavior and embody the principle of “select the most superior solution from superior solutions” [30]. While the above methods are often focused on only part of the links during the searching process, none of them has a comprehensive performance in all aspects. GA has outstanding ability in global searching, while the genetic operations are complex and time-consuming [31]. The iteration time of PSO and ABC is relatively rapid, but easily falls into local extremes [32]. The artificial fish swarm algorithm (AFSA) has a slow convergence rate in the later phase of iterations [33]. In order to overcome the disadvantages of single optimization algorithm, a hybrid PSO-GA algorithm was proposed to solve the scheduling problem in machine tool production in [34]. In [35], ABC and GA were integrated for neural network training and the clustering process. To forecast electricity load, a forecasting model based on GA and ACO was proposed in [36], and the experimental results showed that the proposed hybrid model performed better in load prediction 24 h ahead in terms of mean absolute percentage error than the other methods.
In 2012, a fruit fly optimization algorithm (FOA) was first proposed by Pan through simulating the food finding process of fruit flies and resulted in extensive attention [37]. As the characteristics of fast convergence and simple structure compared with other solutions, FOA was widely applied in parameter optimization [38], forecasting [39], scheduling [40], etc. However, like other optimization algorithms, the basic FOA also has the possibility of falling into local extremum due to poor population diversity during the iterative process [41]. In [42], in order to avoid local optimal solution, swarm collaboration and random perturbation were added into the original FOA to solve the joint replenishment problems. In [43], an adaptive step multi-dimensional FOA (ASM-FOA) was applied to minimize the size of the phasor measurement units configuration while allowing full observability of the network. Ref. [44] presented a changeable fly distance range in FOA to eliminate the drawbacks with fixed values of a search radius, and 29 benchmark functions were carried out to make a comparison with the original FOA. It can be seen that improvements on FOA aim at the process of updating next generation fruit flies, while rare scholars researched the combination of FOA and other optimization solutions.
Bearing the above observations in mind, this paper aims to propose a convenient and reliable cutting pattern recognition method for the shearer through the acoustic signal to overcome the disadvantages of high volume, low efficiency and low reliability of previous ways. As priori knowledge is always scarce in the practical cutting pattern identification process, an unsupervised system is established according to FCM and a hybrid optimization algorithm. The hybrid method is applied to replace the gradient descent approach of the basic FCM, due to its time-consuming nature, ease of falling into local extremes, and sensitivity to initial centroids. Moreover, the synthetic optimization approach integrates the FOA and GA, called the fruit fly genetic optimization algorithm (FGOA), to balance the searching speed and population diversity. Specifically, parts of the fruit flies are updated through genetic operations during production of the next generation individuals in original FOA by introducing a genetic proportion coefficient.
The rest of this paper is organized as follows. In Section 2, the basic theories of FCM, FOA and GA are presented. In Section 3, the iteration process of the proposed FGOA is described and the flow of the cutting pattern recognition method based on FCM and FGOA (FCM-FGOA) was elaborated on in detail. In order to validate the accuracy and superiority of the recognition approach, a simulated fully-mechanized coal mining site is set up and the cutting sound is clustered by the method in Section 4. Then, an industrial experiment is conducted in Section 5. Some conclusions and outlooks are summarized in Section 6.

2. Background

2.1. Fuzzy C-Means Clustering Algorithm

For a sample set X = (x1, x2, …, xJ), it can be classified into c groups. Each sample in X can be sorted into a category according to membership μij, where μij donates the membership value of the j-th sample belonging to the i-th category [12]. For the j-th sample, μij satisfies the condition as follows:
i = 1 c μ i j = 1 ,   μ i j [ 0 , 1 ] .
The objective function in FCM can be presented as follows:
J m ( U , P ) = j = 1 J i = 1 c ( μ i j ) m ( d i j ) 2 ,
where m (1, + ) is weighted index and dij is distance of xj and i-th clustering center vi. The target of the clustering process is to minimize the objective function. Considering some constraint conditions of μij, the Lagrange multiplier method is applied to solve the extremum problem. The membership value μij and the clustering center vi can be calculated as follows:
μ i j = { 1 k = 1 c ( d i j d k j ) 2 m 1 d k j 0 1 d k j = 0 , k = i 0 d k j = 0 , k i } ,
v i = j = 1 J ( μ i j ) m x j j = 1 J ( μ i j ) m .
The iterative process of FCM algorithm can be generalized as follows:
Step 1.1: Initialization. Initialize weighted index m, category number c, original clustering center v ( 0 ) , stopping value of the iterative process ξ and the maximal iteration number N.
Step 1.2: Iteration. Update μij and vi according Equations (3) and (4).
Step 1.3: Comparison. Terminate the iteration process if ||v(b+1)vb|| ≤ ξ or the present iteration number n = N; otherwise, repeat steps 1.2 and 1.3.

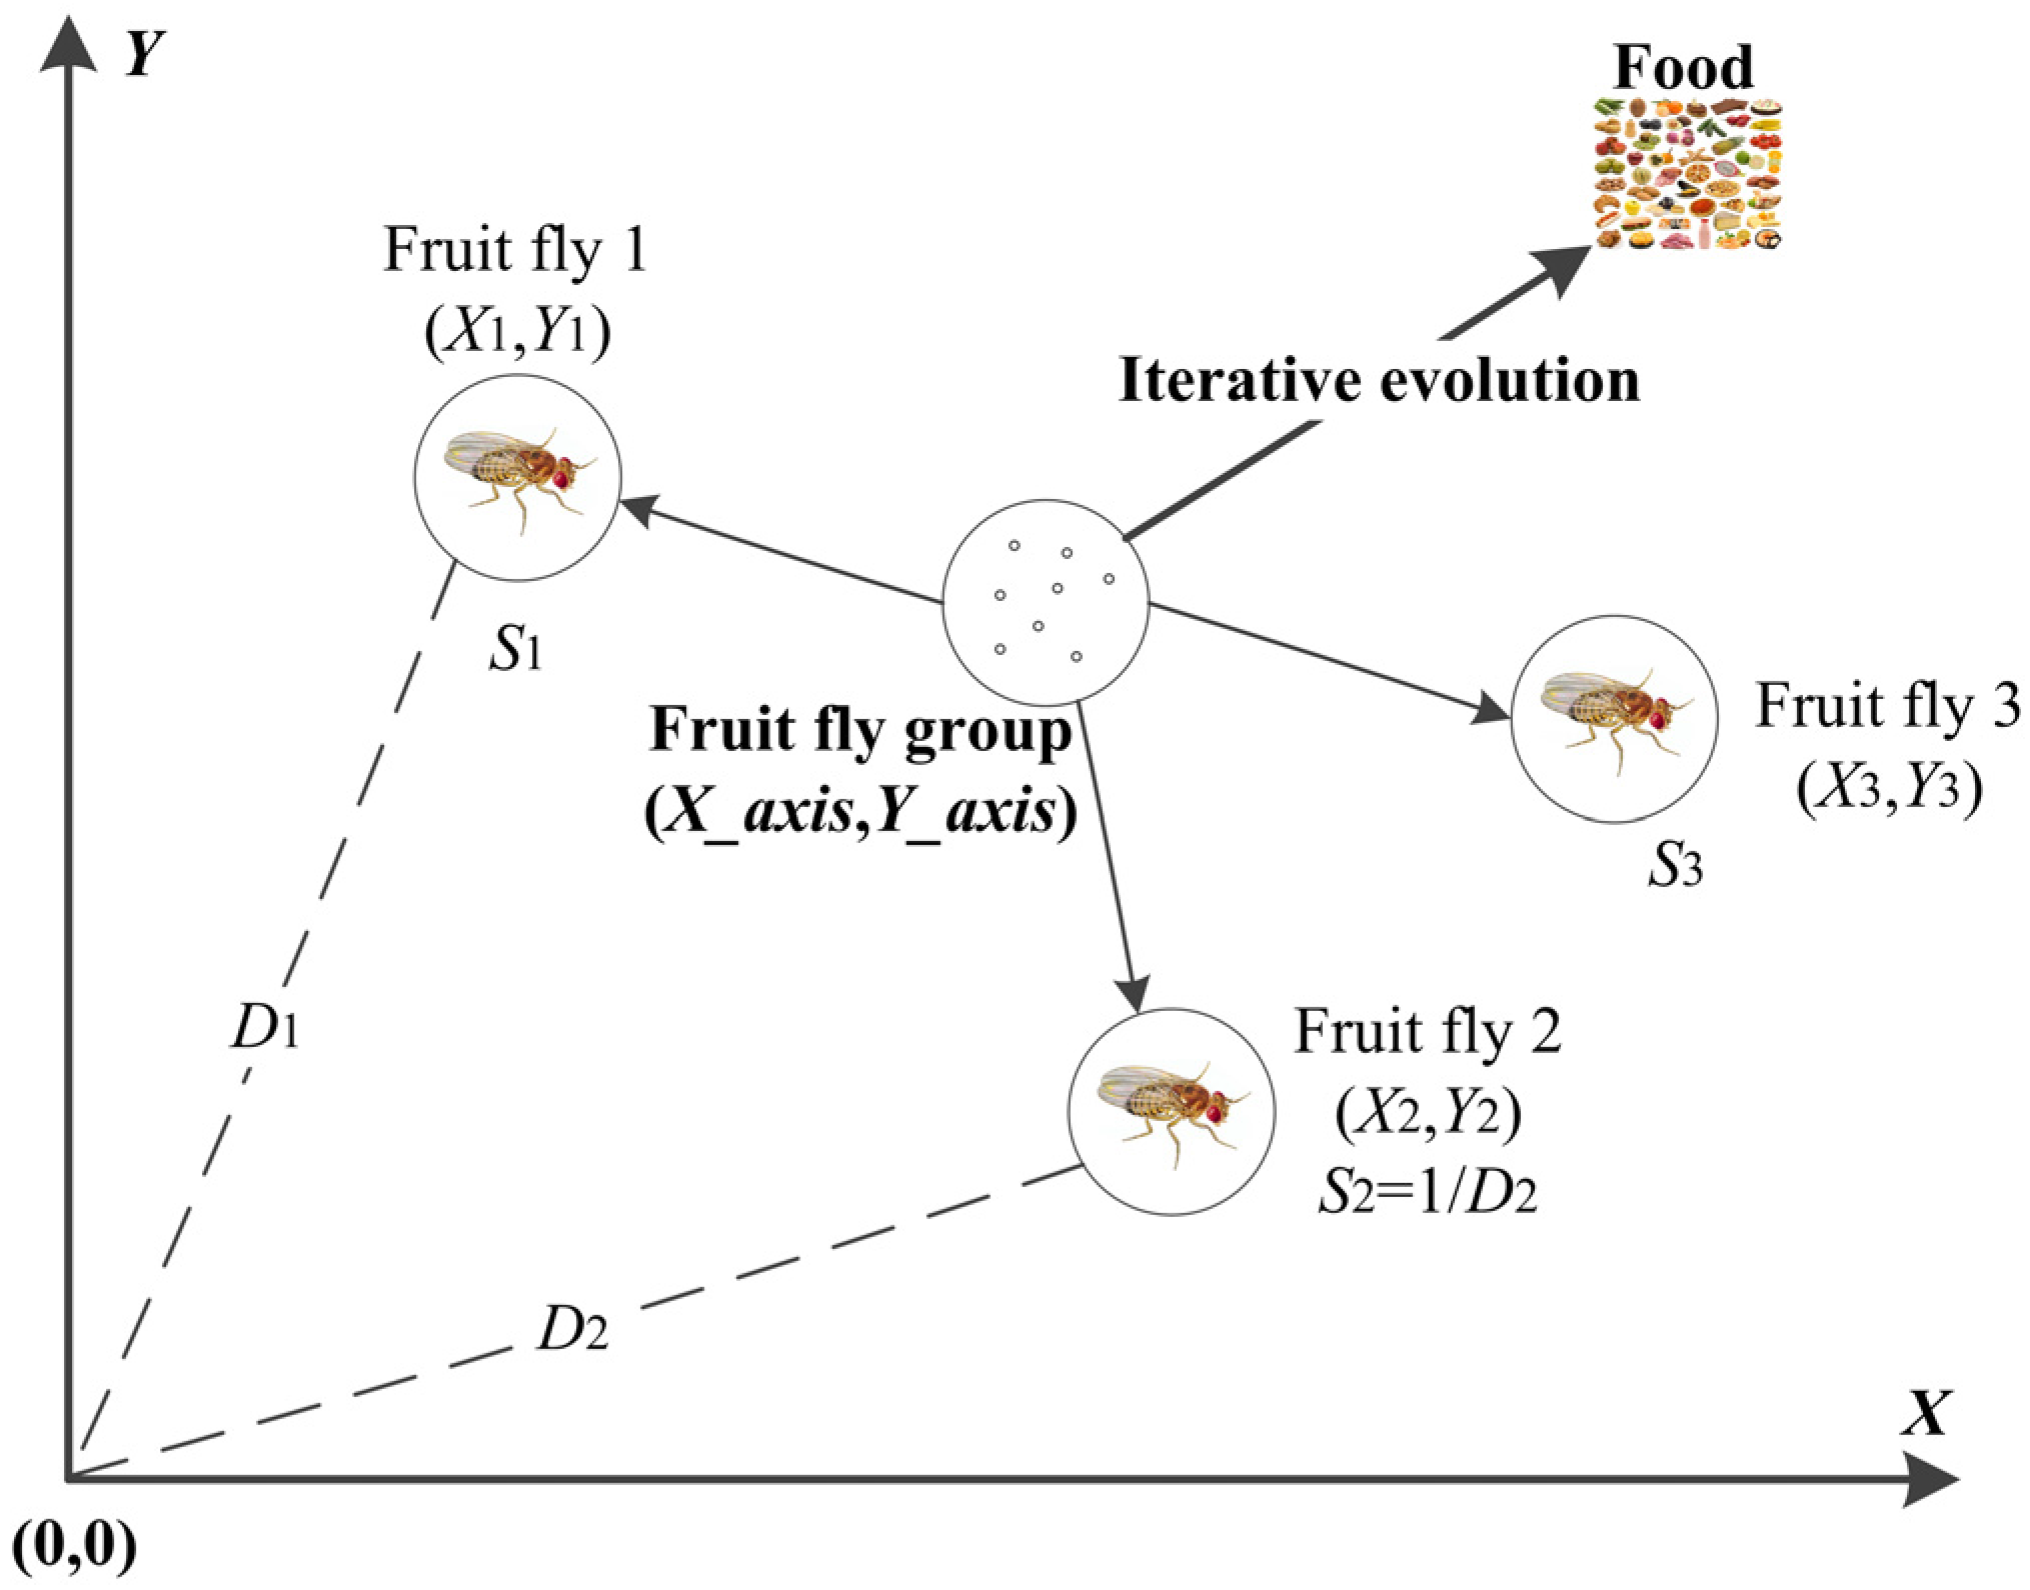
2.2. Fruit Fly Optimization Algorithm

FOA is an interactive evolutionary computation method evolved from the food finding behavior of the fruit fly. Fruit flies feed on rotten fruit, live in temperate and tropical climate zones, and have obvious superiority over other species in osphresis and vision. The food finding process can be shown in Figure 1 and generalized as follows: each fly individual smells the food source according to the osphresis organ and flies towards the location first; then, a sensitive vision organ is applied to find food and other individuals’ flocking locations; and the procedures are repeated until the food is obtained [31]. The detailed iterative process of FOA can be concluded as follows:
Step 2.1: Parameters initialization. Initialize the maximum iteration number N, the number of fruit flies P, the initial fruit fly population location (X_axis, Y_axis) and the random fly distance range L.
Step 2.2: Individuals initialization. The flight direction and distance of each fly are achieved randomly according to its osphresis:
X p = X _ axis + r a n ( L , L ) Y p = Y _ axis + r a n ( L , L ) ,
where p = 1, 2, 3, …, P, Xp and Yp are indexes of p-th fly.
Step 2.3: Fitness evaluation. As the food location is unknown, the distance of each fly to the origin is named as Dp and the reciprocal of Dp is called smell concentration judgment value Sp:
D p = ( X p 2 + Y p 2 ) 1 2 S p = 1 D p .
Then, the smell concentration smellp can be calculated by putting the smell concentration judgment value into the fitness function, which can be presented as follows:
s m e l l p = f ( S p ) [ b e s t s m e l l   b e s t i n d e x ] = max ( s m e l l ) ,
where bestsmell is the maximum smell concentration, bestindex is the corresponding fruit fly number and smell is the smell concentration set of the group.
Step 2.4: Comparison and substitution. The present smell concentration is compared with the former, if it is superior to the last generation, smellbest and the corresponding index are replaced:
s m e l l b e s t = b e s t s m e l l { X _ axis = X ( b e s t i n d e x ) Y _ axis = Y   ( b e s t i n d e x ) .
Step 2.5: Optimization iteration. If the smell concentration reaches the preset precision threshold value or the iteration number reaches the maximal N, the iteration process stops. Otherwise, steps 2.2 to 2.4 are repeated.

2.3. Genetic Algorithm

GA is an artificial search method motivated by natural principles and the concept of survival of the fittest. Each independent variable in the GA is represented by a gene sequence and each solution is described as a chromosome. A standard optimization process can be divided into five key steps: encoding, selecting, crossover, mutation and fitness judgment [21].
Encoding is defined as the mapping relation from problem space to encoding space. The selecting process is choosing individuals with higher fitness value to form a mating pool. The probability of being selected for each chromosome is determined by the proportion of the individual fitness and the total, and the roulette method is mostly applied in the selecting process. For a given group P = {a1, a2, …, aT}, where T is the scale number of the group, the fitness value of at can be described as f(at) and the probability ps(at) can be calculated as follows:
p s ( a t ) = f ( a t ) t = 1 T f ( a t ) ,
where t = 1, 2, …, T. The expectation number P(at) of previous chromosome in offspring is determined as follows:
P ( a t ) = T p s ( a t ) .
The crossover in GA is transmitting a favorable gene to the next generation by simulating the gene recombinant process of sexual reproduction. It was assumed that (vf, ve) were parent chromosomes and the crossover operation was performed on l-th position. Thus, the crossover position of the corresponding child chromosomes (vs, vd) can be presented as follows:
{ v l s = α v l f + ( 1 α ) v l e v l d = α v l e + ( 1 α ) v l f ,
where α is a random value in the range of (0, 1), and l is an integer.
Structure and physical properties of the chromosomes were changed through the mutation operation, and it was assumed that va was the selected chromosome and the mutation process was performed on h-th position, which can be presented as follows:
v h a = β v h a + ( 1 β ) v h b ,
where β is a random value in the range of (0, 1).

3. The Proposed Method

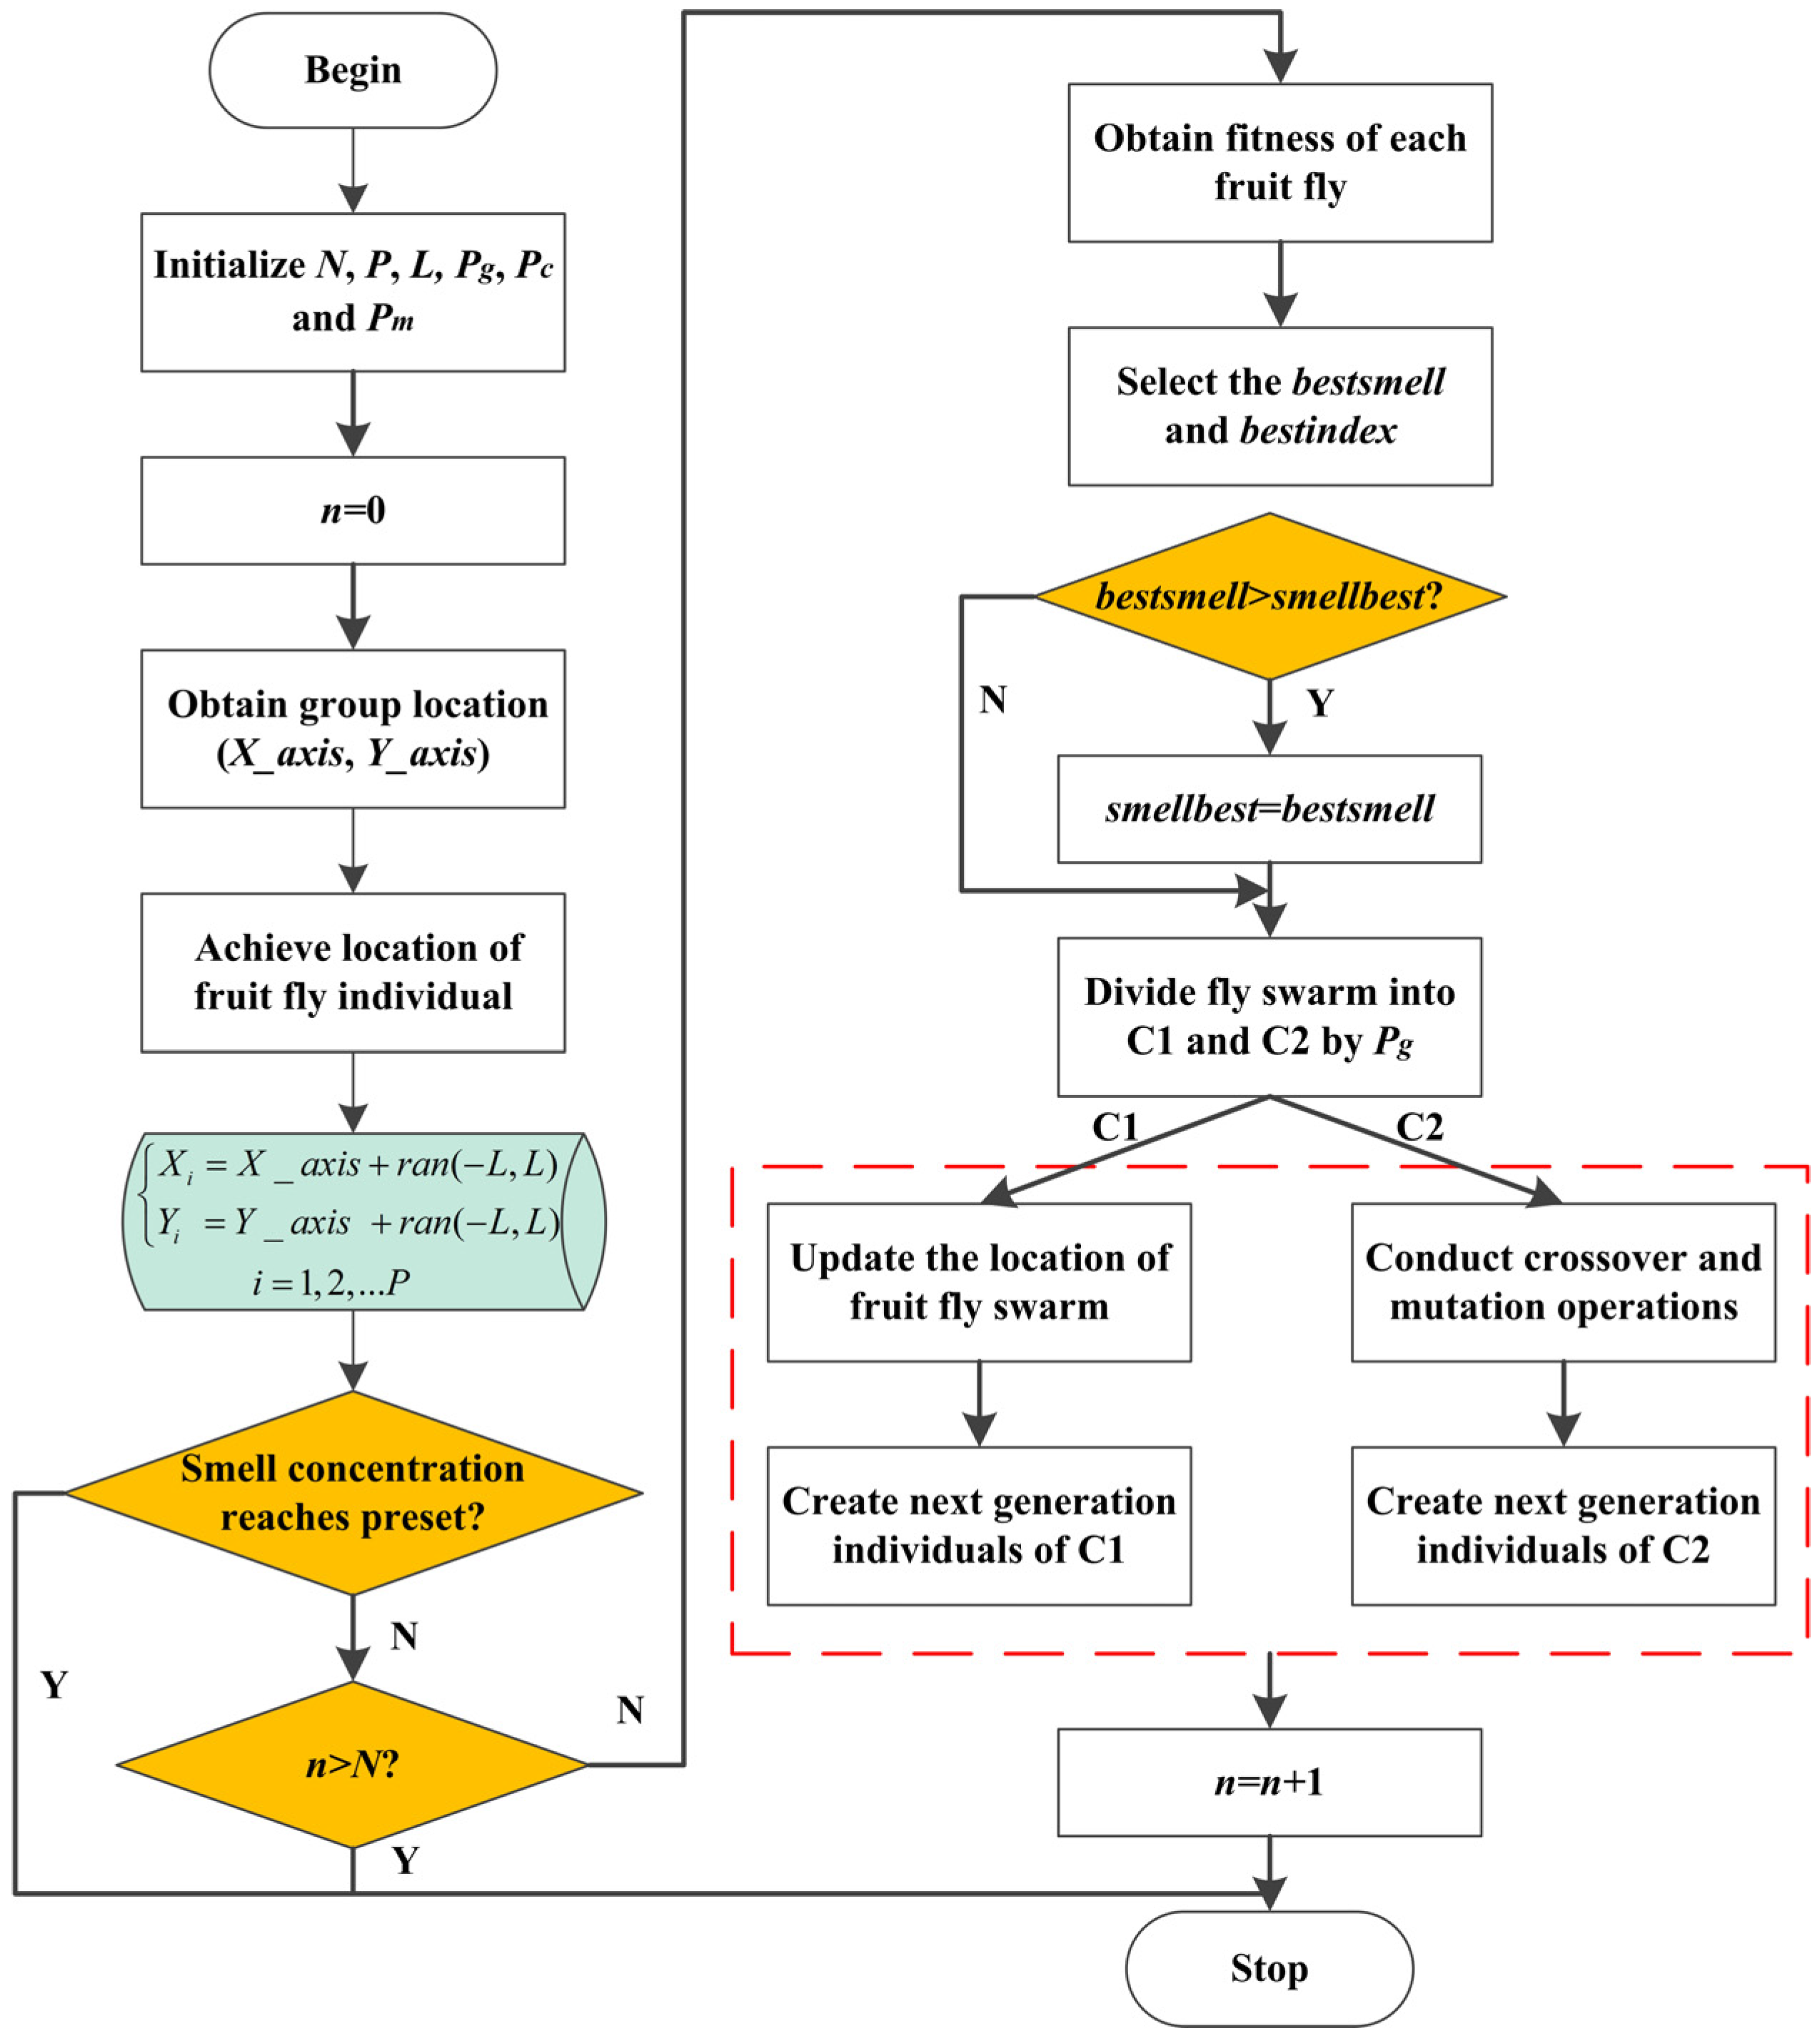
3.1. Hybrid Optimization Algorithm

FOA is a kind of procedural search method and has a simple structure and saves time. However, with typical FOA, it is difficult to ensure the diversity of the fruit fly swarm, and it is easy to fall into local extremes. The reason is based on all individuals tending to the present generation optimal solution during the process of producing new fruit flies and the population diversity is gradually lost. On the other hand, GA has obvious superiority in avoiding partial optimization due to the crossover and mutation operation, while the iterative process is time-consuming. The proposed FGOA integrates a searching process of FOA and crossover and mutation operation of GA to balance the calculation time and search ability.
Three new parameters are introduced in the FGPOA, the genetic proportion Pg, the crossover probability Pc and the mutation probability Pm, and Step 2.4 of FOA is modified as follows:
The present smell concentration is compared with the former, and if it is superior to the last generation, smellbest is replaced by bestsmell. Then, the fruit fly swarm is divided into two groups, one called the fly group (C1), and the other is called the genetic group (C2), where the number of C2 is P·Pg. Offspring of C1 is updated according to FOA, and the crossover and mutation operation are performed on C2. Moreover, the probability of particles selected to conduct crossover and mutation is Pc and Pm respectively. The flowchart of the FGOA is presented in Figure 2.

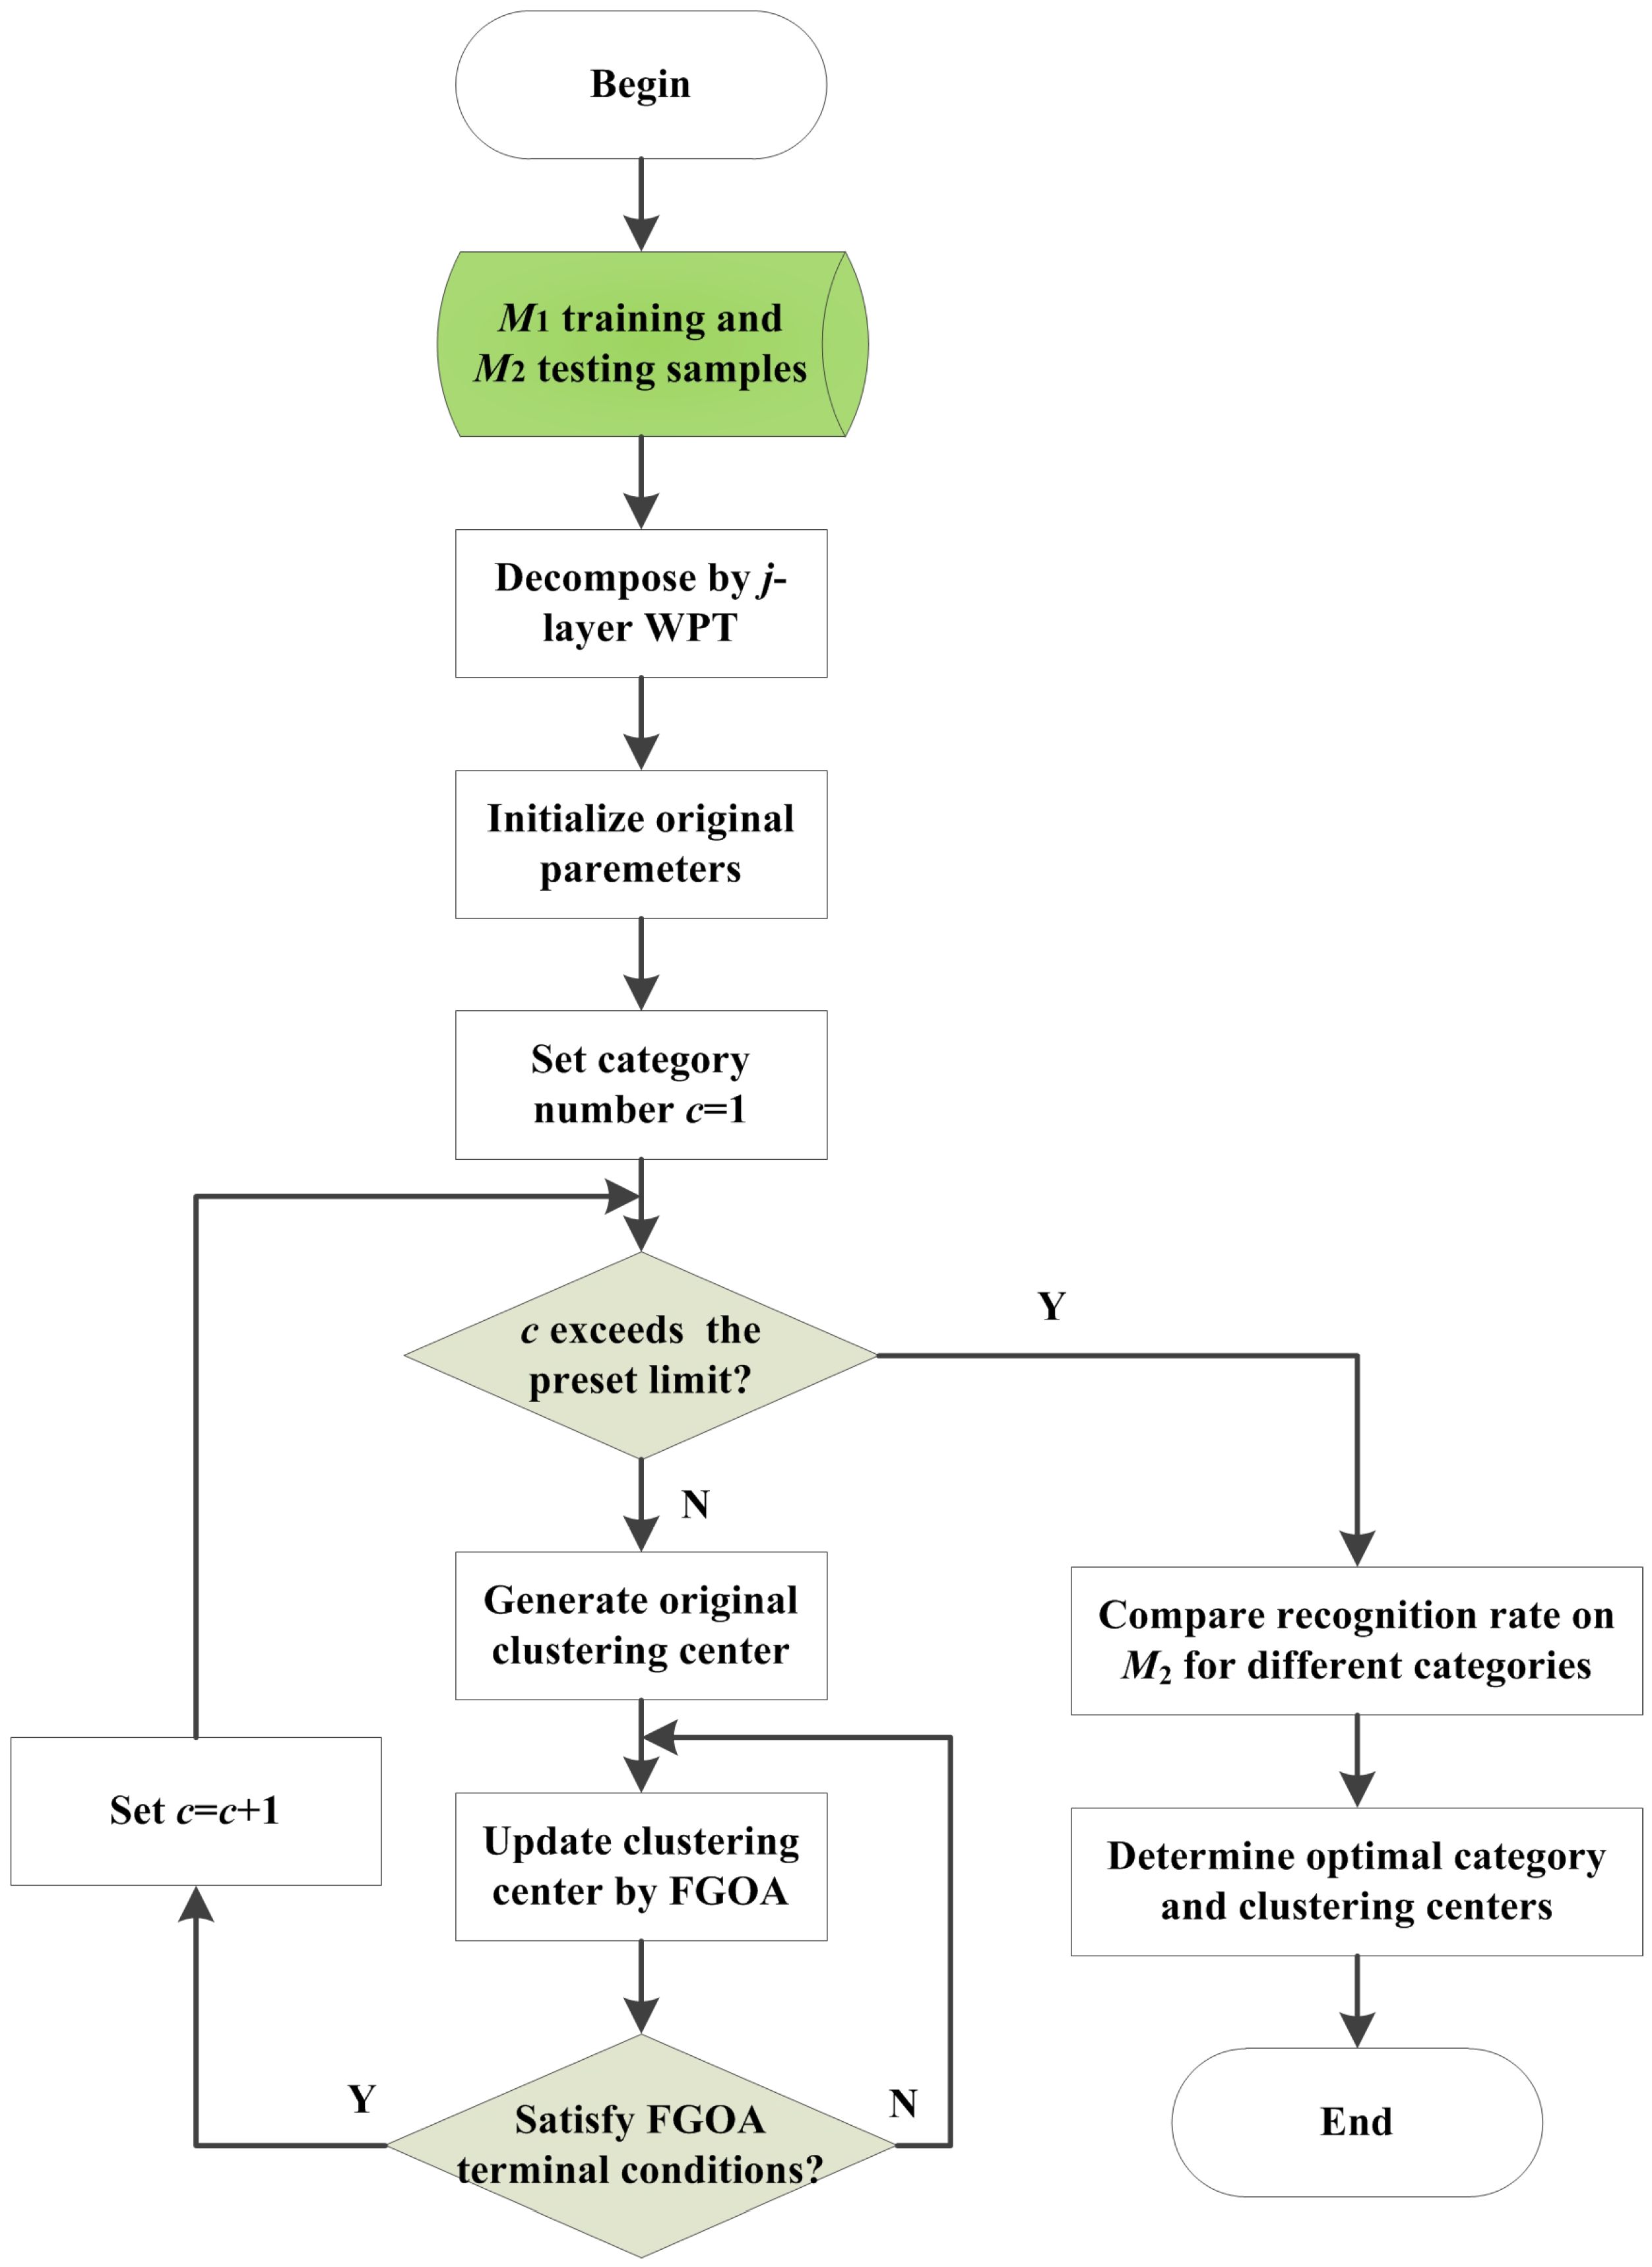
3.2. Flow of the Recognition Method

In order to realize online cutting pattern recognition for the shearer, the cutting sound signal is collected as the criterion, and an improved FCM method optimized by FGOA is applied in this paper. The flow of the proposed FCM-FGOA can be shown as follows:
Step 3.1: Pretreatment on the initial signal. The original sound is divided into T series, where T1 of them are training samples and the rest T2 are testing samples. In order to extract multiple scale information from the original signal clips, wavelet packet transform is first applied to decompose the sound due to its excellent time-frequency analysis ability [45]. Then, a series of wavelet packet coefficients are obtained, defined as d i , k j , which represents k-th coefficient of i-th node in the j-th layer. As the energy of the wavelet packet node often contains key characteristics and is easy to calculate [46], the feature vector in this paper consists of the energy of nodes, which can be calculated as follows:
e i = k d i , k j 2 ,
where ei donates the energy of i-th wavelet packet node. Normalization is conducted subsequently to facilitate computation and training. It was assumed that the value range of all node energy was [emin, emax], and normalized ei can be shown as follows:
e N i = e i e min e max e min ,
where eNi belongs to [0, 1]. For the t-th sound, a 2j-dimensional vector can be extracted as follows:
e t = { e N 1 t , e N 2 t , ... e N 2 j t } ,
where j is the decomposition level of wavelet packet transform (WPT) and et is the feature vector, t = 1, 2, …, T.
Step 3.2: Parameters preset. Key parameters of FCM-FGOA contain: weighted index m, range of category number c, threshold value of the iterative process ξ, maximal iteration number N, random fly distance range L, number of fruit flies P, genetic proportion Pg, crossover probability Pc and mutation probability Pm and original clustering center v p ( 0 ) , where v p ( 0 ) is composed by 2j elements and can be presented as v p ( 0 ) = [ v 11 0 , v 12 0 , ... , v 12 j 0 , ... , v c 1 0 , v c 2 0 , ... , v c 2 j 0 ] , p = 1, 2, 3, …, P. T1 training samples are applied to optimize the FCM-FGPOA and the remaining T2 are used to validate the clustering algorithm.
Step 3.3: Iterative optimization. P clustering centers are produced and the fitness value of each center is calculated according to Equation (16). When Jm(U,P) reaches its smallest value, the fitness is at its maximum. The iterative process is conducted according to FGOA and a new clustering center is generated in each circulation:
f = 1 1 + J m ( U , P ) .
Step 3.4: Terminal condition. If the iteration number reaches N or a center error less than ξ, terminate the iteration process; otherwise, continue the optimization. The flowchart of the FCM-FGOA can be shown in Figure 3.

4. Simulation and Analysis

In order to validate the accuracy and superiority of the proposed method, a simulation example was put forward for shearer cutting pattern recognition. The sound signal during the coal-rock cutting process was collected and pretreated first. Then, the signal was decomposed by WPT and the proposed FCM-FGOA was applied. Finally, the simulation result was compared with actual working condition and some related solutions were compared. All calculations in this section were conducted on a work station (Dell Inc., Round Rock, TX, USA), and the configuration of the station was listed in Table 1.

4.1. Data Acquisition

Original sound data was acquired from the National Coal Mining Equipment Research and Experiment Center (Zhangjiakou, China) at the China Coal Zhangjiakou Coal Mining Machinery Co., Ltd. (Zhangjiakou, China). The test platform (China Coal Zhangjiakou Coal Mining Machinery Co., Ltd., Zhangjiakou, Hebei, China) was 70 meters long and 2 meters high and equipped with a shearer and 43 hydraulic supports. The cutting wall was composed of three sections: a 30 m long pure coal seam with the Protodikonov hardness of f2 (S1), a 30 m long pure coal seam with the hardness of f3 (S2) and a 10 m long coal seam gripping rocks (S3). The traction speed of the shearer was 3 m/min and the cutting drum rotation speed was 25 r/min. The shearer was pulled towards the right direction. An industrial microphone was installed to collect the cutting sound of S1, S2, S3 and the condition with no-load (S4). The arrangement of the experimental site and the installation of microphone were shown in Figure 4. The sampling frequency of the sound signal was 44.1 kHz, and a 100 sound series with a duration time of 0.2 s were recorded for each situation. In addition, a series of 300 were treated as training samples, and the remaining 100 segments as test samples. Four kinds of typical cutting sound signals were shown in Figure 5.

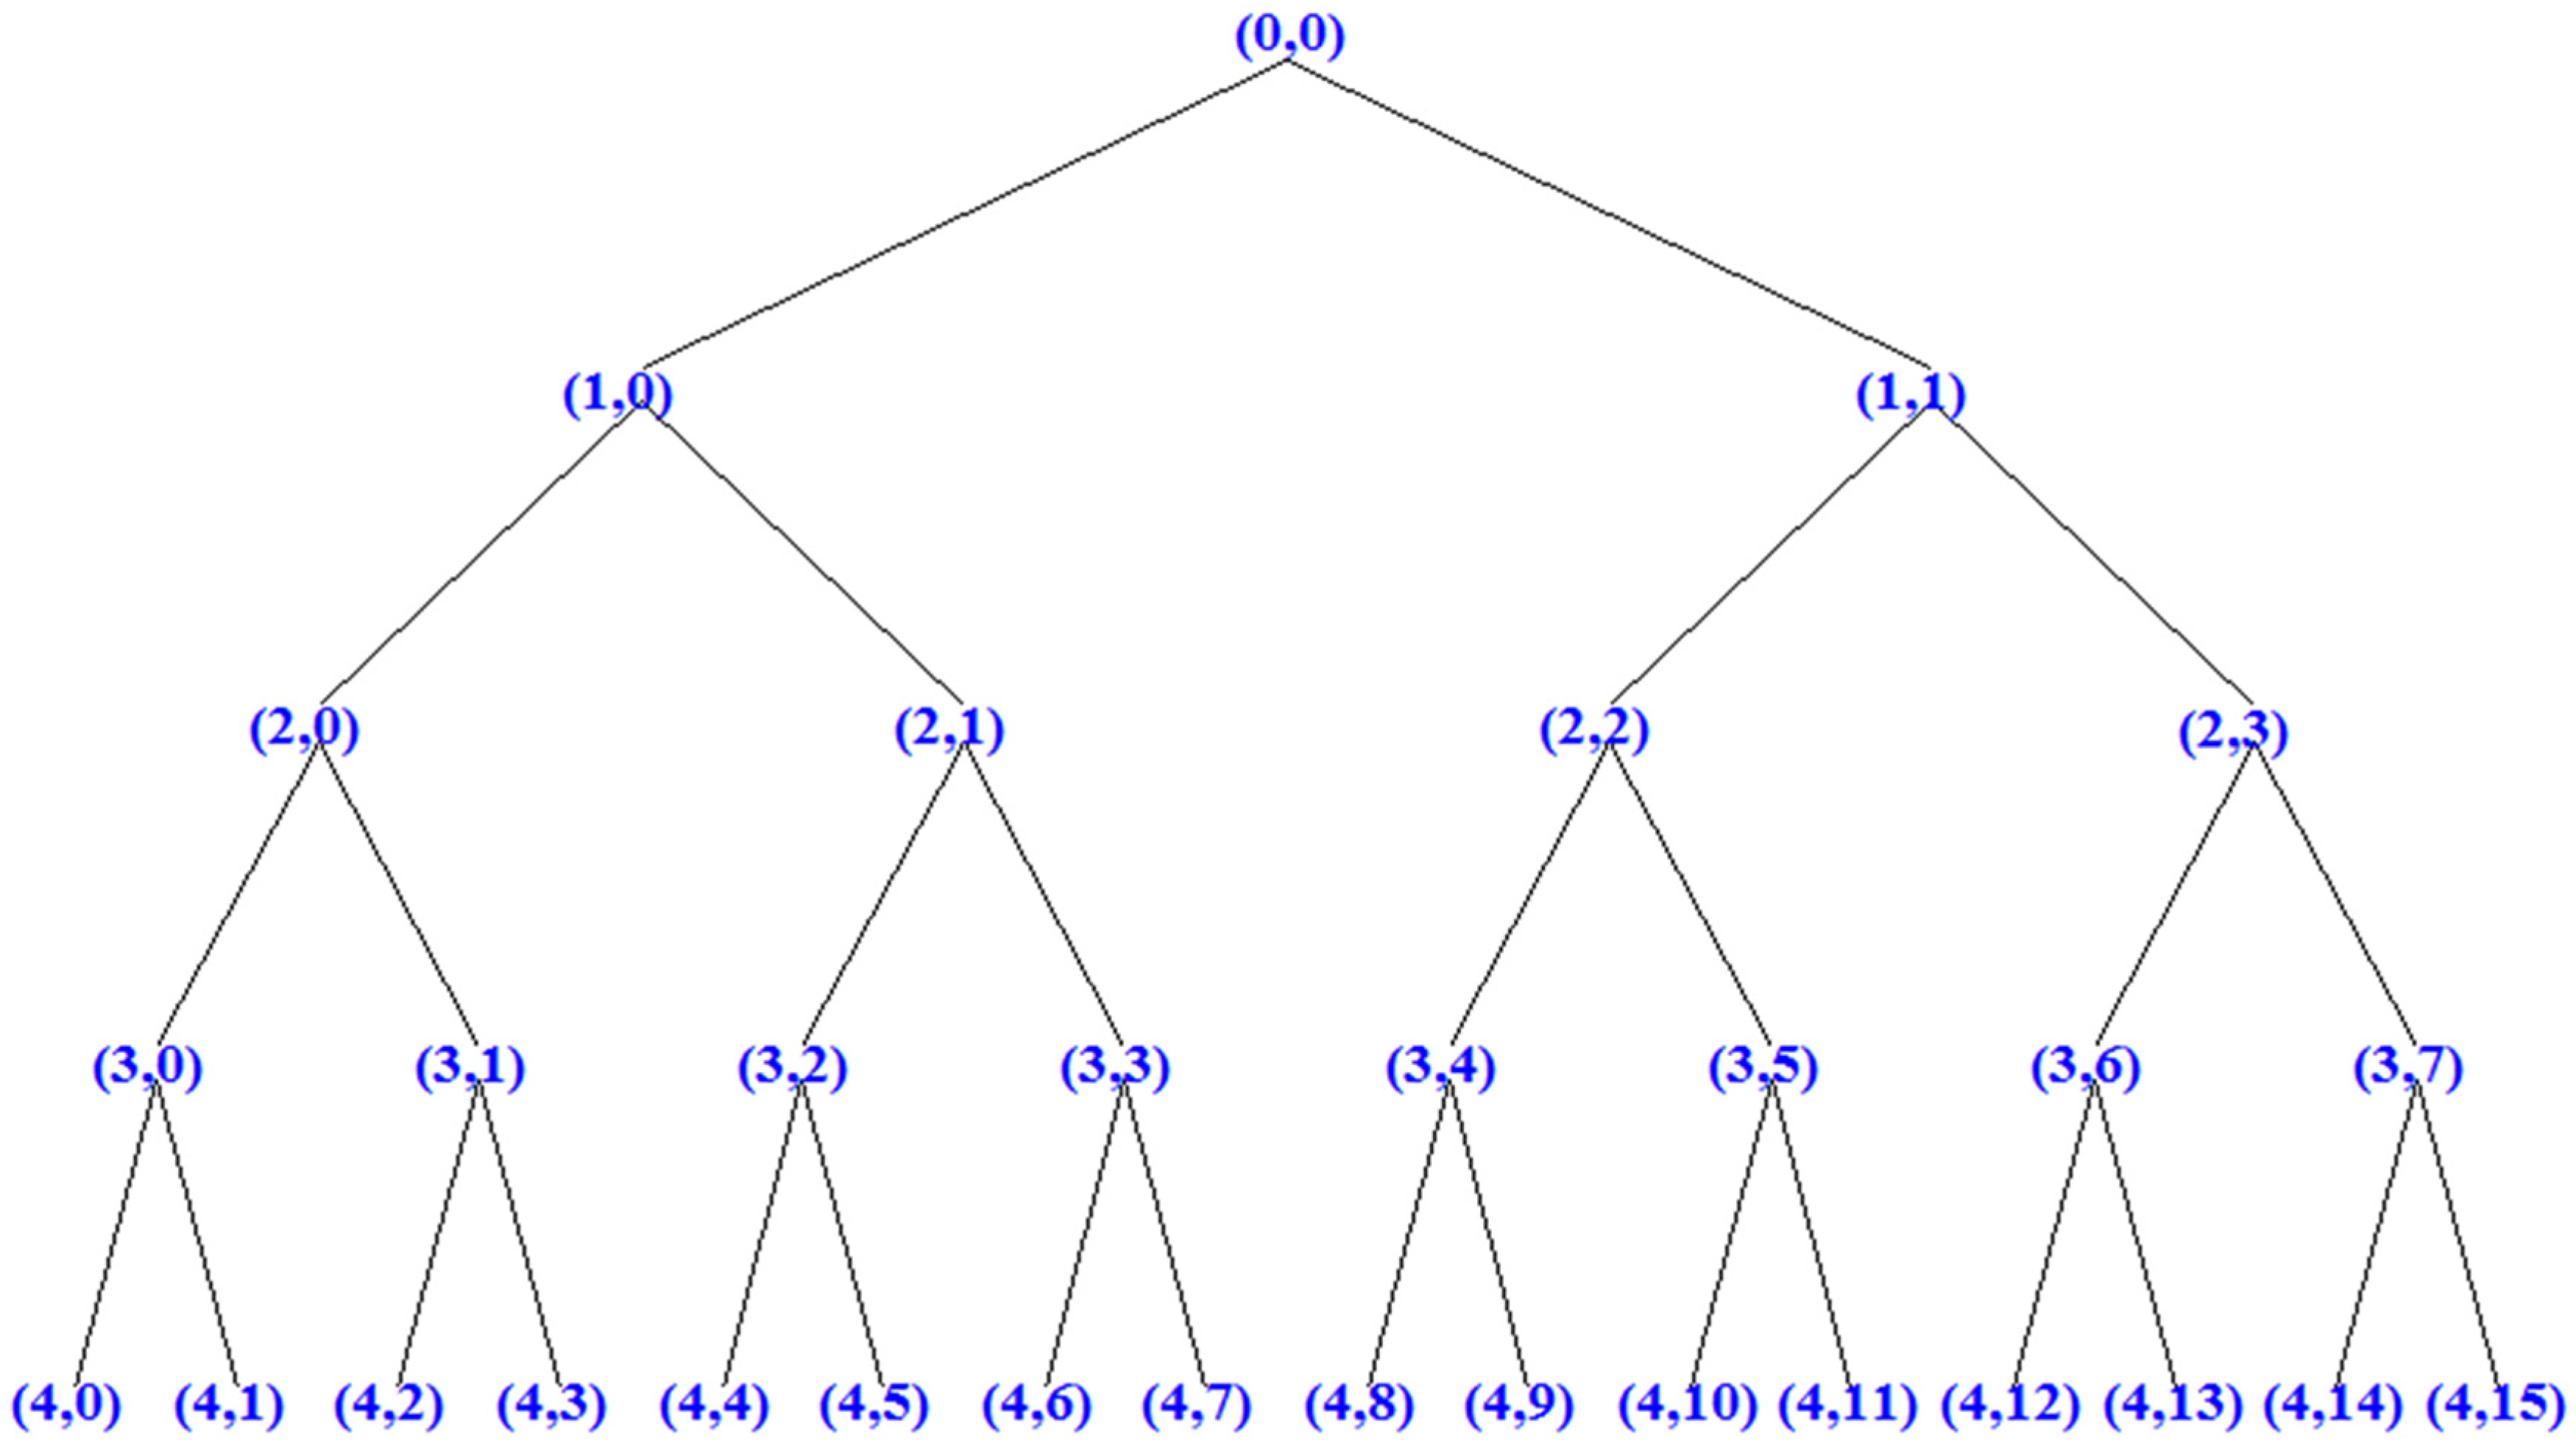
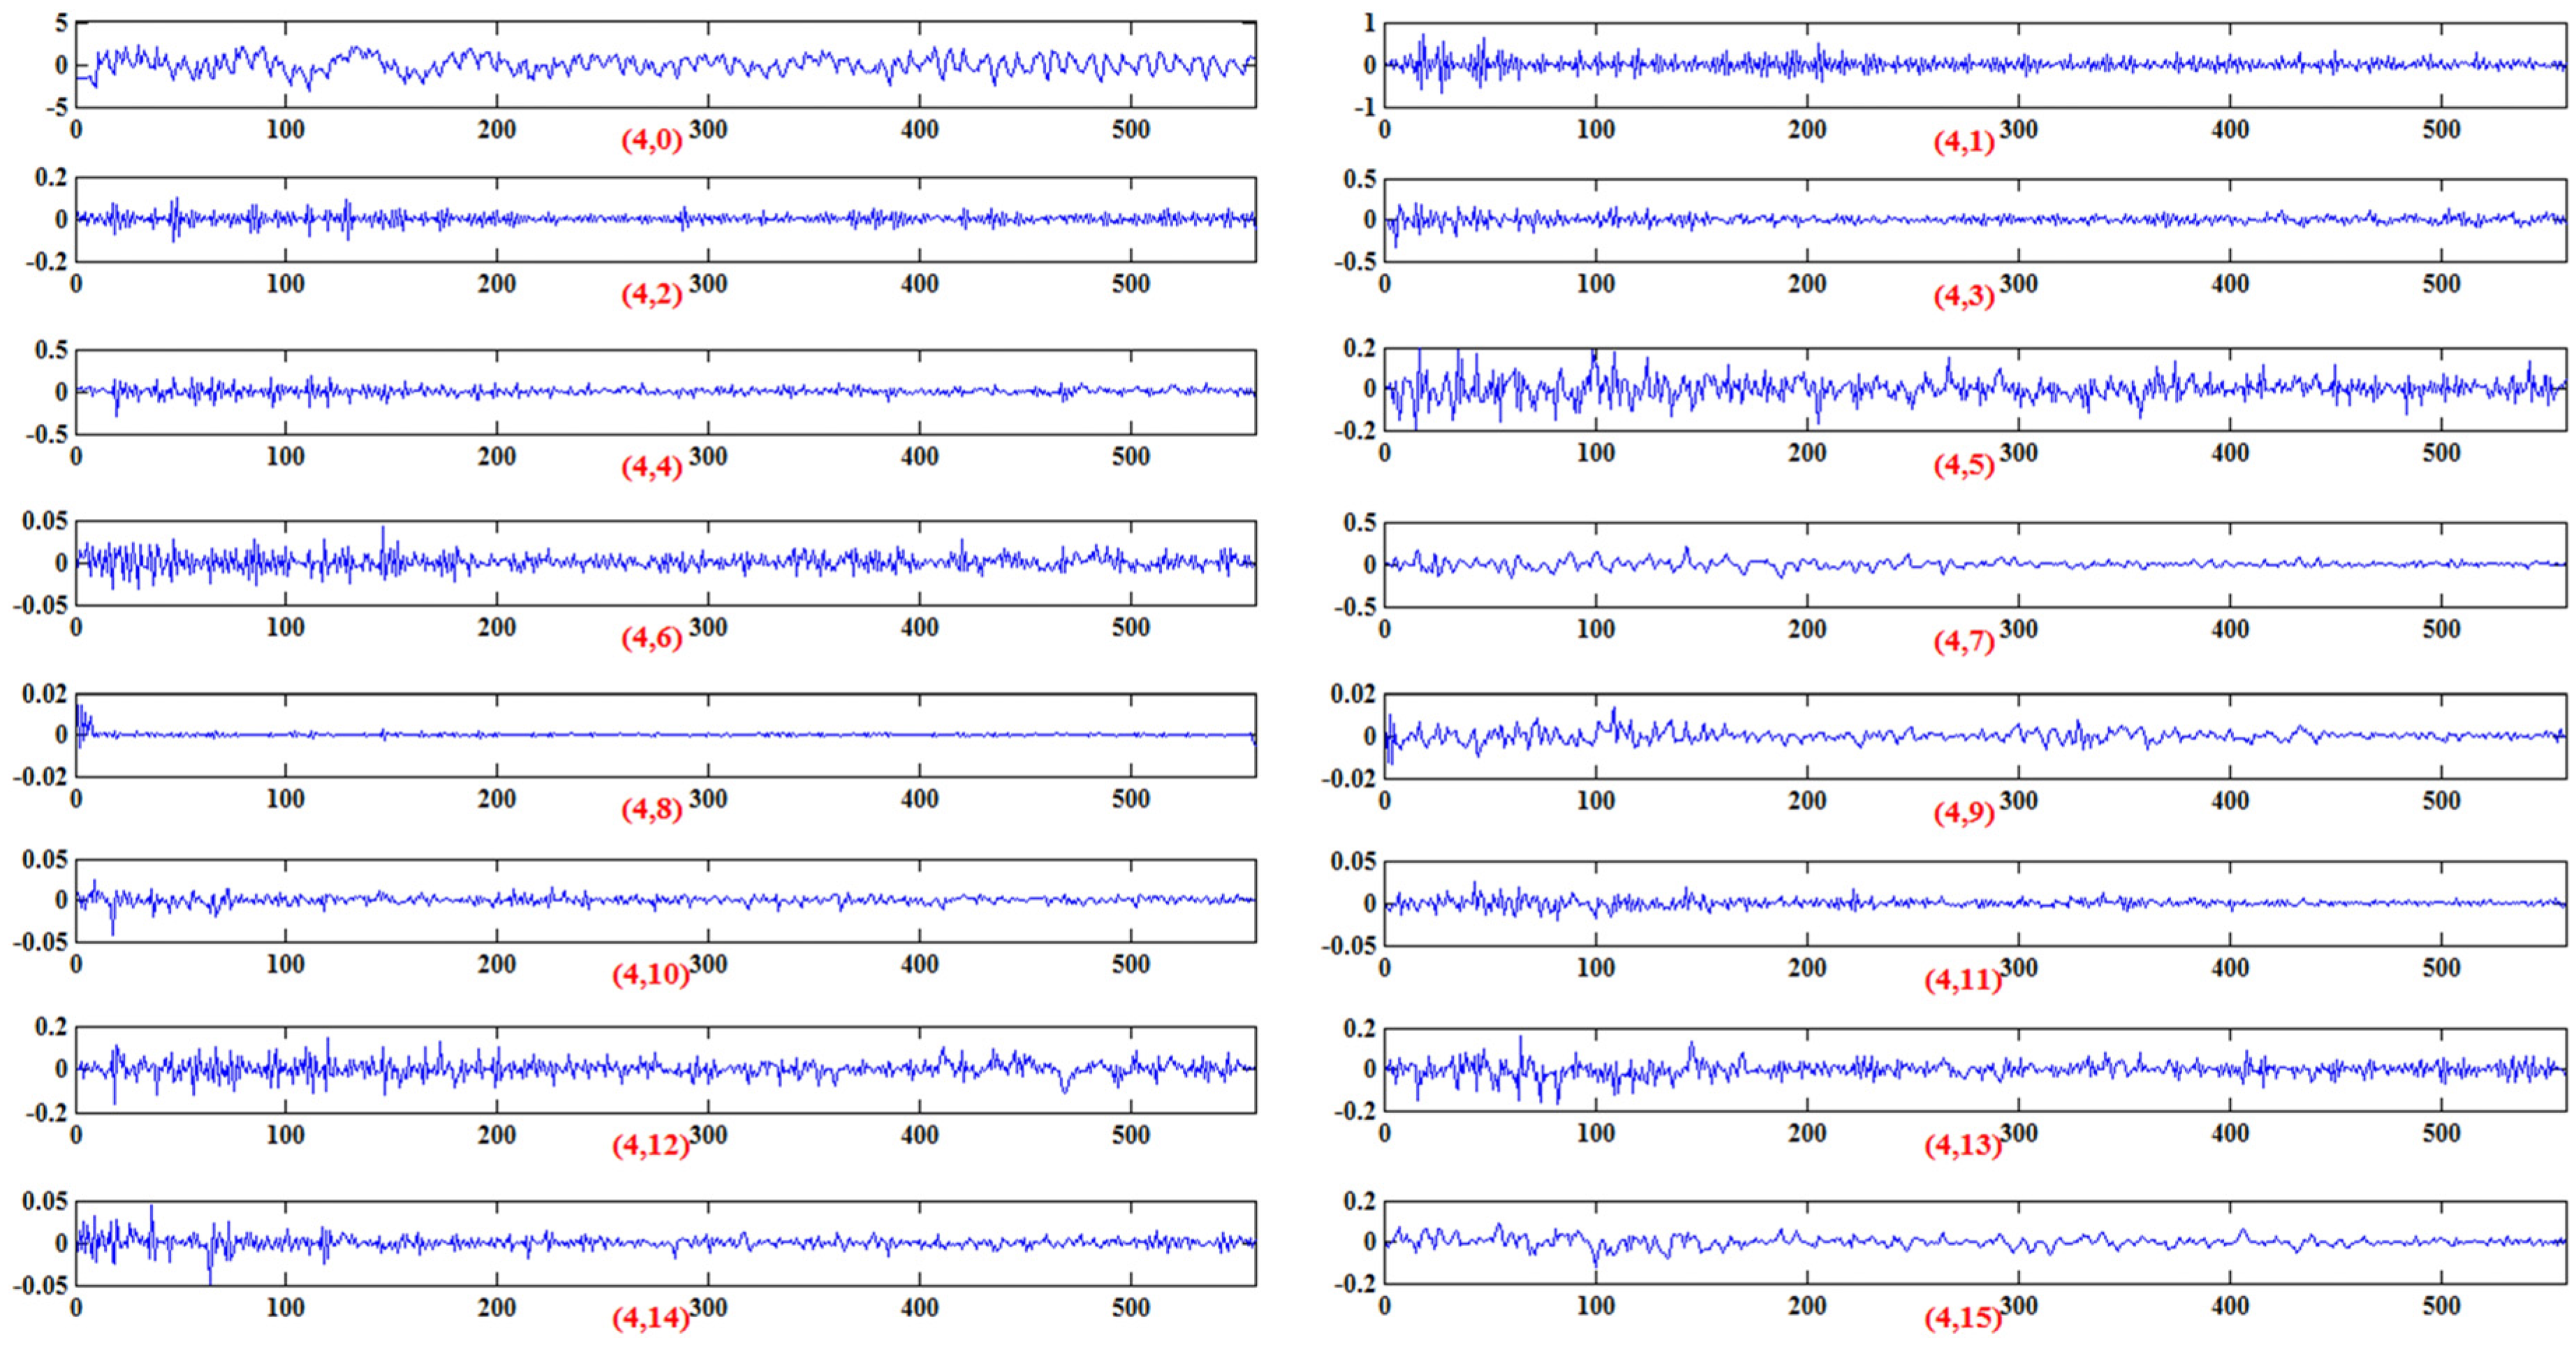
4.2. Pretreatment on Sample Data

WPT was applied for extracting time-frequency features of the samples at first. In this paper, the sound signal was decomposed by db5 wavelet with four levels using a Shannon entropy type. The WPT tree was shown in Figure 6. Sixteen wavelet packet nodes, expressed as (4, 0), (4, 1), (4, 2), …, and (4, 15), were obtained and the coefficients of each node were shown in Figure 7. Then, the energy of each node was calculated according to Equation (13), and normalization was conducted as Equation (14). Each sound signal was described as a 16-dimensional feature vector and shown in Table 2.

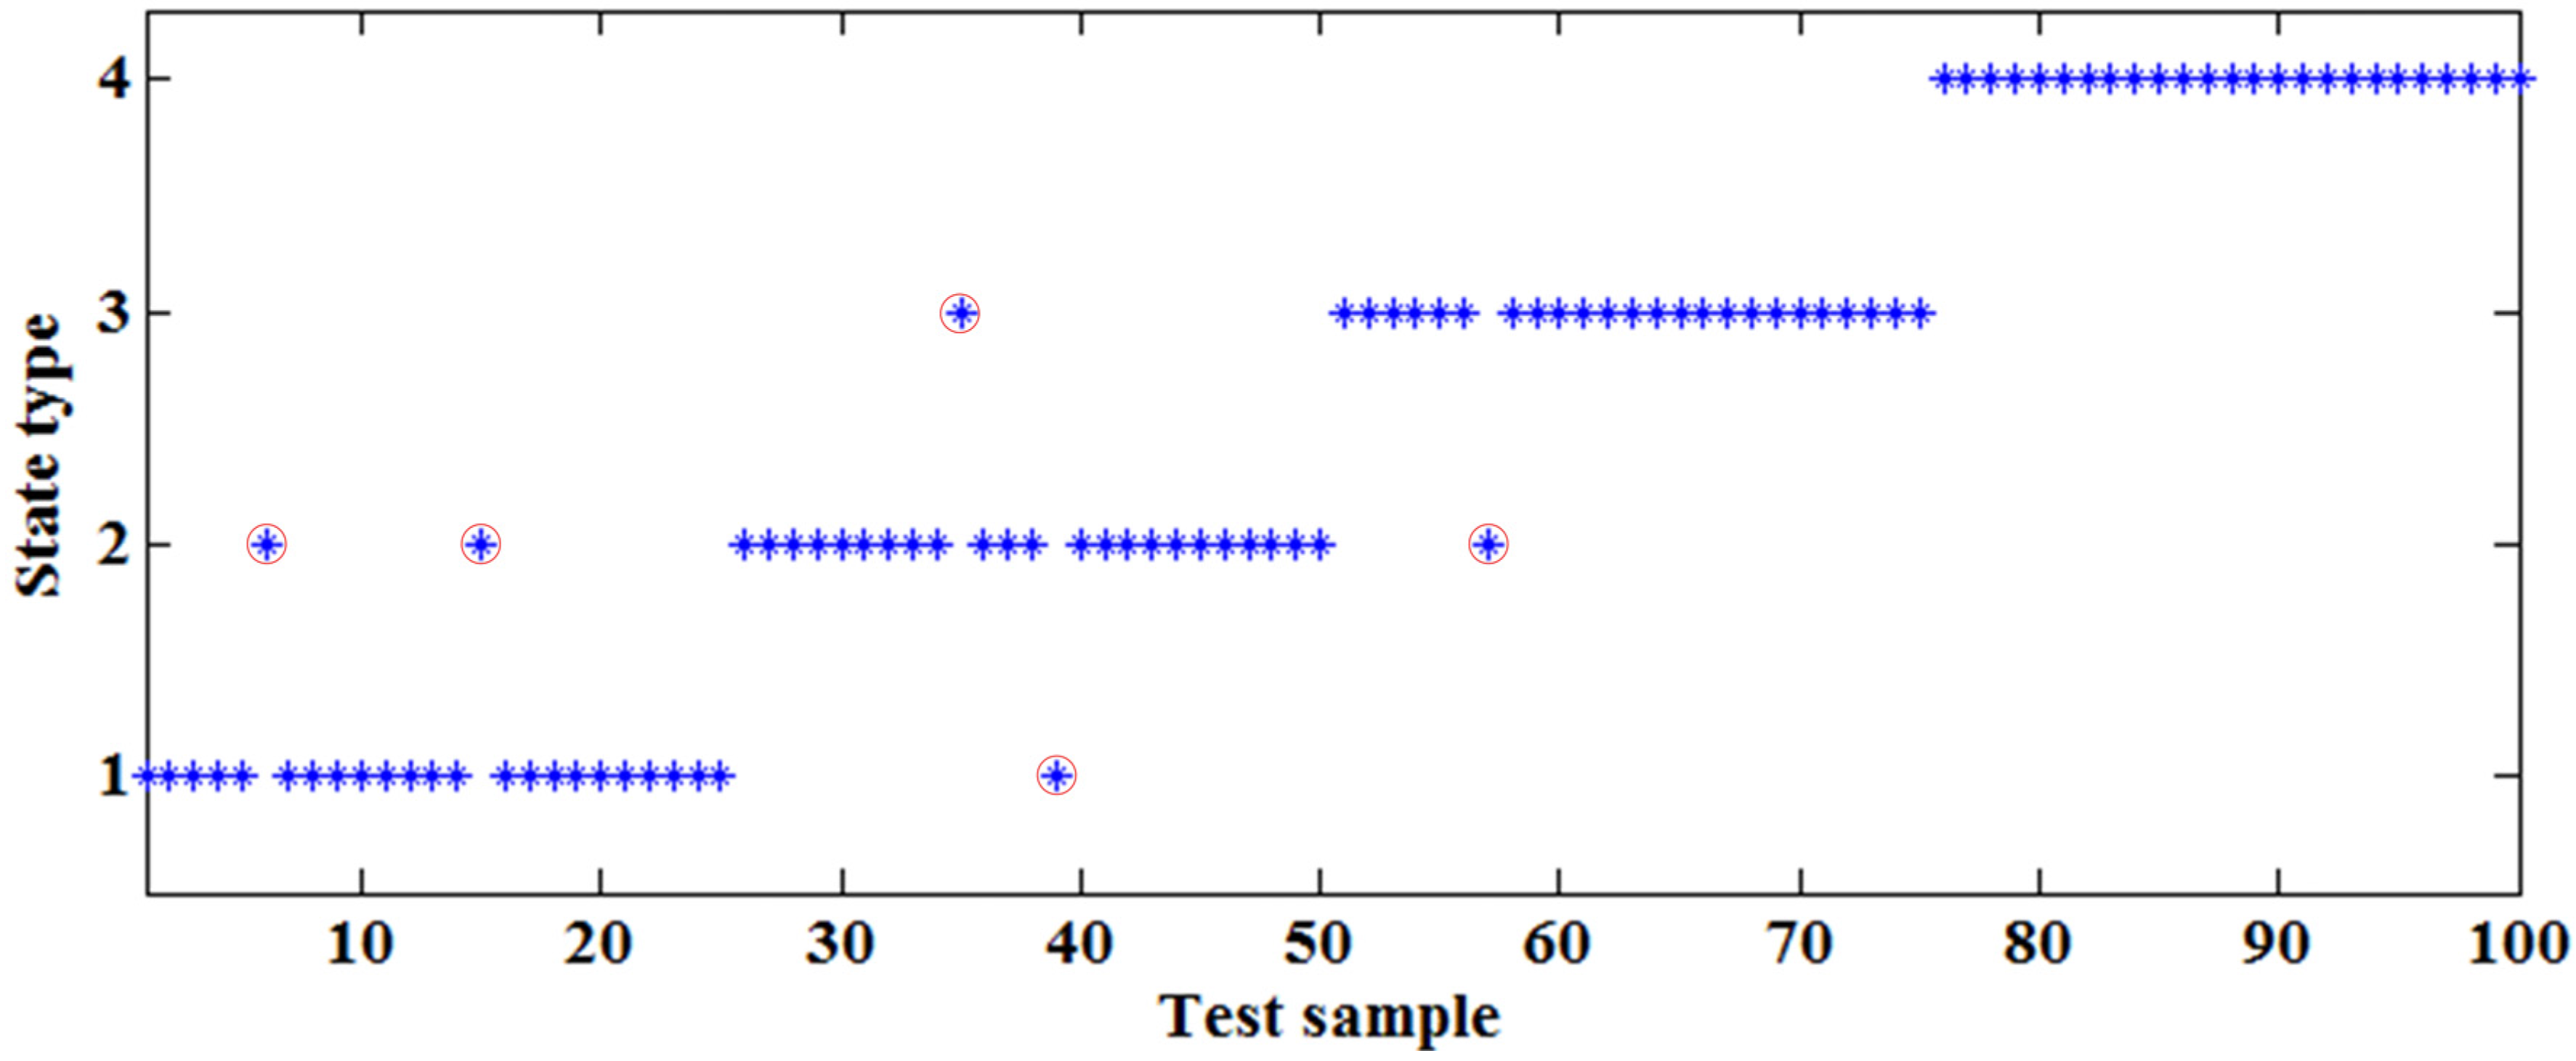
4.3. Clustering Analysis

The parameters of the proposed FCM-FGOA were set as follows: the weighted index m = 2, the threshold value of the iterative process ξ = 10−5, the maximal iteration number N = 100, the random fly distance range L = [−1, 1], the number of fruit flies P = 20, the genetic proportion Pg = 0.3, the crossover probability Pc = 0.8 and the mutation probability Pm = 0.01. The preset recognition accuracy on the testing samples was 90%. The clustering process obtained the convergent fitness value at different preset category number c and selected the maximum as the result. In this paper, the value range of c was [1, 8] and the iteration process at different category numbers was shown in Figure 8. It could be seen from the figure that the maximal fitness value appeared when c was 4. Moreover, the sound samples in practice could be divided as S1, S2, S3 and S4, which was very consistent with the simulation results. In order to validate the accuracy of clustering center obtained from the proposed method, the remaining 100 test samples were applied. The membership value of each sample was calculated according to Equation (3) and the classification result was shown in Figure 9. Five misjudgments occurred in the 100 test samples, so the accuracy of the improved was 95%. It could be seen from the figure that two sample points in S1 were misclassified into S2. One sample in S2 was assigned into S1 and another into S3. The sound series in S3 was confused for S2 once and samples in S4 were classified accurately. The reason lies in the fact that the acoustic signal of cutting objects with similar hardness, such as S1 with S2 and S2 with S3, had small differences. Samples especially from the boundary had larger probability to be misjudged. In comparison, those with obvious distinction, such as S4 with other cutting patterns, could be recognized accurately.
Finally, ten groups of simulations with different genetic proportion Pg were conducted to get the change rule of the fitness value and the convergence time with the proportion value, and the simulation results were listed in Table 3. The category number c was 4, the range of Pg was [0, 1] and the other parameters kept invariant. It could be seen from the table that the convergent fitness was less than 0.643496 when Pg was less than 0.3, and the value was a consistent 0.643496 when fruit flies conducting genetic operation increased. The computation time when the fitness reached the maximal fitness increased with Pg in general. The proposed optimization algorithm was actually FOA when Pg = 0 and turned out to be GA when Pg = 1. Moreover, the optimization easily fell into local extrema while also saving time when FOA occupied the major part, and had outstanding global identity ability while also being time-consuming when GA played a leading role.

4.4. Comparison with the Literature

To demonstrate the superiority of the proposed cutting pattern recognition method through the cutting sound based on FCM-FGOA, some related research were taken was compared. According to the relevant literature, γ-ray concentration detection in [2], vibration analysis in [5], original FCM, FCM optimized by PSO in [23], FCM optimized ACO in [24] and FCM optimized by the combination of PSO and GA (FCM-PSGOA) in [47] were selected as the typical solutions to compare with the proposed FCM-FGOA. The first two approaches adopted the γ-ray concentration of the cutting walls and the vibration of shearer as source signal, respectively. A cutting sound signal was used in the subsequent four methods. Three-hundred training samples were organized to obtain the centers of each cutting pattern, and 100 testing points were introduced for verification. It is necessary to point out that γ-ray concentration and vibration must be detected through contact measurement, which resulted in detectors that were difficult to install and easily damaged during the experiment. The convergence time of the clustering process and the recognition accuracy of the testing samples were listed in Table 4. In order to decrease the accidental error during the experiment, each method was performed ten times, respectively. The average convergence time and recognition rate were presented in the table. It could be seen that sound-based recognition system performed better than other signal sources, and that clustering centers updated by intelligent algorithms had obvious advantages compared to the original FCM. The reason lies in the fact that the original FCM is easily trapped into local extrema, and the iteration solution based on gradient descent algorithm is time-consuming. Moreover, FCM optimized by hybrid optimization algorithms had efficient calculation and high recognition accuracy compared with that of single solutions. The FGOA had overall consideration on the convergence speed and the diversity of population. In summary, the proposed cutting pattern recognition method through cutting sound based on FCM-FGOA had the best comprehensive performance in the comparison.

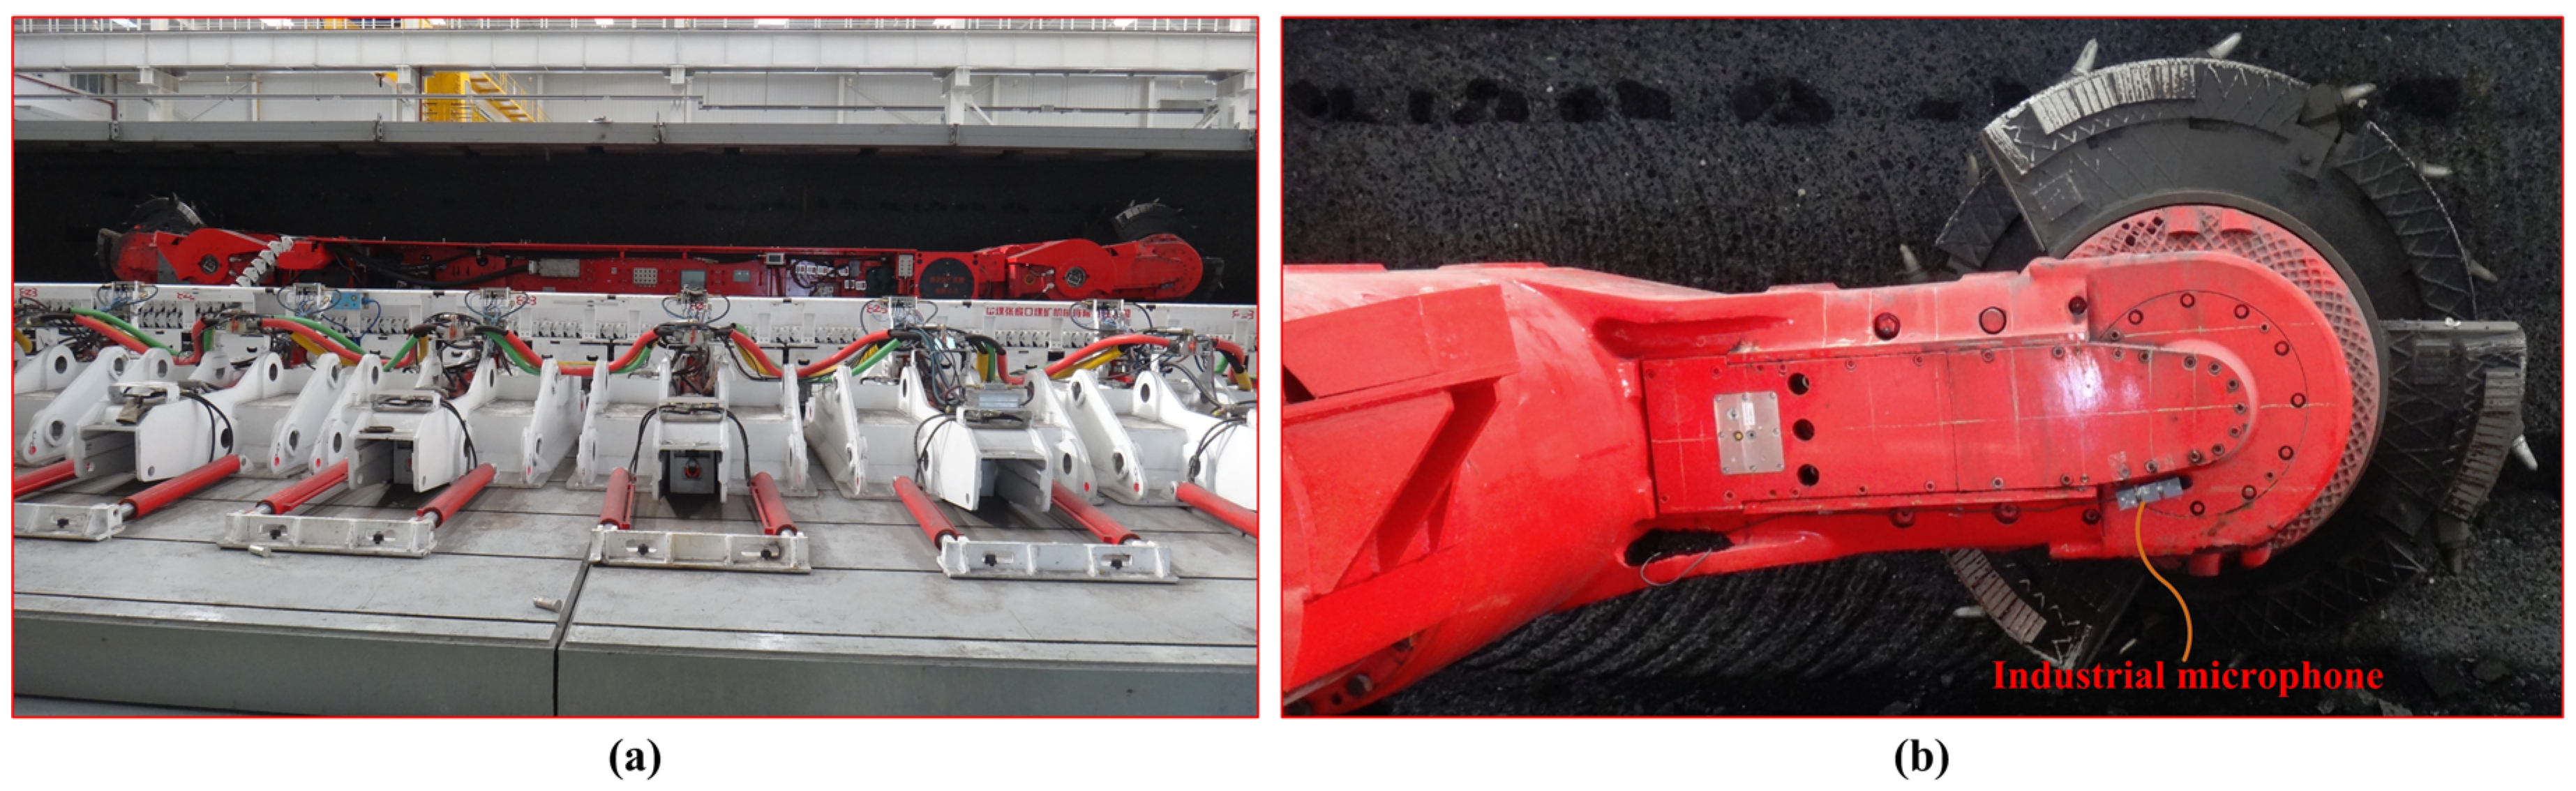
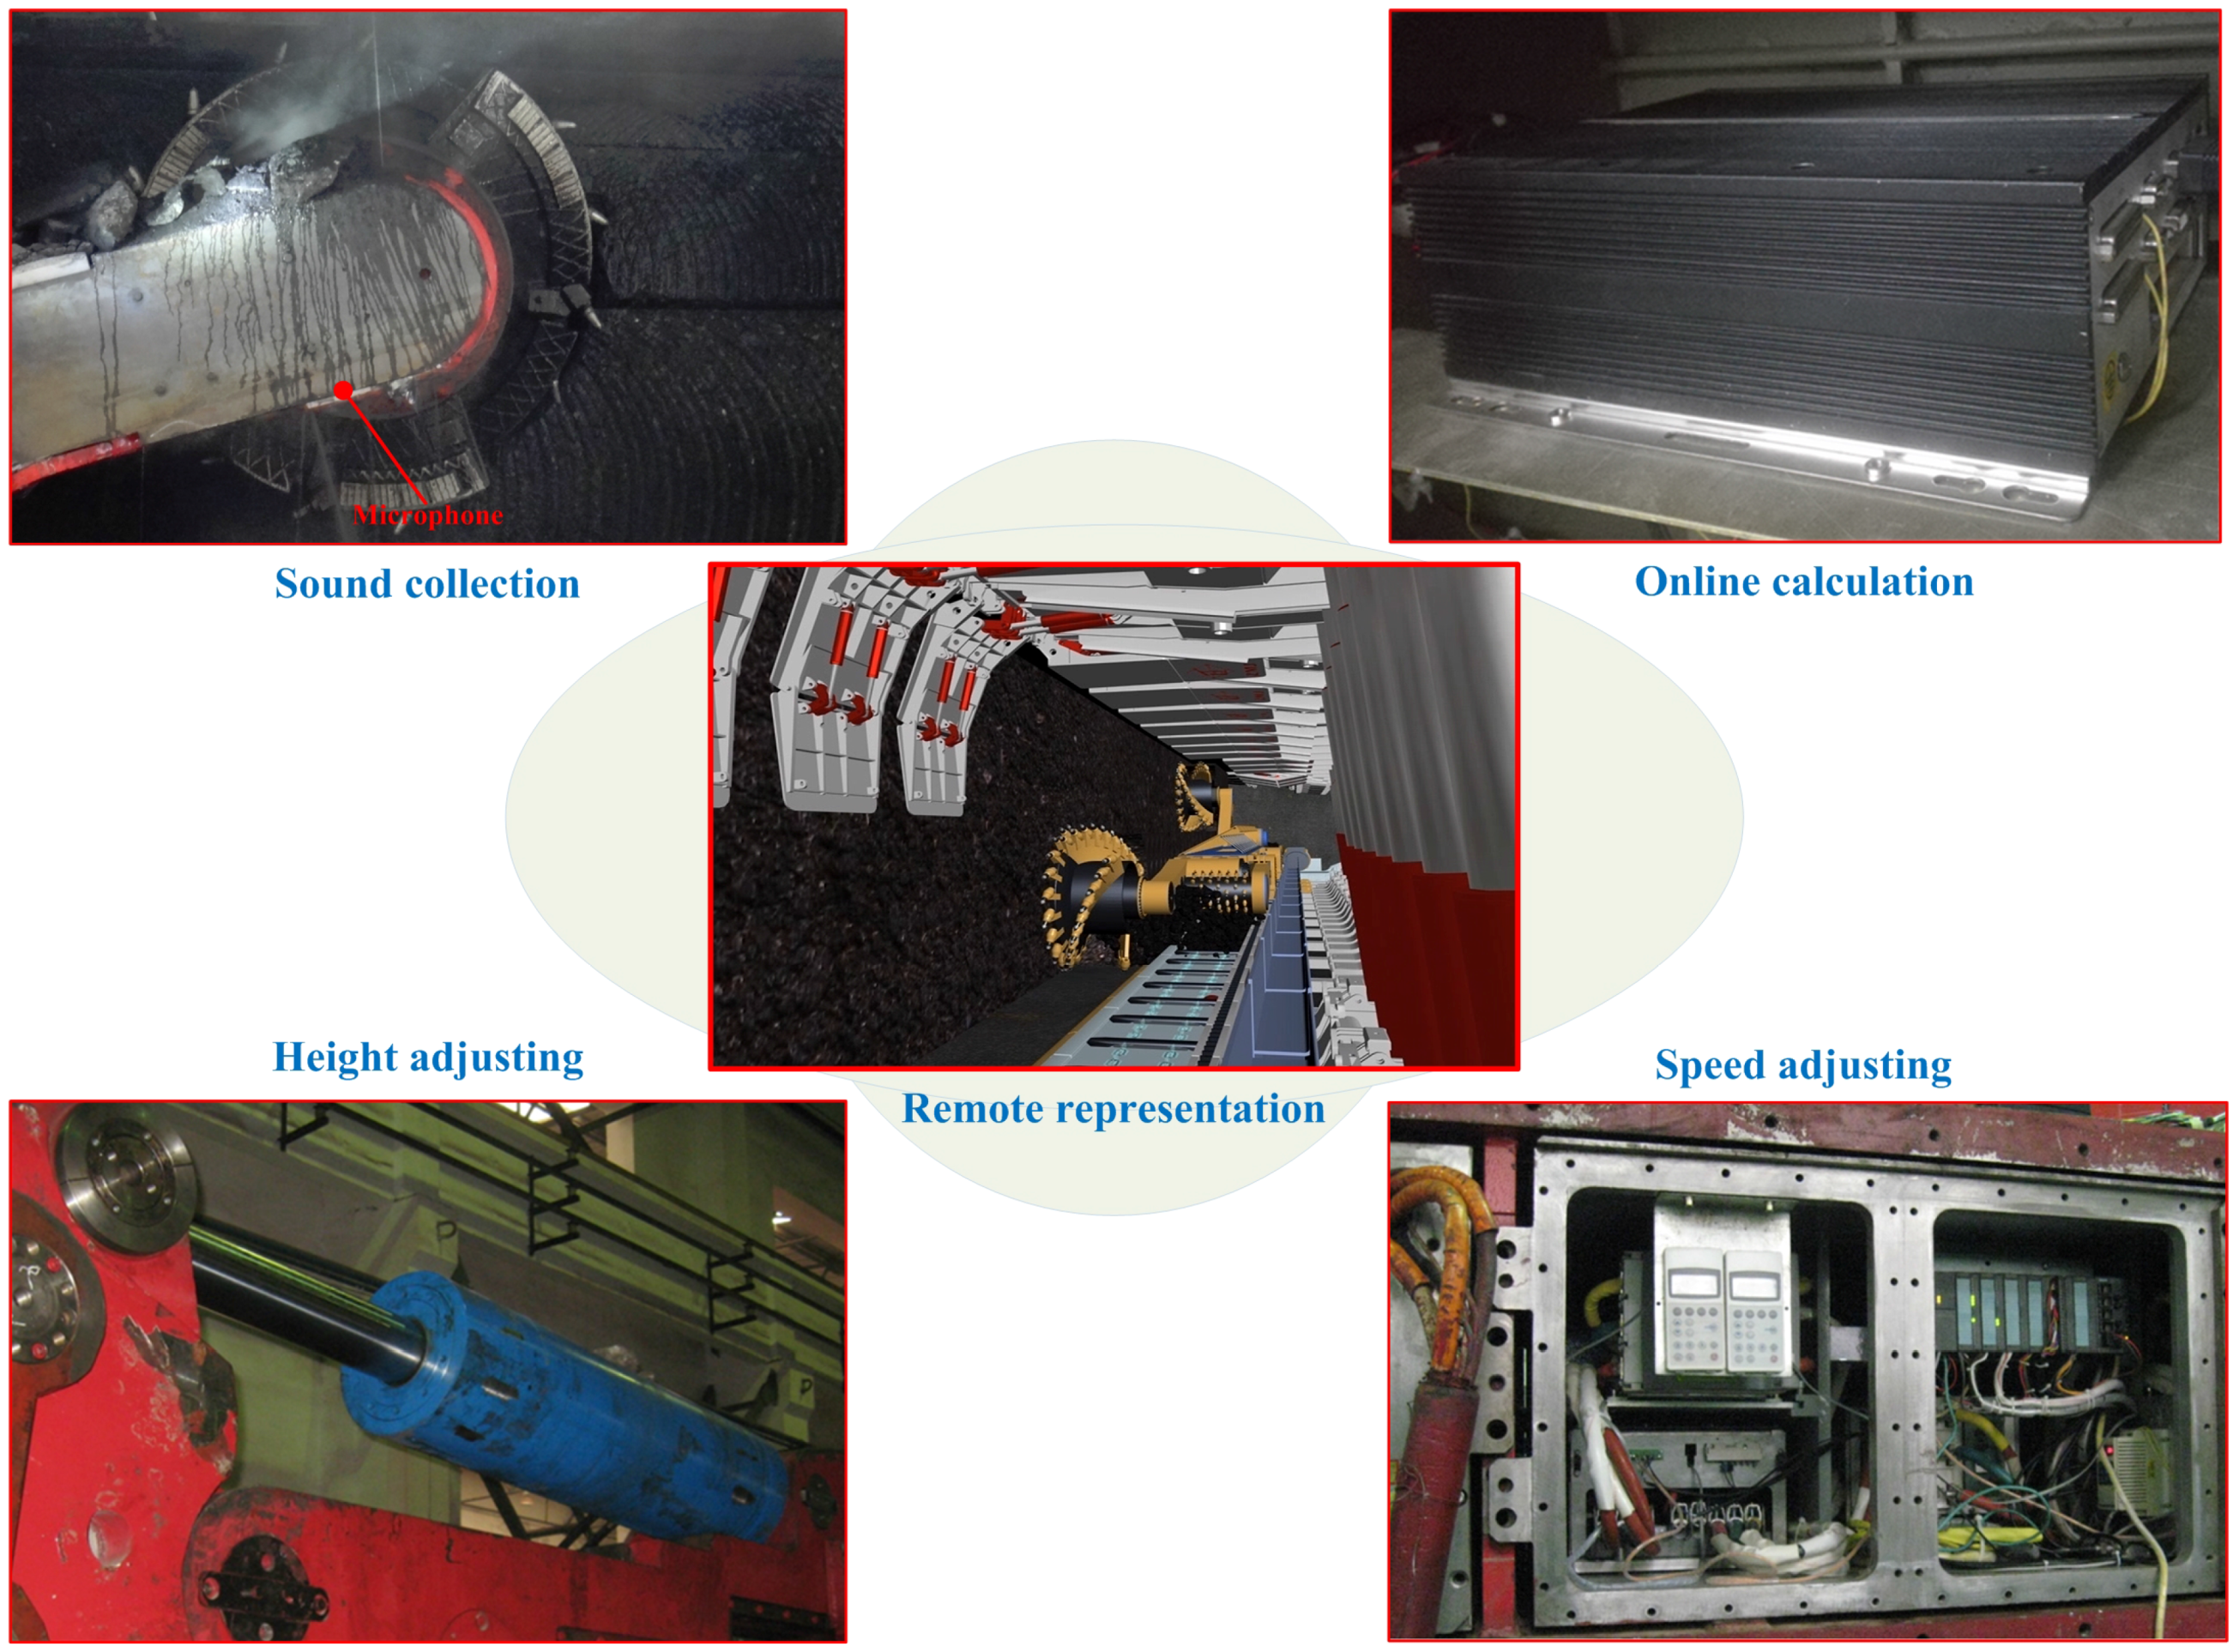
5. Industrial Application

In this section, an online cutting pattern recognition system through the cutting sound based on the proposed FCM-FGOA was established and applied in a coal mine as shown in Figure 10. The industrial experiment was organized at the 2115 coal mining working face in the No. 13 Mine of the Pingdingshan Coal Industrial Group Corporation (Pingdingshan, China). According to the production schedule of the 2115 working face, the expected current of the cutting motor was 27 A. In addition, the changing range of the current should be [−20%, 20%]. Blast protection was conducted on the microphone and the cutting sound was transmitted to the airborne industrial personal computer (IPC). To guarantee the that shearer was working steadily, the IPC calculated the cutting pattern of the shearer online and sent control commands to the hydraulic height adjusting system and variable frequency speed control system of the shearer. The remote working state representation interface was applied to monitor the field condition in the ground control center. In order to exhibit the effectiveness of the system, the cutting current of the shearer was collected and the curve was shown in Figure 11. The current data was from 9:17:00 to 9:47:00 on 22 January 2016, and the changing range of the signal was from 24.3827 to 31.0185 A. The average value of the series was 27.6271 A, and the standard deviation was 0.7816. The maximal value was about 14.883% larger than expected and the minimum was about 9.694% smaller. The shearer kept working steadily and the occurrence of cutting roof was avoided, which proved the stability and reliability of the online system.

6. Conclusions

In order to extract cutting pattern recognition during coal mining, this paper proposed a novel approach through cutting acoustic signals based on FCM and a hybrid optimization. Improved strategy on the basis of introducing a genetic proportion coefficient into original FOA was applied to enhance the diversity of the evolution population. In addition, the intelligent optimization method was used for the iteration process of traditional FCM. To verify the accuracy and superiority of the proposed solution, a simulation example was provided and some comparisons were conducted. The simulation example and comparison results showed that the sound-based cutting pattern recognition method could effectively distinguish the cutting pattern, and the proposed approach surpassed others.
However, there are also some blemishes and shortages in this method that can be listed as follows: (1) genetic proportion coefficient in FGOA is selected mainly through massive simulations. Strict theoretical analysis and derivation are absent, which increases blindness and uncertainty of the recognition system; and (2) only four typical geological conditions are simulated in the data acquisition stage, while it is extremely complex and variable for field coal-rock distribution. Thus, the adaptability of the approach remains to be improved. In future studies, the authors plan to implement some improvements on the proposed method. These may include a strict algorithm to select an appropriate genetic proportion coefficient in FGOA, higher execution efficiency of the algorithm code, and stronger adaptability for the online recognition system.

Acknowledgments

We gratefully acknowledge the support of the Joint Funds of the National Natural Science Foundation of China (No. U1510117), the National Key Basic Research Program of China (No. 2014CB046301), the Postgraduate Scientific Research and Innovation Project of Jiangsu Province (KYZZ16_0212) and the Priority Academic Program Development (PAPD) of Jiangsu Higher Education Institutions in carrying out this research.

Author Contributions

Zhongbin Wang and Jing Xu contributed the new processing method; Chao Tan, Lin Zhang and Xinhua Liu designed the simulations and experiments; and Jiabiao Wang and Jing Xu performed the experiments; and Jing Xu wrote the paper.

Conflicts of Interest

The authors declare no conflict of interest.

References

  1. Xu, J.L.; Wang, Z.C.; Zhang, W.Z.; He, Y.P. Coal-rock interface recognition based on MFCC and neural network. Int. J. Signal Process. Image Process. Pattern Recognit. 2013, 6, 191–200. [Google Scholar] [CrossRef]
  2. Bessinger, S.L.; Neison, M.G. Remnant roof coal thickness measurement with passive gamma ray instruments in coal mine. IEEE Trans. Ind. Appl. 1993, 29, 562–565. [Google Scholar] [CrossRef]
  3. Sun, J.P.; She, J. Coal-rock imagefeature extraction and recognition based on support vector machine. J. China Coal Soc. 2013, 38, 508–512. [Google Scholar]
  4. Si, L.; Wang, Z.B.; Tan, C.; Liu, X.H. A novel approach for coal seam terrain prediction through information fusion of improved D–S evidence theory and neural network. Measurement 2014, 54, 140–151. [Google Scholar] [CrossRef]
  5. Wang, B.P.; Wang, Z.C.; Zhang, W.Z. Coal-rock interface recognition method based on EMD and neural network. J. Vib. Meas. Diagn. 2012, 32, 586–590. [Google Scholar] [CrossRef] [PubMed]
  6. Zhang, Y. Recognition system of coal and rock on mechanized coal mining face. Adv. Inf. Sci. Serv. Sci. 2012, 4, 101–107. [Google Scholar]
  7. Ramathilagam, S.; Huang, Y.M. Extended Gaussian kernel version of fuzzy c-means in the problem of data analyzing. Expert Syst. Appl. 2011, 38, 3793–3805. [Google Scholar] [CrossRef]
  8. Yin, P.Y.; Chen, L.H. A new non-iterative approach for clustering. Pattern Recognit. Lett. 1994, 15, 125–133. [Google Scholar] [CrossRef]
  9. Siripen, W. A multi-objective genetic algorithm with fuzzy c-means for automatic data clustering. Appl. Soft Comput. 2014, 24, 679–691. [Google Scholar]
  10. Das, S.; Abraham, A.; Konar, A. Automatic clustering using an improved differential evolution algorithm. IEEE Trans. Syst. Man. Cybern. 2008, 38, 218–237. [Google Scholar] [CrossRef]
  11. Ilker, O.; Lee, H.M.; Sullivan, M.R.; Wang, S.S. Identification and clustering of event patterns from in vivo multiphoton optical recordings of neuronal ensembles. J. Neurophysiol. 2008, 100, 495–503. [Google Scholar]
  12. Masoud, Y.; Nasim, G. GeneticTKM: A hybrid clustering method based on genetic algorithm, tabu search and k-means. Int. J. Appl. Metaheuristic Comput. 2013, 4, 67–77. [Google Scholar]
  13. Gowri, R.; Rathipriya, R. Protein motif comparator using PSO k-means. Int. J. Appl. Metaheuristic Comput. 2016, 7, 56–68. [Google Scholar]
  14. Haider, A. K-Medoids based clustering of PlanetLab's slice-centric data. Appl. Math. Inf. Sci. 2013, 7, 2372–2384. [Google Scholar] [CrossRef]
  15. Wang, J.; Chung, F.L.; Wang, S.T.; Deng, Z.H. Double indices-induced FCM clustering and its integration with fuzzy subspace clustering. Pattern Anal. Appl. 2014, 17, 549–566. [Google Scholar] [CrossRef]
  16. Baraldi, P.; Francesco, D.M.; Rigamonti, M.; Zio, E.; Seraoui, R. Clustering for unsupervised fault diagnosis in nuclear turbine shut-down transients. Mech. Syst. Signal Process. 2015, 58, 160–178. [Google Scholar] [CrossRef]
  17. Zhang, J.H.; Peng, X.D.; Liu, H.; Raisch, J.; Wang, R.B. Classifying human operator functional state based on electrophysiological and performance measures and fuzzy clustering method. Cogn. Neurodynamics 2013, 7, 477–494. [Google Scholar] [CrossRef] [PubMed]
  18. Chen, S.C.; Zhang, D.Q. Robust image segmentation using FCM with spatial constraints based on new kernel-induced distance measure. IEEE Trans. Syst. Man Cybern. 2004, 34, 1907–1916. [Google Scholar] [CrossRef]
  19. Stetco, A.; Zeng, X.J.; Keane, J. Fuzzy C-means ++: Fuzzy C-means with effective seeding initialization. Expert Syst. Appl. 2015, 42, 7541–7548. [Google Scholar] [CrossRef]
  20. Tang, J.J.; Zhang, G.H.; Wang, Y.H.; Wang, H.; Liu, F. A hybrid approach to integrate fuzzy C-means based imputation method with genetic algorithm for missing traffic volume data estimation. Transp. Res. Part C 2015, 51, 29–40. [Google Scholar] [CrossRef]
  21. Havens, T.C.; Bezdek, J.C.; Leckie, C.; Hall, L.O.; Palaniswami, M. Fuzzy c-means algorithms for very large data. IEEE Trans. Fuzzy Syst. 2012, 20, 1130–1146. [Google Scholar] [CrossRef]
  22. Parker, J.K.; Hall, L.O. Accelerating fuzzy-c means using an estimated subsample size. IEEE Trans. Fuzzy Syst. 2014, 22, 1229–1244. [Google Scholar] [CrossRef] [PubMed]
  23. Jin, G.F.; Zhang, W.; Yang, Z.W.; Huang, Z.Y.; Song, Y.J.; Wang, D.D.; Tian, G. Image segmentation of thermal waving inspection based on particle swarm optimization fuzzy clustering algorithm. Meas. Sci. Rev. 2012, 12, 296–301. [Google Scholar]
  24. Biniaz, A.; Abbasi, A. Unsupervised ACO: Applying FCM as a supervisor for ACO in medical image segmentation. J. Intell. Fuzzy Syst. 2014, 27, 407–417. [Google Scholar]
  25. Gil, J.M.; Han, Y.H. A target coverage scheduling scheme based on genetic algorithms in directional sensor networks. Sensors 2011, 11, 1888–1906. [Google Scholar] [CrossRef] [PubMed]
  26. Liang, J.J.; Qin, A.K.; Suganthan, P.N.; Baskar, S. Comprehensive learning particle swarm optimizer for global optimization of multimodal functions. IEEE Trans. Evolut. Comput. 2006, 10, 281–295. [Google Scholar] [CrossRef]
  27. Karaboga, D.; Basturk, B. A powerful and efficient algorithm for numerical function optimization: Artificial bee colony (ABC) algorithm. J. Global Optim. 2007, 39, 459–471. [Google Scholar] [CrossRef]
  28. Day, R.F.; Yin, P.Y.; Wang, Y.C.; Chao, C.H. Hybrid multi-start tabu search for finding hidden decision strategies based on eye-movement data clustering. Appl. Soft Comput. 2016, 48, 217–229. [Google Scholar] [CrossRef]
  29. Kwedlo, W. A clustering method combining differential evolution with the K-means algorithm. Pattern Recogn. Lett. 2011, 32, 1613–1621. [Google Scholar] [CrossRef]
  30. Wang, X.; Wang, S.; Ma, J.J. An improved co-evolutionary particle swarm optimization for wireless sensor networks with dynamic deployment. Sensors 2007, 7, 354–370. [Google Scholar] [CrossRef]
  31. Alavi, S.M.; Naini, A.F. A comparison between GA, PSO, and IWO for shaped beam reflector antennas. Int. J. Microw. Wirel. Technol. 2015, 7, 565–570. [Google Scholar] [CrossRef]
  32. Mao, L.; Mao, Y.; Zhou, C.; Li, C.; Wei, X.; Yang, H. Particle swarm and bacterial foraging inspired hybrid artificial bee colony algorithm for numerical function optimization. Math. Probl. Eng. 2016. [Google Scholar] [CrossRef]
  33. Luan, X.Y.; Li, Z.P.; Liu, T.Z. A novel attribute reduction algorithm based on rough set and improved artificial fish swarm algorithm. Neurocomputing 2016, 174, 522–529. [Google Scholar] [CrossRef]
  34. Liu, L.L.; Hu, R.S.; Hu, X.P.; Zhao, G.P.; Wang, S. A hybrid PSO-GA algorithm for job shop scheduling in machine tool production. Int. J. Prod. Res. 2015, 53, 5755–5781. [Google Scholar] [CrossRef]
  35. Lavanya, G.; Srinivasan, S. Application of fractional order ABC and GA for neural network training and clustering process. Int. J. Comput. Intell. Syst. 2015, 8, 900–913. [Google Scholar] [CrossRef]
  36. Sheikhan, M.; Mohammadi, N. Neural-based electricity load forecasting using hybrid of GA and ACO for feature selection. Neural Comput. Appl. 2012, 21, 1961–1970. [Google Scholar] [CrossRef]
  37. Pan, W.T. A new fruit fly optimization algorithm: Taking the financial distress model as an example. Knowledge-Based Syst. 2012, 26, 69–74. [Google Scholar] [CrossRef]
  38. Li, H.Z.; Guo, S.; Li, C.J.; Sun, J.Q. A hybrid annual power load forecasting model based on generalized regression neural network with fruit fly optimization algorithm. Knowledge-Based Syst. 2013, 37, 378–387. [Google Scholar] [CrossRef]
  39. Li, H.Z.; Guo, S.; Zhao, H.R.; Su, C.B.; Wang, B. Annual electric load forecasting by a least squares support vector machine with a fruit fly optimization algorithm. Energies 2012, 11, 4430–4445. [Google Scholar] [CrossRef]
  40. Zheng, X.L.; Wang, L.; Wang, S.Y. A novel fruit fly optimization algorithm for the semiconductor final testing scheduling problem. Knowledge-Based Syst. 2014, 57, 95–103. [Google Scholar] [CrossRef]
  41. Shan, D.; Cao, G.H.; Dong, H.J. LGMS-FOA: An improved fruit fly optimization algorithm for solving optimization problems. Math. Probl. Eng. 2013. [Google Scholar] [CrossRef]
  42. Wang, L.; Shi, Y.L.; Liu, S. An improved fruit fly optimization algorithm and its application to joint replenishment problems. Expert Syst. Appl. 2015, 42, 4310–4323. [Google Scholar] [CrossRef]
  43. Ramachandran, B.; Bellarmine, G.T. Improving observability using optimal placement of phasor measurement units. Int. J. Elec. Power 2014, 56, 55–63. [Google Scholar] [CrossRef]
  44. Pan, Q.K.; Sang, H.Y.; Duan, J.H.; Gao, L. An improved fruit fly optimization algorithm for continuous function optimization problems. Knowledge-Based Syst. 2014, 62, 69–83. [Google Scholar] [CrossRef]
  45. Gao, L.X.; Yang, Z.J.; Cai, L.G.; Wang, H.Q.; Chen, P. Roller bearing fault diagnosis based on nonlinear redundant lifting wavelet packet analysis. Sensors 2011, 11, 260–277. [Google Scholar] [CrossRef] [PubMed]
  46. Feng, Y.H.; Schlindwein, F.S. Normalized wavelet packets quantifiers for condition monitoring. Mech. Syst. Signal Pr. 2009, 23, 712–723. [Google Scholar] [CrossRef]
  47. Lei, H.X.; Liu, N.; Cui, D.J.; Ma, T.J.; Xu, H.B. Transformer fault diagnosis based on optimized FCM clustering by hybrid GA and PSO. Power Syst. Protect. Control 2011, 39, 52–56. [Google Scholar]
Figure 1. Foraging process of fruit fly swarm.
Applsci 06 00294 g001
Figure 2. Iterative process of the proposed fruit fly genetic optimization algorithm (FGOA).
Applsci 06 00294 g002
Figure 3. Flowchart of the fuzzy C-means (FCM)-FGOA. WPT, wavelet packet transform.
Applsci 06 00294 g003
Figure 4. The experimental site. (a) Site layout of the platform; and (b) installation of the microphone.
Applsci 06 00294 g004
Figure 5. Four kinds of cutting sound signals. (a) Sound of coal seam with f2; (b) sound of coal seam with f3; (c) sound of coal seam gripping gangue; and (d) sound of no-load.
Applsci 06 00294 g005
Figure 6. Structure of WPT tree.
Applsci 06 00294 g006
Figure 7. Wavelet packet node coefficients.
Applsci 06 00294 g007
Figure 8. Iteration process at different category numbers.
Applsci 06 00294 g008
Figure 9. Comparison between actual state and the proposed method. Blue points mean the samples are classified correctly, blue points with red circle mean the samples are misjudged into other cutting pattern.
Applsci 06 00294 g009
Figure 10. Online cutting pattern recognition system.
Applsci 06 00294 g010
Figure 11. Cutting current of the shearer in 30 min.
Applsci 06 00294 g011
Table 1. Configuration of the work station.
Operating SystemWindows 10 (64 bits)
CPUIntel Xeon E5-2690 (8 cores, 2.9 GHz)
Memory16 GB (DDR3)
Hard disk spaceSSD (512GB)
Matlab version ( MathWorks Inc., Na tick, MD, USA, 2012)8.0
Table 2. Feature vectors of the 300 samples.
NumberFeature Vector
1[0.767079, 0.01970, 0.000509, 0.002197, 0.002056, 0.002177, 0.000075, 0.001561, 0.000001, 0.000006, 0.000021, 0.000020, 0.001224, 0.001112, 0.000045, 0.000417]
2[0.771856, 0.176547, 0.013883, 0.174835, 0.002439, 0.00517, 0.003403, 0.008946, 0.000030, 0.000150, 0.000295, 0.000244, 0.001405, 0.001727, 0.000374, 0.000991]
3[0.744010, 0.118100, 0.067296, 0.063892, 0.031492, 0.002508, 0.055797, 0.008220, 0.000003, 0.000004, 0.000282, 0.000024, 0.000880, 0.000462, 0.000360, 0.000263]
4[0.804032, 0.006559, 0.000681, 0.002085, 0.000015, 0.000053, 0.000241, 0.000120, 0.000001, 0.000006, 0.000011, 0.000009, 0.000011, 0.000015, 0.000011, 0.000013]
399[0.734019, 0.097592, 0.073854, 0.101107, 0.020851, 0.003079, 0.0601384, 0.009932, 0.000002, 0.000006, 0.000730, 0.000009, 0.002013, 0.000099, 0.000670, 0.000155]
400[0.699824, 0.012047, 0.000935, 0.002409, 0.000031, 0.000019, 0.000310, 0.000119, 0.000003, 0.000011, 0.000017, 0.000004, 0.000009, 0.000037, 0.000007, 0.000022]
Table 3. Fitness value and the corresponding convergence time at different Pg.
Genetic ProportionFitness ValueConvergence Time (s)
00.5096242.173550
0.10.6005242.960945
0.20.4210243.581077
0.30.6434964.433216
0.40.6434965.698395
0.50.6434969.298510
0.60.6434968.314697
0.70.64349610.441968
0.80.64349617.276850
0.90.64349615.218627
1.00.64349621.970014
Table 4. Comparison of some related methods.
Compared MethodsConvergence Time (s)Recognition Accuracy
γ-ray detection32.77603144%
Vibration analysis18.76441057%
FCM a17.00796464%
PSO-FCM b3.89623782%
ACO-FCM c5.67458379%
PSGOA-FCM d6.96355092%
The proposed method4.43321695%
a FCM, fuzzy C-means; b PSO-FCM, particle swarm optimization-FCM; c ACO-FCM, ant colony optimization-FCM; d PSGOA-FCM, particle swarm genetic optimization-FCM.

