Article

Identification of the Response of a Controlled Building Structure Subjected to Seismic Load by Using Nonlinear System Models

1
Department of Civil and Environmental Engineering, Incheon National University, 12-1 Songdo-dong, Yeonsu-gu, Incheon 22012, Korea
2
Incheon Disaster Prevention Research Center, Incheon National University, 12-1 Songdo-dong, Yeonsu-gu, Incheon 22012, Korea
3
Department of Public Works and Civil Engineering, Mansoura University, Mansoura 35516, Egypt
4
Department of Civil and Environmental Engineering, Louisiana State University, Baton Rouge, LA 70803, USA
*
Author to whom correspondence should be addressed.
Appl. Sci. 2016, 6(10), 301; https://doi.org/10.3390/app6100301
Submission received: 3 August 2016 / Revised: 2 October 2016 / Accepted: 12 October 2016 / Published: 18 October 2016

Abstract

:
The present study investigates the prediction efficiency of nonlinear system-identification models, in assessing the behavior of a coupled structure-passive vibration controller. Two system-identification models, including Nonlinear AutoRegresive with eXogenous inputs (NARX) and adaptive neuro-fuzzy inference system (ANFIS), are used to model the behavior of an experimentally scaled three-story building incorporated with a tuned mass damper (TMD) subjected to seismic loads. The experimental study is performed to generate the input and output data sets for training and testing the designed models. The parameters of root-mean-squared error, mean absolute error and determination coefficient statistics are used to compare the performance of the aforementioned models. A TMD controller system works efficiently to mitigate the structural vibration. The results revealed that the NARX and ANFIS models could be used to identify the response of a controlled structure. The parameters of both two time-delays of the structure response and the seismic load were proven to be effective tools in identifying the performance of the models. A comparison based on the parametric evaluation of the two methods showed that the NARX model outperforms the ANFIS model in identifying structures response.

1. Introduction

Recently, application of control systems on smart structures in many fields of engineering has been greatly increased. These control systems are used to control the dynamic behavior of complex structural systems of structures located at high risks areas [1,2,3]. Passive and active control systems are used to control the vibration of structures subjected to wind, seismic loads, etc. More information regarding the control strate gies can be found in [1,4,5]. Passive control systems are commonly used for building structures. Vibration control and damage detection of regular and irregular buildings are summarized in [5,6,7]. Ponzo et al. [8] studied an experimental regular frame steel building with passive and semi-active control system under seismic loads. In their study, they reported the effectiveness of the used control system in reducing the seismic effects. Moreover, Mazza [9] and Kim et al. [10] presented a controlled irregular building performance under seismic effects, and observed that the controlled system can reduce the nonlinear performance of structures. In addition, Bigdeli and Kim [5] performed a complete experimental study on three passive control systems including tuned liquid column damper (TLCD), tuned liquid damper (TLD) and tuned mass damper (TMD) to identify the damping and mass contributions of each system in the building vibration reduction. They found that the TMD control system has the highest damping contribution by 49.1% vibration mitigation. Furthermore, many advantages of the TMD over liquid passive controller system are reported in [10]. Therefore, this study focuses on the performance of the TMD controlled structures (as experimental study).
Smart structures performance is controlled in time and frequency domains. In time domain, the magnitude and time period affects decrease, as well as the power spectrum density decreases with the increase of the TMD mass [5]. Moreover, the response of controlled structures decrease more than uncontrolled ones [4]. The nonlinearity performance of controlled structures occurs due to the nonlinearity damping devices of structures [1,3,10]. As such, nonlinear mathematical models are needed to study the relation between input loads and output performance of smart structures to develop predicting models for the performance of controlled structures. Some researchers designed identifications models for smart structures equipped with magnetorheological (MR) damper systems [1,3,11]. This study aims at developing a new application for nonlinear system identification (SI) for describing the behavior of seismically excited building attached with TMD control system.
Commonly, the parametric and non-parametric models are the categories of system identification (SI) [1,12]. The models that are dependent on the physical quantities are considered as parametric models, while the models used to train the input–output map of structural system are non-parametric [1]. Two non-parametric models are defined: input–output and output-only models. More details on structures identification models can be found in [13,14]. The output-only SI is commonly used for structures long monitoring systems [12]. In this paper, an input–output SI model is used and the data is collected from an experimental study.
Adaptive neuro-fuzzy interference system (ANFIS) is the widely SI method applied for the response of controlled structures [1,3]. Two systems are developed by Arsava et al. [1] and Mitchell et al. [3] including the wavelet and one time-delayed ANFIS models, and they were effective in identifying structural behaviors. In their studies, the wavelet analysis is used to de-noise the input signal(s) of the identification models. Therefore, with the filtered data this model is insignificant, as some information on the structural performance can be lost. The one time-delayed ANFIS model is applied; however, in this study, we have used one and two time-delays for the output of the ANFIS model. Simple models have not been used to model the response of controlled structures. In this study, Nonlinear AutoRegresive with eXogenous inputs (NARX) will be examined and a simplified model will be obtained in the behavior evaluation of these types of structures. Despite being used in previous studies [13,14,15,16,17], the NARX is used, in this study, for modeling the behavior of structures equipped with passive controller.
Accordingly, the main objective of this study is to develop SI models that can be used to detect the behavior of structures controlled by TMD-passive control systems. The models are described by experimental system using scaled three story building and a shaking table applying dynamic load to examine the seismic performance of the structure. This paper is organized as follows: Section 2 discusses the methodology and evaluation theories such as the strategy used to investigate the performance of the identification models. Section 3 contains the experimental setup and procedures. The pre-analysis of experiments and modeling results are presented in Section 4. The conclusions are summarized in Section 5.

2. System Identification Methods

In this study, two systems identification models are applied to investigate the applicability of using these models for predicting the structures behavior with attached passive control of Tuned mass damper (TMD), as described in Section 3. The two systems are nonlinear AutoRegresive with eXogenous inputs (NARX), and Adaptive neuro-fuzzy inference system (ANFIS). In this study, the used input–output model is divided into single-input single-output (SISO) and multi-input single-output (MISO). The SISO model is designed based on seismic signals as an input parameter and response of structure as output parameters. While the MISO model depends on the seismic signals and time-delayed output of structural response as input parameters and the response of structure as output parameters.

2.1. Nonlinear ARX

The NARX models can be used to describe different nonlinear dynamic behavior [18]. It is used to predict behavior of structures equipped with passive controller systems. It is worth mentioning that, as the system order increases, the number of candidate terms becomes very large [18,19,20] which leads to increased complexity in the analysis [21]. The ARX is described detail in [21,22]. A prediction of the NARX model takes the form of following nonlinear regression equation [20]:
y ( t ) = f ( y ( t 1 ) , , y ( t n y ) , u ( t n k ) , . , u ( t n k n u + 1 ) )
where f is a nonlinear function, u(t) and y(t) are the input and output sequence, and nu and ny are the maximum numbers of input and output measurements involved in the model, respectively, nk is the input delay.
The common representation for the NARX model in Equation (1) is artificial neural networks, which takes the function f(.). In this study, the sigmoid and wavelet neurons are applied and assessed. However, the neural networks method is used to identify and adjust the model parameters. Identifying a NARX model requires two steps: (1) the parameter estimation and (2) structure detection. Those can be divided into model order selection and the parameters which are selected to be used in the model. The model order selection is considered as a part of structure detection. Determination of the model order depends on the trail and errors method and it restricts the choice of terms to be considered. For NARX models, the system order can be defined as:
O = [ n y   n u   n k ]
The considered prediction ( y s ( t ) ) is computed from measured outputs up to the time instant t − 1.

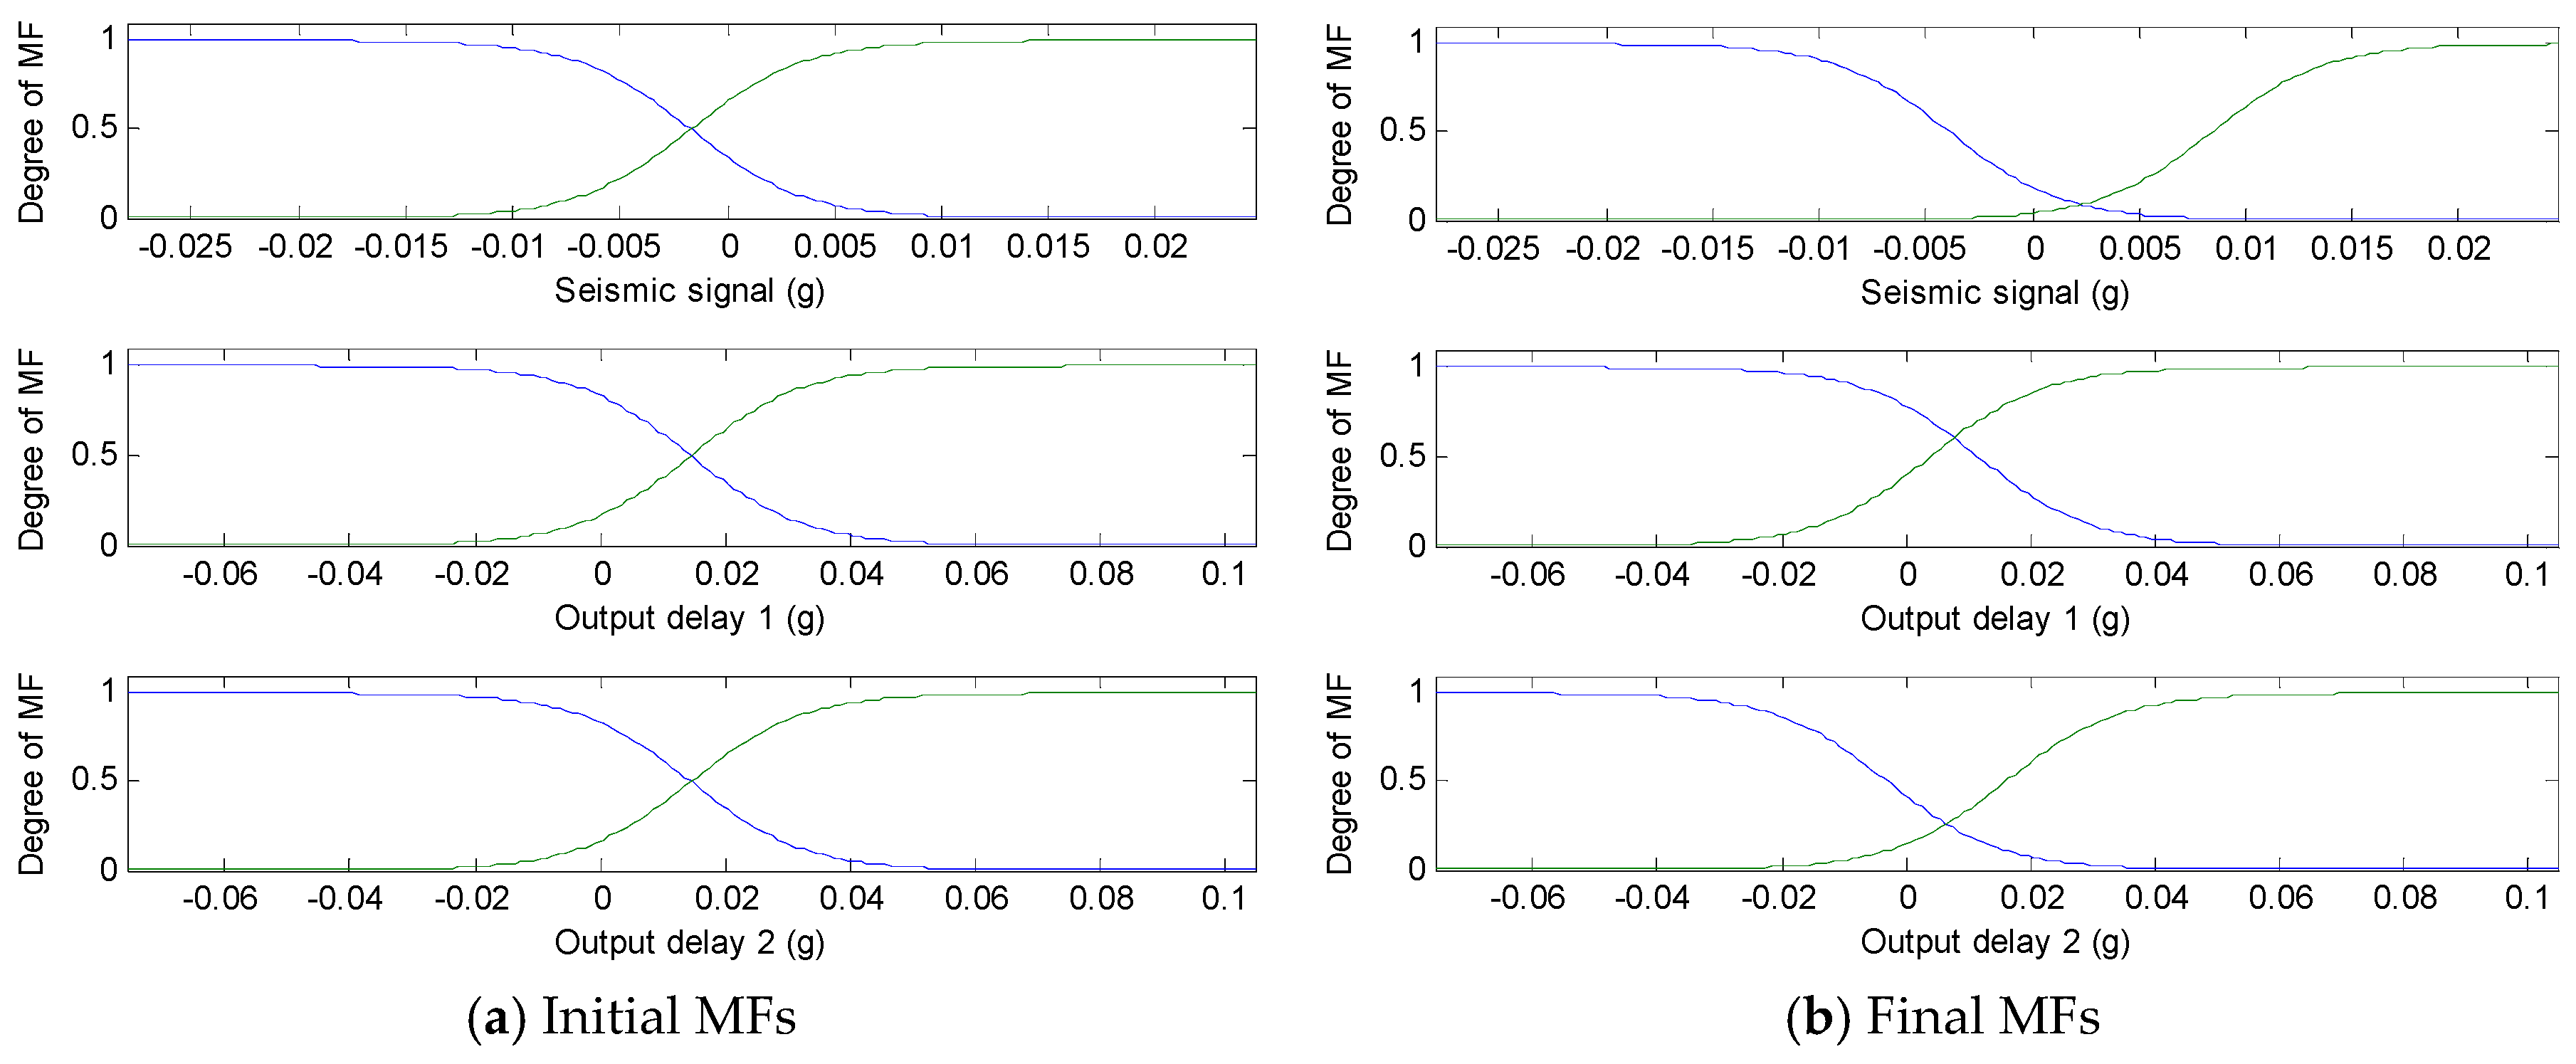
2.2. Adaptive Neuro-Fuzzy Inference System

The simple definition of a ANFIS model is a hybrid method that can construct an input–output mapping set of fuzzy “if-then” rules with appropriate membership functions to design the model input–output data pairs [1,23]. The ANFIS system is a nonlinear learning model that utilizes the least-square as well as back-propagation methods to train the fuzzy inference systems membership functions [3,24]. Moreover, the ANFIS is combined of natural language description of fuzzy systems and the learning properties of neural-networks [24]. Figure 1 demonstrates the ANFIS model structure of two inputs with five layers. It includes two adaptive layers which are distributed between the premise part and the consequent part and three fixed layers [23,24]. Mitchell et al. [3] represents a simplified process of ANFIS for the two or more inputs parameters as follows:
The rules of Takagi–Sugeno fuzzy model were used as [3]:
R j : if   u 1   is   P 1 j     . and   u i   is   P i j ,   then   z = f i ( u 1 ,   .. , u i ) ,   j = 1 , 2 , , N
where R j is the jth fuzzy rules, N is the fuzzy rules number, P i j are fuzzy sets centered at the jth operating point, and u i are premise variable or inputs values. Z is a linear function ( f i ) of the equation of the consequent part. The R j subsystems are integrated by combining the regions of each local subsystem using the interpolation method of fuzzy as a nonlinear system. As shown in Figure 1, the ANFIS model is divided into five layers. The output of layer one can be presented in form:
F 1 , j = u P i j ( u i )
where u P i , j ( u i ) is the membership function (MF) of u i in P i j . This MF is applied for each input of layer one.
The output of layer two represents the firing strength of the rule:
F 2 , j = w j = u P i j ( u 1 ) × u P i j ( u 2 ) × .. × u P i j ( u i )
Taking a ration of the layers two in layer three to normalize the outputs of layer two as follows:
F 3 , j = w ¨ j = w j i = 1 N w i
Layer four applies a node function to the normalized firing strength and the output can be expressed as:
F 4 , j = w ¨ j f j
The consequent parameters of function f i are adjustable in this layer and can be used to tune the outputs of that layer. Therefore, the model output ( y s ) (fifth layer outputs) summates the layer inputs as:
F 5 , j = y s = i = 1 N w ¨ i f i

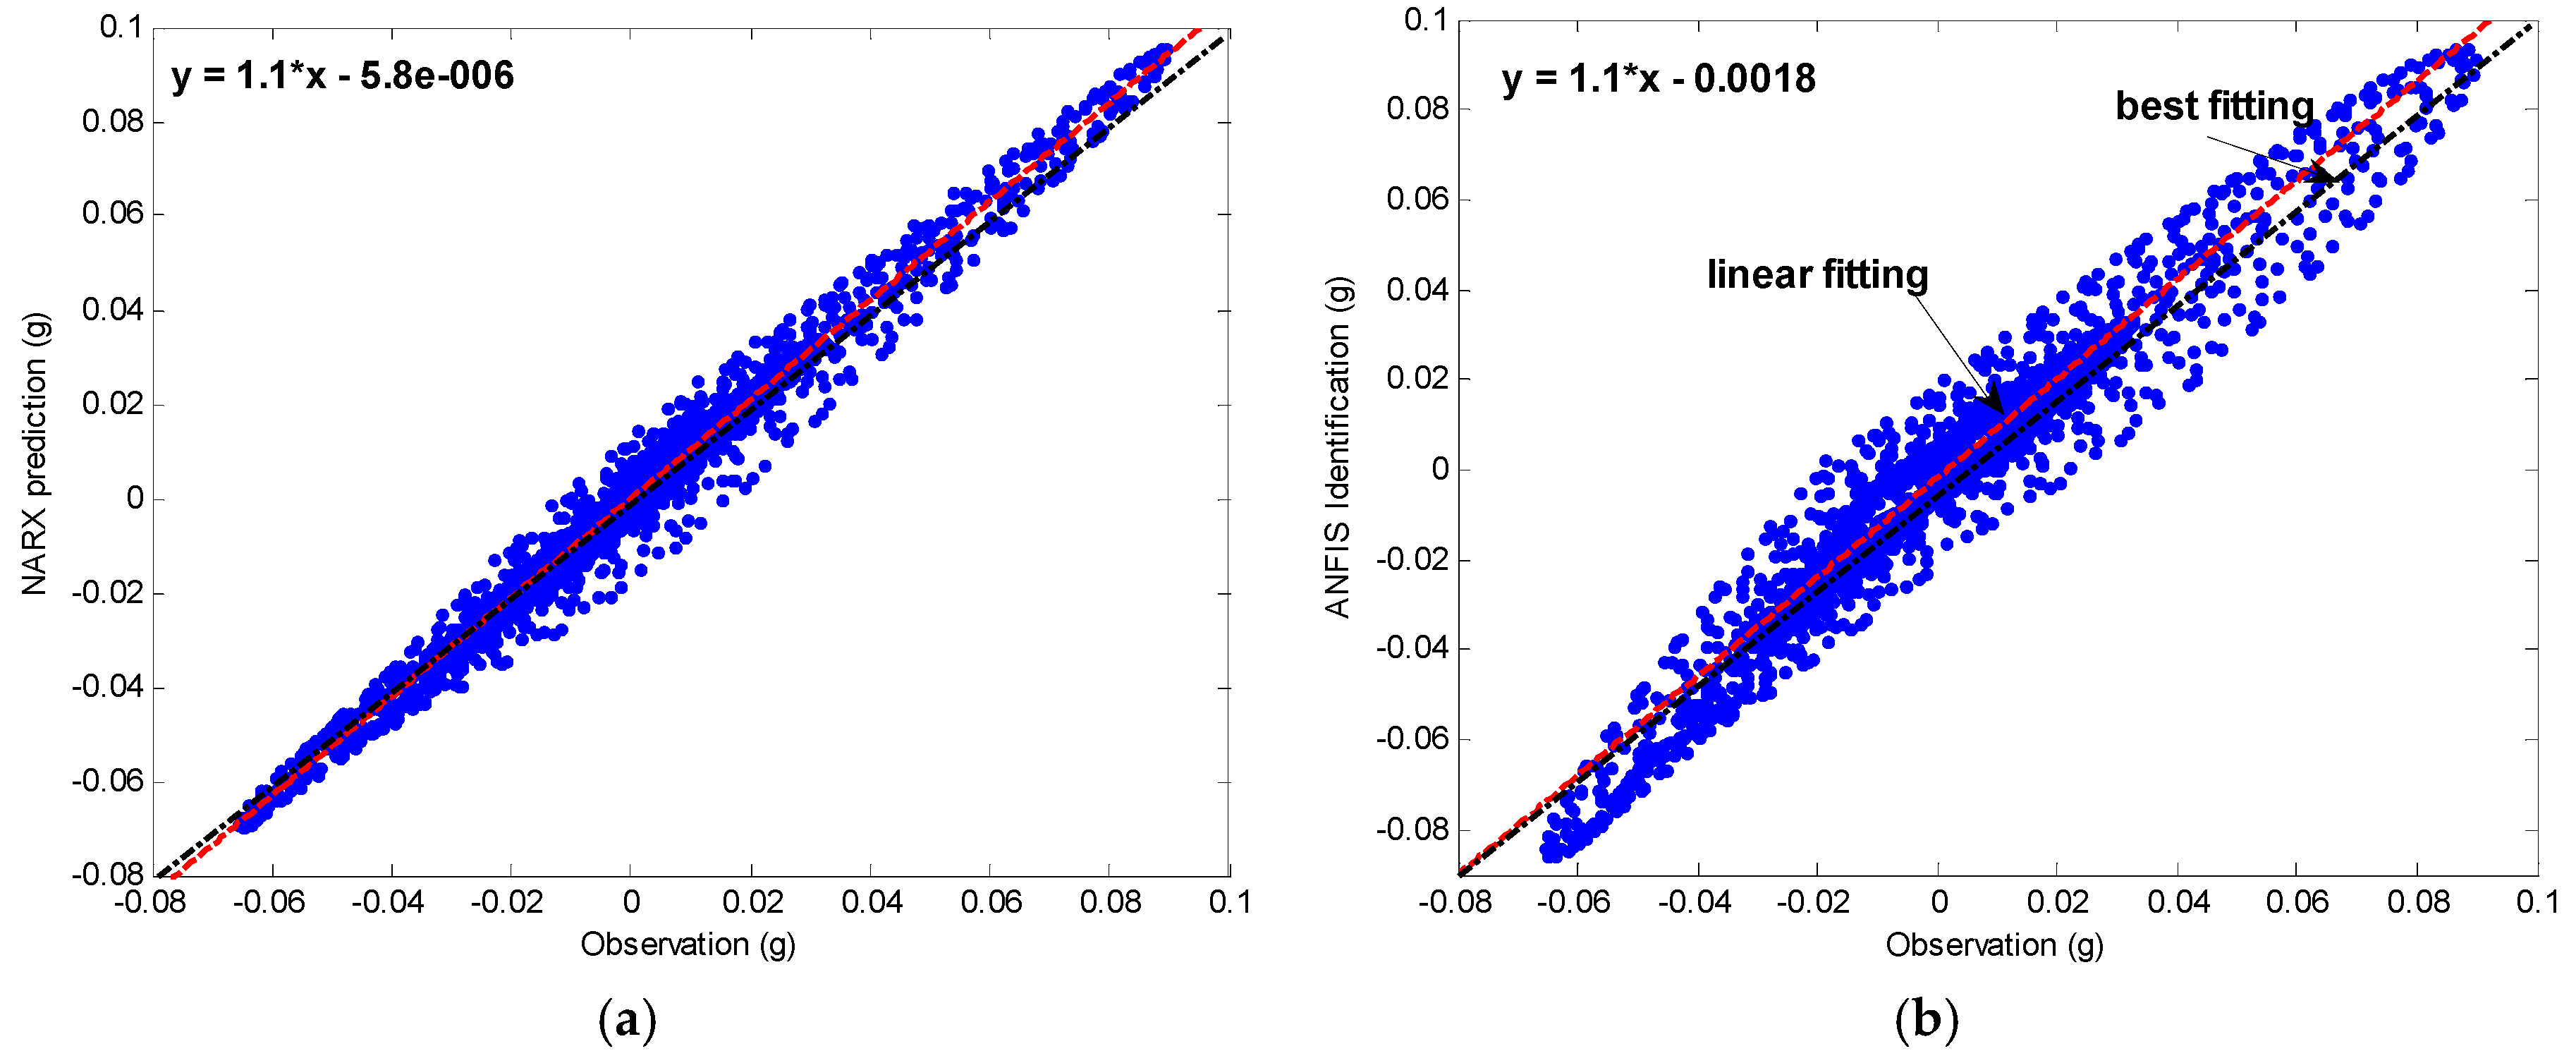
2.3. Performance Evaluation of Models

To evaluate the output performance of systems identifications applied for the structure behavior, three criteria were used in this study:
First: The correlation coefficient (R2) provides information for linear dependence between observations and corresponding predictions [25]. R2 is defined in Equation (9) and ranged between 0 and 1; the higher value of R is the better quality of the model.
R 2 = i = 1 n ( y y ¨ ) ( y s y ¨ s ) i = 1 n ( y y ¨ ) 2 i = 1 n ( y s y ¨ s ) 2
where y and y s are observed and predicted performance of structures at time t = 1,…,n; n is the number of observations; and y ¨ and y ¨ s are the mean values of the observations and predictions, respectively.
Second: The mean absolute error (MAE) which describes the average magnitude of the errors. MAE is defined in Equation (10) where smaller value of MAE means better quality of the model.
MAE = i = 1 n abs ( y y s ) n
Third: The root mean square error (RMSE) which considered the average magnitude of the errors by giving more weight on large errors. The RMSE defined as in Equation (11) where smaller value of RMSE means better quality of the model.
RMSE = i = 1 n ( y y s ) n

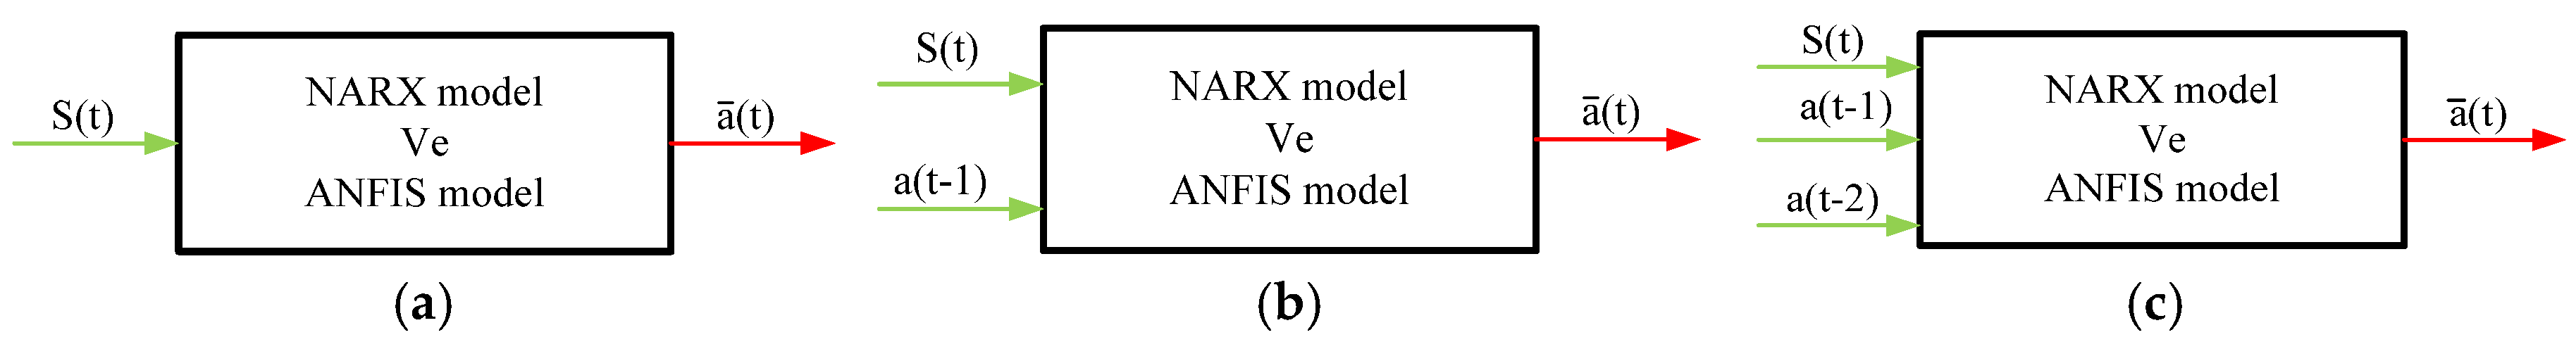
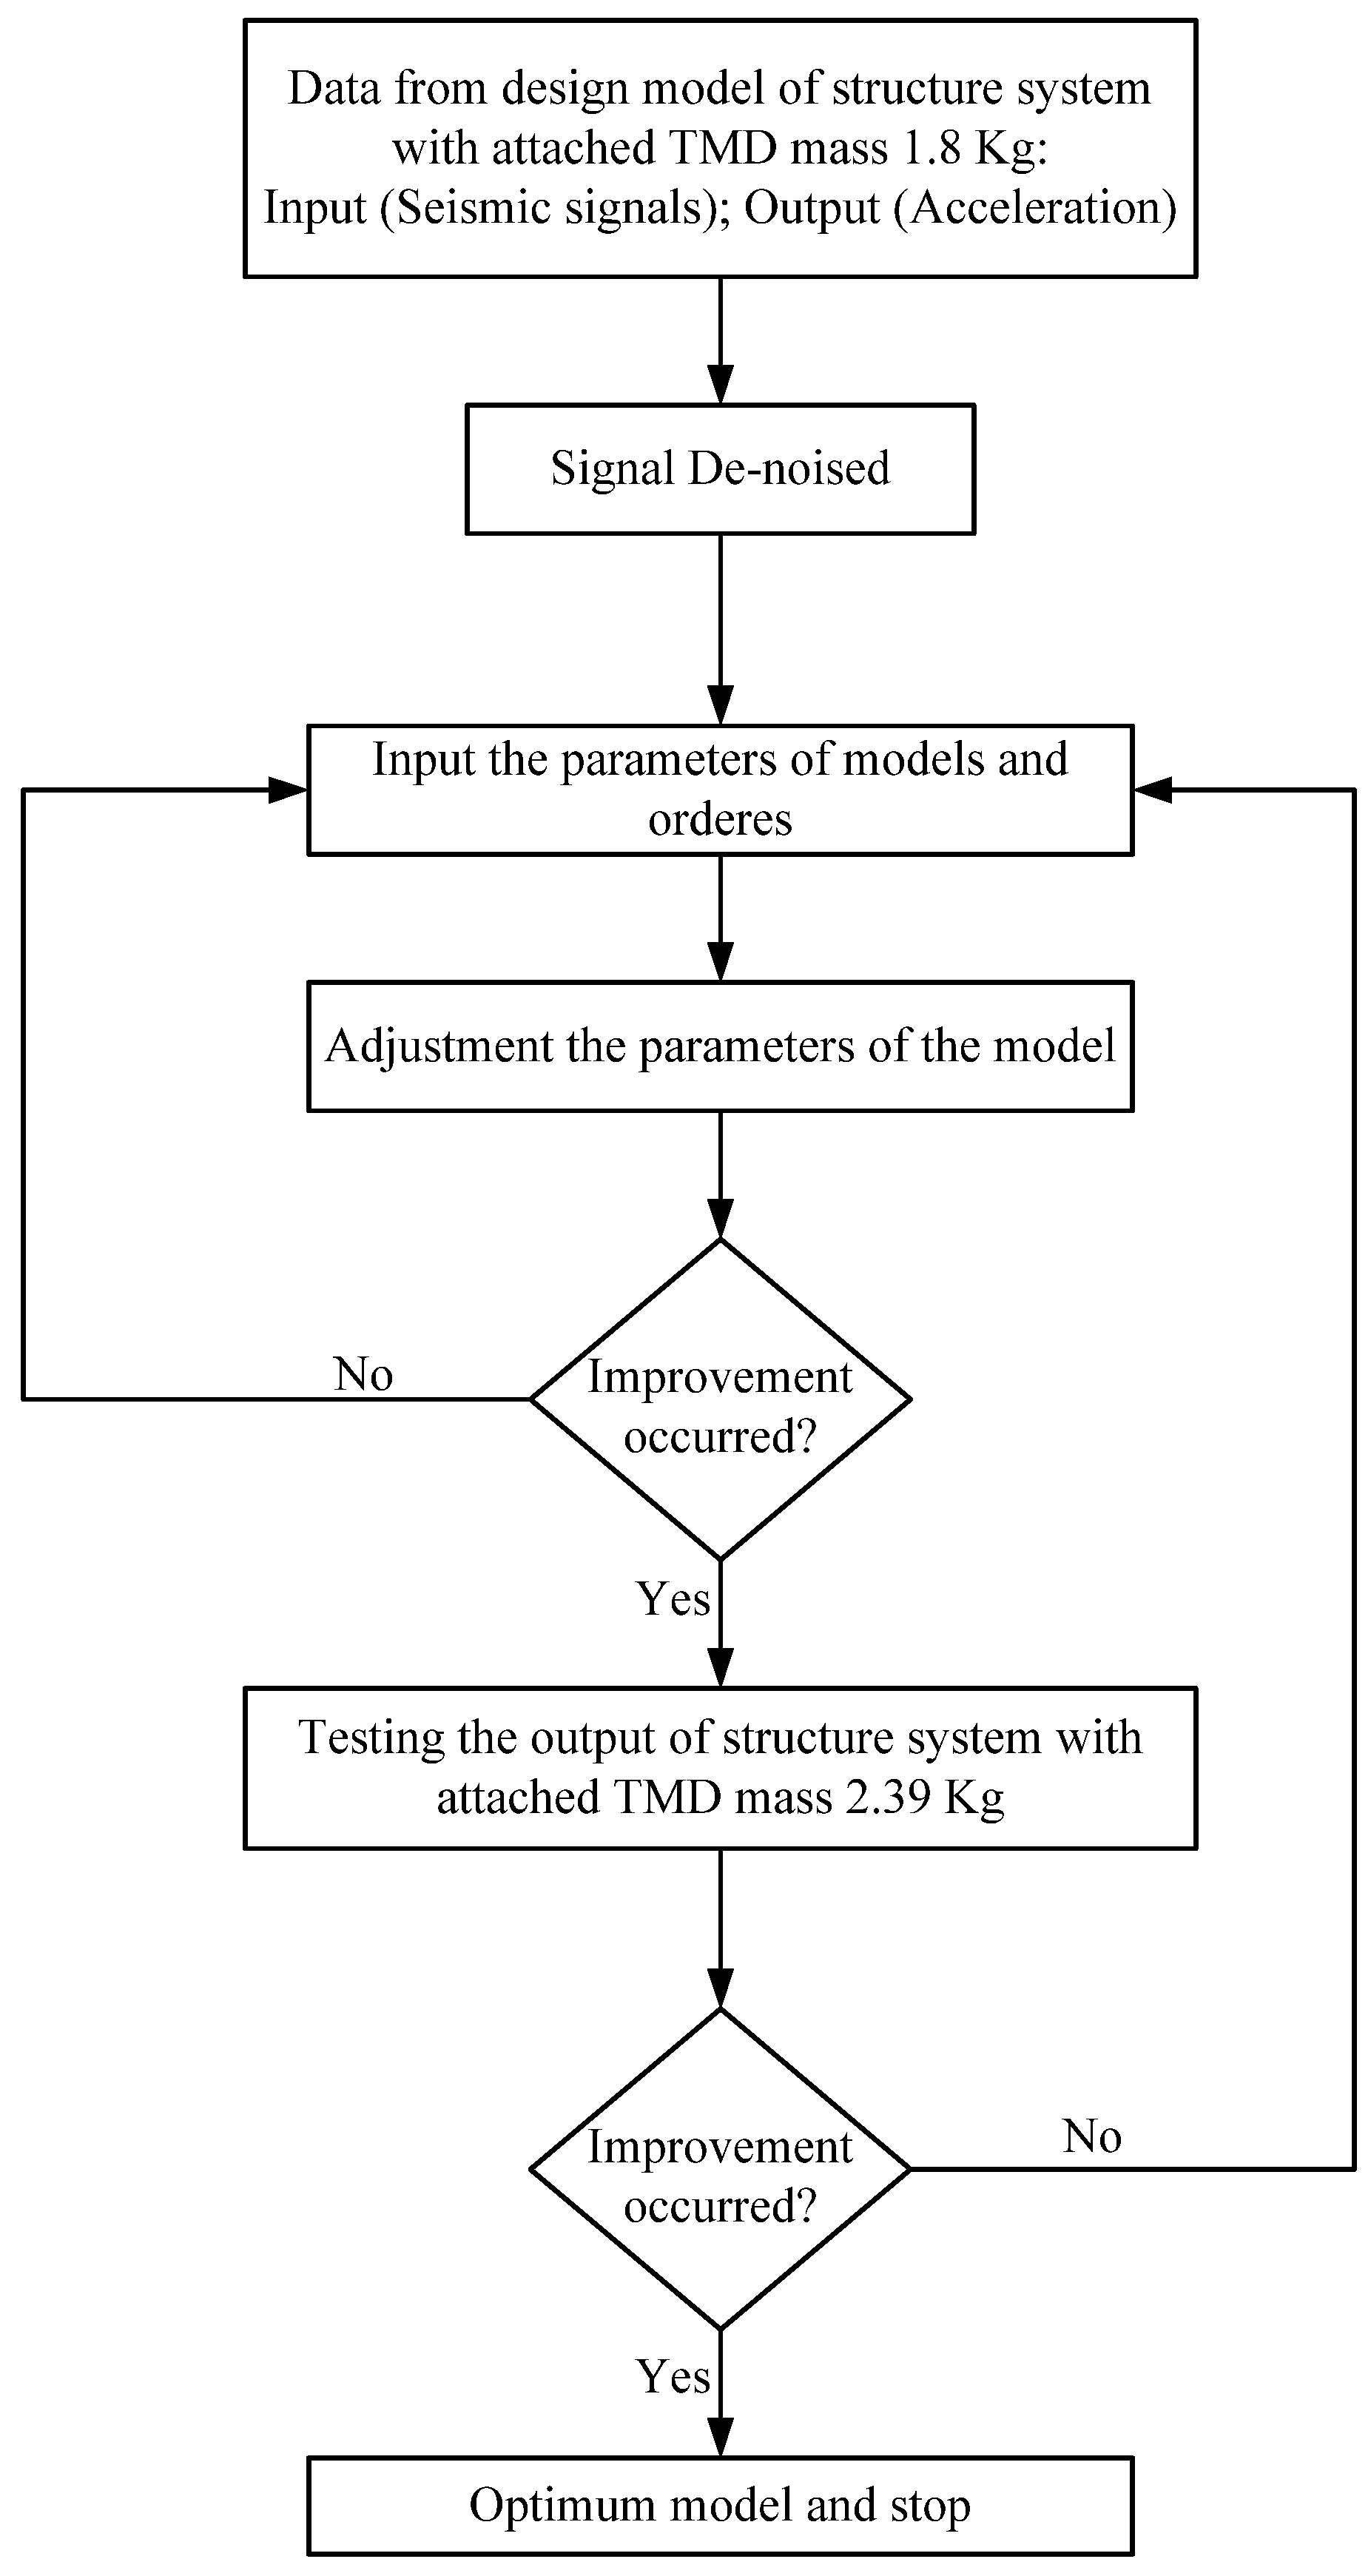
2.4. The Strategy of the Identification Models

The strategy used in this study focuses on the modeling of the behavior of the structures equipped with a passive controller, i.e., TMD, under seismic loads. The experimental study is designed as presented in Section 3. The three models are designed in-between input and output experimental data, as shown in Figure 2 under seismic generated loads, and predicted response of third floor of the frame building, as output. The first model, i.e., SISO system model, is designed using one input (seismic signals S(t)) and predicted acceleration behavior ( a ¯ ( t ) ) is the output (see Figure 2a). Second model uses the seismic signal and one time-delayed for the acceleration measurements ( a ( t ) ) of third floor as input (see Figure 2b). The third model utilizes the seismic signal, and one and two time-delays of the acceleration measurements of third floor as input and predicted acceleration response as output (see Figure 2c). Second and third models are considered a MISO system models.
A shaking table is used to apply input excitation signals (Section 3) to the scaled three-story building equipped with TMD passive control. The models are designed using TMD with mass of 1.8 kg (TMD-1.80) as a training setting and TMD with mass 2.39 kg (TMD-2.39) as a testing setting. The output signals (acceleration) of two cases is filtered using Butterworth Low Pass filter, the verification of de-noising filter is provided by Bigdeli and Kim [5]. The models process is shown in a flow chart format (see Figure 3).

3. Controller System Design

Figure 4 illustrates the experimental design of the building, the TMD control system and shaking table setup. Figure 4a,b presents a three-story steel building attached with TMD control system which the base of the control system is weight 1.26 Kg. A scaled steel frame building structure with a plane eccentricity of zero percent on each floor, and a total height of 930 mm is selected. Diameter of circle section area of steel columns is 5 mm and story height is 310 mm that the weight of columns for each floor is equal to 4 × 0.05 = 0.2 kg. All degrees of freedom (DOF) are restricted at base level. Each floor consists of a rigid steel square plate (300 mm × 300 mm) with 3.44 kg weight with three degrees of freedom; translation in x- and y-directions; and rotation around a vertical line passing through the centers of mass in each floor. Therefore, total number of DOFs after the application of the boundary conditions, rigid diaphragm and also Guyan reduction [26] of vertical and rotational DOFs around x- and y-axes is equal to 9 (degree of freedom was 42 prior to the application of the boundary conditions). In order to record the response of the building model subjected to an excitation load, three wireless accelerometers with identical properties were installed at each floor (see Figure 4a). The accelerometers were equipped with a wireless Bluetooth system to transfer the data to the core computer. These devices were able to record the acceleration responses in the x- and y- directions at the same time. Dynamic loading is applied to the structure by using an earthquake simulating shaking table (ST-E-1) designed by Smart Control & Sensing. The shaking table system consists of an application program, a control box and a shaking table, which work together simultaneously and the delay time is about 62.5 micro-seconds which can be ignored during the process (see Figure 4c). Furthermore, the load is directly connected to the motor. Therefore, there is no elasticity from the moving elements. Thus, the dynamic behavior of the servo control is improved and higher levels of accuracy are achieved. Table 1 reports the performance characteristics of the employed shaking table. The shaking table program is used to de-noise the recorded response and the design seismic signals. The mass attached to the TMD control system in this study are 1.80 and 2.39 kg. Herein, it must be noted that these amount of masses are larger than usual. However, the obtained response would still be used for the validity examination of the identification systems. The structure responses for those two controllers are presented in Section 4.
The acceleration response of each floor is recorded by wireless monitoring systems. Figure 5a,b presents the input signal and its frequency domain power spectral density. The dominant signal frequency is 1.92 Hz; however, the provided effective frequency range is between 1.5 and 2.3.

4. Results and Discussions

The results for the control system design effects and systems identifications are presented in this section. Furthermore, the evaluation and optimum model for the training (TMD-1.80) and testing (TMD-2.39) are presented and discussed.

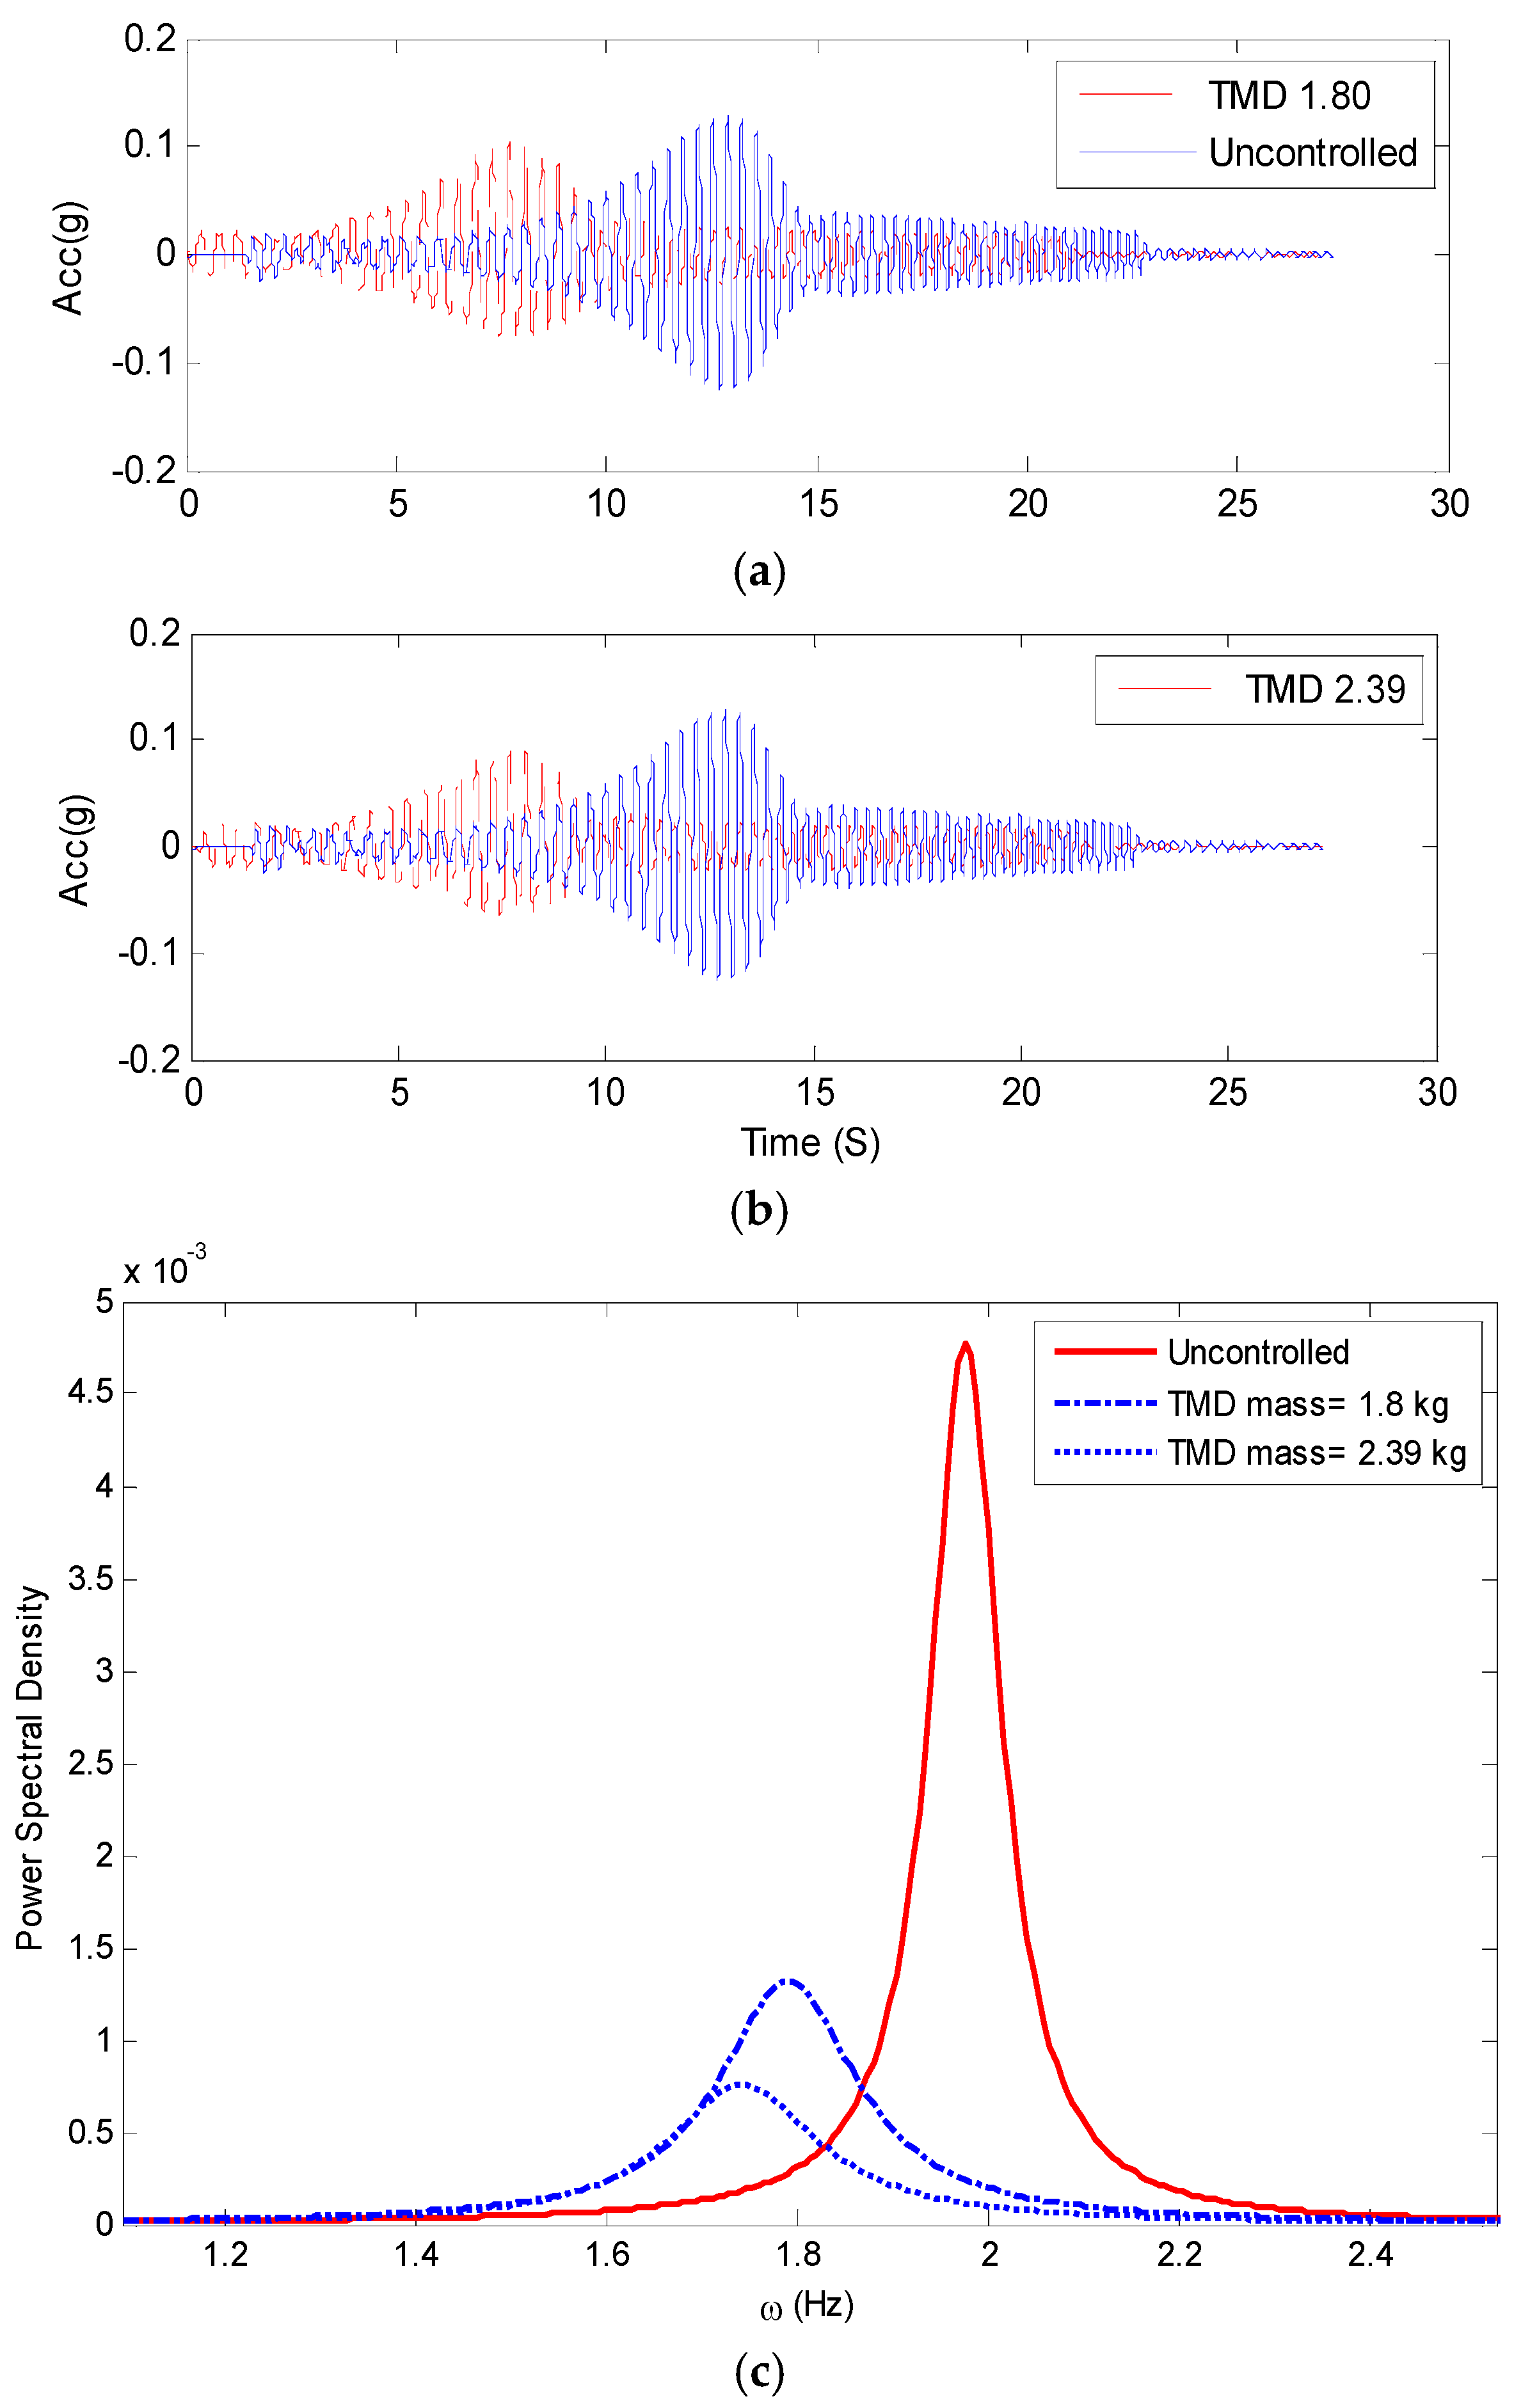
4.1. Controller System Behavior Analysis

In order to assess the controlled system effects on the structural behavior, the input signal and third floor acceleration measurements (output) for two case studies are presented in Figure 5 and Figure 6. The input signal generated artificially through shaking table program. This program generates an acceleration signal having a waveform in which parameters such as strong motion duration, ramp times, number of strong motion peaks, etc. are variables. The signal is generated based on the capability of the shaking table [27]. The signal contains the frequencies with a range of 1.2 to 2.6 Hz. This range of frequency is close to the natural frequency of the system identified by conducting free vibration test. Thus, it will make a greater impact on the building response, which helps to investigate the response of the structure for the critical conditions. The dominant frequency of the input signal was reported as 1.92 Hz (see Figure 5b). Being more specific on the effect of increasing the TMD mass of the response of the structure, Figure 6c presents a meaningful suppress on the response of the structure, i.e., 84% for 2.39 kg, which means that mass is playing important role in vibration mitigation. However, the damping effect of the controller system can be ignored where it has a significant effect on suppressing the response.
From Figure 5 and Figure 6, it can be shown that the maximum response of structure is 0.13, 0.10, and 0.08 g for the uncontrolled, TMD-1.80 and TMD-2.39 controlled systems, respectively. Furthermore, increase the TMD mass is increases the mass and damping of the structure which leads to vibration mitigation by 72% and 84% for the TMD 1.80 and 2.39 kg, as well as, the amplitude of time series response of structure is decreased by 30% and 38%, respectively. This means that the controllers are effectively reducing the response. In addition, the dominant frequency for those cases, i.e., where TMD mass is equal to 1.80 and 2.39 kg, are decreased by 9.4% and 11.8%, respectively. Therefore, it can be concluded that the TMD is efficient controller system in the mitigation of the produced vibration of the structures due to dynamic loads. The mass contribution of the TMD control system to the mitigating the produced vibration of the structure is significant and the system is not properly tuned. Nevertheless, the obtained structural response can be used for the identification purposes of this study. The time and frequency delay are observed with increasing the mass of TMD (see Figure 6a,b). The advantages of using TMD for vibration control purposes are presented in [5] where the comparison between this system and other passive controls are well presented.

4.2. System Identification Analysis

To estimate an optimum model of system identification for the behavior of a coupled structure and controller system effects, the parameter setting should be evaluated as shown in Figure 3. This section is divided into two parts: first, the training setting which contains the evaluation of the third-floor behavior of the building with 1.80 Kg TMD mass (TMD-1.80). Second, the optimum models are evaluated and discussed using the behavior of the third floor experiments based on 2.39 kg TMD mass (TMD-2.39). This system case is used as a testing setting.

4.2.1. Training Setting Evaluation

The first estimation model is NARX model. In this section, three NARX models are presented and evaluated including SISO, one time-delayed MISO, and two time-delayed MISO models, as shown in Figure 2 and Figure 3. The input parameters are seismic design signal (Figure 5a) and time-delay output of structure behavior (acceleration measurements). The output is a response of the third floor of the building (TMD with mass 1.80 kg (see Figure 6a)), while the maximum response of this floor is higher than the first and second floors. The three models are designed as shown in Figure 2. Table 2 illustrates the evaluation of the NARX model selections. The trial and error process is used to determine the number of parameters that can be used to improve the predicted output signals. Herein, NARX(1) refers to model 1, NARX(2) present model 2 and model 3 is NARX(3) (Figure 2 and Section 2.4). Nine models are presented in Table 2: one and two are SISO models, and three to nine are MISO models. The nonlinear wavelet and sigmoid functions are employed also in this table to evaluate the nonlinear models design. The 5, 10 and 20 neurons are evaluated with SISO model and the R2 are 0.30, 0.33, −0.018, respectively. Therefore, the 10 neurons are used to design the neural network model. From Table 2, model 8 is the best (NARX(3) with sigmoid function) based on MISO model design with three inputs parameters (seismic signal, one and two output time-delays). The evaluation performance of the models shows that by any increase in the parameters of SISO models the accuracy increased, while the MISO models perform via versa. In addition, the nonlinear functions of the wavelet and sigmoid functions with neural network solution are shown suitable to estimate a good performance of the structural behavior. The sigmoid function performs better than the wavelet with SISO and MISO of the three inputs parameters. The SISO model is the worst. From these results, it is concluded that the simplified MISO-NARX models are suitable to estimate the behavior of controlled structures with high agreement between the observed and the predicted signals (identified) for model 8, as shown in Table 2 and Figure 7. Therefore, model 8 is selected as the best model that can be used to identify the nonlinear behavior of a controlled structure.
The second model is called ANFIS model, which is known as the best models used in previous research in controlled structures [1,12,24,25]. The number and type of MF and input time-delayed are main parameters for the ANFIS model as presented in [1]. Table 3 presents the selection evaluation of the numbers used and types of MFs. The numbers of MF are evaluated with sigmoid function of MF type, and the MF types are evaluated with two MF. Furthermore, all evaluations use the MISO model with two time-delays input, while model 3 is the best. The number of iterations is evaluated and 10 iterations is used; the RMSE for 10 and 50 are 7.78 × 10⁻³ and 8.17 × 10⁻³ g, respectively. The R2, MAE and RMSE show better performance of model 3 with two MF (Table 3). When increasing the MFs to more than two, the performance parameters become worse. Thus, two MFs are used in our case. In addition, four common MF types are evaluated in Table 3, and it can be seen that the sigmoid function has a good performance. The sigmoid function is presented in Equation (12).
u P i , j ( u i ) = 1 1 + e a ( u i c )
where a and c parameters denote the shape and behavior of the MF, respectively [24]. These parameters are called the premise parameters as they are adjustable parameters in the premise part.
Figure 8 shows the initial and final MF before and after training for the selected model (model 3). It shows that significant modifications have been done to the shapes of initial MFs through the learning process. After determining the initial value of the premise parameter and the architecture of the predictive model, the network was trained by the hybrid technique. Therefore, the number and type of MF are an important parameter in identifying the model selected.
The evaluation of SISO (model 1) and MISO (models 2 and 3) are presented in Table 4 with sigmoid function and two MFs. Herein, the ANFIS models are multi inputs models and do not support single input [3,23]. Therefore, to design the SISO model in this case, it is assumed that seismic signal and one time-delayed for the seismic signal are used in the input parameters as a single input. Therefore, the two inputs for one parameter (seismic signal) are assumed as a one input model, which is in the model 1. Models 2 and 3 are designed based on the seismic signals and time-delayed output of the structure behavior measurements as input and the predictive structure behavior as output.
Table 4 reports that the highest value of R2 and the lowest values of MAE and RMSE for the training case were peculiar to the ANFIS model 3, hence, it could be concluded that model 3-ANFIS is the most suitable one to be used for this study. Figure 9 illustrates the response of the controlled structure and predictions of model 3-ANFIS, with high correlation between the observed and predicted signals.
Finally, a comparison between model 8-NARX and model 3-ANFIS shows that the two models can be used to estimate the behavior of controlled structure but model 8-NARX gives higher accuracy and generally performs better than the traditional models [1,11] and developed model 3-ANFIS for the ANFIS method, as shown in Table 2 and Table 4. In addition, the correlation between observation and predicted signals are higher with model 8-NARX than model 3-ANFIS, as shown in Figure 7 and Figure 9.

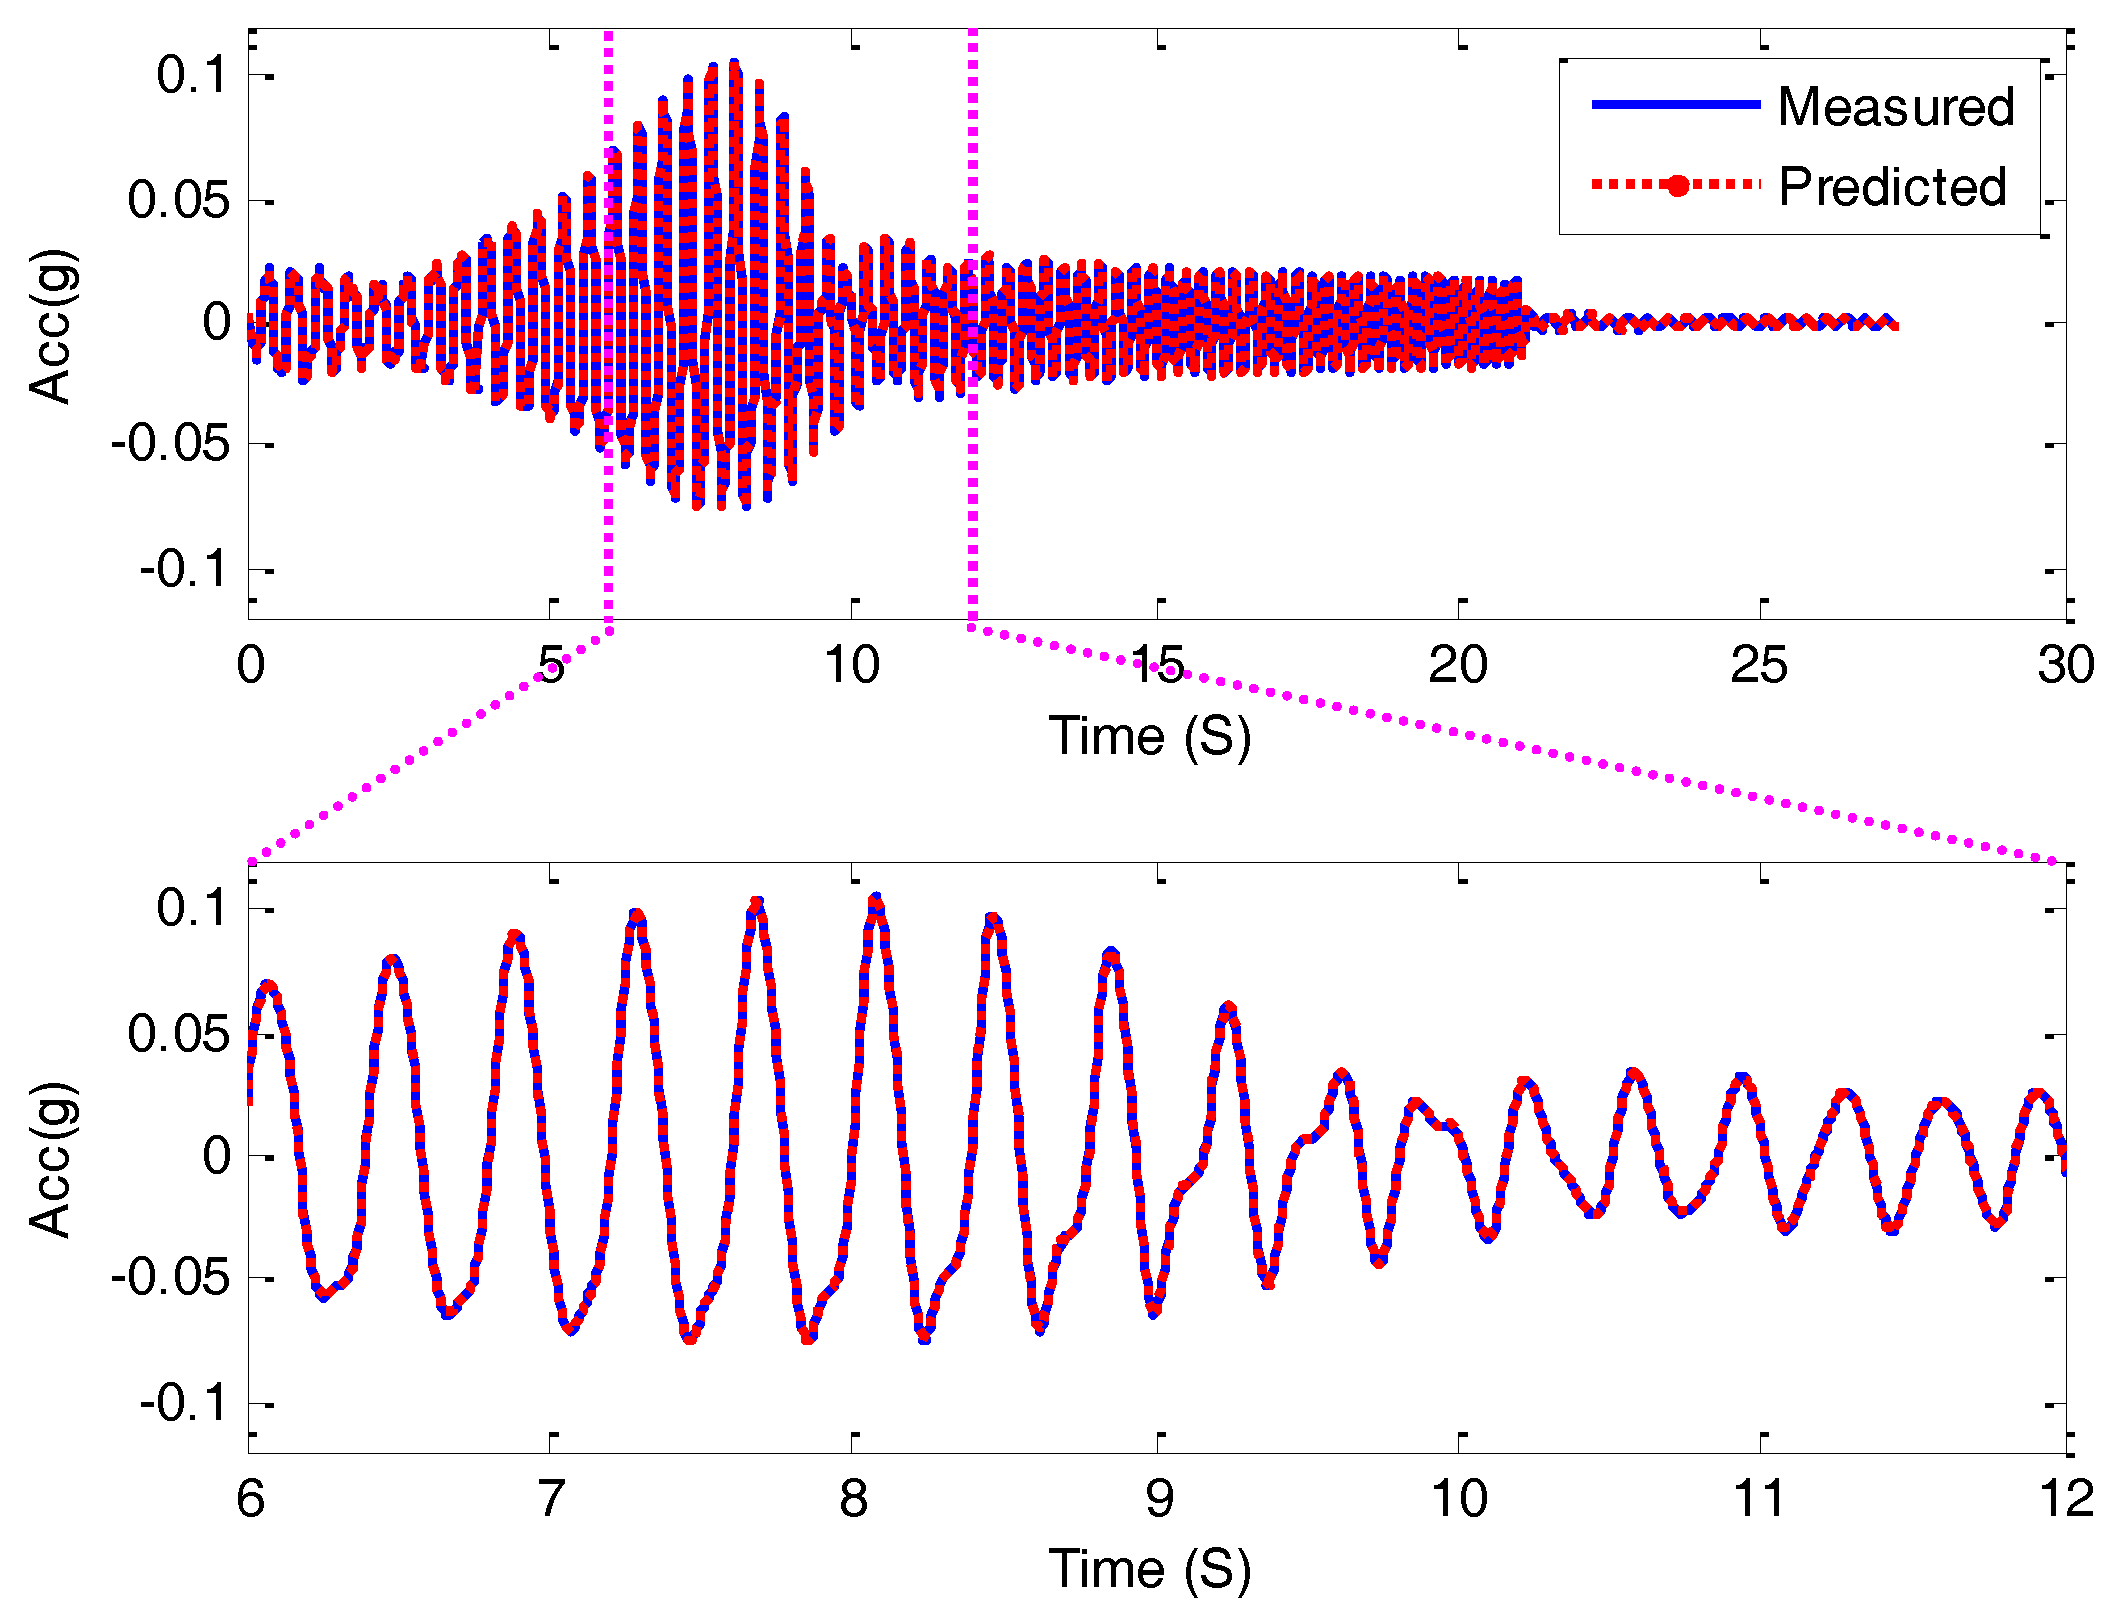
4.2.2. Testing Setting Evaluation

In this section, the parameters calculated in the training setting for the models 8-NARX and 3-ANFIS are utilized to estimate the behavior of the building equipped with TMD-2.39 controller system (Figure 3 and Figure 6b). The performances of two models are evaluated in Table 5. Figure 10 displays the observed and identified behavior of the controlled structure using by two above-mentioned models.
The models’ performance evaluation shows that the two models can be used for the detection of the behavior of structures equipped with passive TMD controller systems. The R2 is obtained as closed values for two models while model 8-NARX works more effective. In addition, it can be shown that the MAE and RMSE values for the model 8-NARX are decreased by 50% approximately relatively to the model 3-ANFIS. However, the model 8-NARX can be used in our case to detect the behavior of the controlled structure. Moreover, Figure 10 demonstrates that the two predicting models results are close to the observations of acceleration response. A high correlation is observed with best fitting required that is shown with model 8-NARX. Therefore, it can be concluded that these two models are acceptable models to predict the behavior of structure in our case, and model 8-NARX seems to be more effective at identifying the behavior of the structure equipped with the TMD controller system. Herein, it should be mentioned that this study is an experimental study; therefore, to utilize these models with full scale case, the full scale monitoring and evaluation of these models should be studied.

5. Conclusions

The behavior of a structure equipped with a TMD passive controller system is evaluated and identified in this study. A three-story steel frame building and a shaking table were used to simulate the behavior of structure and dynamic load. The accelerometers monitoring system is used to measure the building response equipped with a TMD controller system. Two cases for the weight of employed controller were used, including 1.80 and 2.39 kg of masses. Two nonlinear system identification models were applied to predict the behavior of those case studies including NARX and ANFIS models. In addition, the SISO and MISO input–output parameters are presented. The application of two SI models are designed and developed based on the experimental results. In summary, the following conclusions could be drawn from this study:
The evaluation of TMD controller system showed that the increase in the mass of the TMD leads to a vibration mitigation of 72% and 84% for the 1.80 and 2.39 kg of the TMD mass, respectively. In addition, the dominant frequency for the 1.80 and 2.39 kg are decreased by 9.4% and 11.8%, respectively. Therefore, the TMD is very efficient controller system for mitigating structures behaviors in both time and frequency domains.
The results of the NARX model shows that the two time-delays with seismic input parameters have more influence on the performance of the model. The results also indicate that the model 8-NARX with sigmoid function is more suitable for predicting the acceleration response of structures in the training case. Moreover, the results of ANFIS model showed that the highest R2 value and the lowest MSE and RMSE values were obtained for model 3-ANFIS in the training case. Therefore, the developed ANFIS model 3 is more suitable for this study. On the other hand, the comparison between the models 8-NARX and 3-ANFIS shows that the correlation coefficient values were found to be 0.98 and 0.96, respectively. The MAE and RMSE values for model 8-NARX are decreased by approximately 50% relative to model 3-ANFIS. Therefore, model 8-NARX generally outperformed model 3-ANFIS in terms of the training and testing performance of identification for the controlled experimental structures equipped with the TMD passive control system. Finally, this study is still limited as an experimental study and we recommend it should be applied to a full scale control system to improve this study application.

Acknowledgments

This work was supported by a 2015 Incheon National University (INU) Research Grant. The authors gratefully acknowledge these supports.

Author Contributions

Mosbeh R. Kaloop conceived the study, performed analysis, wrote the paper and interpreted the results; Yasser Bigdeli designed the experiments; Mosbeh R. Kaloop, Jong Wan Hu and Yasser Bigdeli reviewed the study plan and edited the manuscript.

Conflicts of Interest

The authors declare no conflict of interest.

References

  1. Arsava, K.S.; Kim, Y.; El-Korchi, T.; Park, H.S. Nonlinear system identification of smart structures under high impact loads. Smart Mater. Struct. 2013, 22, 055008. [Google Scholar] [CrossRef]
  2. Mitchell, R. A WANFIS Model for Use in System Identification and Structural Control of Civil Engineering Structures; Worcester Poytechnic Institute: Worcester, MA, USA, 2012. [Google Scholar]
  3. Mitchell, R.; Kim, Y.; El-Korchi, T. System identification of smart structures using a wavelet neuro-fuzzy model. Smart Mater. Struct. 2012, 21, 115009. [Google Scholar] [CrossRef]
  4. Seo, J.; Hu, J.W. Seismic Response and Performance Evaluation of Self-Centering LRB Isolators Installed on the CBF Building under NF Ground Motions. Sustainability 2016, 8, 109. [Google Scholar] [CrossRef]
  5. Bigdeli, Y.; Kim, D. Damping effects of the passive control devices on structural vibration control: TMD, TLC and TLCD for varying total masses. KSCE J. Civ. Eng. 2016, 20, 301–308. [Google Scholar] [CrossRef]
  6. Bigdeli, Y.; Kim, D.; Chang, S. Vibration control of 3D irregular buildings by using developed neuro-controller strategy. Struct. Eng. Mech. 2014, 49, 687–703. [Google Scholar] [CrossRef]
  7. Kaloop, M.R.; Hu, J.W. Damage Identification and Performance Assessment of Regular and Irregular Buildings Using Wavelet Transform Energy. Adv. Mater. Sci. Eng. 2016, 2016, 6027812. [Google Scholar] [CrossRef]
  8. Ponzo, F.C.; Di Cesare, A.; Nigro, D.; Vulcano, A.; Mazza, F.; Dolce, M.; Moroni, C. JET-PACS project: Dynamic experimental tests and numerical results obtained for a steel frame equipped with hysteretic damped chevron braces. J. Earthq. Eng. 2012, 16, 662–685. [Google Scholar] [CrossRef]
  9. Mazza, F. Comparative study of the seismic response of RC framed buildings retrofitted using modern techniques. Earthq. Struct. 2015, 9, 29–48. [Google Scholar] [CrossRef]
  10. Kim, D.; Hassan, M.K.; Chang, S.; Bigdeli, Y. Nonlinear Vibration Control of 3D Irregular Structures Subjected to Seismic Loads. In Handbook of Research on Advanced Computational Techniques for Simulation-Based Engineering, No. November; Samui, P., Ed.; IGI Global: Hershey, PA, USA, 2015; pp. 103–119. [Google Scholar]
  11. Arsava, K.S.; Kim, Y.; Kim, K.H.; Shin, B.S. Smart fuzzy control of reinforced concrete structures excited by collision-type forces. Expert Syst. Appl. 2015, 42, 7929–7941. [Google Scholar] [CrossRef]
  12. Kaloop, M.; Hu, J.; Sayed, M. Bridge Performance Assessment Based on an Adaptive Neuro-Fuzzy Inference System with Wavelet Filter for the GPS Measurements. ISPRS Int. J. Geo-Inform. 2015, 4, 2339–2361. [Google Scholar] [CrossRef]
  13. Doebling, S.W.S.; Farrar, C.R.C.; Prime, M.B.M.; Shevitz, D.W.D. Damage Identification and Health Monitoring of Structural and Mechanical Systems from Changes in Their Vibration Characteristics: A Literature Review; Los Alamos National Lab.: Los Alamos, NM, USA, 1996.
  14. Sirca, G.F.; Adeli, H. System identification in structural engineering. Sci. Iran. 2012, 19, 1355–1364. [Google Scholar] [CrossRef]
  15. Elnabwy, M.T.; Kaloop, M.R.; Elbeltagi, E. Talkha steel highway bridge monitoring and movement identification using RTK-GPS technique. Measurement 2013, 46, 4282–4292. [Google Scholar] [CrossRef]
  16. Taguchi, S.; Suzuki, T.; Hayakawa, S.; Inagaki, S. Identification of probability weighted multiple ARX models and its application to behavior analysis. In Proceedings of the IEEE Conference on Decision and Control, Shanghai, China, 15–18 December 2009; pp. 3952–3957.
  17. Fasel, T.R.; Sohn, H.; Park, G.; Farrar, C.R. Active sensing using impedance-based ARX models and extreme value statistics for damage detection. Earthq. Eng. Struct. Dyn. 2005, 34, 763–785. [Google Scholar] [CrossRef]
  18. Radmaneshfar, E.; Karrari, M. A new method for structure detection of nonlinear ARX model: ANOVA_BSD. World Congr. Eng. 2007, 2165, 407–411. [Google Scholar]
  19. Hu, B.; Zhao, Z.; Liang, J. Multi-loop nonlinear internal model controller design under nonlinear dynamic PLS framework using ARX-neural network model. J. Proc. Contr. 2012, 22, 207–217. [Google Scholar] [CrossRef]
  20. Zhang, Q.; Ljung, L. Multiple steps prediction with nonlinear ARX models. In Proceedings of the 6th IFAC Symposium on Nonlinear Control Systems, Stuttgart, Germany, 1–3 September 2004; pp. 309–314.
  21. Zhu, Y. Estimation of Nonlinear ARX Models. In Proceedings of the 41st IEEE Conference on Decision and Control, Las Vegas, NV, USA, 10–13 December 2002; pp. 2214–2219.
  22. Peng, H.; Ozaki, T.; Haggan-Ozaki, V.; Toyoda, Y. A nonlinear exponential ARX model-based multivariable generalized predictive control strategy for thermal power plants. IEEE Trans. Control Syst. Technol. 2002, 10, 256–262. [Google Scholar] [CrossRef]
  23. Jang, J.S.R. ANFIS: Adaptive-Network-Based Fuzzy Inference System. IEEE Trans. Syst. Man Cybern. 1993, 23, 665–685. [Google Scholar] [CrossRef]
  24. Eldessouki, M.; Hassan, M. Adaptive neuro-fuzzy system for quantitative evaluation of woven fabrics’ pilling resistance. Expert Syst. Appl. 2015, 42, 2098–2113. [Google Scholar] [CrossRef]
  25. Kisi, O.; Shiri, J. Prediction of long-term monthly air temperature using geographical inputs. Int. J. Climatol. 2014, 34, 179–186. [Google Scholar] [CrossRef]
  26. Guyan, R.J. Reduction of stiffness and mass matrices. AIAA J. 1965, 3, 380–380. [Google Scholar] [CrossRef]
  27. Takhirov, S.M.; Fenves, G.L.; Fujisaki, E.; Clyde, D. Ground Motions for Earthquake Simulator Qualification of Electrical Substation Equipment; Peer Report 2004/7; Pacific Earthquake Engineering Research Center: Berkeley, CA, USA, 2005. [Google Scholar]
Figure 1. The two inputs adaptive neuro-fuzzy inference system (ANFIS) model architecture (A and B are a membership functions (MFs)).
Applsci 06 00301 g001
Figure 2. (a) Single-input single-output (SISO) and (b,c) multi-input single-output (MISO) models designed for the modeling of the structure behavior under seismic load.
Applsci 06 00301 g002
Figure 3. Proposed models procedure.
Applsci 06 00301 g003
Figure 4. Tuned mass damper (TMD) passive vibration controller installed on scaled test model: (a) scaled frame building, attached with controllers and monitoring systems; (b) TMD; (c) process of seismic excitation applied to structure through shaking table.
Applsci 06 00301 g004
Figure 5. Excitation dynamic signal: (a) time domain signal; and (b) frequency domain contents.
Applsci 06 00301 g005
Figure 6. (a,b) Structural responses for TMD 1.80 and 2.39 kg of uncontrolled and controlled structure behaviors; and (c) frequency contents of output measurements.
Applsci 06 00301 g006
Figure 7. Nonlinear AutoRegresive with eXogenous inputs (NARX) identification model 8 for the acceleration response.
Applsci 06 00301 g007
Figure 8. Initial (a) and final (b) membership functions of model 3.
Applsci 06 00301 g008
Figure 9. Model 3-ANFIS model identification for the acceleration behavior.
Applsci 06 00301 g009
Figure 10. TMD-2.39 testing the capability of response prediction by two models: (a) model 8-NARX; and (b) model 3-ANFIS models.
Applsci 06 00301 g010
Table 1. Performance properties of the employed shaking table.
Performance
Peak Force (N)375.0
Continuous Force (N)84.1
Peak Power (W)2261
Continuous Power (W)113
Table travel (cm)±12.0
Table Operational Bandwidth (Hz)20
Table Peak Acceleration (g)2.0
Table 2. Statistical parameter used for the evaluation of Nonlinear AutoRegresive with eXogenous inputs (NARX) models.
Model No.ModelOrder [ ( n y ) ( n u )   ( n k ) ] and FunctionR2MAE (g)RMSE (g)
Model 1NARX(1)[(5)(3)(1)]-sigmoid0.330.0470.057
Model 2NARX(1)[(5)(3)(1)]-wavelet0.180.0250.042
Model 3NARX(2)[(2) (2 1) (0 1)]-sigmoid0.992.97 × 10−44.35 × 10⁻⁴
Model 4NARX(2)[(2) (2 1) (0 1)]-wavelet0.992.80 × 10−44.27 × 10⁻⁴
Model 5NARX(2)[(2) (2 1) (0 0)]-sigmoid0.992.95 × 10−44.26 × 10⁻⁴
Model 6NARX(3)[(2) (2 2 1) (0 0 1)]-sigmoid0.991.48 × 10−42.41× 10⁻⁴
Model 7NARX(3)[(2) (2 2 1) (0 0 1)]-wavelet0.995.54 × 10−46.90 × 10⁻⁴
Model 8NARX(3)[(2) (2 2 1) (0 0 0)]-sigmoid0.991.26 × 10−41.88 × 10⁻⁴
Model 9NARX(3)[(2) (2 2 1) (0 0 0)]-wavelet0.994.96 × 10−46.09 × 10⁻⁴
Table 3. Membership function (MF) numbers and type’s performance evaluation.
MF No.R2MAE (g)RMSE (g)MF typesR2MAE (g)RMSE (g)
20.975.58 × 10−37.78 × 10⁻³Gaussian0.938.51 × 10−30.012
3−0.590.0450.118trapezoidal0.797.74 × 10−30.016
4−0.540.0710.359triangle0.840.0140.030
6−0.630.0490.109sigmoid0.975.58 × 10−37.78 × 10⁻³
Table 4. Adaptive neuro-fuzzy inference system (ANFIS) models performance evaluation.
ModelR2MAE (g)RMSE (g)
Model 10.380.0160.023
Model 20.130.0180.032
Model 30.975.58 × 10−37.78 × 10⁻³
Table 5. Testing models performance evaluation.
ModelR2MAE (g)RMSE (g)
Model 8-NARX0.982.55 × 10−33.68 × 10⁻³
Model 3- ANFIS0.964.79 × 10−36.78 × 10⁻³

