Article

Sizing Subsurface Defects in Metallic Plates by Square Pulse Thermography Using an Oriented Gradient Map

1
College of Engineering, Ocean University of China, Qingdao 266071, China
2
College of Mechanical and Electronic Engineering, China University of Petroleum (East China), Qingdao 266580, China
*
Author to whom correspondence should be addressed.
Appl. Sci. 2016, 6(12), 389; https://doi.org/10.3390/app6120389
Submission received: 3 November 2016 / Revised: 22 November 2016 / Accepted: 22 November 2016 / Published: 5 December 2016
(This article belongs to the Special Issue Structural Health Monitoring (SHM) of Civil Structures)

Abstract

:
We developed a new approach for sizing subsurface defects in the square pulse thermography of metallic plates by employing the oriented gradient of histograms. To size defects with high accuracies is still a challenge in infrared (IR) thermography today. Especially for blurry defects, accurate sizing of them is difficult with existing methods. The oriented gradient of histograms, which is used in the successful probability of boundary (Pb) contour detector in natural image processing literature, is employed in this work to improve the sizing accuracy in square pulse thermography. Experiments on a corroded steel plate with flat blind holes have verified the effectiveness of the proposed approach to size defects. Experimental results show that the proposed approach can size distinct and blurry defects with high accuracies. Comparison research is also implemented between the proposed approach and other sizing methods. The comparison results show that the proposed approach is superior to existing methods.

Graphical Abstract

1. Introduction

Defects in components can severely reduce the strength of a structure and may even result in a serious failure of the structure. Non-destructive testing (NDT) is an essential technique to detect defects on surface and subsurface defects in components. The objectives of NDT include detection of defects and their characterization. Detection of defects aims to judge whether defects are present in the tested specimen or not [1,2]. Characterization of defects is to determine dimensions of defects, including depth, thickness, and size. The size of a defect is a critical factor which should be considered when evaluating the remaining useful life and the capacity of a metallic component. Decision-making in maintenance management of a metallic component usually depends on the size information of the detected defects, and many NDT techniques have been used for defect sizing [3,4]. Consequently, accurate sizing of defects is of great importance in NDT of metallic components.
Infrared (IR) thermography, an important NDT technique, has been widely applied to test metallic components due to its advantages in terms of non-contact, efficiency, and safety [5,6,7,8,9]. The effectiveness of IR thermography in detecting subsurface defect in metallic components has widely been validated in many studies [10,11,12]. However, defects usually present weak indications in thermograms. Thermograms have more random noise compared to natural images due to the intrinsic principle of IR thermography [13]. Moreover, surfaces of test objects are not always ideal for processing with black matt painting, which is a common way to enhance defect indications in IR thermogaphy. For example, for a metallic part with a corroded surface, defect indications in thermograms are blurrier due to the effect of corrosion material. Non-uniform heating also makes some defects blurry in thermograms. Under non-uniform heating condition, defects obtaining less heating energy present weaker indications than those in regions with intensive irradiation. Sizing of these blurry defects with a high accuracy is significantly difficult in IR thermography.
Much research has focused on sizing defect in IR thermography. In general, these approaches can be classified into temperature profile-based, point-spread function (PSF)-based, and image processing-based approaches. Full width at half maximum (FWHM) is the most widely used temperature profile-based approach [14,15]. In FWHM, the width of half maximum gray level along horizontal and vertical lines in a selected IR thermal image is employed to describe the size of a defect. Olga et al. thus proposed a gradient-based sizing means for pulsed IR thermography, which is still widely being used today [16,17,18]. Maldague proposed a sizing method by computing the product of the derivative of contrast and contrast gradient in [13]. All of these approaches can size distinct defects with satisfactory accuracies. However, for blurry defects that present low observable indications, the above-mentioned approaches usually cannot perform with a sufficient accuracy. Moreover, difficulties in searching for the peak temperature location and in selecting the reference temperature make sizing blurry defects a time-consuming work.
PSF-based sizing approaches regard a captured thermal image as the convolution of the defect shape function and a PSF. With a known PSF, the contour of a defect can be retrieved by implementing deconvolution on the captured thermal image. Several PSF models have been proposed in IR thermography [19,20]. However, PSF is a function of defect depth. The contour of a defect can only be retrieved accurately on the condition that the depth of the defect is known. In other words, depth retrievement should be implemented before sizing a defect when using PSF-based approaches. This introduced step increases the workload of inspectors significantly.
Image processing is another means of sizing defects in IR thermography. Some image processing-based approaches have been proposed to size defects automatically. These approaches are based on contour detection or image segmentation. Classic contour detectors, such as the Canny operator and the Sobel operator, have been employed in IR thermography in the natural image processing literature [21,22]. Recently, a new approach to detecting the tips of cracks in inductive thermography was developed based on sparse greedy-based principle component analysis [23]. These contour detectors can provide accurate contour information for distinct defects. However, defects are not always distinct in IR thermography due to the effects of non-uniform heating and the depths of defects. Low observable defects are usually over-sized when applying these classic contour detectors. Besides contour detection algorithms, image segmentation is another kind of image processing-based sizing approach to distinguish defects from sound regions. Image segmentation algorithms applied in IR thermography include thresholding [24,25,26,27,28], region growing [29], superpixel segmentation [30], and anomaly detection [31]. Thresholding is the most commonly used method because of its easily understandable and simple programming. However, sizing accuracies of these image segmentation-based approaches are usually sensitive to the quality of thermal images.
Our work aims to develop a fast approach which can size defects with a satisfactory accuracy not only for distinct defects but also for blurry ones in square pulse thermography. The proposed approach is based on the oriented gradient of histograms, which is used to calculate gradient in the probability of boundary (Pb) contour detector used in the natural image literature [32,33]. Testing results on experimental thermal images demonstrate that the sizing accuracy in square pulse thermography can be improved significantly through the presented approach. Especially blurry defects, which may be over-sized greatly by existing methods, are sized with high accuracies in the proposed approach.

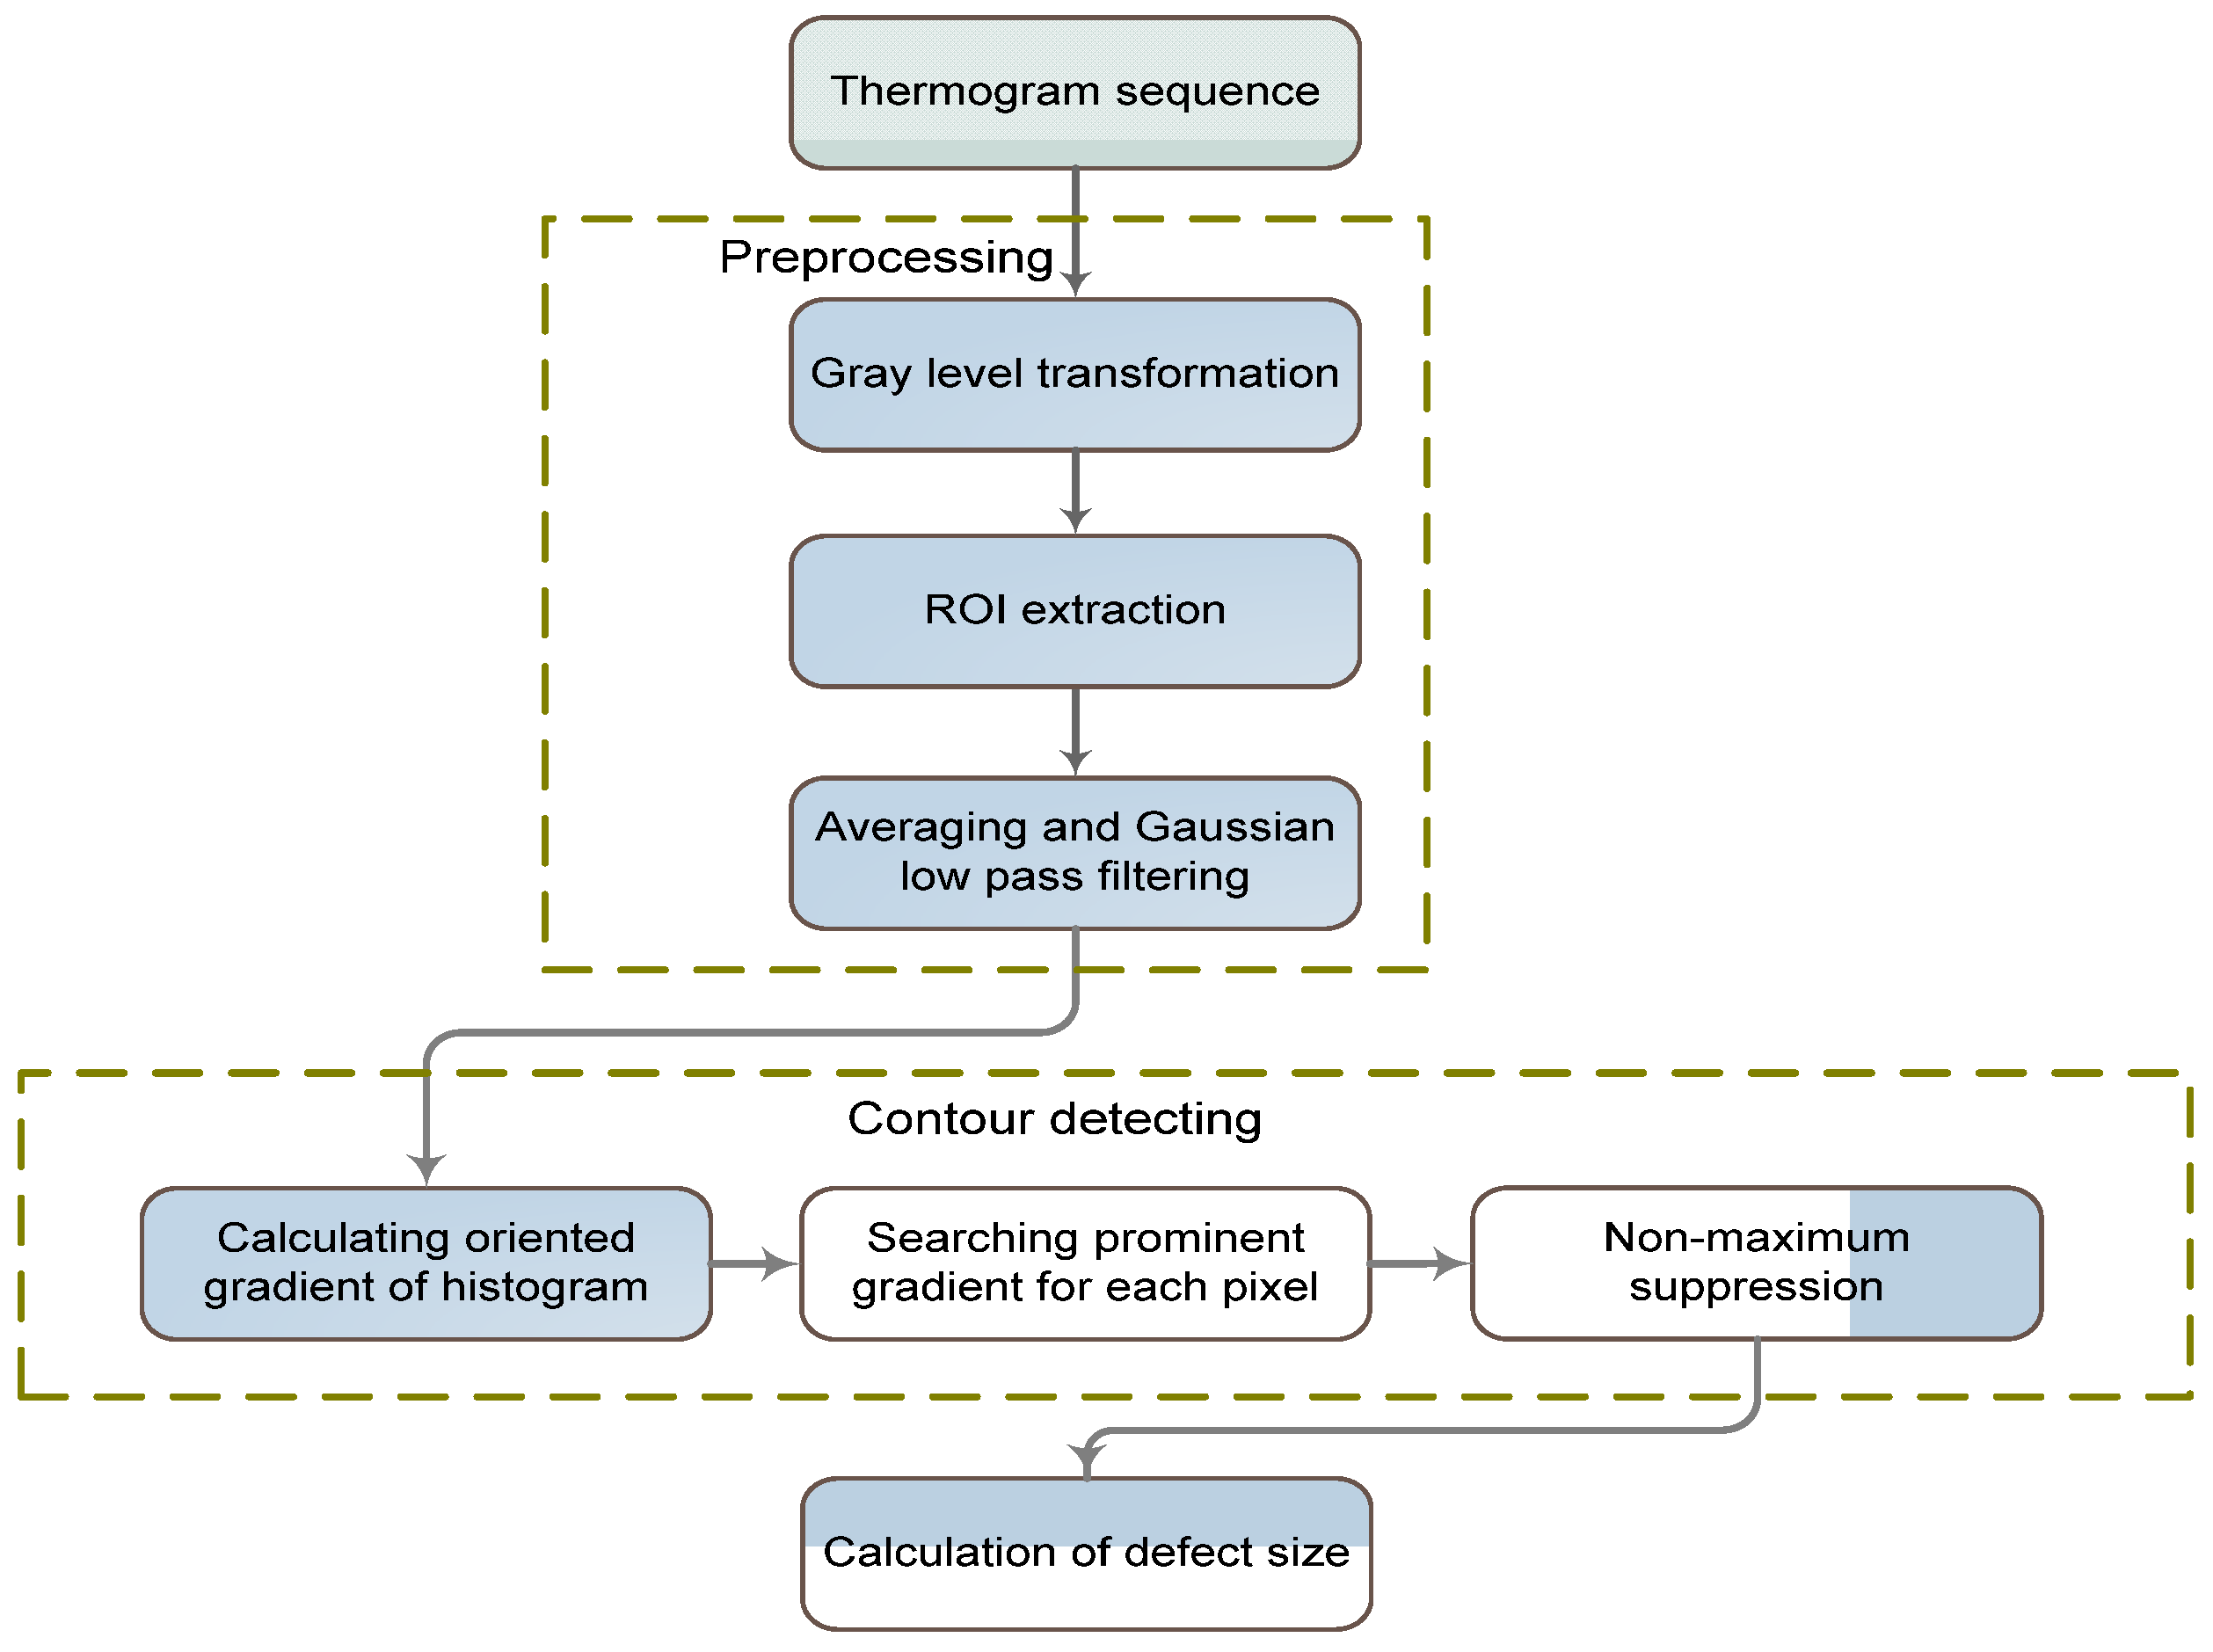
2. Details of the Proposed Approach

Figure 1 describes the flowchart of the proposed sizing approach. It mainly includes preprocessing of raw thermal images, contour detection of defects, and size calculation of defects. The preprocessing step aims to enhance defect indications in thermal images using existing methods. Then, contour detection is implemented by employing the oriented gradient of histograms. Finally, physical sizes of defects are calculated based on the ratio between physical size and pixel number in the thermal image.

2.1. Preprocessing of Raw Thermograms

In the developed approach, each thermogram is firstly transformed into a gray level image. After gray level transformation, the gray level of each pixel is proportional to its temperature. The region of interest (ROI) that corresponds to the tested specimen is then extracted by using a simple thresholding process on the first thermal frame. Otsu’s thresholding method is employed in our work because of its automated determination of threshold value [34].
There has always been a great deal of random noise in thermograms due to the intrinsic working principle of IR thermography. Just like the adverse effect of random noise on the accuracy of the contour detection of natural images, random noise in thermograms can also reduce sizing accuracy significantly. Hence, the denoising of thermogram is important for improving sizing accuracy. In our work, all thermograms recorded during the heating period were averaged to diminish random noise, as described in [25]. Then, the averaged thermogram was filtered through the Gaussian low pass filter as proposed in [26] to weaken the effect of random noise further.

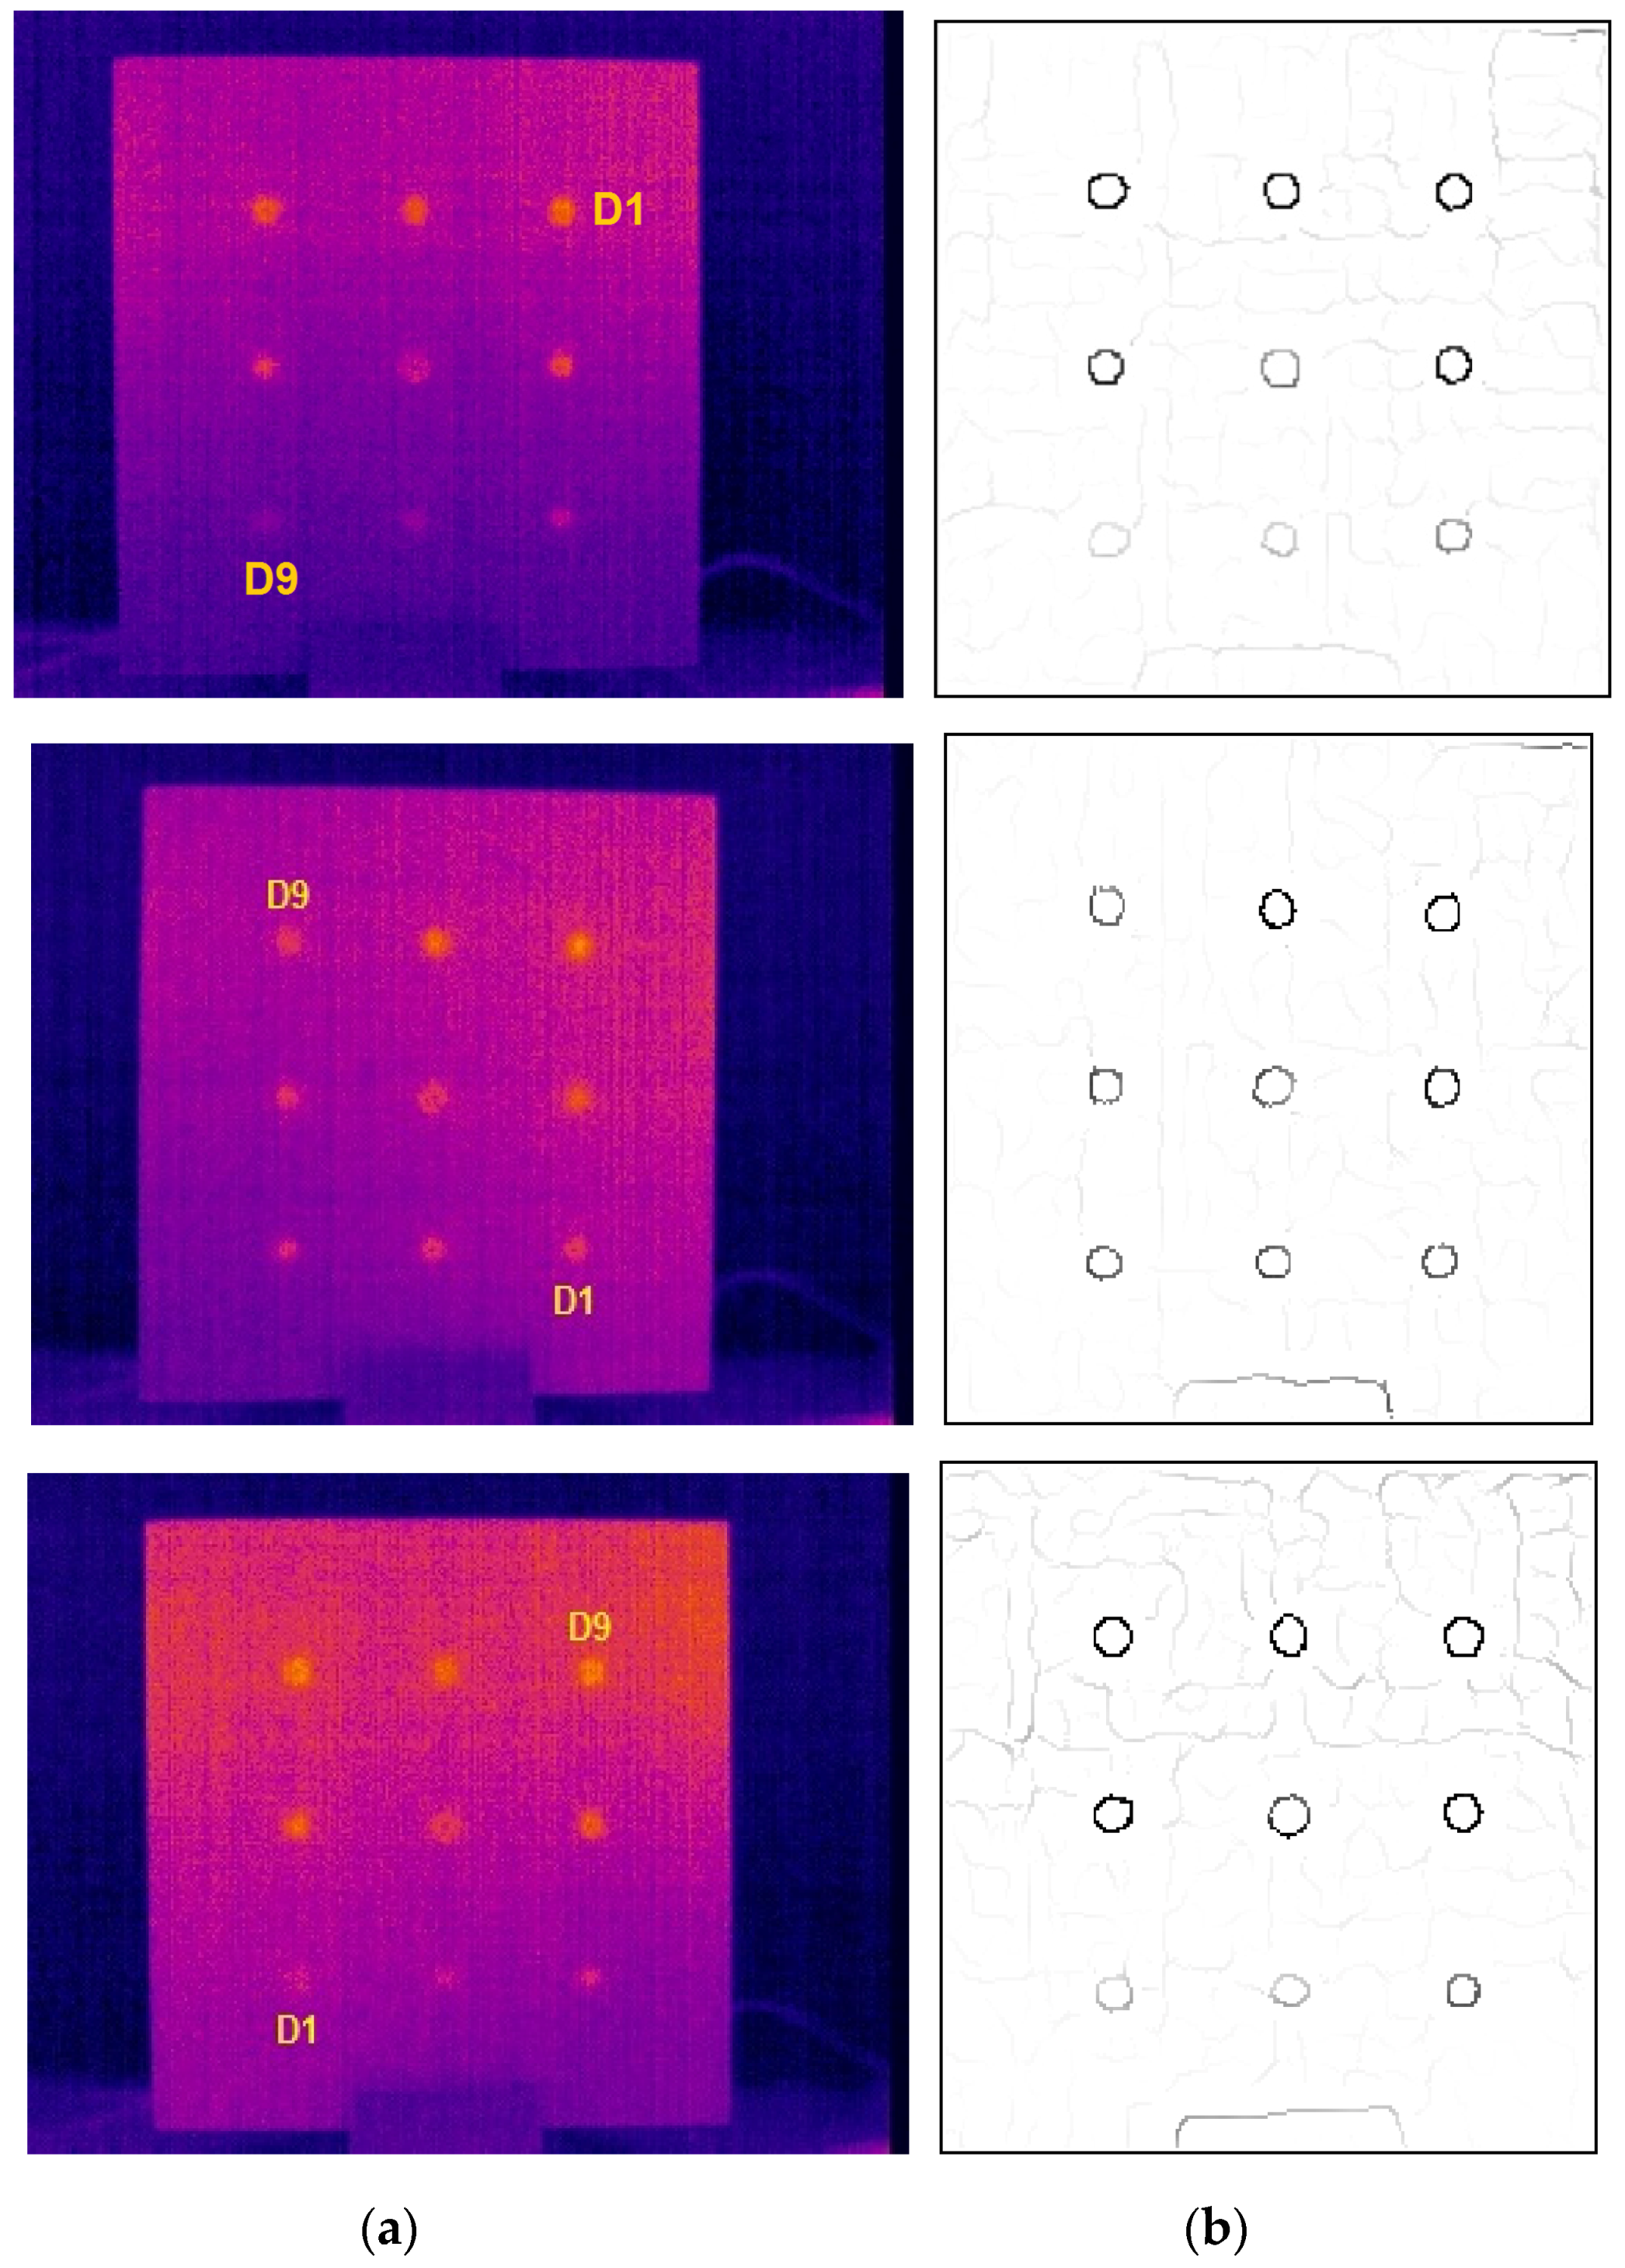
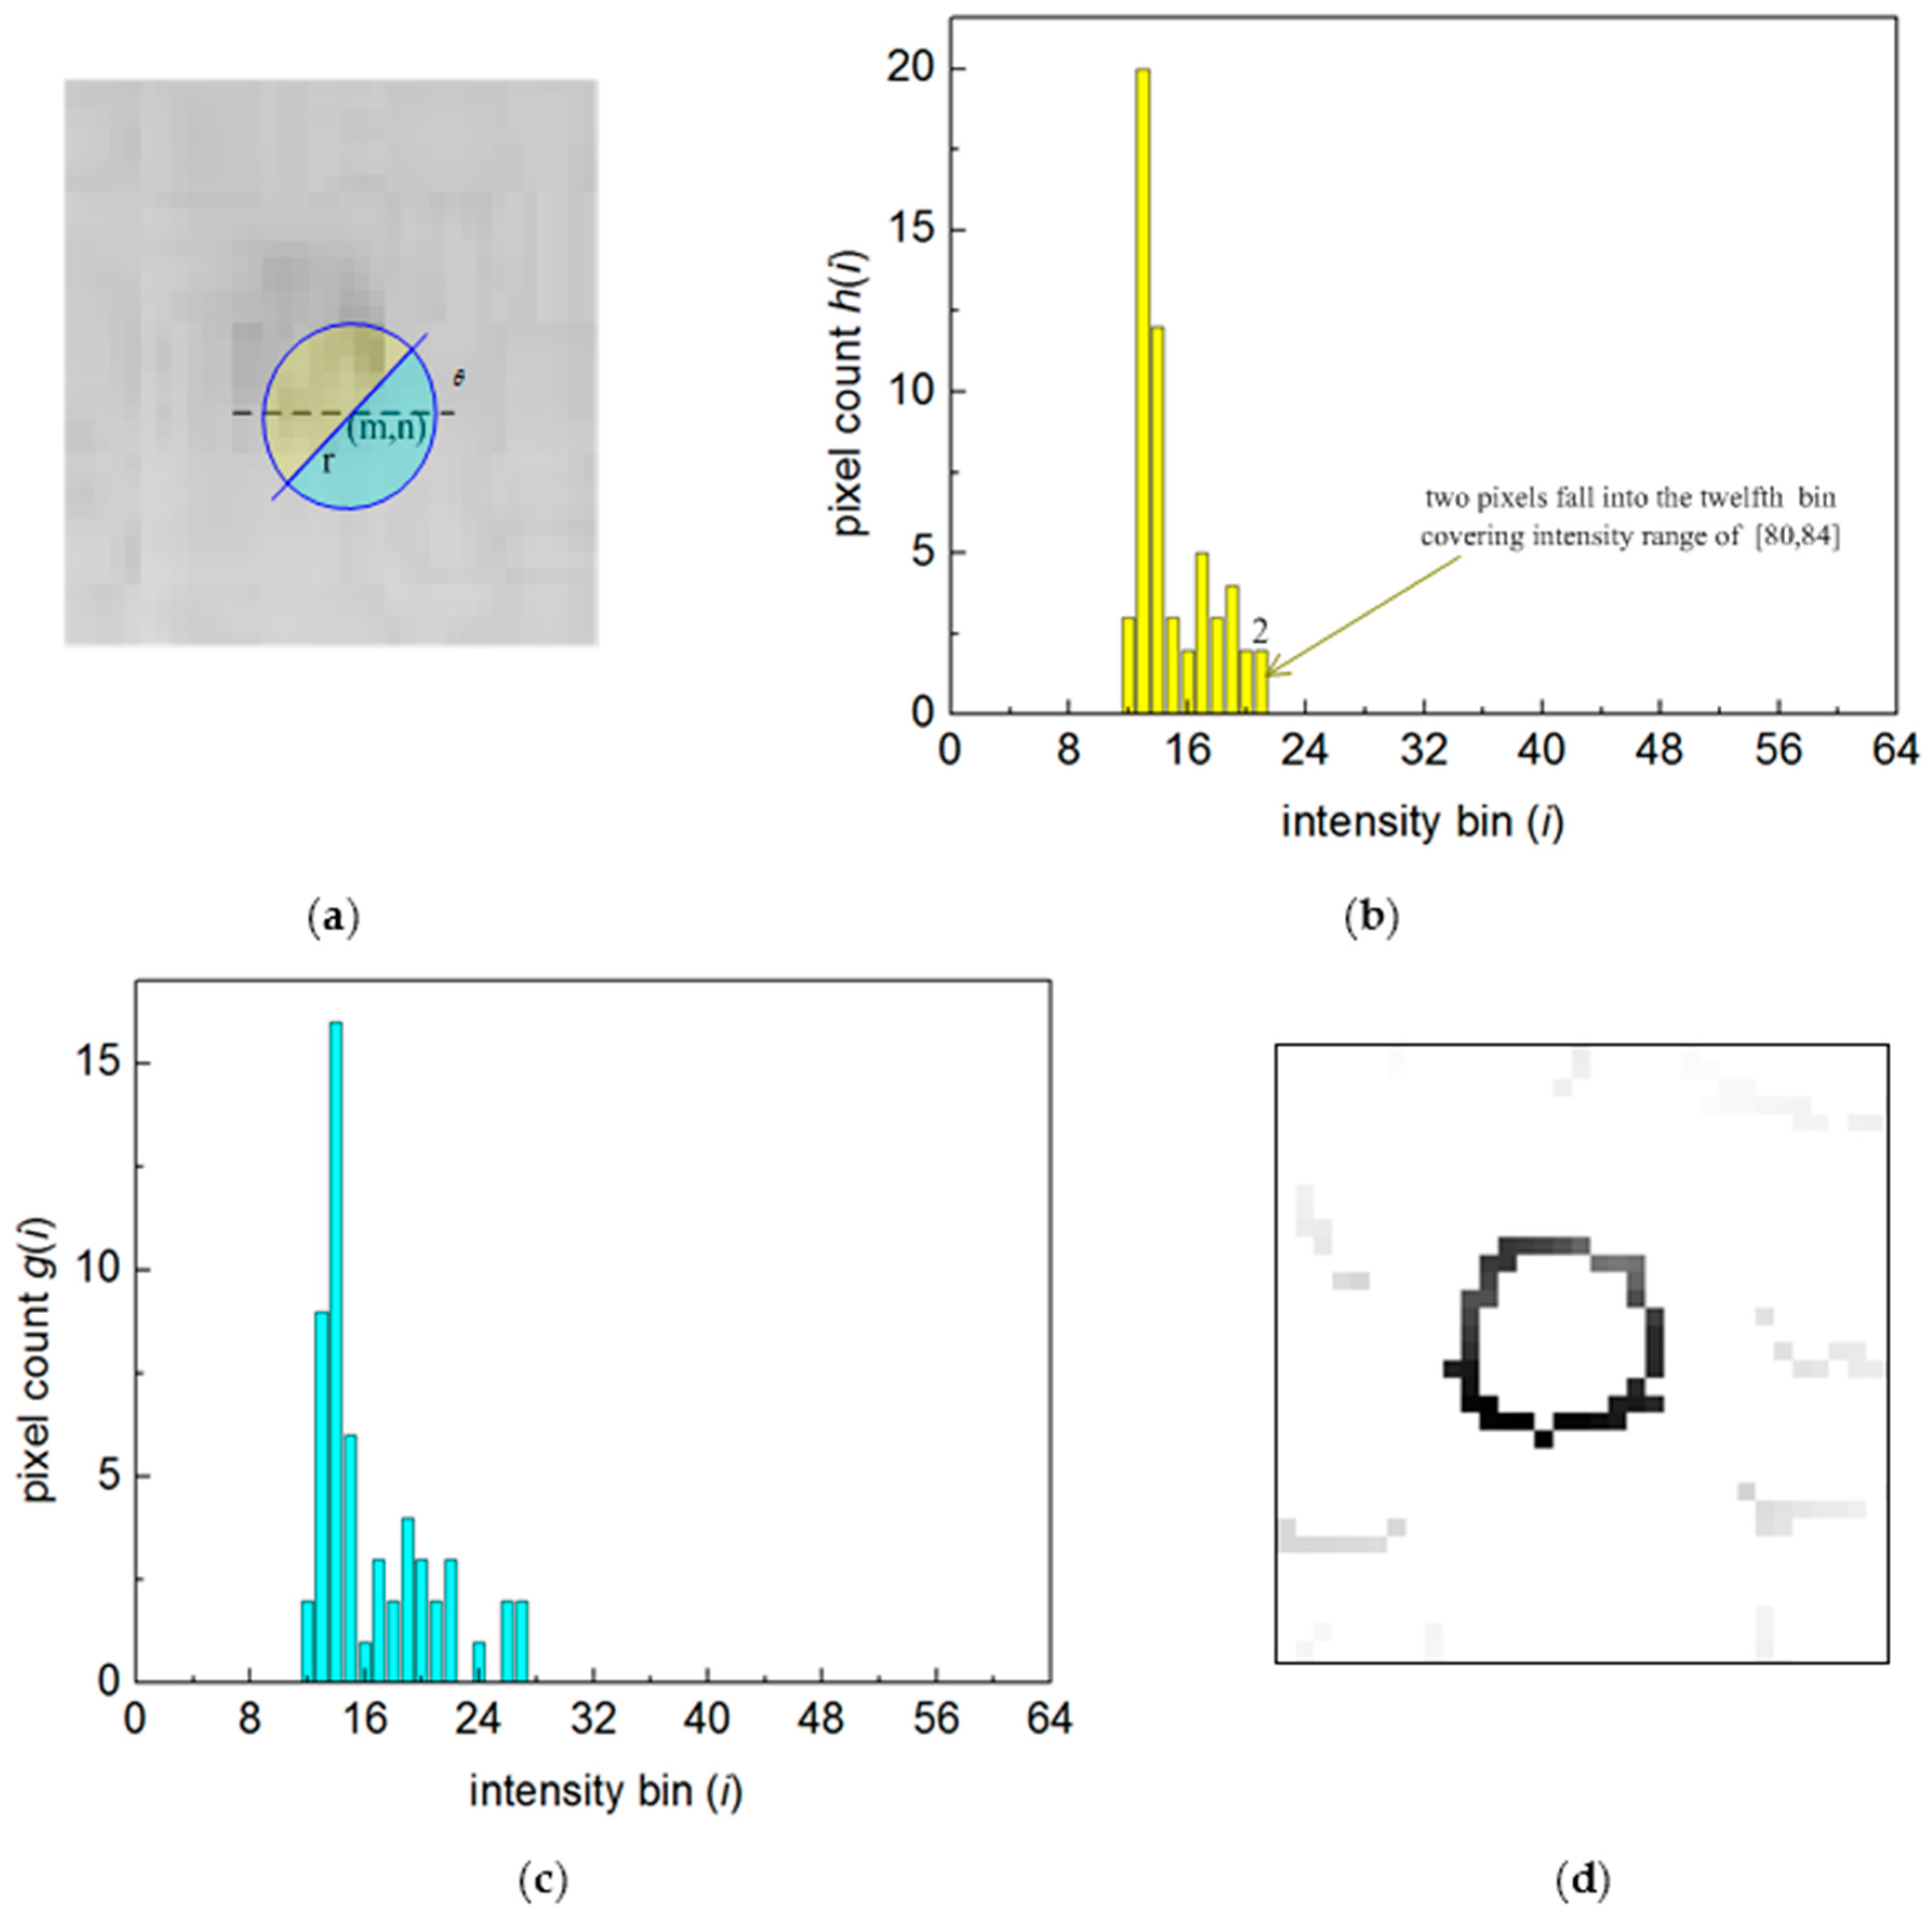
2.2. Contour Detection Using the Oriented Gradient of a Histogram

The oriented gradient of histograms has been used in Pb contour detectors and has been a successful method in image processing literature [32,33]. For most classical gradient-based contour operators, such as the Canny operator or the Sobel operator, the gradient at an investigated pixel is calculated based on the gray levels of its neighbor pixels. Different from these methods, the oriented gradient of histograms is calculated based on the intensity histogram of a local region, the center of which is the investigated pixel.
The calculation of the oriented gradient for a pixel (m, n) is demonstrated in Figure 2. A circular disc with a specified radius of r is placed at the investigated pixel and the disc is split into two half-discs by a diameter at angle θ, as shown in Figure 2a. According to the findings in the previous work [32], when calculating the intensity histogram of each half-disc region, the gray level range of [0, 255] is divided into 64 bins in our work; consequently, each bin covers an intensity range of about 4. Intensity histograms of the two half-disc regions were calculated and are shown in Figure 2b,c, respectively. The horizontal ordinate in the intensity histogram describes the intensity bins, and values at the vertical ordinate are the count of pixels falling into each bin. The oriented gradient of histograms at pixel (m, n) along direction θ is then described by the χ 2 distance between the histogram g(i) of the lower half-disc and the histogram h(i) of the upper half-disc:
G ( m , n , θ ) = 1 2 i = 1 64 ( g ( i ) h ( i ) ) 2 g ( i ) + h ( i ) .
For each pixel, the oriented gradient is calculated along different directions by changing the value of θ. In our work, oriented gradients are calculated in nine directions by changing θ from 0° to 160° with an interval of 20°. Consequently, each pixel has nine oriented gradients corresponding to nine directions. Only the maximum gradient of each pixel remains as the prominent gradient, and a gradient map is then constructed with the prominent gradient of each pixel. In the constructed gradient map, pixels around which gray levels change greatly will have large gradient magnitudes. These pixels with large gradient magnitudes constitute the contours of the defects.
The contour of a defect presents a wide border in the constructed gradient map. In order to locate the defect contour more accurately, a narrow border with a pixel width should be determined. Non-maximum suppression (NMS) is implemented for this object in this work. NMS is a commonly used method in the image processing literature for obtaining a one-pixel width edge. Details of NMS are given in [35]. Through NMS operation, only the local maxima pixels remain in the gradient map. Consequently, the defect contour is indicated as a one-pixel width curve. The gradient map of Figure 2a after NMS processing is shown in Figure 2d.
Once the contour of a subsurface defect is detected, the size of the defect can be easily calculated based on the ratio between the physical size and the pixel number in the thermogram of the tested specimen.

3. Experiment Result and Discussion

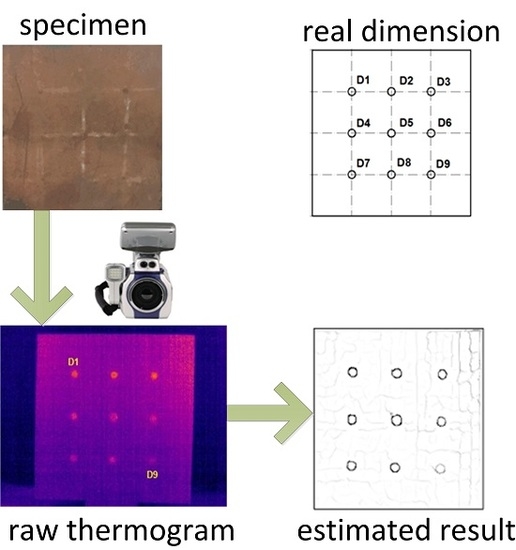
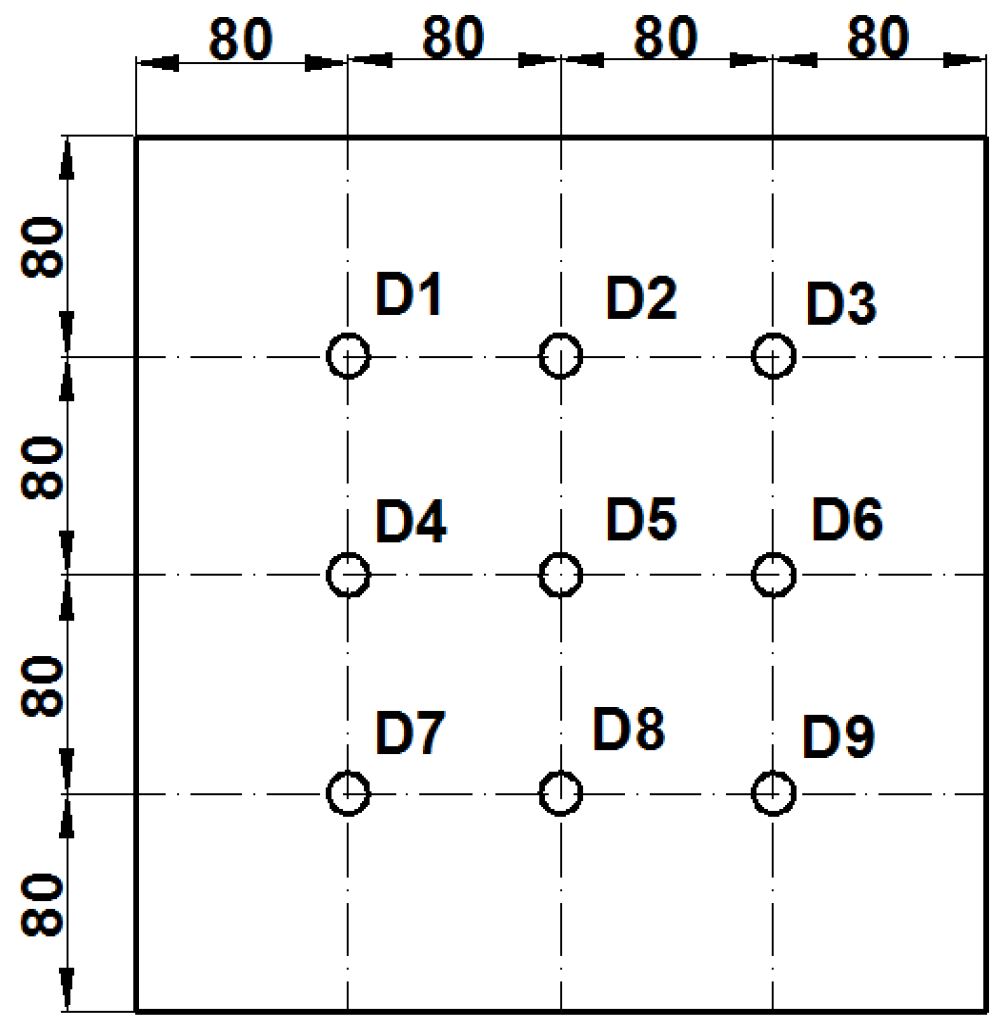
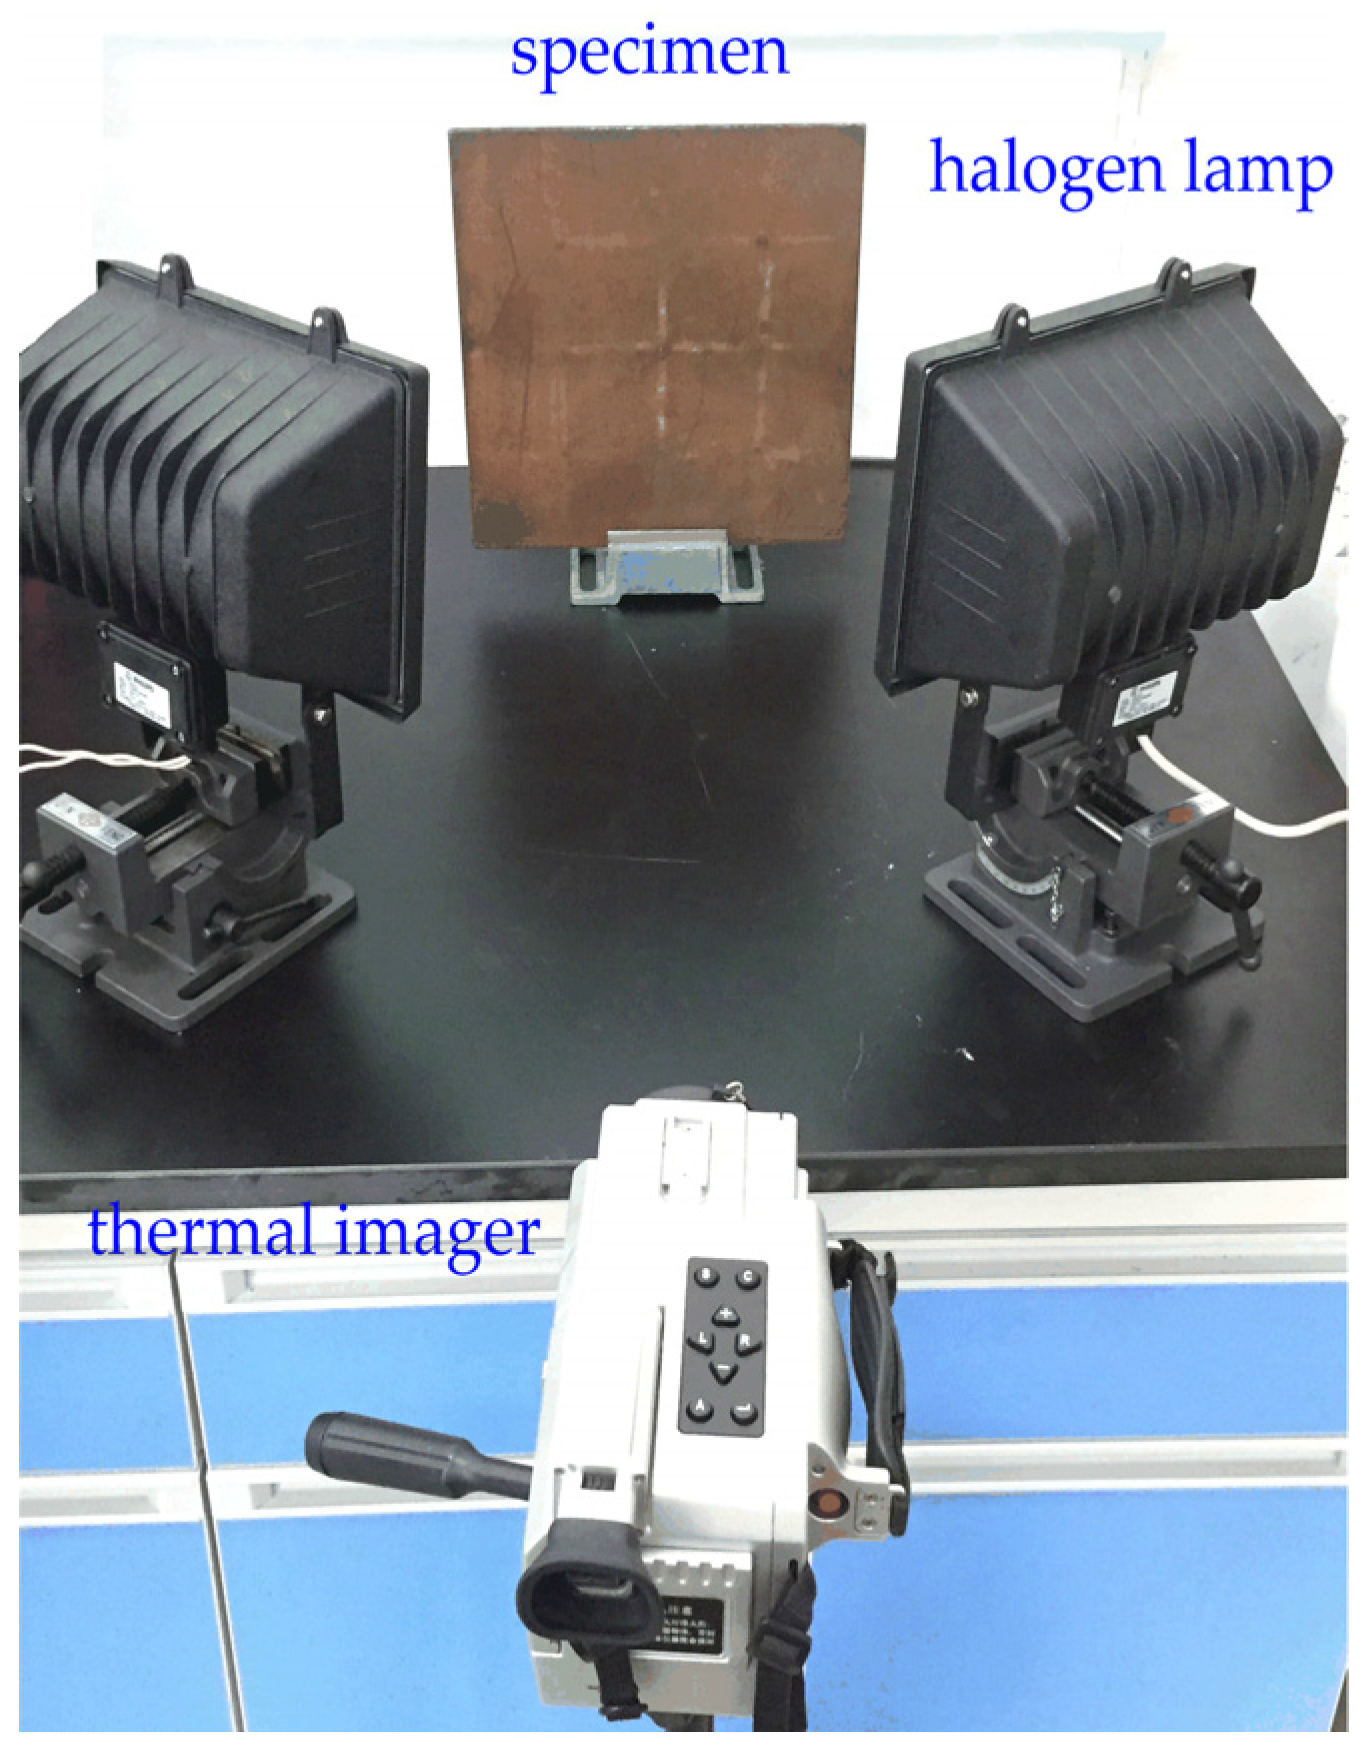
3.1. Experimental Setup

The proposed approach was tested on experimental thermogram sequences. The experimental setup for square pulse thermography is shown in Figure 3. Two Phillips QVF137 halogen lamps with a rated power of 1000 W were used to generate square pulse thermal waves. The temperature distribution of the metallic surface was captured using a SAY-HY6850 infrared imager with a thermal sensitivity of 80 mK and a resolution of 320 × 240. Both the lamps and the infrared thermal imager were located on the same side with respect to the inspection surface of the specimen. The vertical distance between the inspection surface and the lamps is 0.4 m, while that between the inspection surface and the infrared thermal imager is 0.9 m. With these arrangements, one pixel represented about 1.47 mm in thermograms. The incidence angle of square pulse thermal waves was about 45°. In order to verify the efficiency of the proposed approach for blurry defects, the lamps were mounted such that their centers were 5 mm higher than the horizontal center line of the specimen. As a result, less heating flux was obtained by defects in the bottom row. Due to this non-uniform heating, indications of the bottom row defects were greatly weakened in the captured thermograms.
Experiments were performed on a Q235 steel plate (320 × 320 × 6 mm3). The plate was placed in a moist environment for about three months without any corrosion prevention. Then, the surface of the plate was completely covered by corrosion material. Nine flat-bottom blind holes with the same diameter of 15 mm but with different depths (from D1 to D9: 0.55, 0.50, 0.65, 0.8, 0.65, 0.75, 0.70, 0.7, 1.0 mm) were machined, and detailed information of these defects is shown in Figure 4. If the surface of the specimen had not been corroded and had been processed by black matt painting, indications of these defects would be very distinct in thermograms. However, due to the effect of the corrosion material, the indications of defects were weakened significantly in the real test. Under this condition, the performance of the proposed approach for blurry defects can be tested precisely.
In order to verify the repeatability of the proposed approach, the specimen was tested four times, and the specimen was rotated for 90° in each testing. During each testing, the specimen was heated for 8 s, and thermograms were recorded for 16 s with a sampling frequency of 25 Hz.

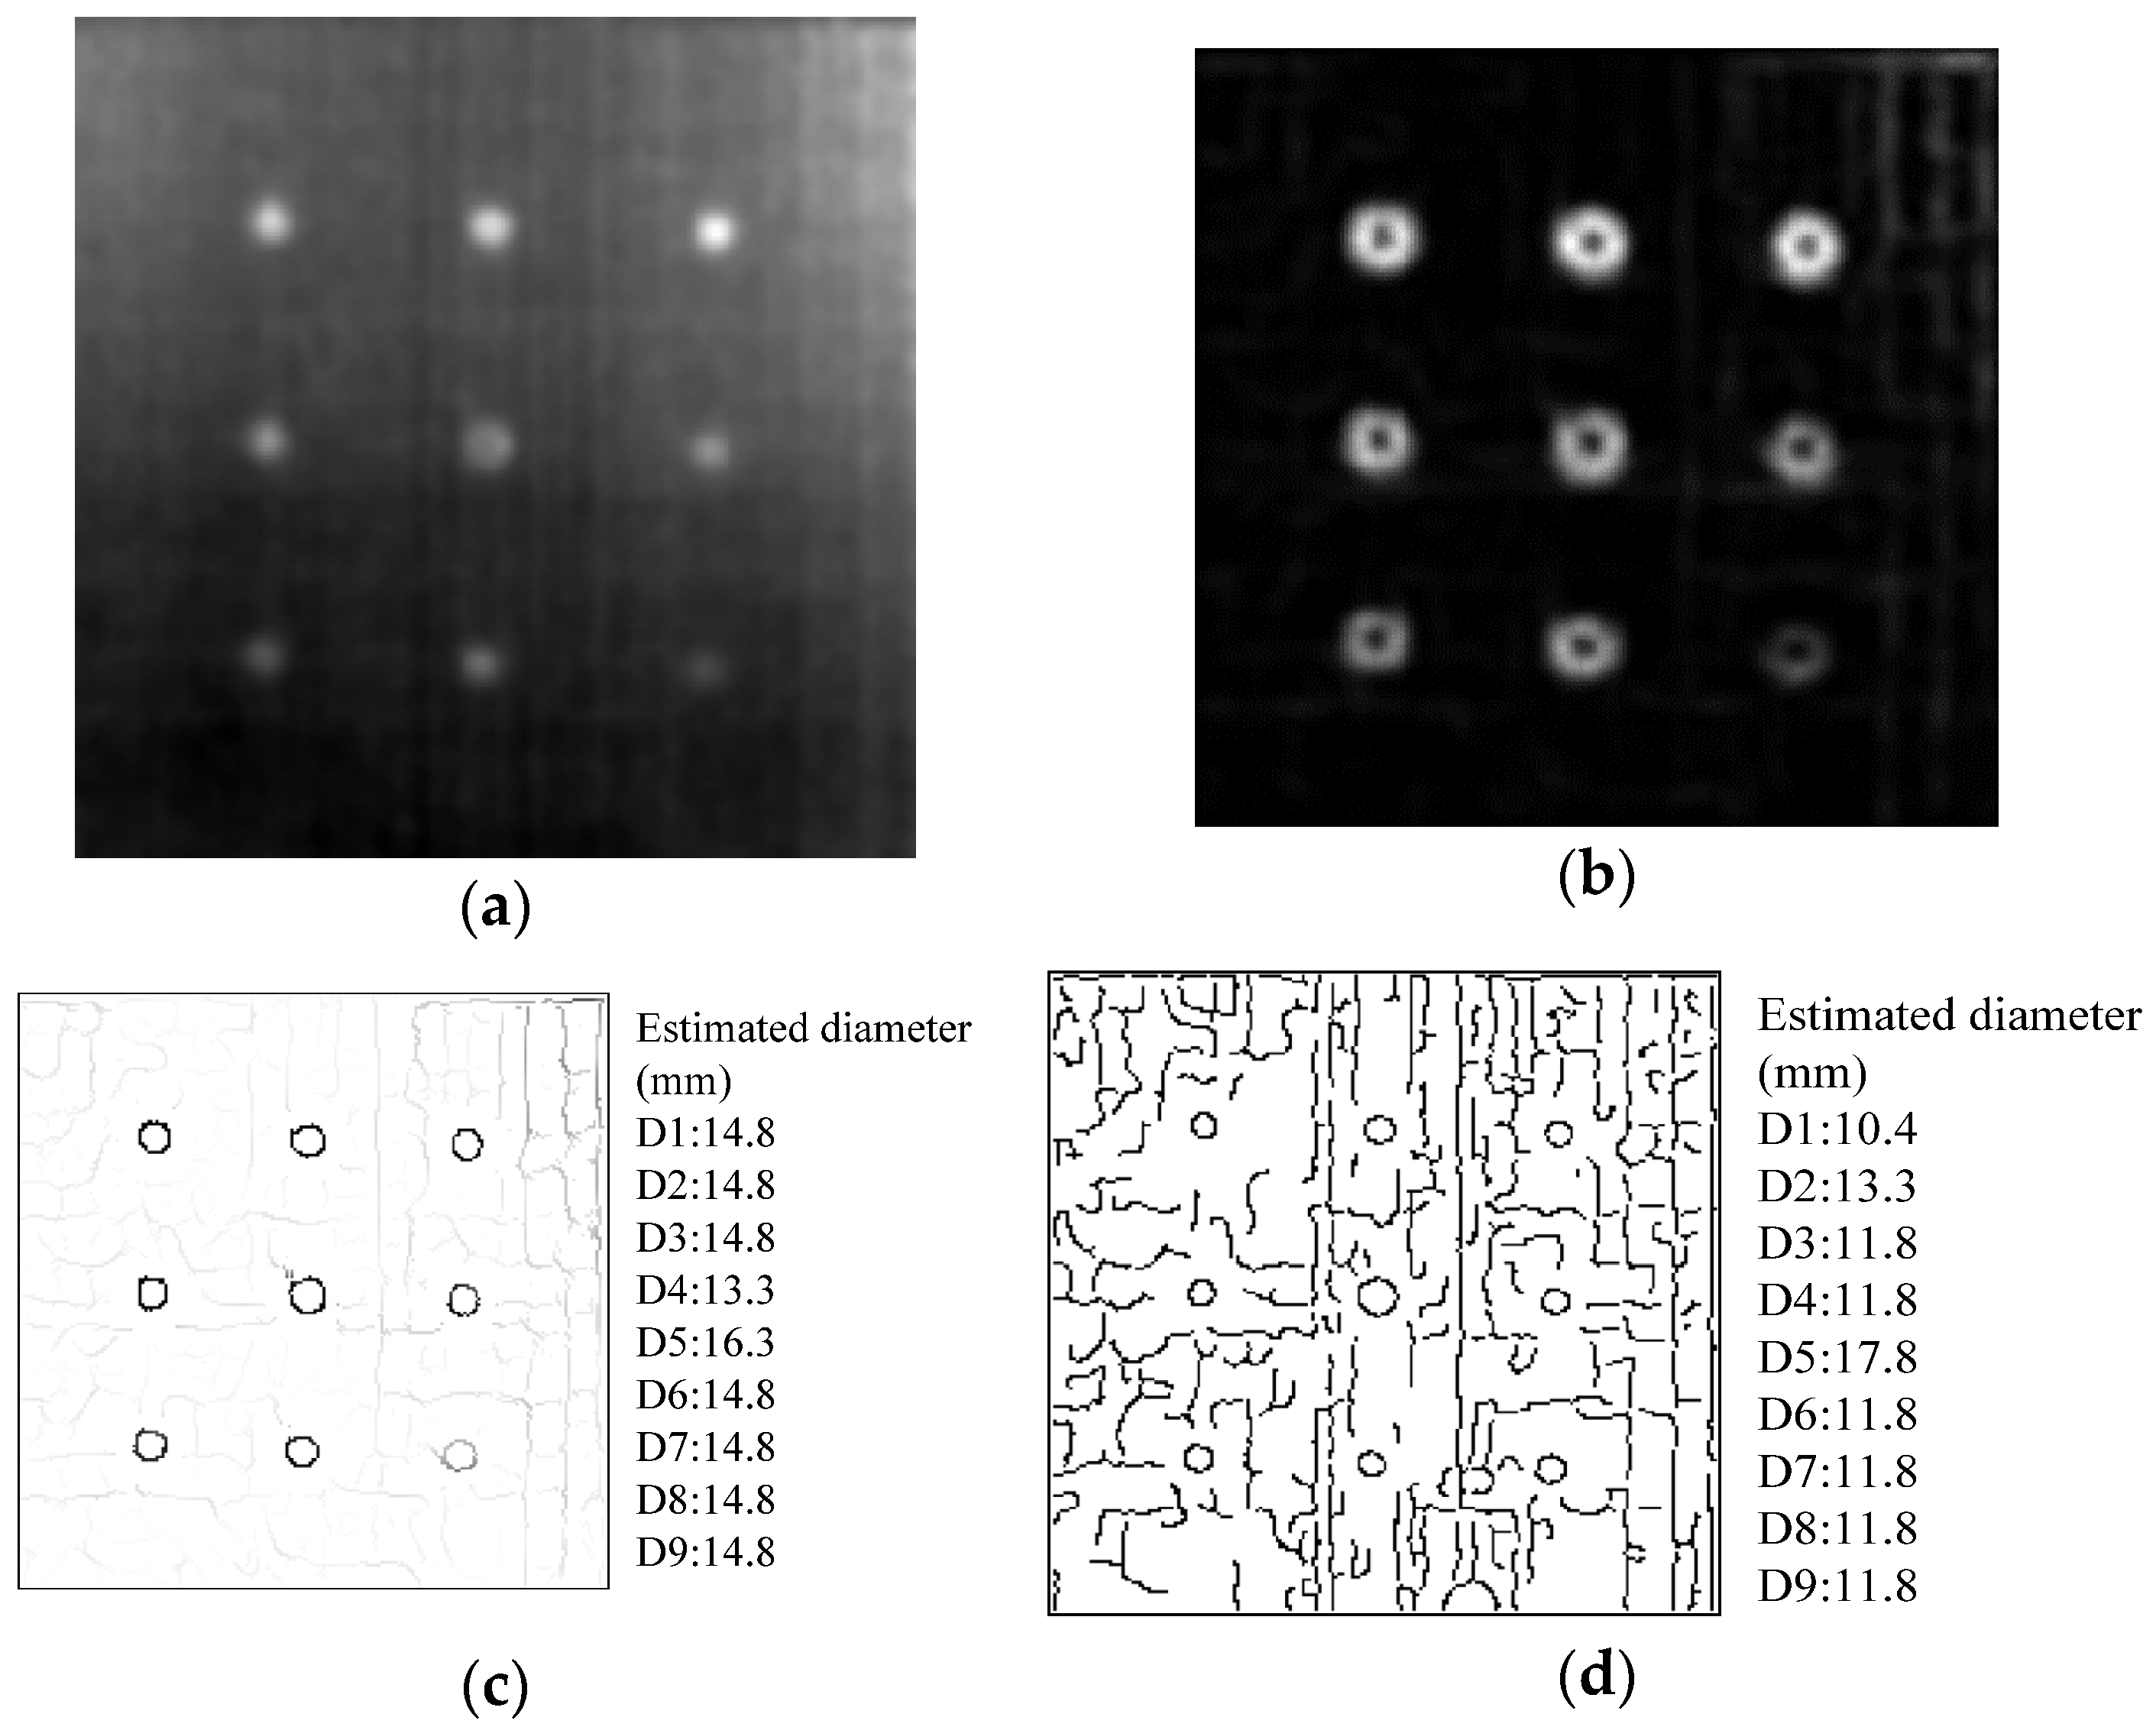
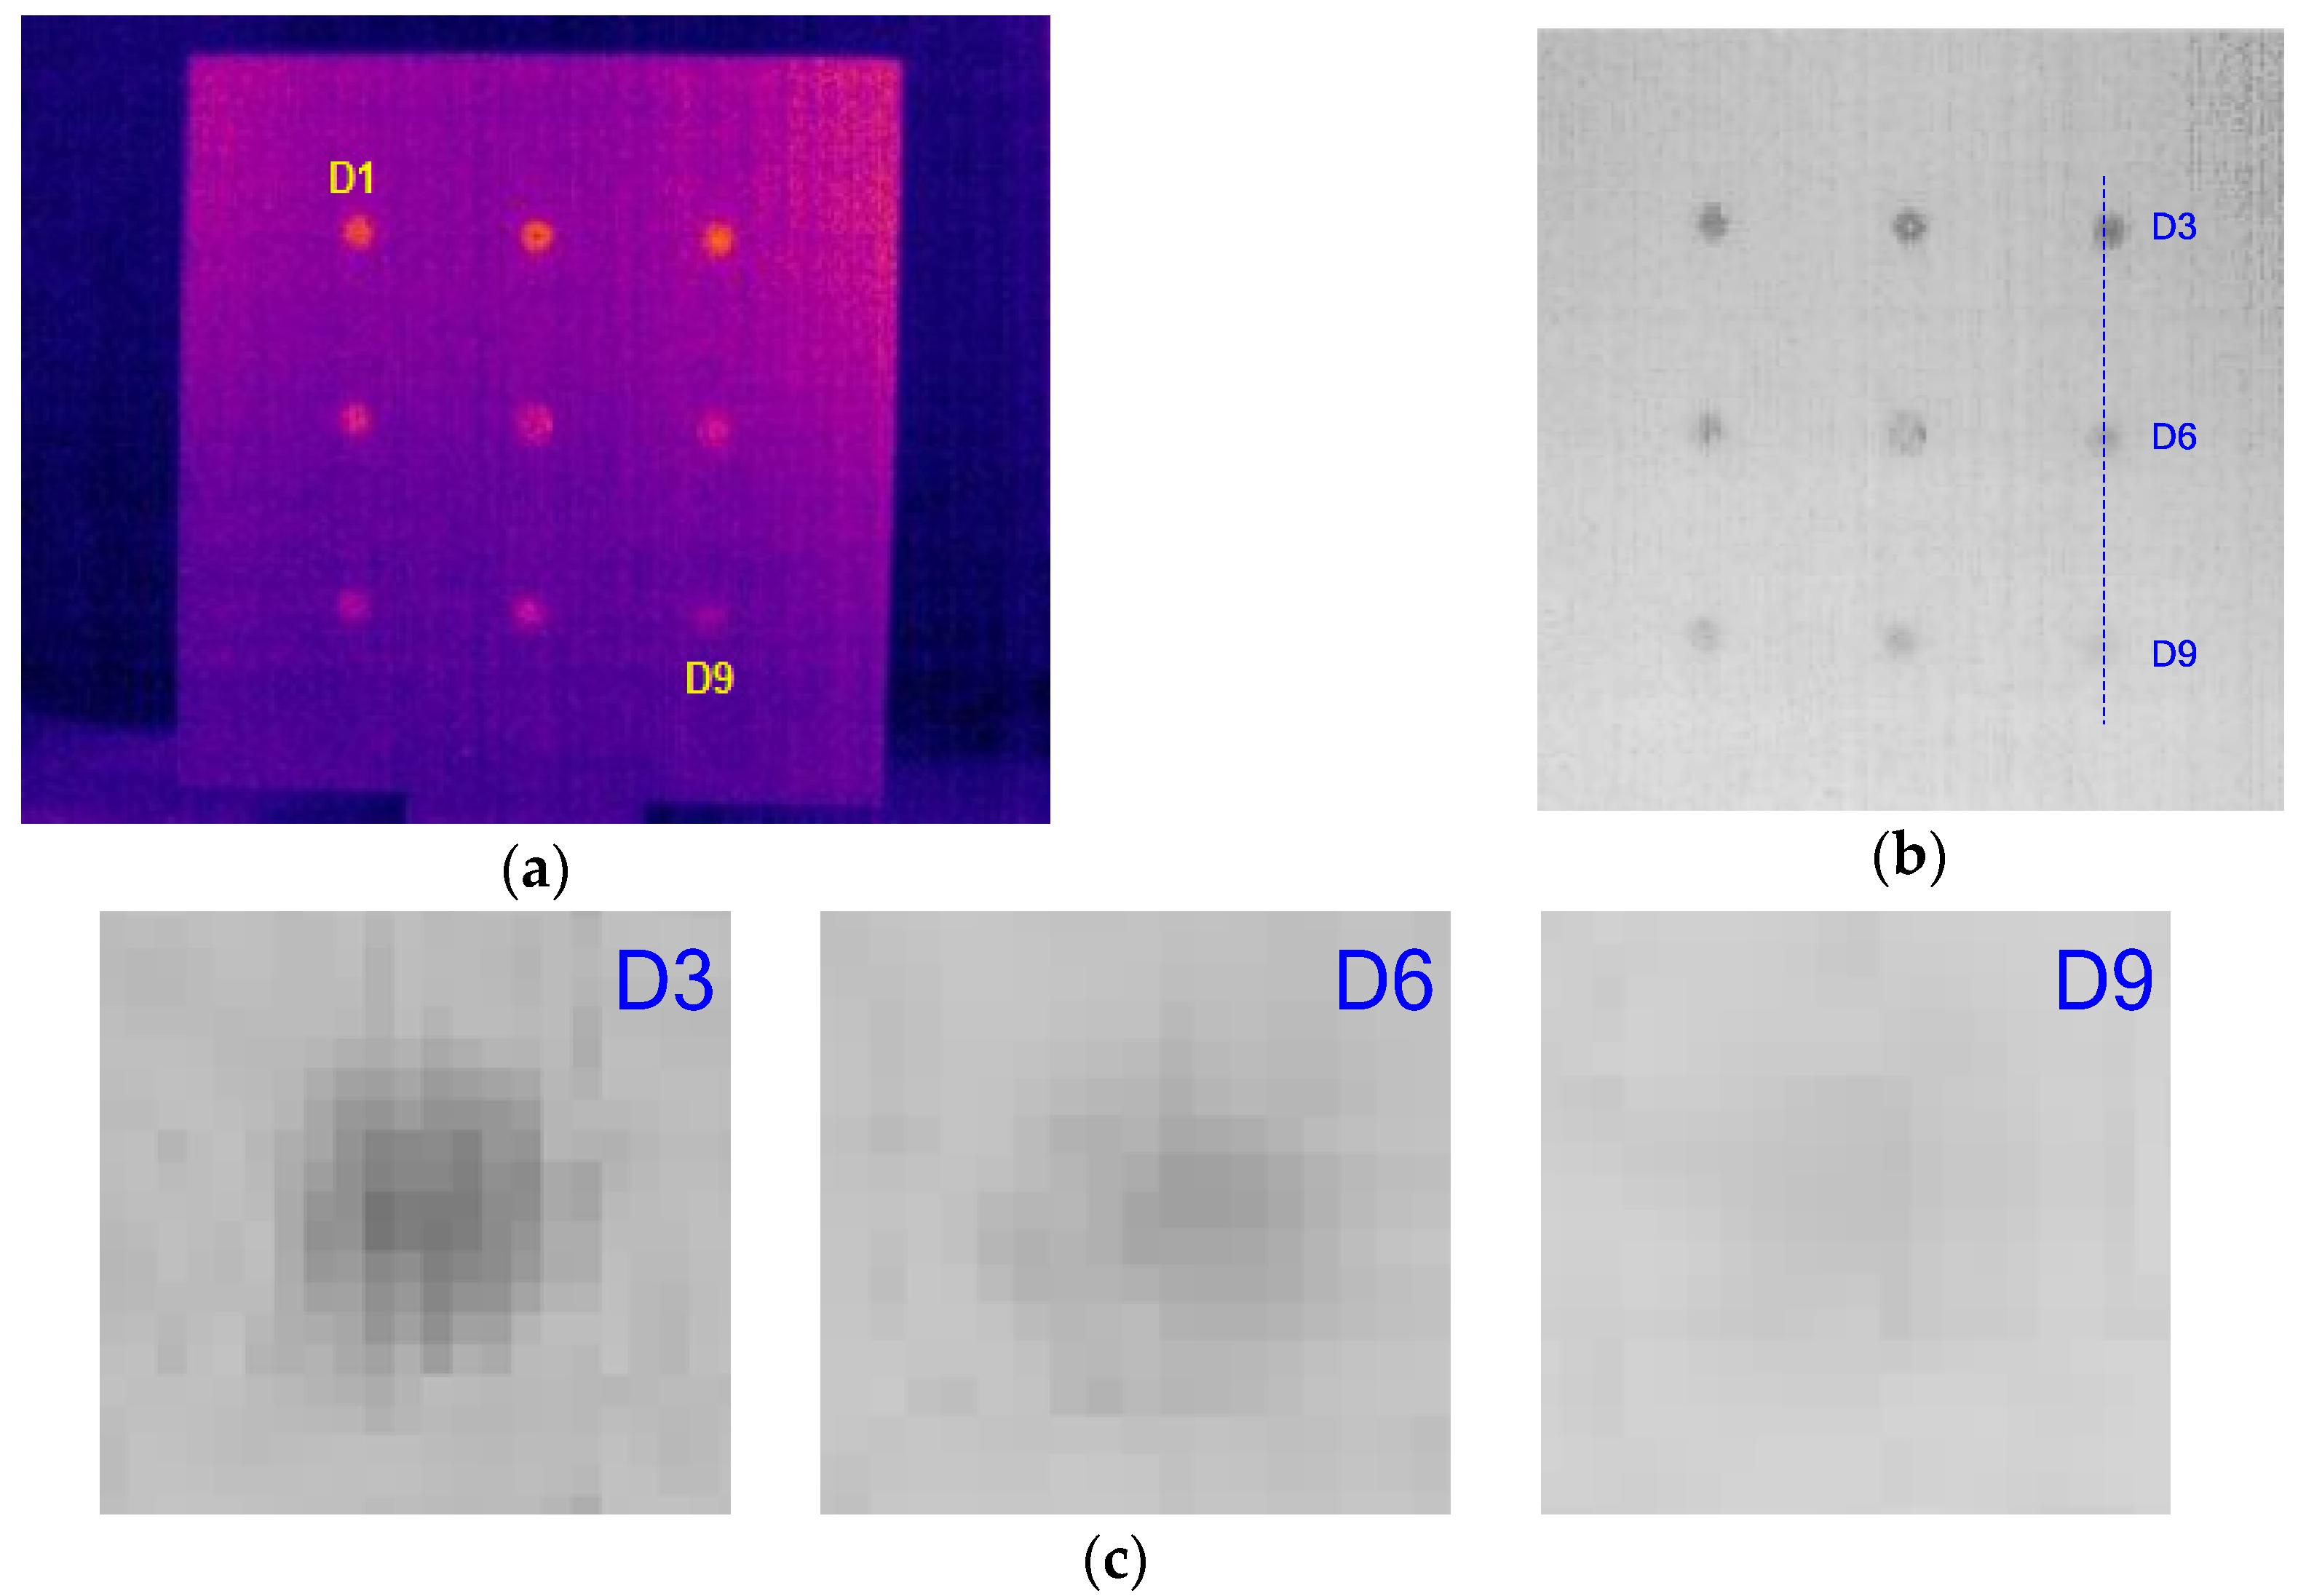
3.2. Sizing Results on Experimental Thermograms

The thermogram captured at 5.6 s from the heating beginning is shown in Figure 5a. In this thermogram, defect D9 has the best contrast indication compared to that in other thermograms. The gray level ROI image is shown in Figure 5b. From this image, it can be seen that the defects present indications with various observable levels. The defect depth is a crucial factor resulting in the difference in contrast indications of defects. A deeper defect presents a lower observable indication and a more blurry contour according to heat conduction theory. Non-uniform heating is another reason for the different defect indications. As stated previously, the centers of lamps were not aligned to the horizontal center line of the specimen, which resulted in a serious non-uniform heating condition. More heating energy was obtained by the upper part of the specimen. For defects in regions obtaining lower heating energy, they presented lower contrast indications. The amplified views of the defects in the right column are shown in Figure 5c. It can be seen that D3 presents as a distinct defect, while D6 and D9 have low contrast indications and blurry contours because D6 and D9 are deeper than D3 and they obtained less heating energy.
D9 has extremely low observability and its contour is too blurry to be located, which makes the sizing of this defect a challenge. This can also be observed in Figure 6, which shows the intensity profile along the line across the right column defects. The contrast between defect and sound region varies greatly for D3, D6, and D9. Sizing results of FWHM for these defects are also demonstrated in Figure 6. We can see that D3 was sized with the highest accuracy by FWHM due to its distinct contrast indication. However, the estimated sizes of D6 and D9 by FWHM deviated from the real sizes, with large errors of 4.7 mm and 5.3 mm, respectively. This result demonstrates that the sizing accuracy of FWHM closely depends on the contrast level of the defect indication.
The denoised thermogram after averaging processing and Gaussian low pass filtering is shown in Figure 7a. Figure 7b depicts the prominent oriented gradient map of this denoised thermogram. In Figure 7b, it can be observed that pixels on defect contours have larger gradient values in the prominent oriented map. After implementing NMS on the prominent gradient map, one-pixel width contours of the defects were obtained and are shown in Figure 7c. As can be seen, the circular shape of each defect has been retained well. Using the ratio between physical size and pixel number of the tested specimen, defect sizes were calculated, and the results are illustrated in Figure 7c. The calculated results show that the estimated size is approximately equal to the real diameter (15 mm) for all defects, including the hardly observable D9. Most defects are accurately sized with a tiny error of 0.2 mm (3.25%). As a comparison, the Canny operator was also employed on the denoised thermogram to size the defect, and its sizing results are shown in Figure 7d, which indicates that most defects were sized by the Canny operator with an error of 3.2 mm (21%). The maximum sizing error of the Canny operator is 4.6 mm (31%). A detailed comparison of the proposed approach to the Canny operator and the FWHM is shown in Table 1. It can be observed that, when employing the Canny operator to detect defect contours, the sizing error is generally larger than that of the proposed approach. FWHM provides a slightly lower accuracy than the proposed approach for distinct defects (D1, D2, and D3). However, the sizing accuracy of FWHM decreases greatly for blurry defects. In contrast, the proposed approach provides satisfactory sizing result for these blurry defects with an accuracy similar to those for the distinct defects.
In order to investigate the performance of the proposed approach further, we tested the specimen repeatedly by rotating the specimen 90° each time. Because lamps and specimen are not located at the same height as described previously, top row defects always obtain more heating energy. As a result, thermograms captured in each test vary greatly due to this non-uniform heating. The raw thermogram with maximum contrast for D9 and the contour detection result of the proposed approach for the testing directions of 90°, 180°, and 270° are shown in Figure 8. It can be observed that shapes of all defects are described well by the proposed approach. The detailed sizing results for each test are illustrated in Table 2. The maximum sizing error is 1.8 mm considering all tests. From the mean error averaged on four tests, it can be found that sizing errors of all defects except D5 are within 1 mm. By observing the surface of the tested specimen, we found that the surface corresponding to D5 is extruding due to the machining process. We think such a special surface condition corresponding to D5 is the possible reason for its special sizing error, which is slightly larger than those of other defects.

4. Conclusions

Although the sizing of defects in IR thermography has been researched for decades, sizing a blurry defect accurately is still a challenge. In this work, the sizing of subsurface defects in square pulse thermography of metallic plates is accomplished by employing the oriented gradient of histograms, which is used in a Pb contour detector found in the natural image processing literature. The oriented gradient of histograms is calculated based on the distribution of the gray level value in a local region rather than the gray level value of a single pixel.
Experimental testing was implemented on a corroded steel plate on which nine flat-bottom blind holes with a diameter of 15 mm were machined. Attributed to the non-uniform heating and variation of defect depths, defects presented different observable levels in raw thermograms. The experimental result shows that the proposed approach succeeds in not only sizing distinct defects but also sizing blurry ones with high accuracies. The sizing result of the proposed approach is compared to that of the Canny operator and FWHM. The comparison shows that the proposed approach is superior to the Canny operator in sizing not only distinct defects but also blurry ones. When sizing distinct defects, the proposed approach has an accuracy similar to FWHM. However, it outperforms FWHM when sizing blurry defects. We implemented experiments repeatedly by rotating the tested specimen 90° each time. The sizing results of the proposed approach are generally stable although serious non-uniform heating was stimulated in the experiments. Experimental results verified that the proposed approach can size both distinct defects and blurry ones with a high and stable accuracy in square pulse thermography of metallic plates. Based on the accurate size information provided by the proposed approach, a more reasonable decision can be made in the maintenance management of metallic components. In the future, we will test the performance of the proposed approach on IR thermography with other excitation means.

Acknowledgments

This work was financially supported by the National Key Research and Development Program (Nos. 2016YFC0303803), the Fundamental Research Funds for the Central Universities of China (Nos. 14CX02077A) and the Shandong Provincial Natural Science Foundation of China (Nos. ZR2013EEQ028).

Author Contributions

Jing Xie conducted experimental data analysis and wrote the paper. Changhang Xu organized and revised the paper. Xumei Gong performed the experiments and drew all figures. Weiping Huang provided guidance for methods of data analysis. Guoming Chen provided advices for results discussion.

Conflicts of Interest

The authors declare no conflict of interest.

References

  1. Marks, R.; Clarke, A.; Featherston, C.; Paget, C.; Pullin, R. Lamb Wave interaction with adhesively bonded stiffeners and disbonds using 3D vibrometry. Appl. Sci. 2016, 6, 12. [Google Scholar] [CrossRef]
  2. Wang, T.; Song, G.; Wang, Z.; Li, Y. Proof-of-concept study of monitoring bolt connection status using a piezoelectric based active sensing method. Smart Mater. Struct. 2013, 22, 087001. [Google Scholar] [CrossRef]
  3. Kersemans, M.; Martens, A.; Degrieck, J.; Van Den Abeele, K.; Delrue, S.; Pyl, L.; Zastavnik, F.; Sol, H.; Van Paepegem, W. The ultrasonic polar scan for composite characterization and damage assessment: Past, present and future. Appl. Sci. 2016, 6, 58. [Google Scholar] [CrossRef]
  4. De Angelis, G.; Meo, M.; Almond, D.P. A new technique to detect defect size and depth in composite structures using digital shearography and unconstrained optimization. NDT E Int. 2012, 45, 91–96. [Google Scholar] [CrossRef]
  5. Vavilov, V.; Burleigh, D.D. Review of pulsed thermal NDT: Physical principles, theory and data processing. NDT E Int. 2015, 73, 28–52. [Google Scholar] [CrossRef]
  6. Parvasi, S.M.; Xu, C.; Kong, Q.; Song, G. Detection of multiple thin surface cracks using vibrothermography with low-power piezoceramic-based ultrasonic actuator—A numerical study with experimental verification. Smart Mater. Struct. 2016, 25, 055042. [Google Scholar] [CrossRef]
  7. Bagavathiappan, S.; Lahiri, B.B.; Saravanan, T.; Philip, J.; Jayakumar, T. Infrared thermography for condition monitoring—A review. Infrared Phys. Technol. 2013, 60, 35–55. [Google Scholar] [CrossRef]
  8. Marinetti, S.; Vavilov, V. IR thermographic detection and characterization of hidden corrosion in metals: General analysis. Corros. Sci. 2010, 52, 865–872. [Google Scholar] [CrossRef]
  9. Maldague, X. Applications of infrared thermography in non-destructive evaluation. In Trends in Optical Nondestructive Testing; Rastogi, P., Inaudi, D., Eds.; Elsevier Science: Lausanne, Switzerland, 2000; pp. 591–609. [Google Scholar]
  10. Choi, M.; Kang, K.; Park, J.; Kim, W.; Kim, K. Quantitative determination of a subsurface defect of reference specimen by lock-in infrared thermography. NDT E Int. 2008, 41, 119–124. [Google Scholar] [CrossRef]
  11. Ibarra-Castanedo, C.; Avdelidis, N.P.; Maldague, X.P. Quantitative pulsed phase thermography applied to steel plates. In Defense and Security; International Society for Optics and Photonics: Orlando, FL, USA, 2005; pp. 342–351. [Google Scholar]
  12. Sakagami, T.; Kubo, S. Applications of pulse heating thermography and lock-in thermography to quantitative nondestructive evaluations. Infrared Phys. Technol. 2002, 43, 211–218. [Google Scholar] [CrossRef]
  13. Maldague, X. Nondestructive Evaluation of Materials by Infrared Thermography; Springer: London, UK, 1993. [Google Scholar]
  14. Ludwig, N.; Teruzzi, P. Heat losses and 3D diffusion phenomena for defect sizing procedures in video pulse thermography. Infrared Phys. Technol. 2002, 43, 297–301. [Google Scholar] [CrossRef]
  15. Almond, D.P.; Lau, S.K. Defect sizing by transient thermography. I. An analytical treatment. J. Phys. D Appl. Phys. 1998, 27, 1063–1069. [Google Scholar] [CrossRef]
  16. Wysocka-Fotek, O.; Oliferuk, W.; Maj, M. Reconstruction of size and depth of simulated defects in austenitic steel plate using pulsed infrared thermography. Infrared Phys. Technol. 2012, 55, 363–367. [Google Scholar] [CrossRef]
  17. Lai, W.W.L.; Lee, K.K.; Poon, C.S. Validation of size estimation of debonds in external wall’s composite finishes via passive Infrared thermography and a gradient algorithm. Constr. Build. Mater. 2015, 87, 113–124. [Google Scholar] [CrossRef]
  18. Wysocka-Fotek, O.; Maj, M.; Oliferuk, W. Use of pulsed IR thermography for determination of size and depth of subsurface defect taking into account the shape of its cross-section area. Arch. Metall. Mater. 2015, 60, 615–620. [Google Scholar] [CrossRef]
  19. Breitenstein, O.; Altmann, F. Inversion of microscopic lock-in thermograms in the presence of emissivity contrast. NDT E Int. 2006, 39, 636–640. [Google Scholar] [CrossRef]
  20. Pickering, S.; Almond, D. Matched excitation energy comparison of the pulse and lock-in thermography NDE techniques. NDT E Int. 2008, 41, 501–509. [Google Scholar] [CrossRef]
  21. Tsanakas, J.A.; Chrysostomou, D.; Botsaris, P.N.; Gasteratos, A. Fault diagnosis of photovoltaic modules through image processing and Canny edge detection on field thermographic measurements. Int. J. Sustain. Energy 2015, 34, 351–372. [Google Scholar] [CrossRef]
  22. Dutta, T.; Sil, J.; Chottopadhyay, P. Condition monitoring of electrical equipment using thermal image processing. In Proceedings of the IEEE First International Conference on Control, Measurement and Instrumentation (CMI), Kolkata, India, 8–10 January 2016; pp. 311–315.
  23. Gao, B.; Woo, W.L.; He, Y.; Tian, G.Y. Unsupervised sparse pattern diagnostic of defects with inductive thermography imaging system. IEEE Trans. Ind. Inform. 2016, 12, 371–383. [Google Scholar] [CrossRef]
  24. Sham, F.C.; Chen, N.; Long, L. Surface crack detection by flash thermography on concrete surface. Insight-Non-Destr. Test. Cond. Monit. 2008, 50, 240–243. [Google Scholar] [CrossRef]
  25. Patel, P.M.; Lau, S.K.; Almond, D.P. A review of image analysis techniques applied in transient thermographic nondestructive testing. Nondestruct. Test. Eval. 1992, 6, 343–364. [Google Scholar] [CrossRef]
  26. Grys, S.; Vokorokos, L.; Borowik, L. Size determination of subsurface defect by active thermography-Simulation research. Infrared Phys. Technol. 2014, 62, 147–153. [Google Scholar] [CrossRef]
  27. Grys, S. Filtered thermal contrast based technique for testing of material by infrared thermography. Opto-Electron. Rev. 2011, 19, 234–241. [Google Scholar] [CrossRef]
  28. Macleod, G.; Wolfond, H. Image processing for automated flaw detection in pulsed thermography. In Proceeding of the 6th International Workshop-NDT Signal Processing, London, ON, Canada, 24–27 August 2009; pp. 1–9.
  29. Florez-Ospina, J.F.; Benitez-Restrepo, H.D. Toward automatic evaluation of defect detectability in infrared images of composites and honeycomb structures. Infrared Phys. Technol. 2015, 71, 99–112. [Google Scholar] [CrossRef]
  30. Xu, C.; Xie, J.; Chen, G.; Huang, W. An infrared thermal image processing framework based on superpixel algorithm to detect cracks on metal surface. Infrared Phys. Technol. 2014, 67, 266–272. [Google Scholar] [CrossRef]
  31. Benmoussat, M.S.; Guillaume, M.; Caulier, Y.; Spinnler, K. Automatic metal parts inspection: Use of thermographic images and anomaly detection algorithms. Infrared Phys. Technol. 2013, 61, 8–80. [Google Scholar] [CrossRef]
  32. Martin, D.R.; Fowlkes, C.C.; Malik, J. Learning to detect natural image boundaries using local brightness, color and texture cues. IEEE Trans. Pattern Anal. Mach. Intell. 2004, 26, 530–549. [Google Scholar] [CrossRef] [PubMed]
  33. Arbelaez, P.; Maire, M.; Fowlkes, C.; Malik, J. Contour detection and hierarchical image segmentation. IEEE Trans. Pattern Anal. Mach. Intell. 2011, 33, 898–916. [Google Scholar] [CrossRef] [PubMed]
  34. Otsu, N. A threshold selection method from gray-level histograms. Automatica 1975, 11, 23–27. [Google Scholar] [CrossRef]
  35. Neubeck, A.; Van Gool, L. Efficient non-maximum suppression. In Proceedings of the 18th International Conference on Pattern Recognition (ICPR 2006), Hong Kong, China, 20–24 August 2006; pp. 850–855.
Figure 1. Flowchart of the proposed approach.
Applsci 06 00389 g001
Figure 2. Calculation of the oriented gradient of histograms: (a) a patch of a thermogram; (b) histogram of the upper half-disc; (c) histogram of the lower half-disc; (d) oriented gradient map after non-maximum suppression (NMS) processing.
Applsci 06 00389 g002
Figure 3. Photograph of the experimental setup.
Applsci 06 00389 g003
Figure 4. Details of the specimen.
Applsci 06 00389 g004
Figure 5. Raw thermogram and preprocessed thermogram: (a) raw thermogram captured at 5.6 s after the beginning of heating with testing direction of 0°; (b) preprocessed thermogram through gray level transformation and the region of interest (ROI) extraction; (c) amplified display of the right column defects.
Applsci 06 00389 g005
Figure 6. Intensity profile along the investigated line shown in Figure 5b and estimated sizes by full width at half maximum (FWHM).
Applsci 06 00389 g006
Figure 7. Intermediate result and contour detection result: (a) denoised image; (b) prominent gradient map; (c) sizing result of the proposed approach (inverse displayed for clarity); (d) sizing result of the Canny operator (inverse displayed for clarity).
Applsci 06 00389 g007
Figure 8. Raw thermogram and contour detection result: (a) Raw thermogram with maximum contrast for the lowest observable defect with testing directions of 90°, 180°, and 270° (from top to bottom). (b) Contour detection result of the proposed approach (inverse displayed for clarity).
Applsci 06 00389 g008
Table 1. Performance comparisons of sizing methods.
MethodsSizing Error (mm)
D1D2D3D4D5D6D7D8D9
Canny operator4.61.73.23.22.83.23.23.23.2
FWHM0.30.30.33.31.24.72.61.75.6
Proposed approach0.20.20.21.71.30.20.20.20.2
Table 2. Estimated defect sizes.
DefectDefect Diameter (mm)Estimated Size by the Proposed Approach (mm)
Testing Direction Mean Error
90°180°270°
D11514.815.215.215.20.1
D214.815.215.216.70.5
D314.815.215.216.70.5
D413.315.215.215.20.3
D516.316.716.816.71.6
D614.813.713.715.20.7
D714.816.715.213.60.1
D814.815.215.215.20.1
D914.816.715.216.70.9

