1. Introduction
Placement of endovascular stent has become a preferred option for treatment of acute aorta dissection and aortosclerosis, because it can reduce the risk of infection and patient trauma [
1]. Stent placement can replace conventional medical treatment for the majority of patients. During the procedures, surgeons insert a catheter into aortic lesions to finish the placement of stent. However, incorrect placement of the stent can cause delayed complications. There are two critical factors which directly influence the accuracy of stent deployment: (1) information on morphological characteristics of the aorta, especially calcification or lesion areas, which can greatly assist surgeons to determine the size of stent [
2]; (2) intuitive three-dimensional (3D) navigation images which can reflect intraoperative information of cardiac structure [
3].
Conventional stent placement, which is typically performed under X-ray, remains challenging, due to several shortcomings of fluoroscopic guidance. Firstly, repeated radiations influence the health of patients and clinical staff. Contrast agents probably increase the risk of iatrogenic renal injury for patients. Secondly, although fluoroscopy can visualize the catheter excellently, fluoroscopy lacks depth perception and cannot directly visualize anatomic structures [
4]. Thirdly, 2D (two-dimensional) fluoroscopy images cannot provide a quantitative analysis of the vessel’s morphological characteristics [
5]. To solve these problems, realizing 3D intuitive image navigation is useful for catheter intervention and stent placement.
Several solutions have been proposed for performing 3D navigation imaging. Some authors have suggested using other 3D imaging modalities as alternatives to fluoroscopy. For example, intraoperative magnetic resonance (MR) and computed tomography (CT) imaging technologies [
6,
7] have been applied, but their usage is very limited because of relatively low temporal resolution and inflexibility in the workflow. Another approach is the transfer of preoperative CT volume into the intraoperative environment by fusing CT with fluoroscopy. Göksu et al
. have used feature-based rigid registration to combine 3D preoperative CT with intraoperative 2D fluoroscopy for endovascular navigation [
8]. Although this approach may potentially provide 3D information, it still exposes the interventionist and patient to harmful radiation.
To solve the above problem, some researches proposed using electromagnetic (EM) tracking rather than relying on X-ray for navigation, because EM tracking can collect 3D position information by assembling an EM sensor on the catheter. Manstad-Hulaas et al
. [
9] use EM approaches to track catheter position and overlay the position onto previously acquired CT or MR data during the procedures. Wang et al
. propose combining EM technologies with virtual visual feedback for surgical navigation [
10]. Ramcharitar et al. also present a navigation method by combining multi-slice CT with EM navigation for endovascular intervention [
11]. These studies achieve the overlay between catheter tip and preoperative images, but cannot detect movements of soft tissue during the surgery.
In addition, some non-ionizing radiation imaging methods have been used for radiation-free navigation. Real-time ultrasound (US) images may assist endovascular intervention and navigation. For example, an US-based catheter localization method [
12] and a guidance technology based on US image registration [
13] have been proposed for the minimally invasive endovascular surgical navigation. Furthermore, Luan et al
. propose a visualization navigation system that integrates US imaging with preoperative anatomical models for catheter intervention of oral cancers [
14]. McLeod et al
. make use of biplane US to guide trans-catheter aortic valve implantation deployment in a phantom study [
15]. However, it is difficult that a single cardiac US image provides sufficient information for doctors. This is because in endovascular navigation, single US images cannot provide a 3D context of the surgical site and high-resolution morphological information of the aorta. Intravascular ultrasound (IVUS) is an attractive complement for common US or preoperative CT images, because IVUS obtains 2D images of the cross-sections of the blood vessels, providing information on vessel morphology for diagnosis and surgery [
16]. IVUS imaging is more accurate than conventional angiography because of the relatively higher resolution [
17]. Therefore, the approach proposed in this paper is to combine IVUS images with common US images in order to implement a radiation-free 3D guidance system for transcatheter aortic stent deployment. The work described here expands on our previous study [
18]. The major limitations of our previous study are that: (1) the accuracies of catheter tracking and IVUS segmentation need to be improved; (2) the verification experiments of US navigation method with global and local information need to be increased. To solve these limitations, the new system not only integrates more accurate methods of tracking and segmentation into previous system but also presents more evaluations experiments and better results.
2. Materials and Methods
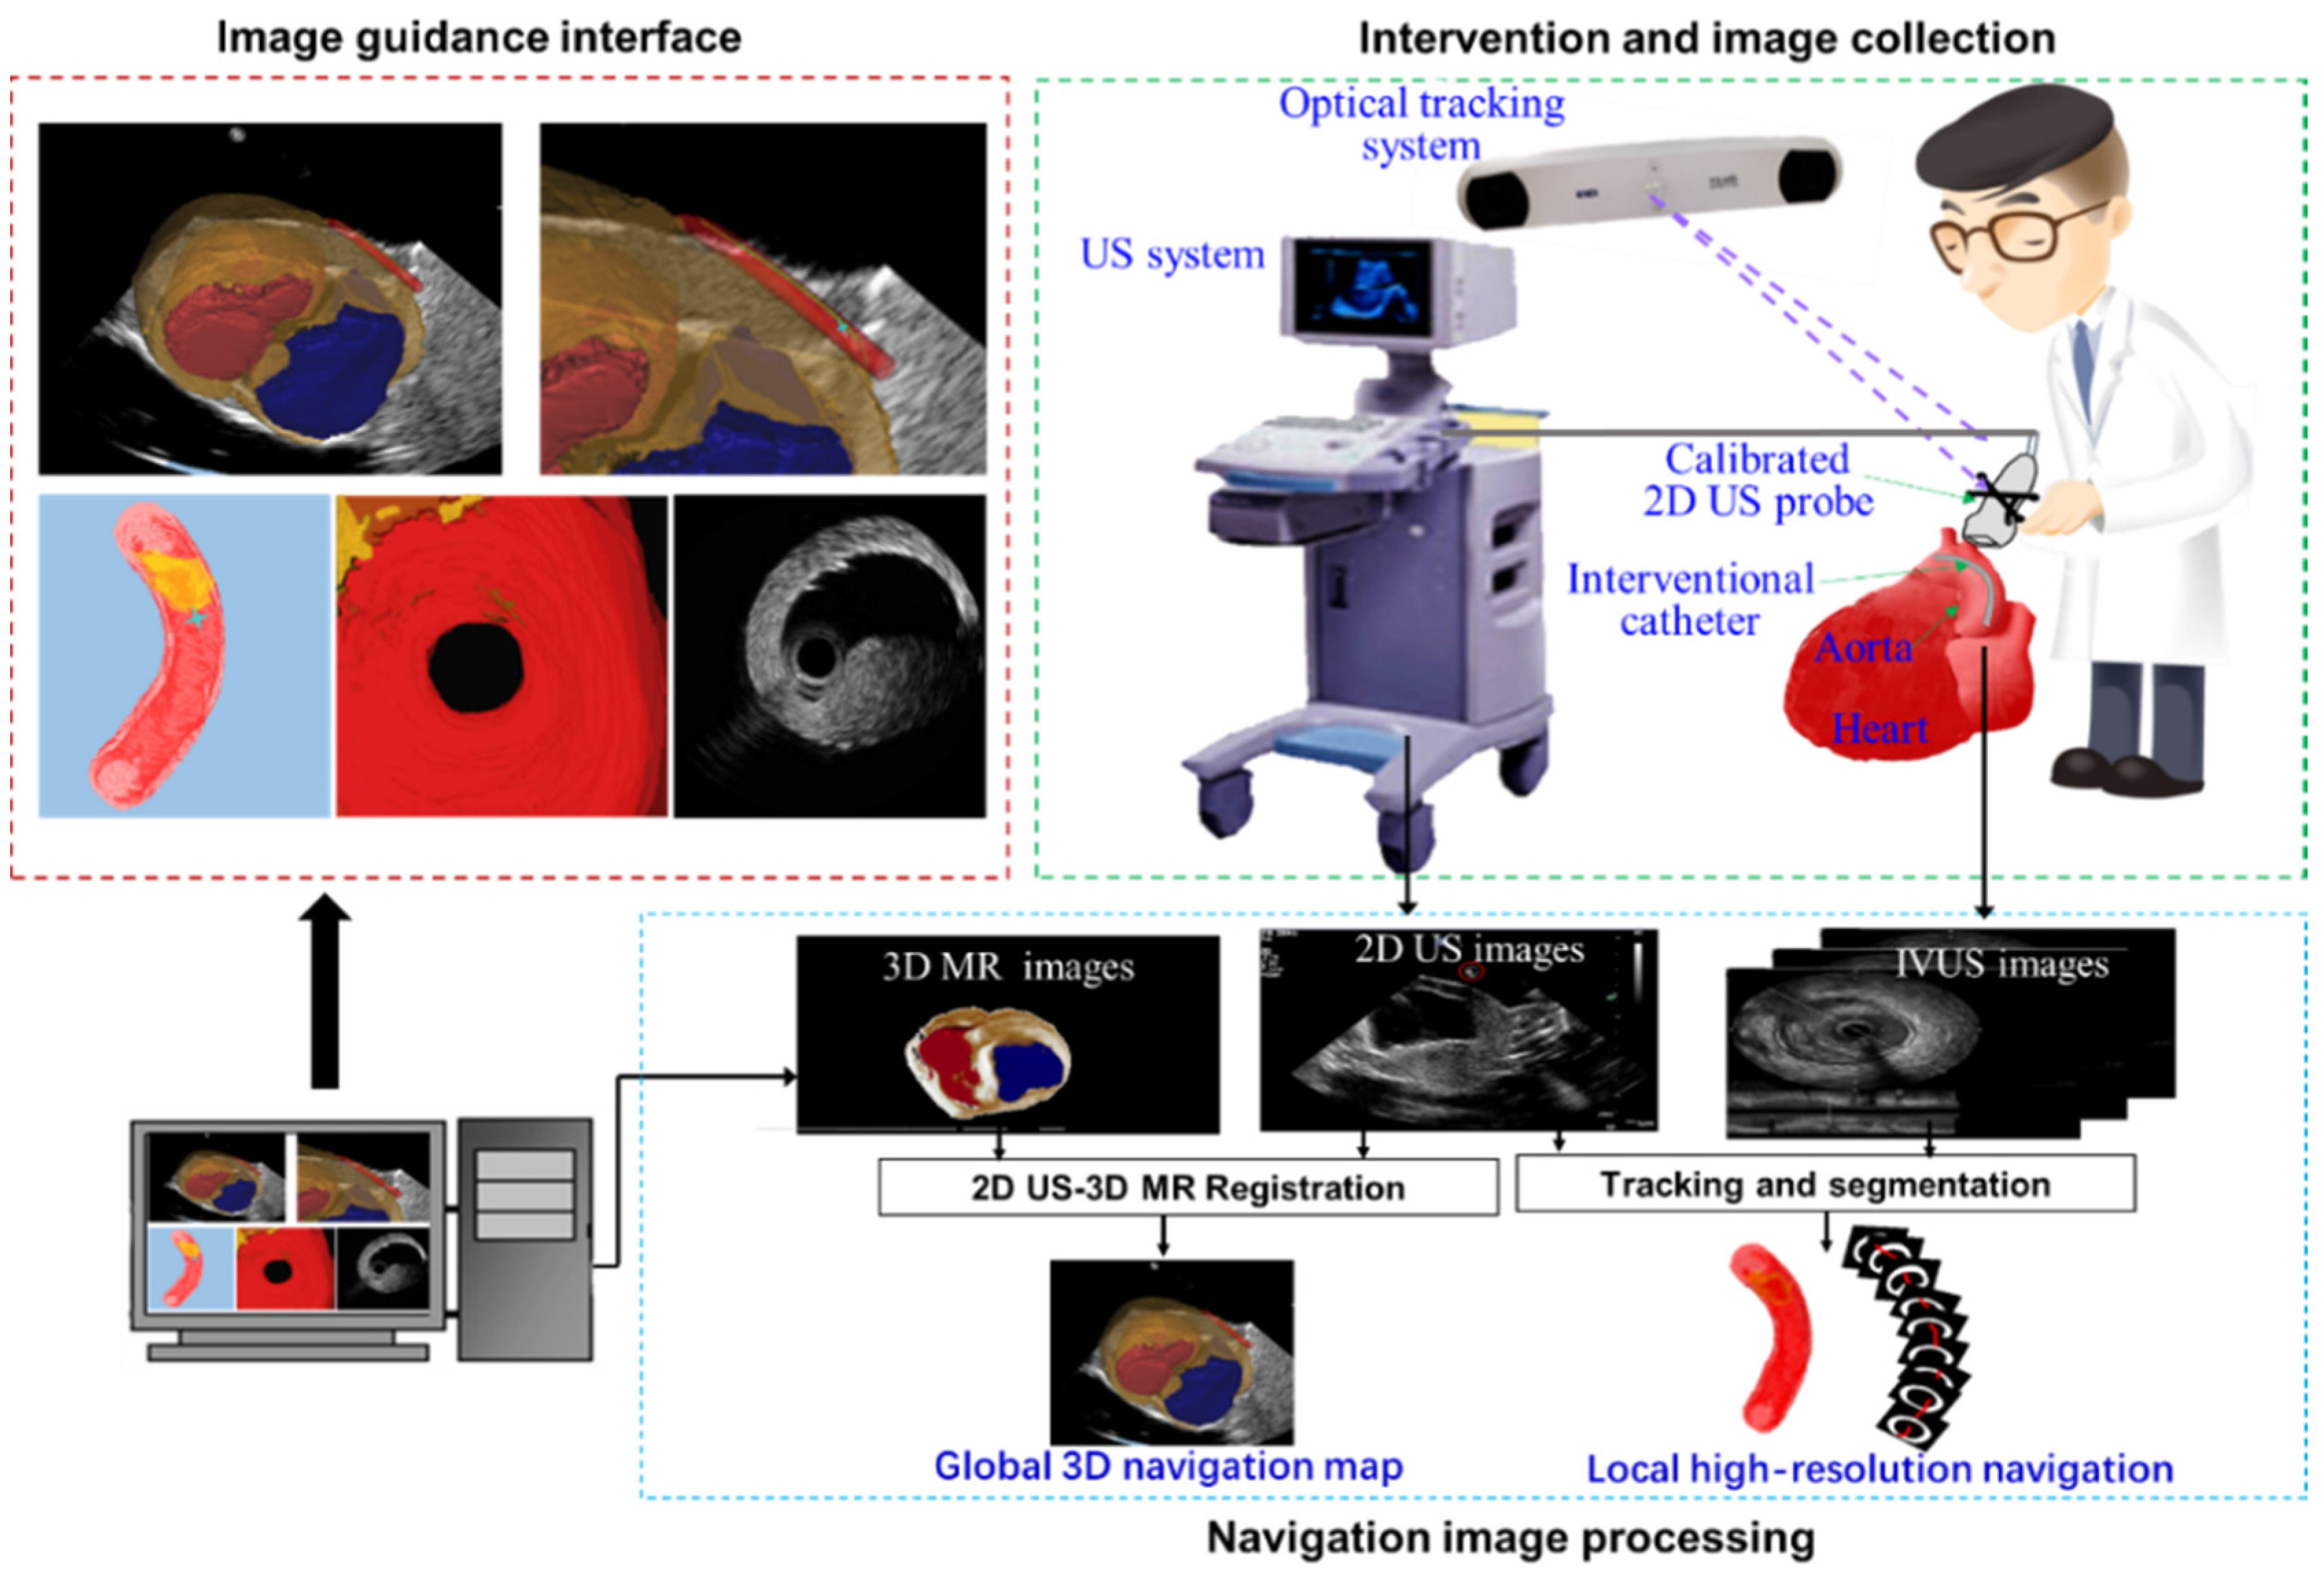
The configuration of our US navigation system is shown in
Figure 1. During the surgical intervention, an US device, an optical tracking system and a catheter are used. Firstly, the tracking system collects the pose of US probes (S5-1, Philips, Amsterdam, The Netherlands). IVUS scanning probe (Atlantis SR, Boston Scientific, Marlborough, MA, USA) and stent are inserted into the aortic lesion through a catheter (Atlantis SR, Boston Scientific, Marlborough, MA, USA). Next, the collected intraoperative US images, IVUS images and preoperative 3D MR images are combined during the image processing procedure. This procedure mainly includes two parts: (1) 2D US-3D MR registration for a 3D intuitive global navigation map; (2) combining segmented IVUS images with the trajectory of the catheter from US images to finish local high-resolution navigation information. Finally, the global and local navigation images help surgeons to finish accurate transcatheter aortic stent deployment.
2.1. A Global 3D Navigation Map Based on 2D US-3D MR Image Registration
A global 3D navigation map is presented which integrates 2D US images with a high-quality 3D context from MR images through 2D US-3D MR image registration. We apply a preoperative 3D US image to simplify the 2D US-3D MR image registration into two easily achieved steps: 2D US-3D US intra-modal registration and 3D US-3D MR intra-dimensional registration. The rigid registration transformation
between 2D US and 3D MR images is calculated by
, where
is the transformation between intra-modal 2D and 3D US images, and
is the transformation between intra-dimension 3D US and MR images.
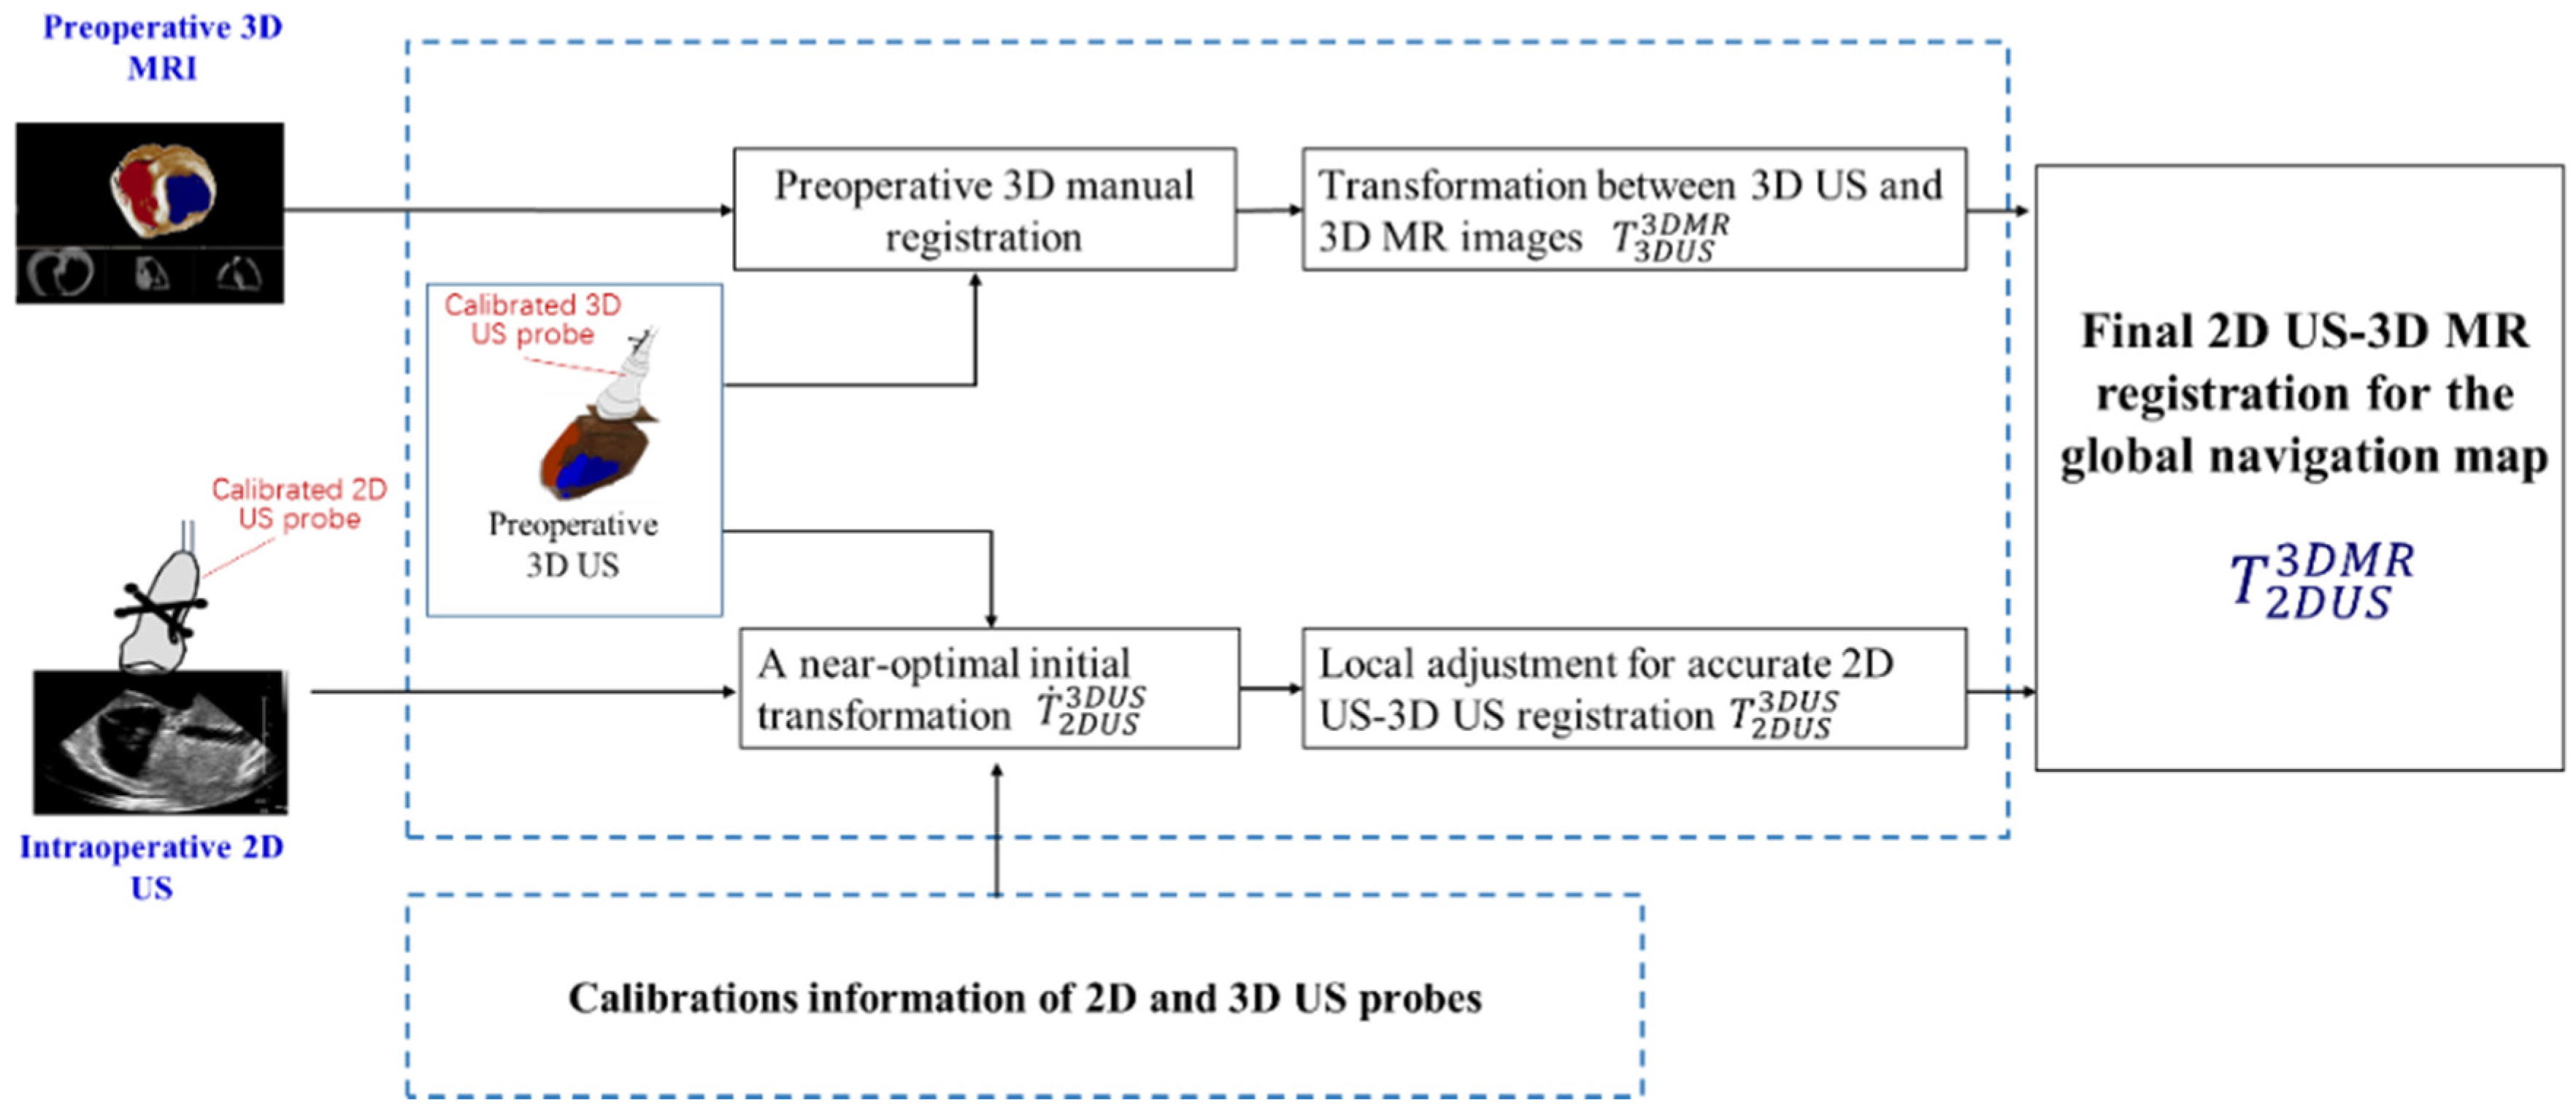
Figure 2 shows the workflow of 2D US-3D MR image registration. In the intraoperative preparatory stage, we employ a calibrated 3D US probe to collect a 3D US image of the heart. The 3D US-3D MR intra-dimension registration transformation
is acquired manually by using an open source platform (3D slicer) (
http://www.slicer.org). Next, crucial 2D US-3D US intra-modal registration
is achieved automatically by the following steps.
Firstly, an N-wire calibration phantom is realized for calibration of the 2D US probe and to acquire the transformation
between 2D US image coordinate and tracking system (TS) coordinate. Similarly, an IXI-wire calibration phantom is utilized for calibration of the 3D US probe and to solve the transformation
between the 3D US image coordinate and the TS coordinate. The near-optimal initial transformation
can be calculated by
Secondly, with the acquired near-optimal initial transformation
, fast automatic intensity-based local adjustment is employed for accurate registration. In the local adjustment, mutual information (MI) is utilized as a similarity metric. Gradient ascent optimizer is used to find optimum value of the MI metric and final rigid transformation
. More detailed descriptions about calibrations of probes and image registration can be found in our previous work [
19].
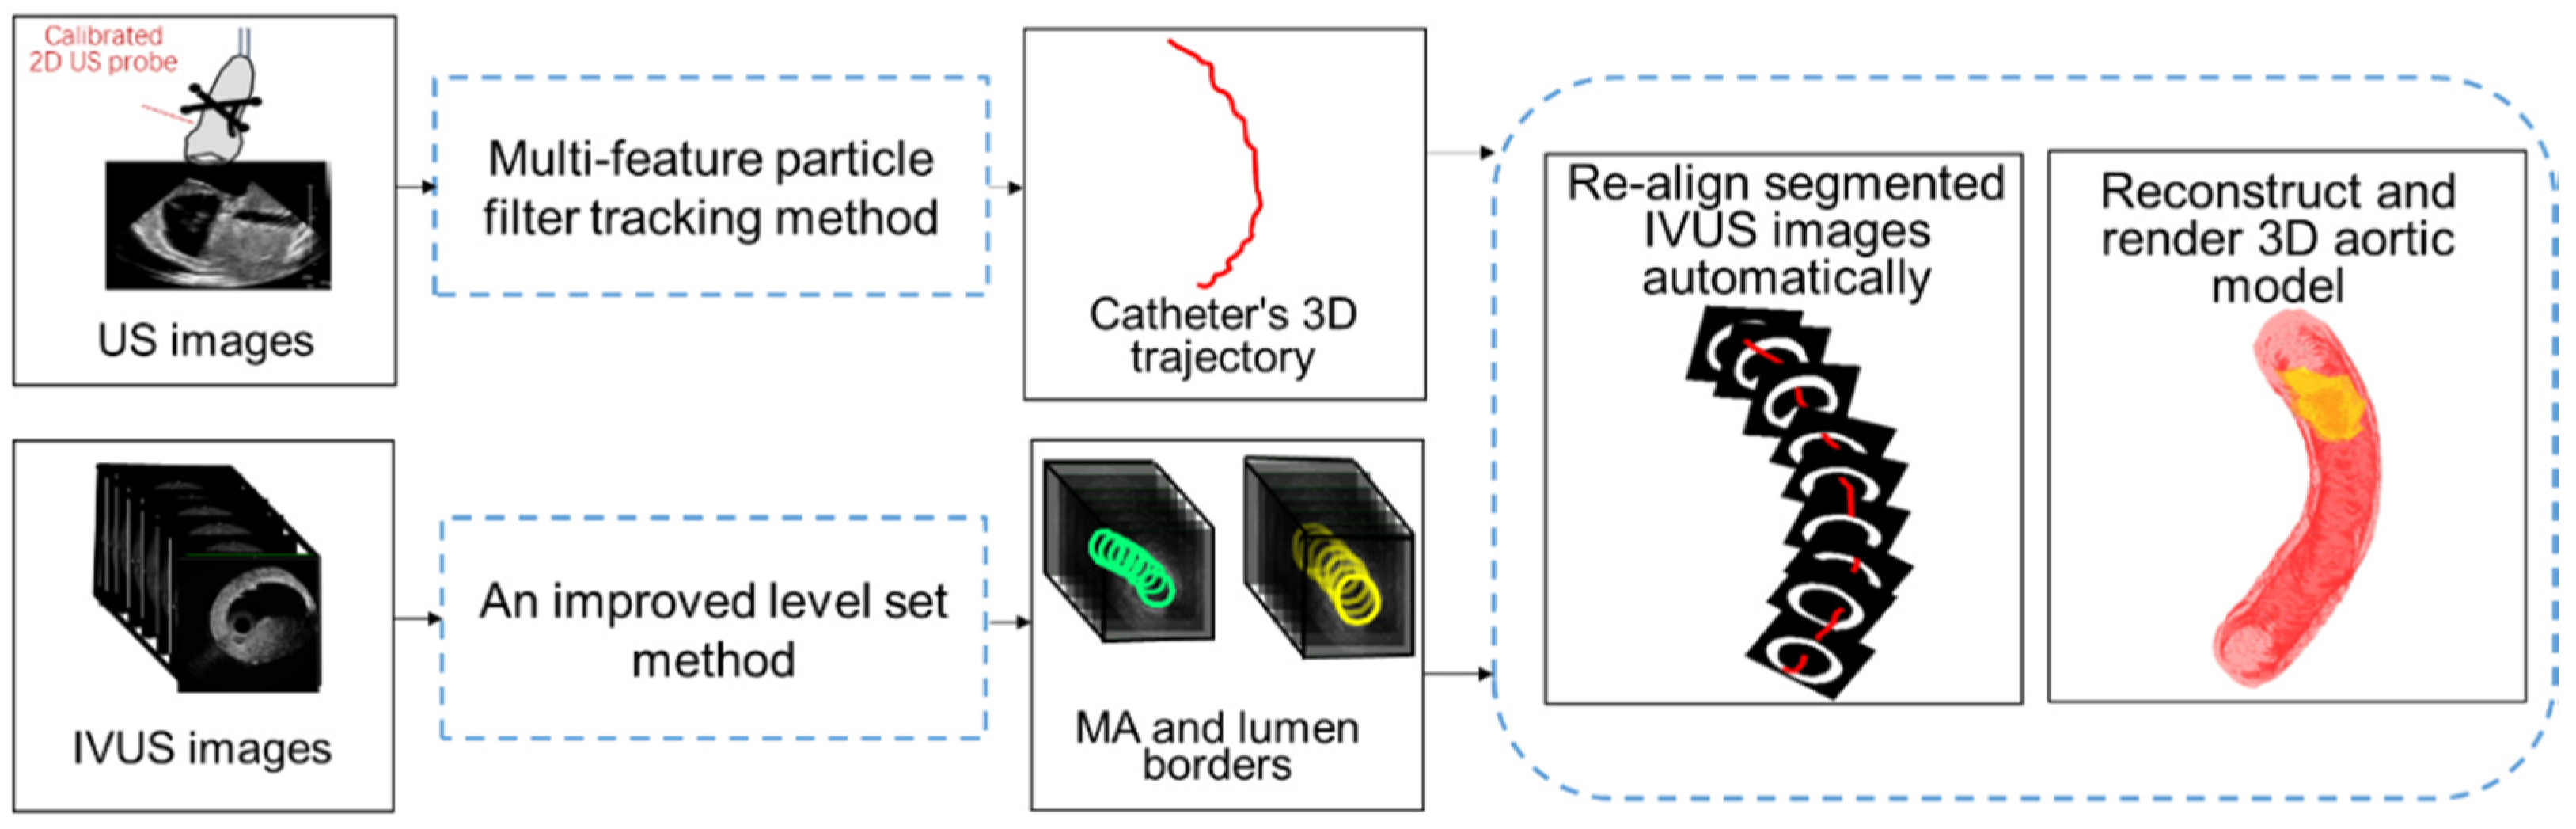
2.2. Local High-Resolution Navigation Information Based on US Images Tracking and IVUS Image Segmentation
The calibrated 2D US probe collects a series of 2D US images and these 2D US images contain not only the intraoperative structure of heart but also the information of the catheter. On the one hand, these 2D US images are registered with 3D MR to finish a global 3D navigation map. On the other hand, we locate the tip of the catheter in these 2D US images and acquire the trajectory of catheter (for details, see
Section 2.2.1). The IVUS probe is embedded in the interventional catheter and collects IVUS images with almost constant velocity (0.5 mm/s). The IVUS images contain the information of complex lesions, such as plaque, aneurysms, etc. By using IVUS images segmentation (for details, see
Section 2.2.2), vascular borders (media-adventitia (MA) and lumen borders) and location information of the lesion are extracted. Finally, the segmented IVUS images are re-aligned to acquire a high-resolution aortic model for endovascular intervention guidance. To re-align segmented IVUS images, we use the pose determination method of IVUS images proposed by Ma et al. [
20]. As for the locations of IVUS images, due to constant velocity of image collection, the centers of segmented IVUS images are distributed at equidistant intervals on the acquired 3D catheter trajectory. In addition, as for the distribution angles of IVUS images, image planes are positioned perpendicular to the catheter trajectory. In this way, the spatial pose of each segmented IVUS image along catheter trajectory is determined and a 3D aortic model is reconstructed and rendered. The workflow of local navigation information based on US images tracking and IVUS images segmentation is shown in
Figure 3.
2.2.1. Multi-Feature Particle Filter Tracking Method for the 3D Trajectory of the Catheter
The calibrated 2D US probe scans the aortic phantom in consecutive cross-sections and results in a series of axis cross-sections of aorta. At the beginning of tracking, an initial tracking region on the first US image is manually delineated. The delineated region is described as a circle because the outline of aortic cross-section is circular. In addition, because the fixed radius of the aortic phantom is 4.5000 mm and the resolution of 2D US image is 0.2382 mm/pixel, the radius of initial circle tracking region is set as 19 pixels. The cross-sections of the catheter are contained in aortic cross-sections. The intensity of the catheter’s cross-section is much higher than for the other region inside the aortic cross-section. Therefore, once the aortic cross-section is tracked in US images, the position of the cross-section of the catheter can be acquired by using a threshold (in our application, the threshold value is set as 220 on a 256 step scale). The tip of interventional catheter is located in the last US image frame where the catheter’s cross-section can be detected. Then the positions of catheter’s tip in 2D US images are transformed to the optical tracking system by using transformation . The 3D location points of the tip of the catheter in the optical tracking system are connected into a curve, which is the 3D trajectory.
As a key step, tracking aortic cross-sections in 2D US images is difficult because there are various noises in US images. Particle filter method provides a robust predicting and tracking framework, because it approximates the object position with a finite set of weighted samples (or particles). Conventional particle filter method [
21] uses a single intensity feature to calculate the weight of particle. To achieve more stable tracking of aortic cross-section in US images, we propose a multi-feature particle filter tracking algorithm as follows:
| Algorithm 1: Multi-feature particle filter for tracking of aortic cross-section in real-time US (ultrasound) images |
| Input: US scanning images |
| Output: Tracked cross-sections of aorta |
(a) Initialization: (t = 0)1: Generate initial target position ( denotes the center of aortic cross-section in US image ). 2: Scatter initial particles (M is the number of particles) (, is zero mean Gaussian random variables).
|
(b) Particle state propagate:1: Calculate new particle set according to state propagation model and (State propagation model is random drift model , where is the Gaussian white noise). 2: Acquire region of the particles (circle regions centered on position of the particles ) and template region (a circle region centered on the target position ).
|
(c) Particle weight decision:1: Calculate particle weight by comparing differences in features between template region and region of the particles , (); ( denotes the process of multi-feature fusion for particles’ weights decision and it is described in detail in Appendix)
|
| (d) State estimation output: |
(e) Resampling step:Re-sample M particles from according to their weight , and obtain a new particle set , particle’s weight is .
|
| Let and iterate to step (b) |
2.2.2. An Improved Level Set Method for IVUS Images Segmentation
IVUS segmentation and border detection can provide accurate vascular structure and lesion location for endovascular local navigation [
22]. Thus, vascular modeling based on segmented IVUS images is useful in guiding stent deployment and assessing the efficacy of catheter interventions [
23]. We develop an improved level set method to detect MA and lumen borders in IVUS images [
24]. Level set function evolves from initialization
to final borders under the influence of curve force and image force [
25]. Appropriate initialization will obtain accurate segmentation. Therefore, we propose an appropriate initialization
determination method through features classification.
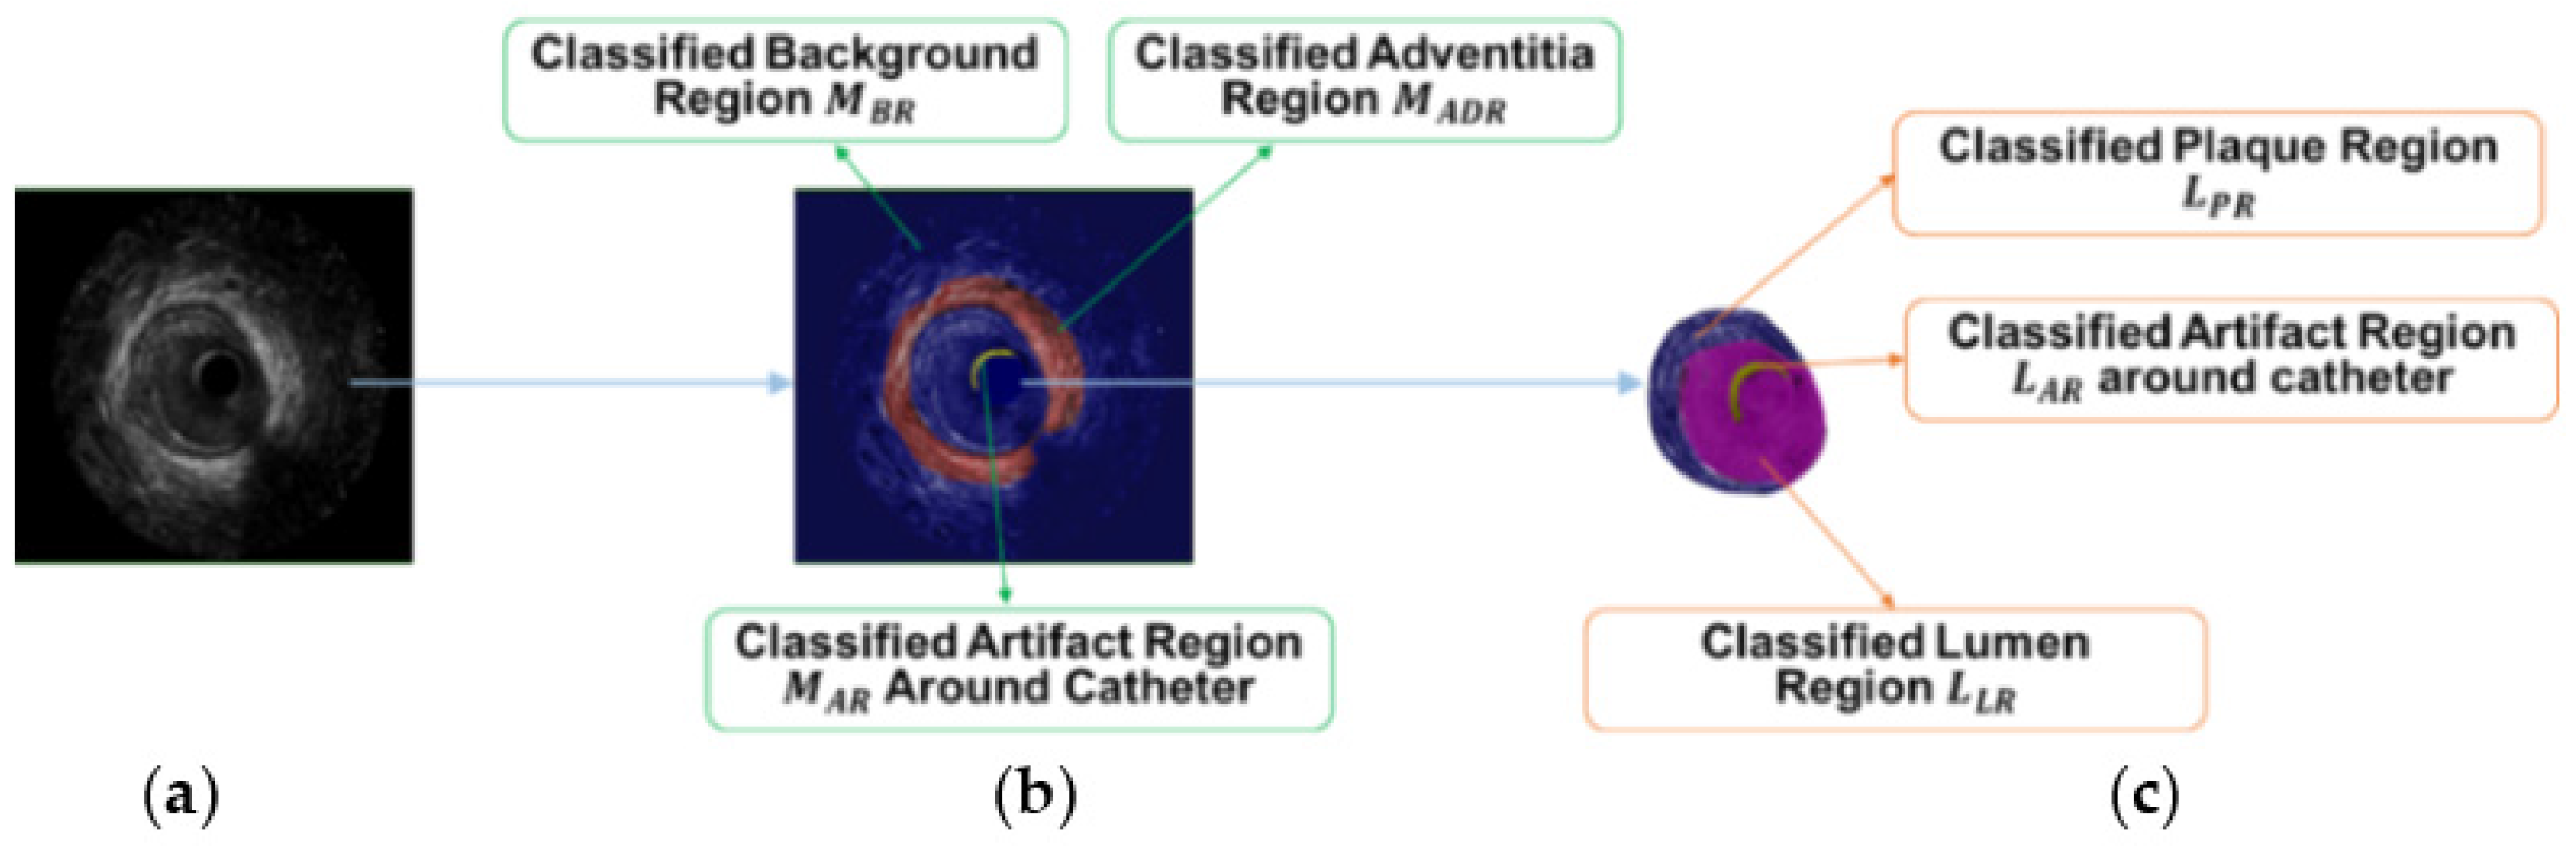
Firstly, Laws’ texture energy measure [
26] is applied to represent the features of the pixels in IVUS images. Secondly, support vector machine (SVM)-based feature classification [
27] is applied to regionalize IVUS images and provides a rough target area
for the following appropriate initialization
. For MA border detection, pixels in the first IVUS image of the sequence are the training data. For lumen border detection, pixels inside vessel region of the first image are the training data. SVM classification models are acquired through the training data. By testing other IVUS images, image regionalization results are calculated during MA border detection (
Figure 4b). Similarly, regionalization results are also acquired during lumen border detection (
Figure 4c).
Thirdly, searching-eliminating-interpolating technology is applied to process the rough target area
and acquire appropriate initialization
. Image regionalization results of
(adventitia region) and
(the union of lumen region and artifact region) are rough target areas for MA and lumen border initializations, respectively. The searching step is implemented to search for the contour point of interest
and the eliminating step can remove improper points of
in the process. The final interpolating step is used to acquire smooth initialization
. More detailed descriptions about IVUS segmentation can be found in paper [
24].
2.3. US Navigation System for Transcatheter Aortic Stent Deployment Using Global and Local Information
The surgical workflow of proposed the US navigation system for transcatheter aortic stent deployment contains three stages: preoperative preparatory, intraoperative preparatory and intraoperative navigation.
● Preoperative preparatory
- (1)
Collecting preoperative MR images of patient’s heart.
- (2)
Segmenting the heart and aorta from preoperative MR images via open source platform.
- (3)
Finishing path planning in segmented phantoms of heart and aorta.
● Intraoperative preparatory
- (1)
Using a calibrated 3D US probe to collect a 3D US image only once.
- (2)
Preparing catheter and stent for aortic stent deployment.
● Intraoperative navigation
- (1)
During insertion of the stent and IVUS probe into aorta through a catheter, a calibrated 2D US probe is implemented to collect the real-time 2D intraoperative US images, and an IVUS probe is used to collect IVUS images.
- (2)
US navigation system displays a 3D global navigation map to users. In this map there are 3D cardiac MR images of the patient, along with an US image plane providing an updated interior view of the aorta. Position information of inserted catheter is overlaid on this 3D image.
- (3)
When the inserted catheter approaches the lesion of aorta, users need to focus on the local navigation information. With local navigation, users obtain more accurate distance information between lesion and inserted catheter. When the distance is close to zero, the catheter is opened to release the stent.
- (4)
In this process, local information including virtual visual images of endovascular view and collected IVUS image is also displayed. This navigation information can also help the surgeon judge the severity of lesion.
3. Experiments and Results
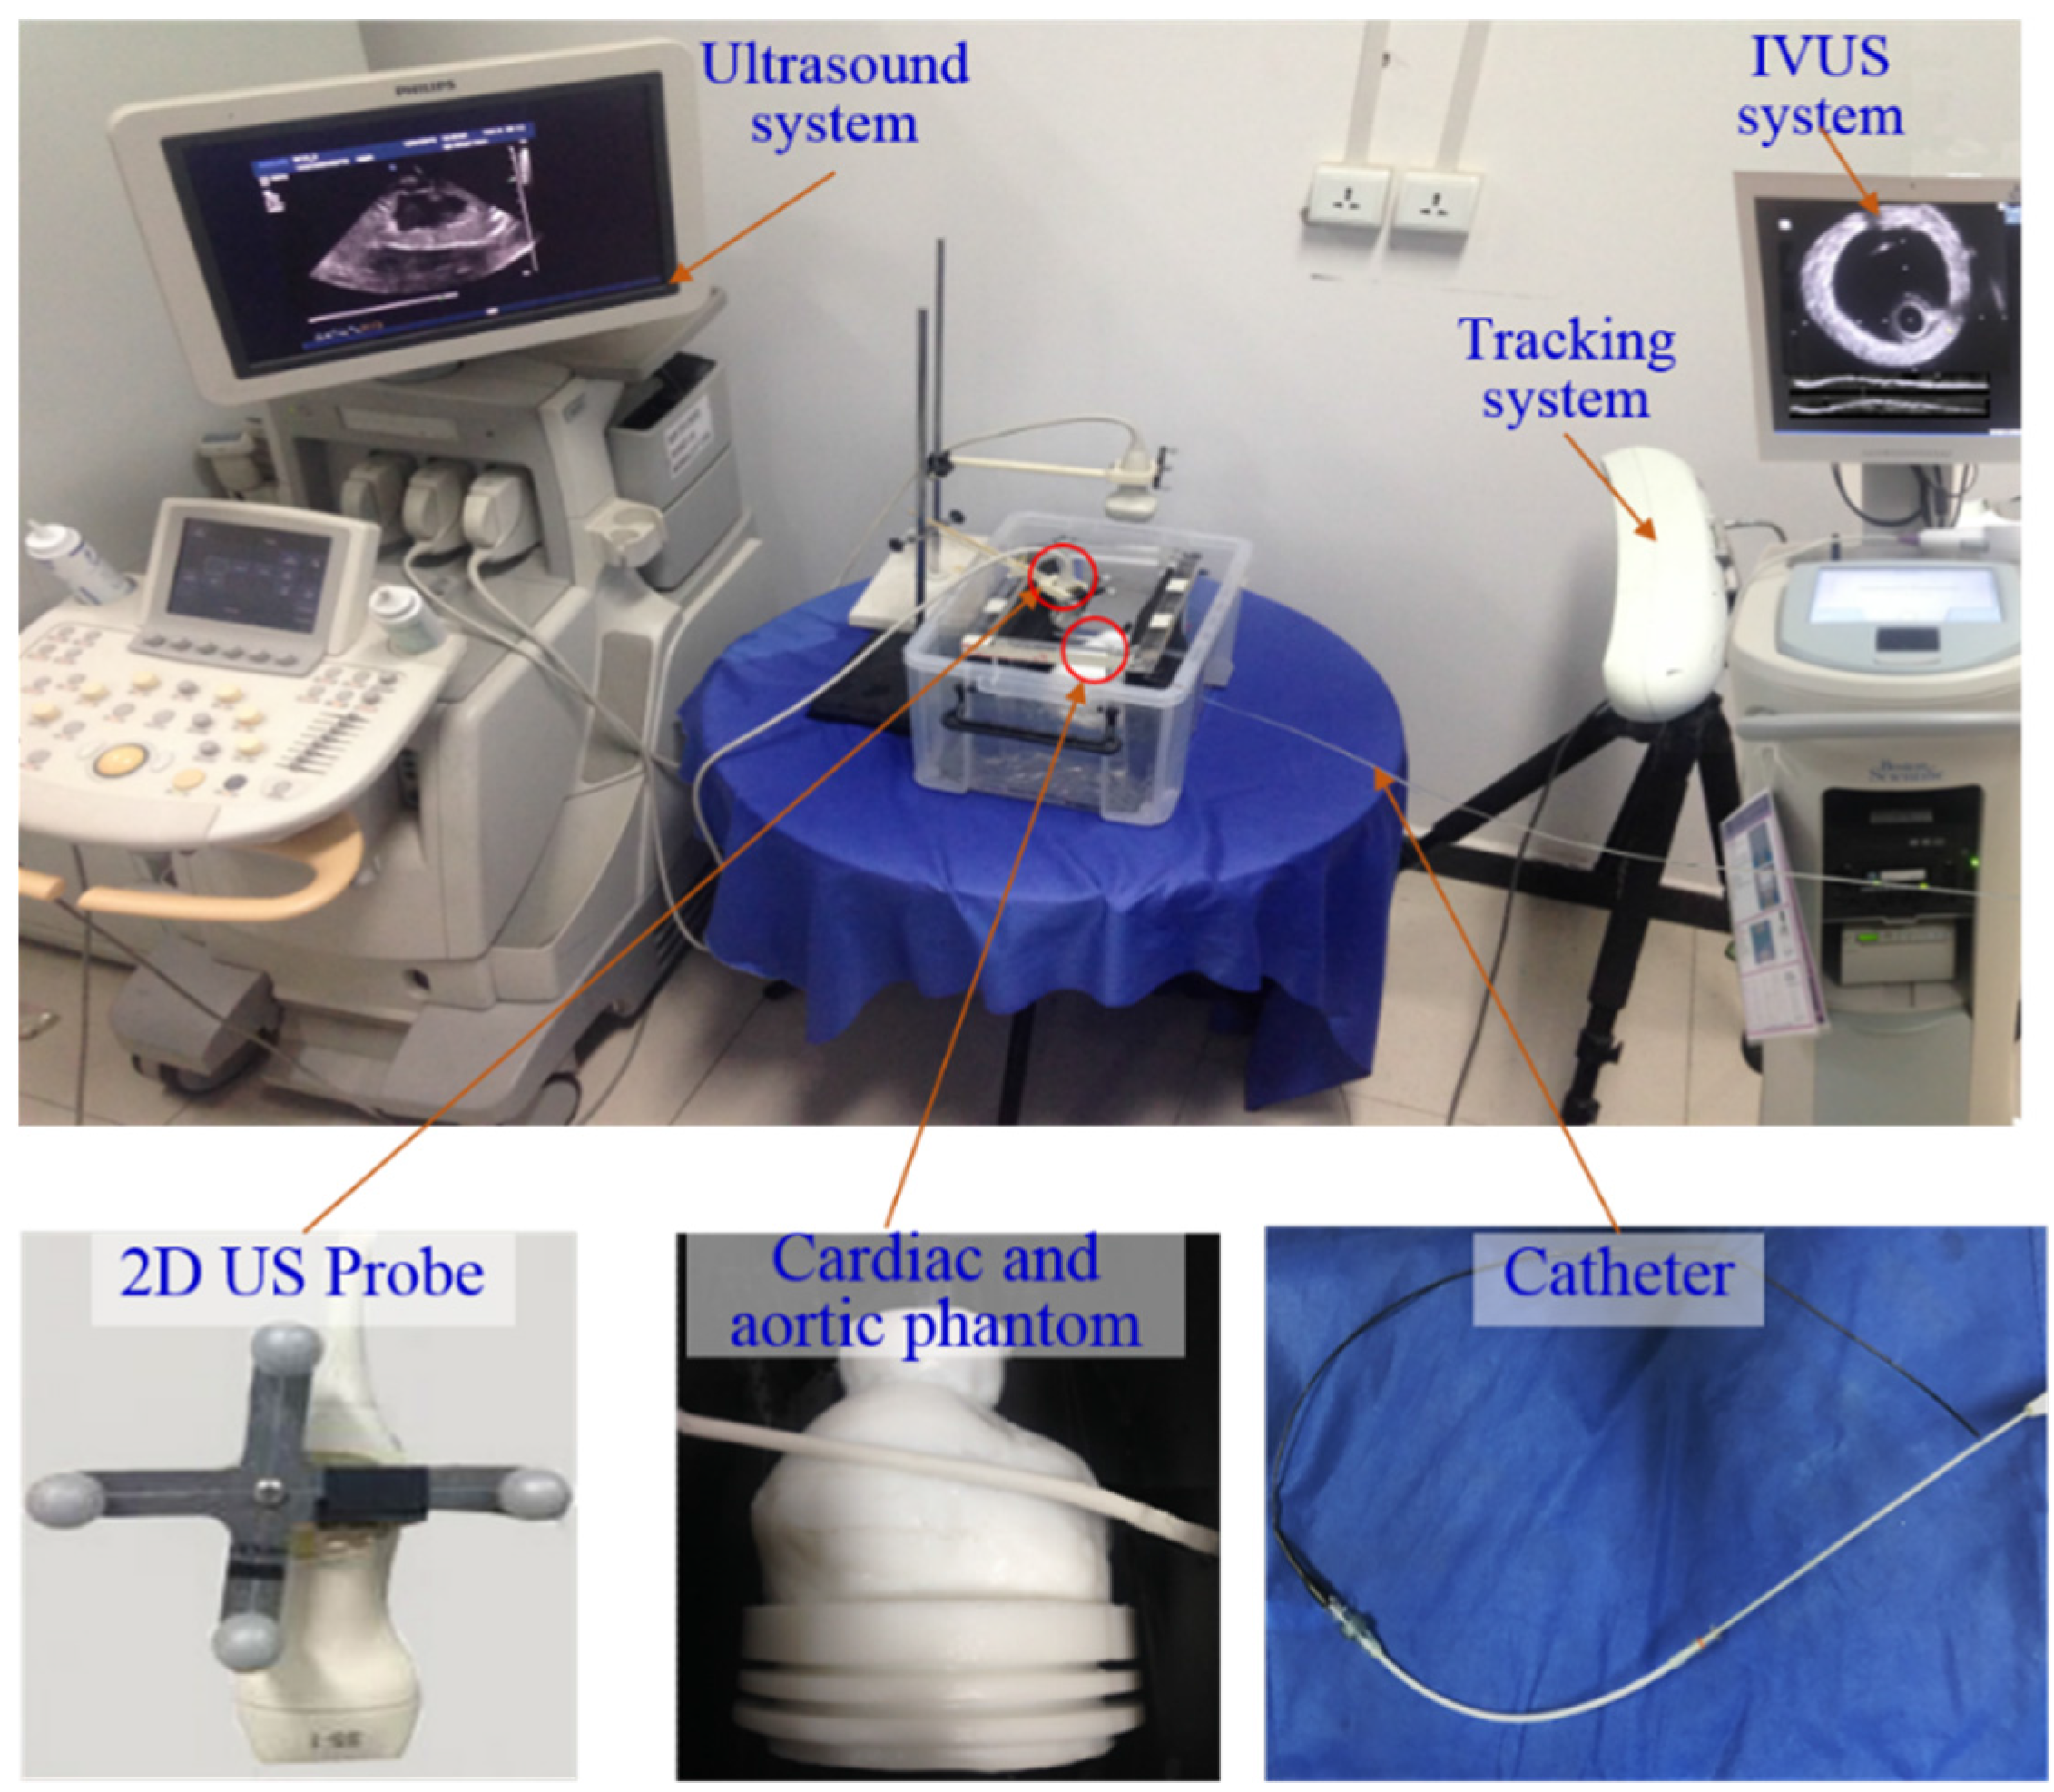
Our experiment platform (as shown in
Figure 5) includes the following components. (1) an optical tracking system (Polaris, Northern Digital Inc., Waterloo, ON, Canada) to collect the pose information of US probes; (2) an MR compatible multimodality heart phantom (SHELLEY Medical, London, ON, Canada), which contains a left ventricle (LV) and a right ventricle (RV). An aortic phantom with fixed radius (outer radius: 4.5000 mm; inner radius: 3.5000 mm) is right above the heart phantom; (3) an US system (iU22 xMATRIX, Philips, Amsterdam, The Netherlands) with a 2D linear array probe (S5-1, Philips, Amsterdam, The Netherlands). The size of 2D US images is 600 × 800 pixels with resolution 0.2382 mm × 0.2382 mm; (4) an IVUS system (Boston Scientific Galaxy 2 system, Marlborough, MA, USA) with a 40 MHz Atlantis SR IVUS probe. The collected IVUS images are 8-bits, 512 × 512 with in-frame resolution 0.0175 mm× 0.0175 mm; (5) a 7.5-F diameter catheter (Blazer, Boston Scientic, Marlborough, MA, USA). The IVUS probe and stent are inserted into aortic phantom along with the catheter; (6) preoperative 3D MR images of phantom which are collected with a MR scanner (Philips Achieva 3.0T TX, Amsterdam, The Netherlands). The size of the MR images is 480 × 480 × 300 voxels with resolution 0.4871 mm × 0.4871 mm and slice thickness 1.6000 mm; (7) the image processing technologies in our navigation system are developed using mixed program based on C++ and Matlab (Matlab2014a, MathWorks, Natick, MA, USA). The navigation system runs under Windows 7, on an Intel Core i7 computer with 16 GB RAM (Random Access Memory).
The navigation system contains two key parts including the acquirement of global navigation map based on 2D US-3D MR image registration, and local high-resolution navigation information based on US images tracking and IVUS image segmentation. A set of experiments was conducted to evaluate these two parts (
Section 3.1 and
Section 3.2). In particular, many image-processing methods applied in these two parts were evaluated individually. After the analyses of these two key parts, an in vitro experiment of catheter intervention (
Section 3.3) was conducted to confirm that the integration of global and local information is significant.
3.1. Evaluation of the Global 3D Navigation Map
The global 3D navigation map is based on 2D US-3D MR image registration. And the proposed 2D US-3D MR images registration method relies on effective calibration results of 2D and 3D US probes. Therefore, the evaluation of global navigation map contains the verification of probe calibrations and assessment of 2D US-3D MR image registration.
3.1.1. Calibrations of 2D and 3D US Probes
Calibration reproducibility (CR) error measures repeatability of a probe calibration method when it is performed on a new set of images [
28]. CR error is the Euclidian distance between two calibration transformations (
and
) of the same US image point
. CR error is usually calculated by
During the evaluations of 2D and 3D US probe calibrations, we performed 8 calibration trials and used 10 images per trial, 80 datasets in total. The acquired CR error of the 2D US probe’s calibration is 0.61 mm and the CR error of 3D US probe’s calibration is 1.42 mm.
3.1.2. 2D US-3D MR Images Registration
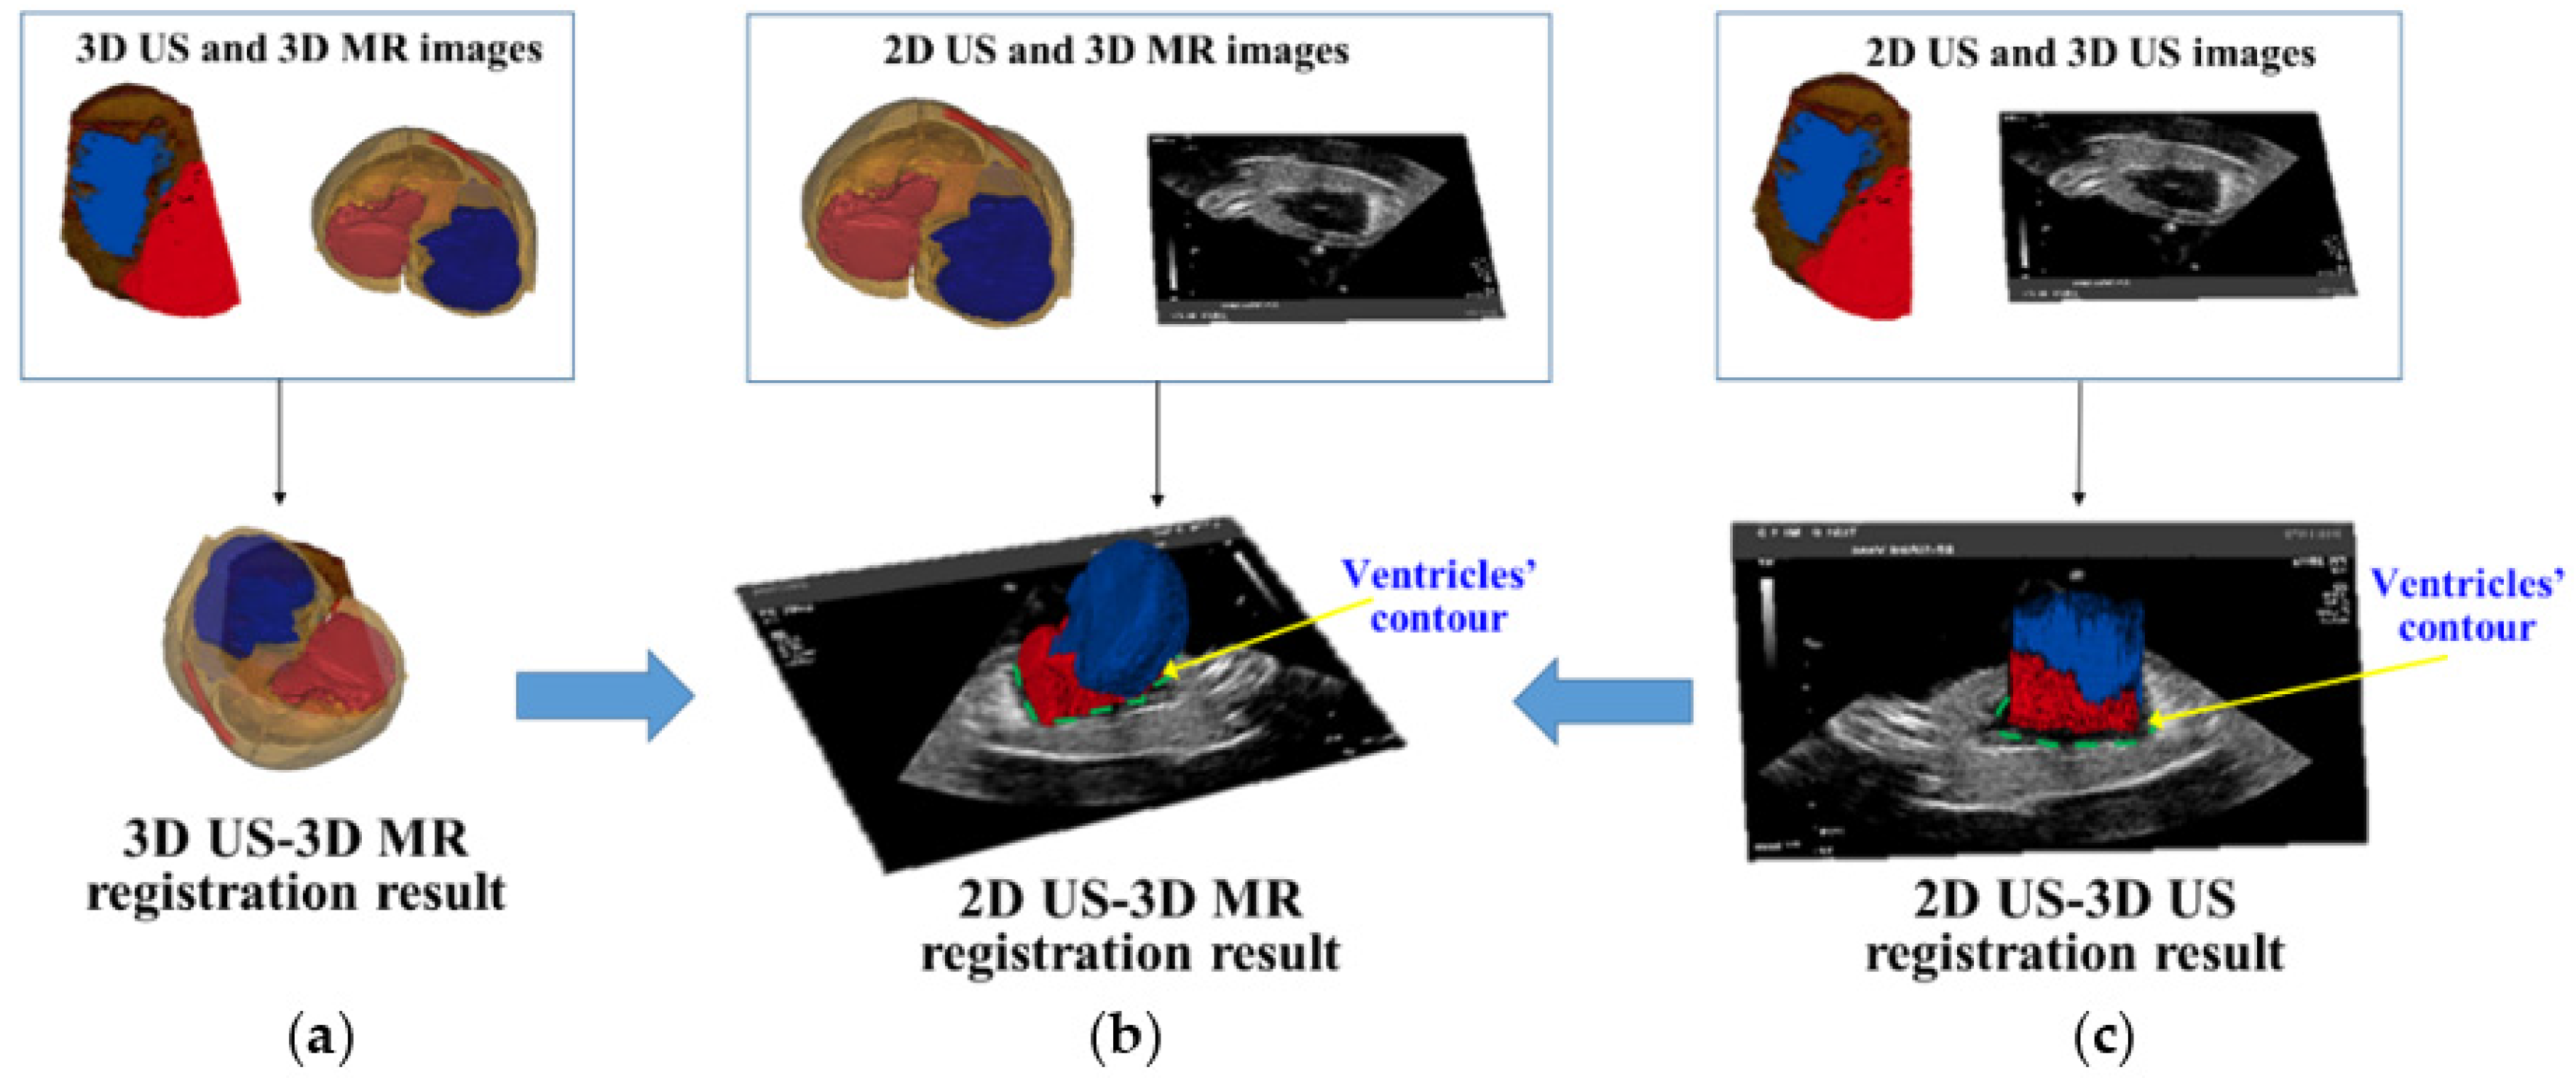
The registration results of 2D US-3D US images, 3D US-3D MR images and final 2D US-3D MR images are shown in
Figure 6. The registration accuracy of 2D US-3D MR images was quantitatively evaluated by calculating the target registration error (TRE). Ten contour points of ventricle in 2D US and the corresponding contour points of ventricle in 3D MR model were manually delineated by a surgeon to calculate TRE. TRE is the average Euclidean distance of these corresponding contour points. A mean TRE of 2.70 mm (range 1.05–3.67 mm) is obtained during 2D US-3D MR image registration.
3.2. Evaluation of Local High-Resolution Navigation Information
Local high-resolution navigation information is achieved by combining the 3D trajectory of the catheter from US images tracking with segmented IVUS images. Therefore, the effectiveness of local navigation can be validated by verifying these two critical factors.
3.2.1. Evaluation of Multi-Feature Particle Filter Method for Catheter’s 3D Trajectory
During the experiment, we inserted the catheter into the aortic phantom and scanned large areas with a calibrated 2D US probe. Multi-feature particle filter tracking method was used to track aortic cross-sections in the collected 2D US images. The corresponding parameters in particle filter tracking were set as a = 0.5, δ = 0.7, and the number of particles was 40. Aortic cross-sections were tracked in 200 US images with the multi-feature particle filter tracking methods. The tracking error is determined by the Euclidean distance between aortic cross-section center from automatic tracking and manually delineative center. The average tracking error of multi-feature particle filter method is 0.87 mm (lateral error is 0.43 mm and longitudinal error is 0.76 mm).
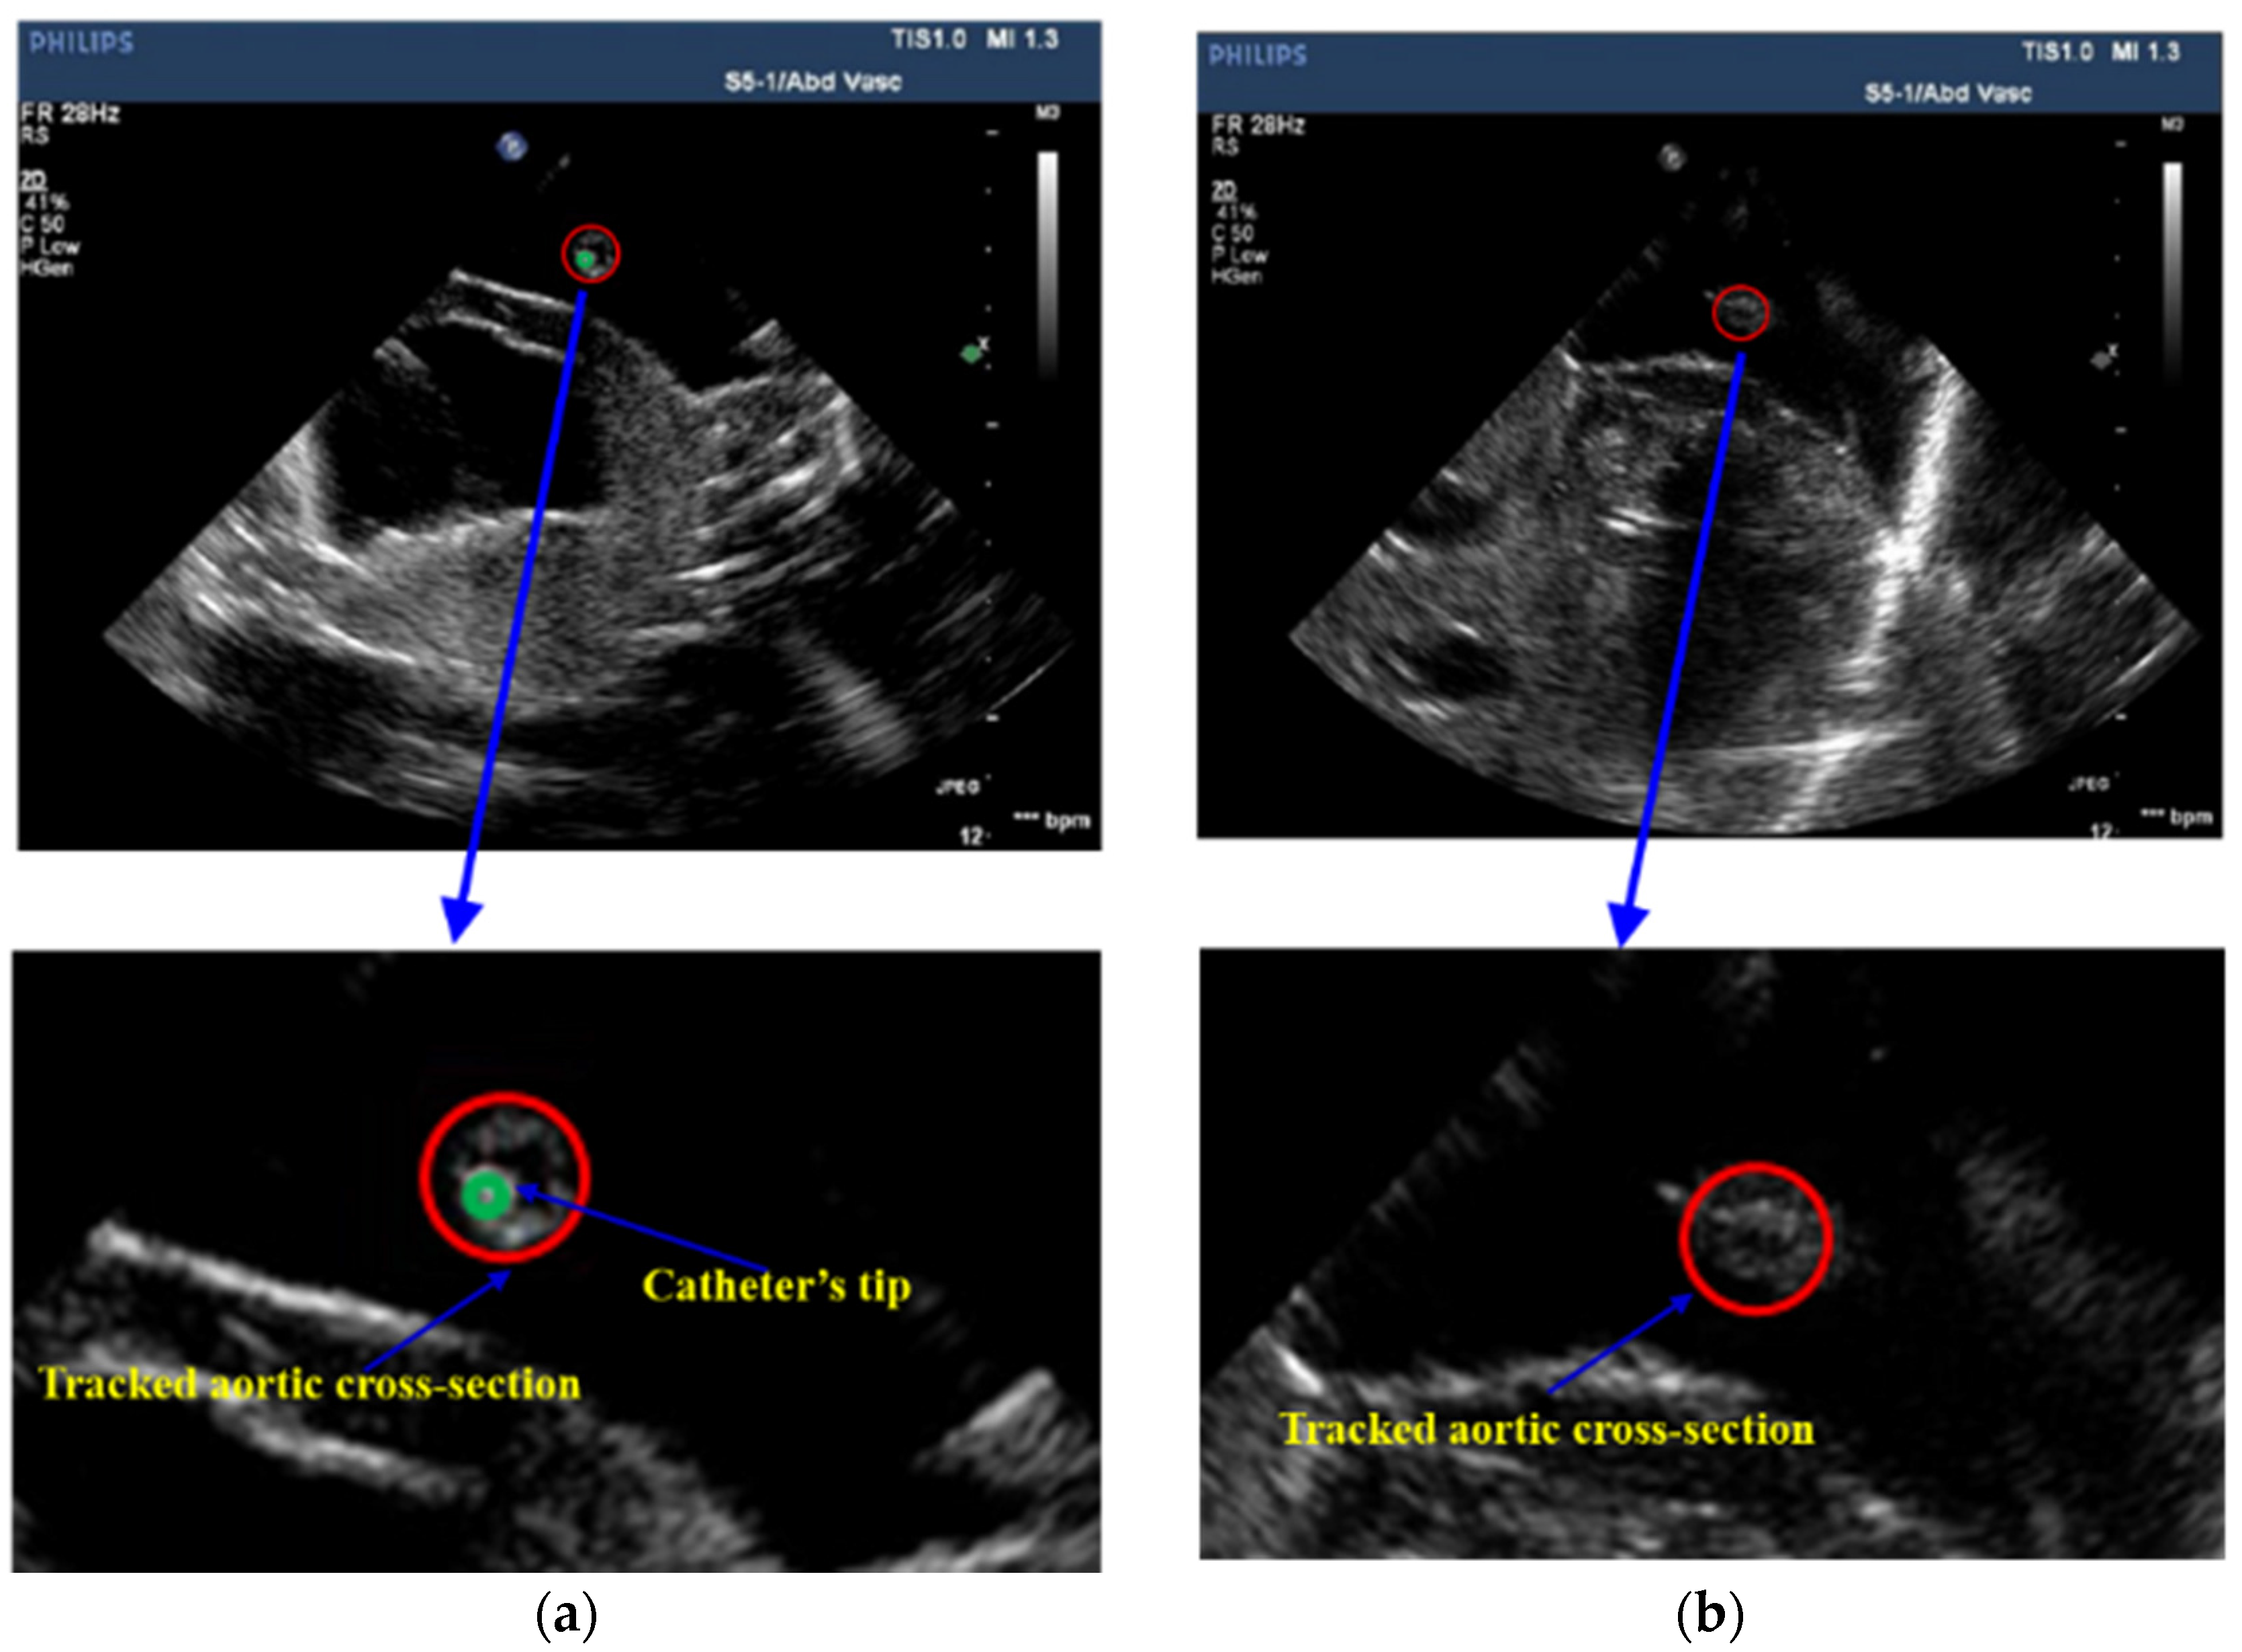
After tracking aortic cross-sections in US images, threshold technology is applied to obtain those pixels whose intensities are higher than 220 inside the aortic cross-section. The centroid of those pixels is the detected position of the cross-section of the catheter. In
Figure 7, the red circle represents the tracked aortic cross-section and the green point is the located tip of catheter. Based on the positions of the catheter’s tip, the 3D trajectory of the catheter is acquired.
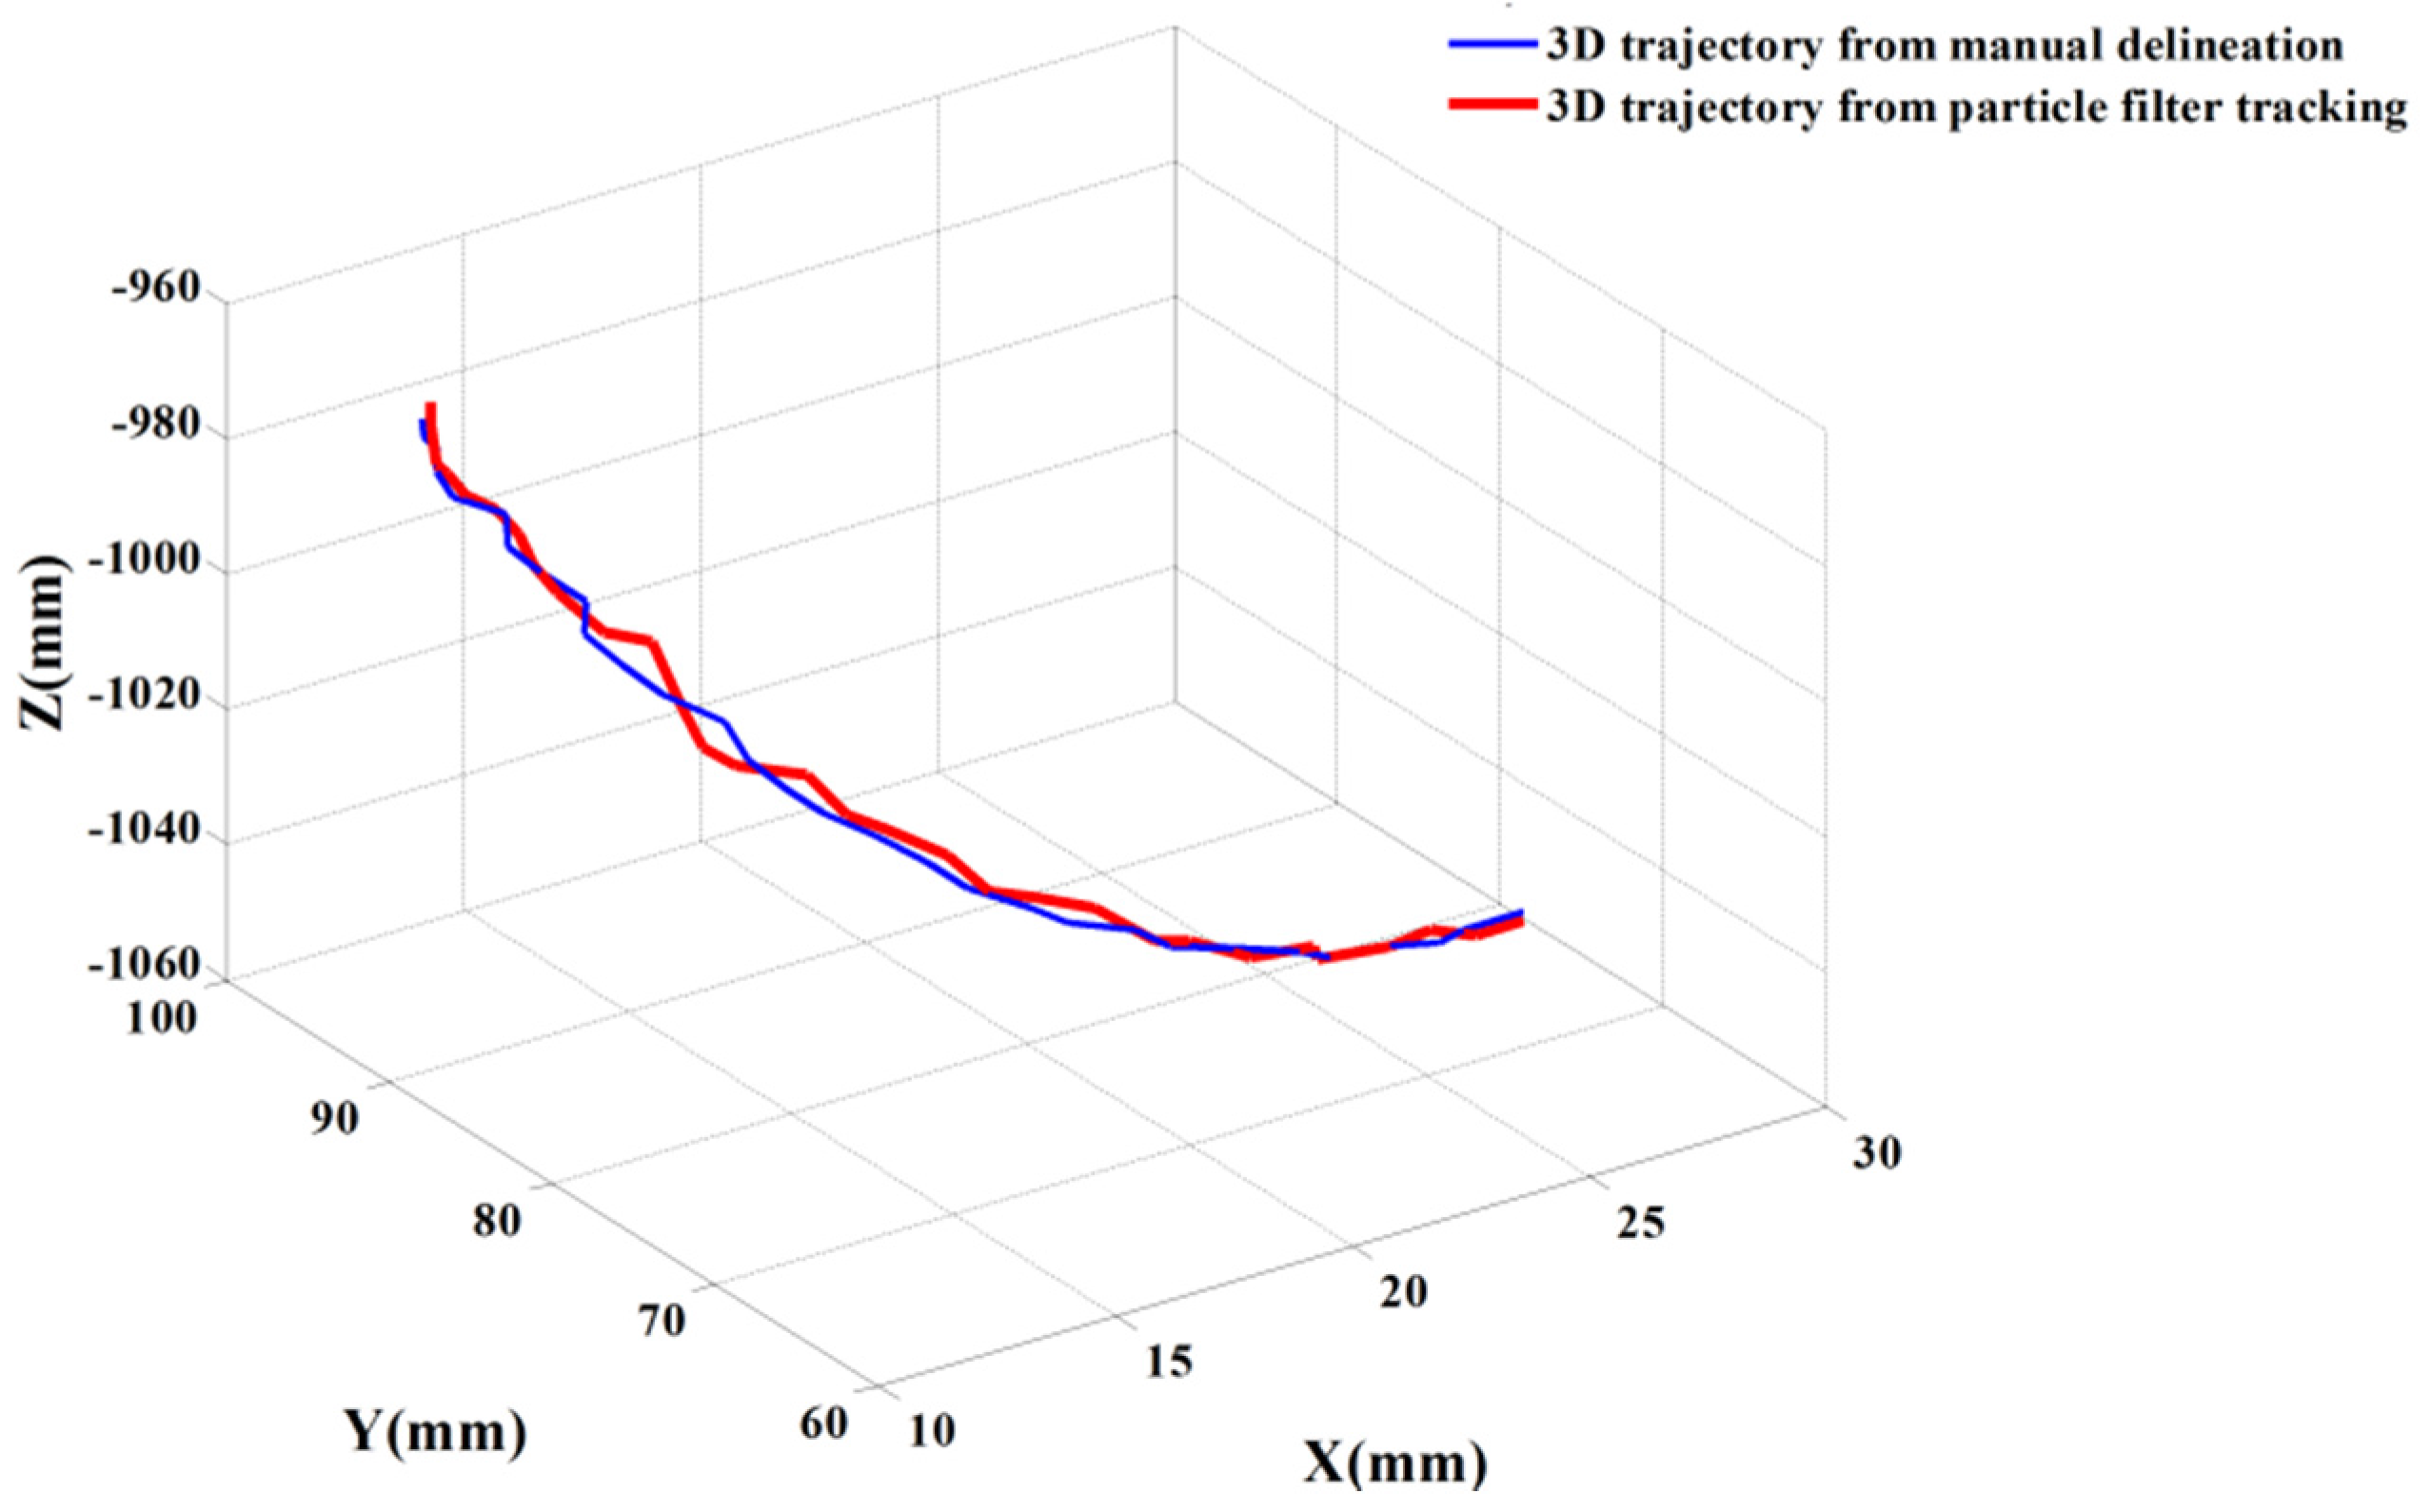
Figure 8 shows two trajectories of the catheter, including an automatic trajectory of the catheter from our multi-feature particle filter tracking method and a 3D trajectory from the manually delineative catheter’s tip. The distance between the manual trajectory and automatic trajectory using multi-feature particle filter tracking method is 1.48 mm.
3.2.2. Evaluation of the Improved Level Set Method for IVUS Images Segmentation
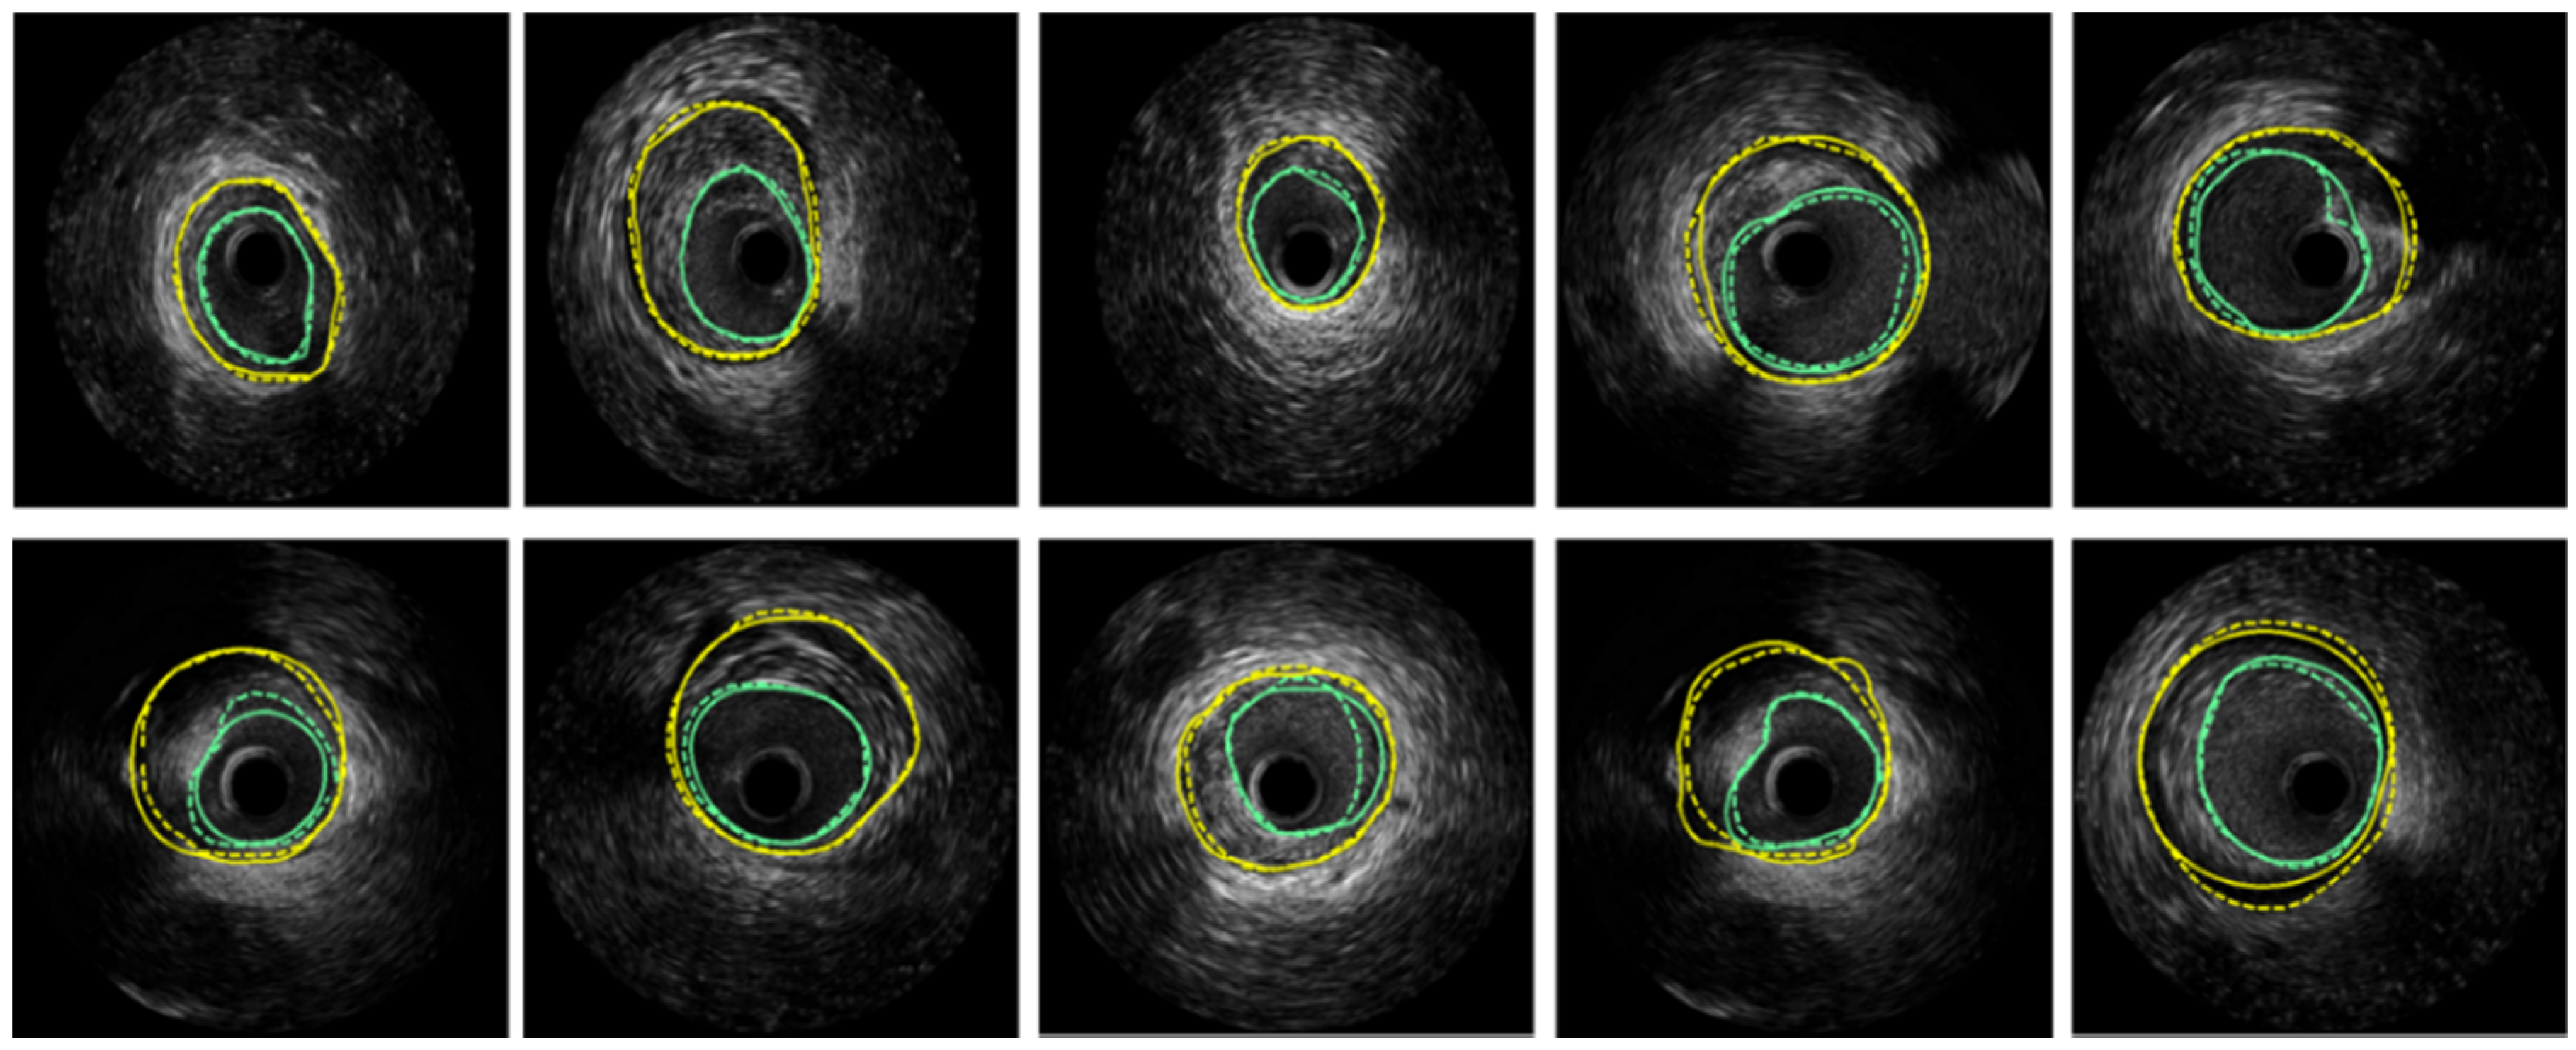
Accurate IVUS segmentation and borders detection can provide lesion location inside the vessel for local navigation. For clinical patients who need stent placements, the collected IVUS images contain information on the lesions but various artifacts exist. A segmentation method applicable for real patients is critical. Therefore, the performance of IVUS segmentation method was evaluated using 500 IVUS images from the sequences of ten patients. These patients’ IVUS sequences were collected in Navy PLA General Hospital, China (detailed information of patients is listed in
supplementary material Table S1). The MA and lumen borders of 500 images had been manually delineated by an expert in IVUS images interpretation from the Navy PLA General Hospital. Examples of segmented lumen and MA borders of our method are illustrated in
Figure 9. Segmentation accuracy was quantified by using standard measurements including Dice indexes and Hausdorff distance. The comparison results of proposed segmentation method and manual delineation are listed in
Table 1.
3.3. The US Navigation In Vitro Experiment
We presented an in vitro experiment of the catheter intervention for stent deployment, which is conducted on a cardiac and aortic phantom. During the experiment, there was a plaque inside our aortic phantom, and the center of the plaque was identified as the surgical target. The user was asked to insert a catheter into the target inside the vessel to simulate transcatheter stent deployment. During the intervention, two different types of navigation information: (1) a global navigation map alone; (2) a global map plus local navigation information were available to the user, respectively.
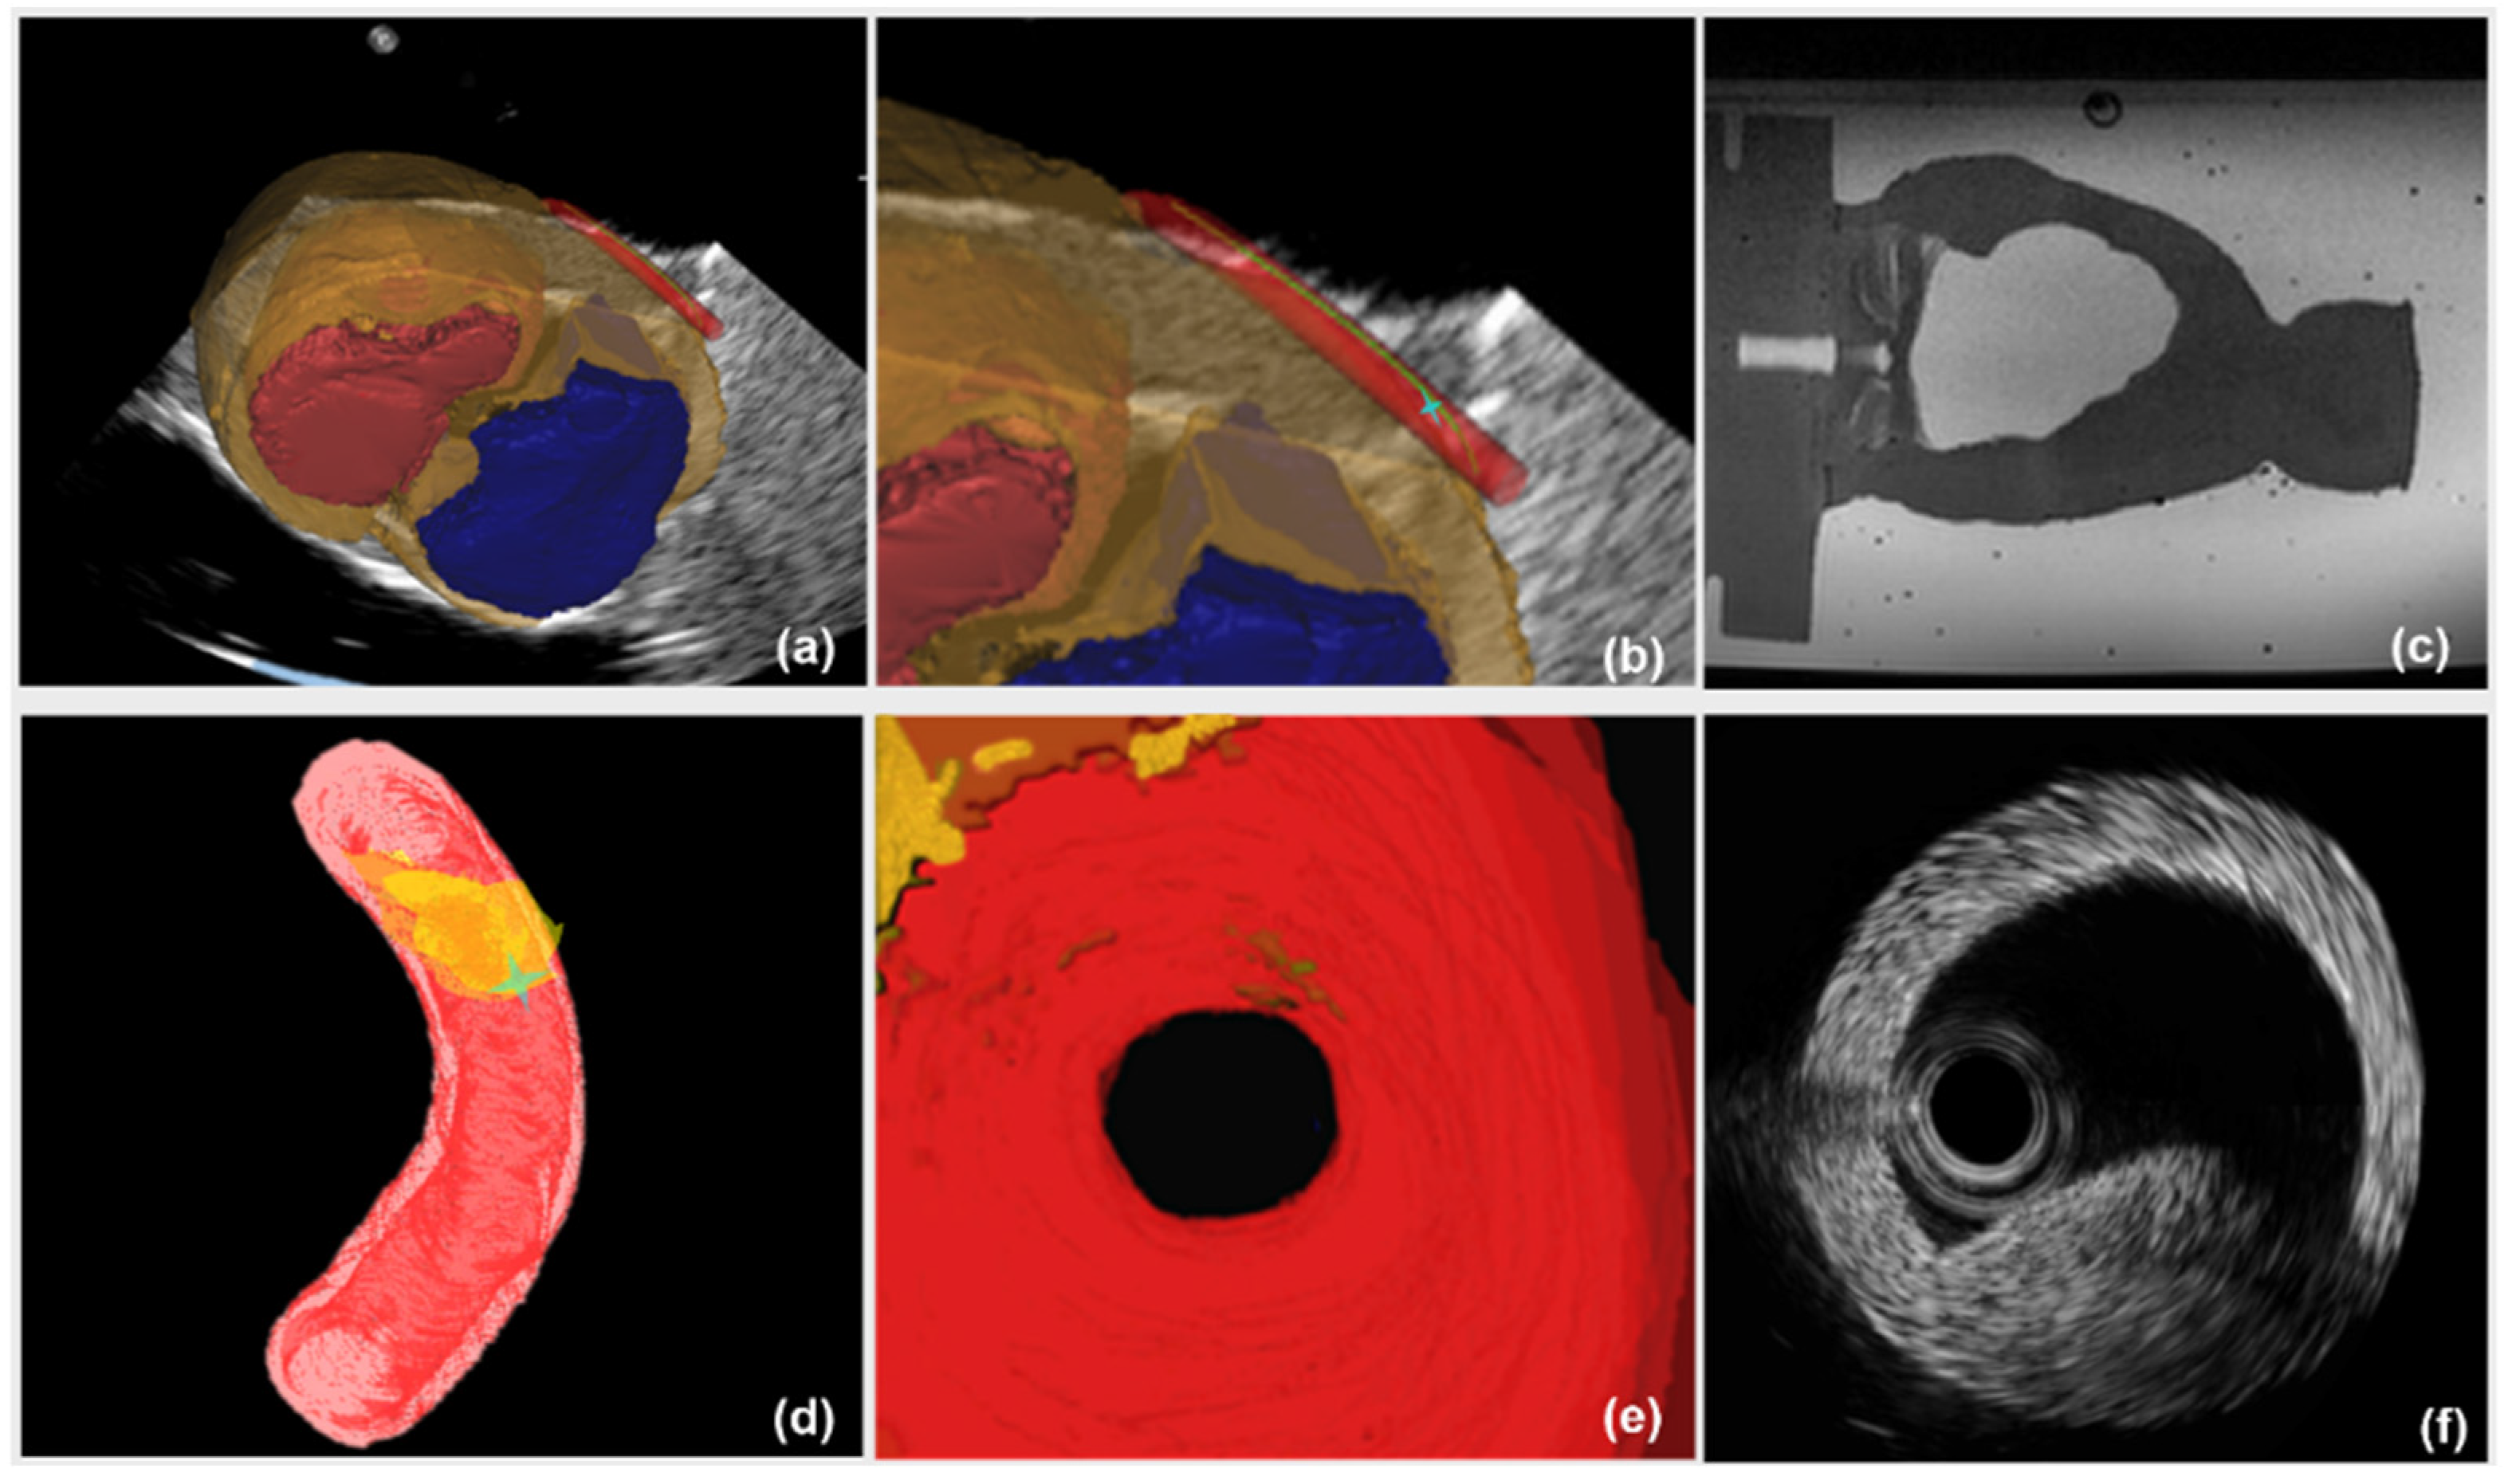
The image guidance interface and information during the intervention are illustrated in
Figure 10. Under the guidance of a global navigation map (
Figure 10a–c), the relative position between interventional catheter and 3D cardiac structure is displayed intuitively to navigate the catheter to the target. However, there is the limitation that the morphological information of aortic model, especially the lesion’s position, is blurred (
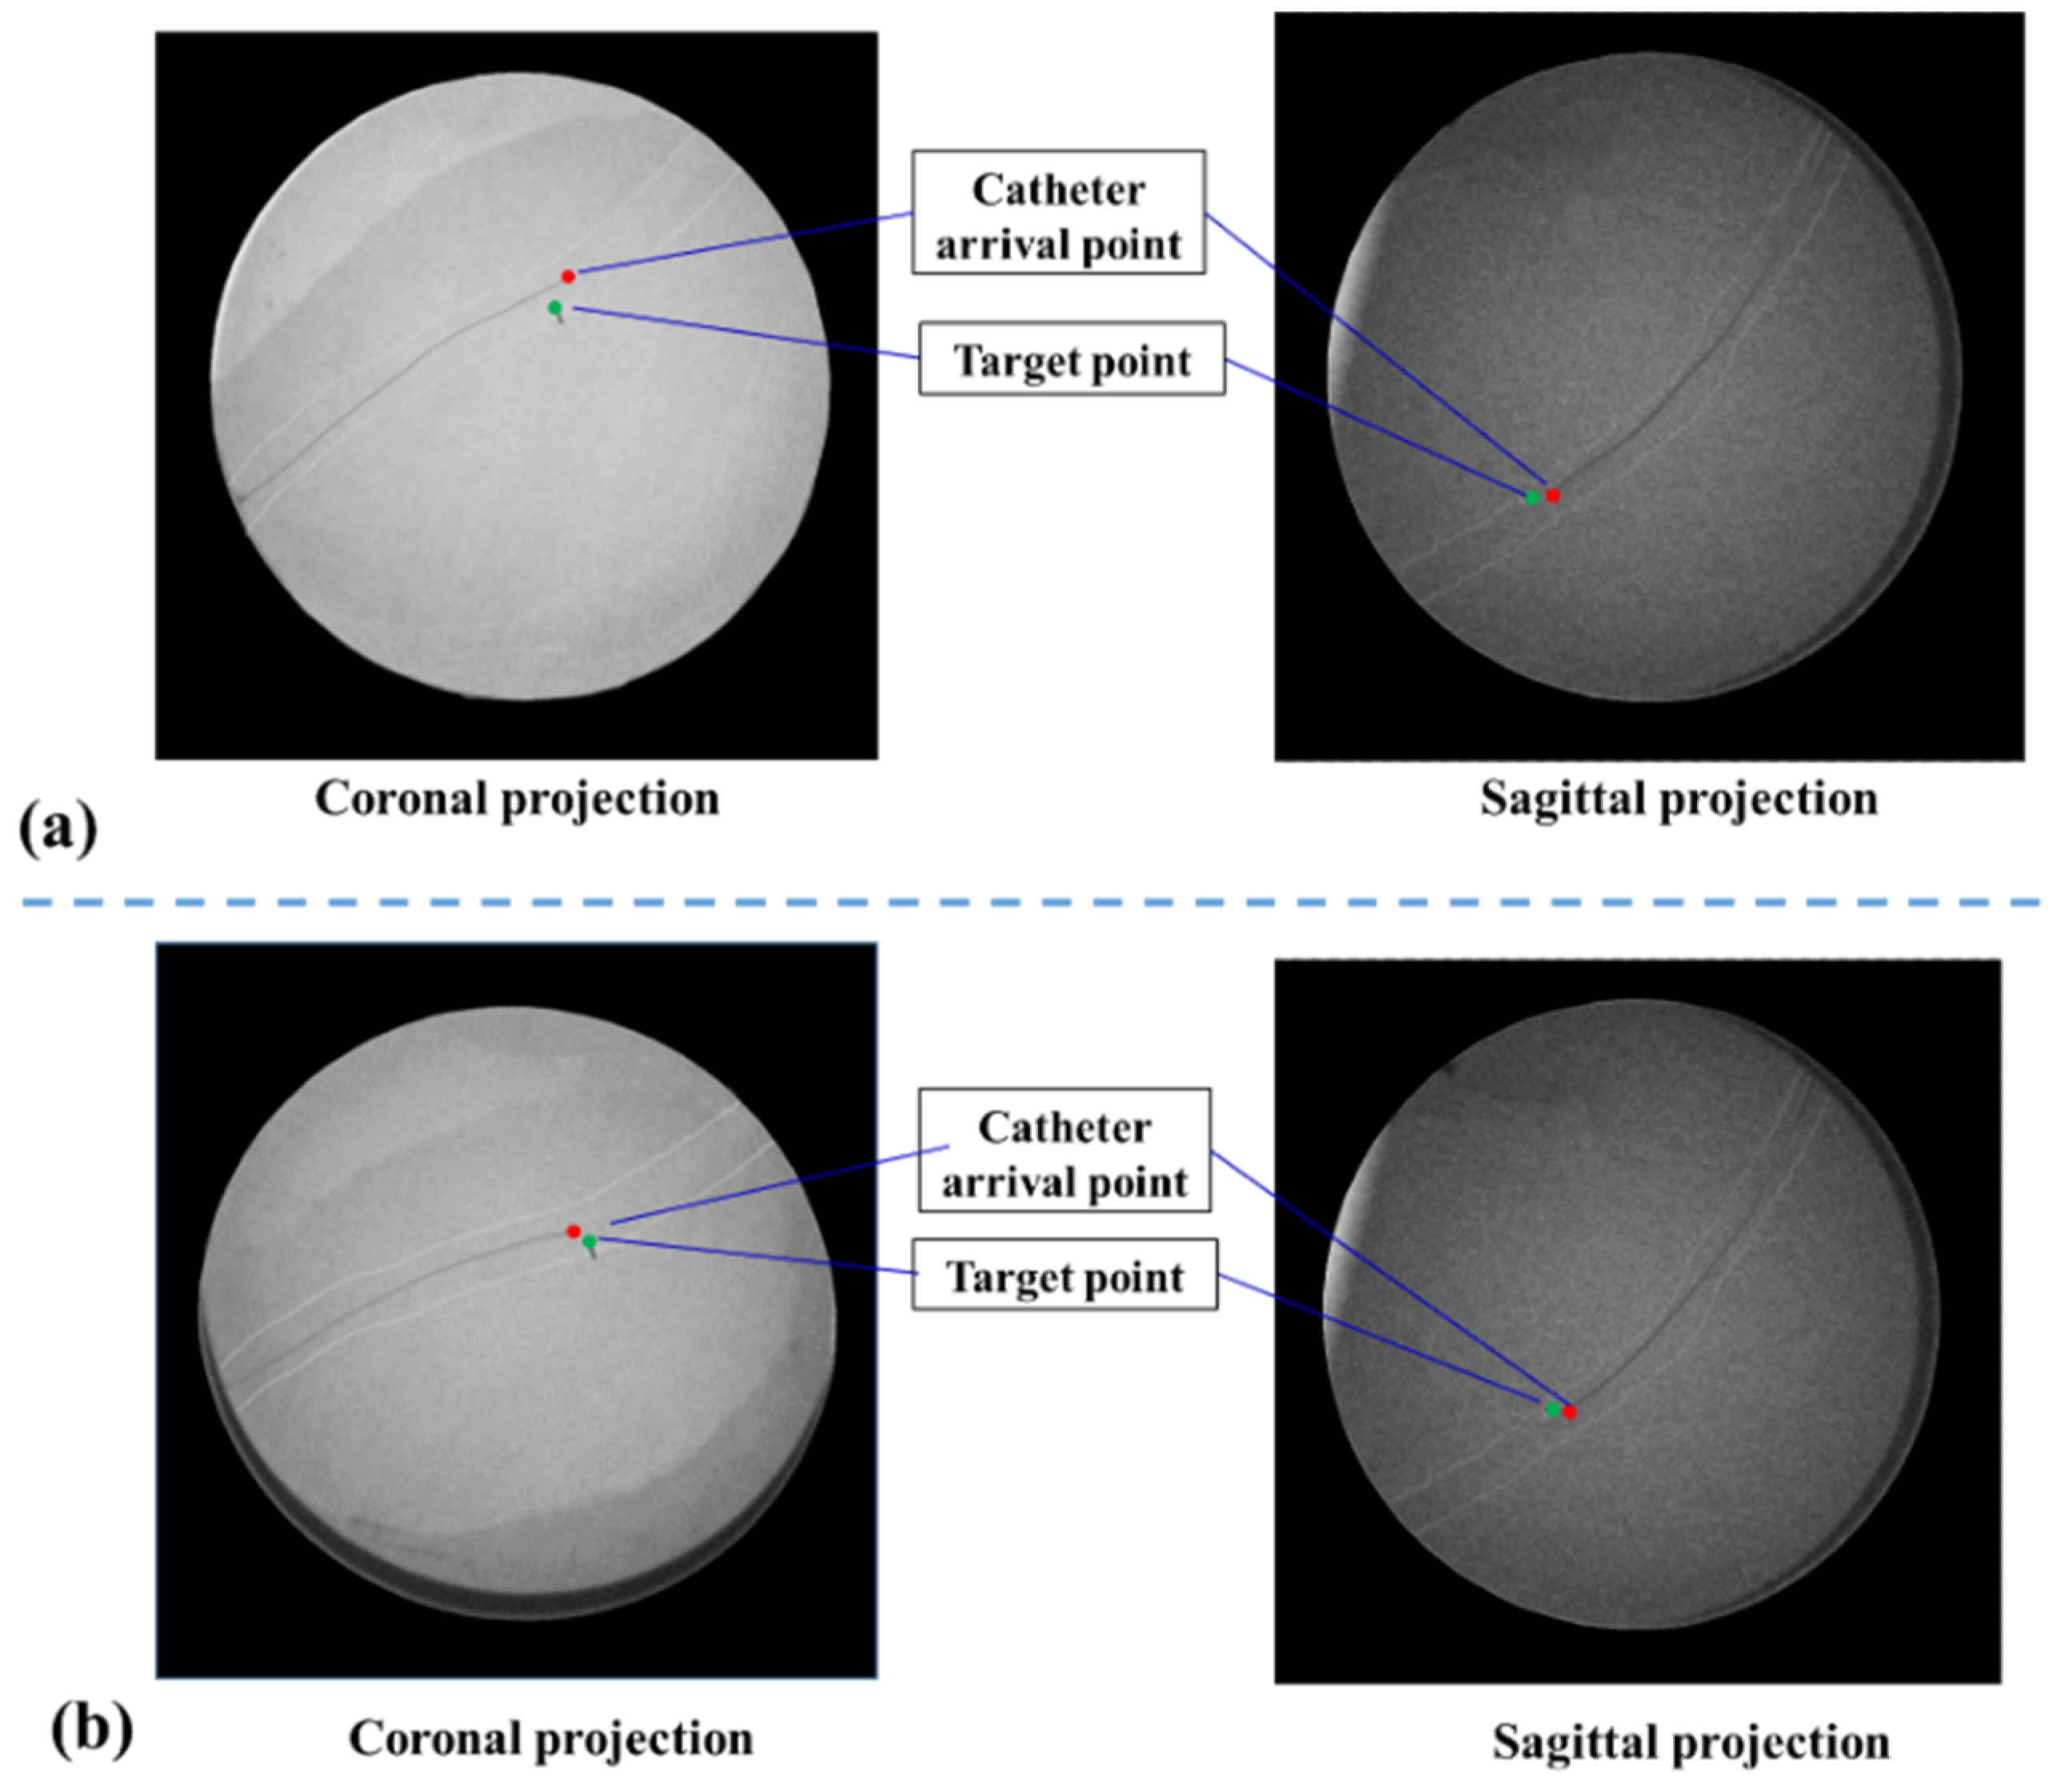
Figure 10c). On one hand, to evaluate the vessel reconstruction error of global information, we measured the average outer radius of manually reconstructed aortic model from global MR image, and compared the average outer radius with the actual outer radius of aortic phantom (4.5000 mm). We selected 40 transverses of the reconstructed aortic model to acquire an average outer radius. The resolution of MR images is 0.4871 mm and the acquired reconstruction error of global navigation is 1.1241 mm. On the other hand, the catheter was navigated to the target using global information, and the distance between the catheter arrival position and the target was measured by using coronal and sagittal X-ray projections images from C-arm (Fluoroscan Insight, HOLOGIC, Boston, MA, USA). This distance is treated as targeting error of global navigation (See
Figure 11a) and the acquired targeting error is 2.8701 mm.
Comparatively, in the case of a global map plus local navigation information, the user can be guided to insert catheter along the preoperative planning path. Meanwhile, the local navigation information (
Figure 10d–f), further provides the user with critical details of the target point. Firstly, to evaluate the vessel reconstruction error of local navigation information, we calculated the average outer radius of the automatically reconstructed aortic model from segmented IVUS images, and compared this average outer radius with the actual radius of aortic phantom. The resolution of IVUS images is 0.0175 mm and the acquired reconstruction error of local information is 0.2217 mm. Secondly, to evaluate the targeting error of catheter intervention, we captured coronal and sagittal X-ray projections when the catheter was navigated to the target by using global plus local information. These projections images are measured (See
Figure 11b) and the acquired targeting error is 1.7214 mm. This experiment shows that the new US navigation system which integrates global and local information can improve upon the navigation system that relies on a global navigation map alone.
4. Discussion
The aim of this paper is to present a radiation-free US navigation system for transcatheter aortic stent deployment by combining MR images with two types of US images including IVUS images and common US images. The proposed US navigation system can provide surgeons with not only a global navigation map of heart and surrounding tissue, but also morphological characteristics of aorta to assist stent deployment. There are two key parts in our system: (1) a global navigation map from 2D US-3D MR image registration; (2) local morphological navigation information based on US images tracking and IVUS images segmentation.
Recently, 2D US images have been widely used in minimally invasive cardiac procedures due to its real-time imaging capabilities. However, it is difficult to relate the 2D US images to anatomical context due to the limit of image quality. 3D US image may overcome this problem to some degree, but it performs 3D imaging at the cost of decreased temporal resolution and only provides a narrow field of view. Therefore, we propose to use high-quality 3D context from MR images to enhance 2D US images through image registration, providing a global navigation map for surgeons. To solve the difficulty of 2D US-3D MR image registration, we develop a novel registration method based on calibrations of 2D and 3D US probes. On the one hand, we acquire the small probes’ calibration reproducibility errors (calibration error of 2D US probe: 0.61 mm, calibration error of 3D US probe: 1.42 mm). On the other hand, in
Figure 6b, the contours of ventricles in 2D US and 3D MR images achieve a good agreement after registration, which qualitatively demonstrates that the proposed 2D US-3D MR image registration method is effective. A TRE of 2.70 mm is obtained for US and MR image registration. Through registration, interpretability of 2D US images is improved within the 3D anatomical context provided by MR images. Therefore, a global navigation map by integrating 2D US and 3D MR images is achieved (
Figure 10a).
Local high-resolution navigation can reveal morphological characteristics of the aorta, especially the information on the target lesion. The vessel reconstruction error of local information is reduced by 80% compared to global information (error: 0.2217 mm versus 1.1241 mm). In addition, in the catheter intervention experiment, the targeting error of global navigation is 2.8701 mm. By adding the local high-resolution navigation information to global navigation, the targeting error reduces to 1.7214 mm. Thus, combining the large view of global navigation with the high accuracy of local navigation can provide surgeons with an intuitive 3D map and adequate lesion location for precise catheter intervention in stent deployment.
We have validated the applicability of our proposed system in a laboratory setting, but several problems exist and need to be solved before delivering our system to clinical in vivo interventions. Firstly, compared with the static phantom experiment in water tank, the beating of heart needs to be taken into account in the in vivo experiment. We will add phase synchronization of US, MR and IVUS images through electrocardiograph (ECG) signals to solve this problem; Secondly, in the in-vivo experiment, the collected IVUS images are more complex than the IVUS images of aortic phantom. We are conducting more evaluations of images segmentation for more patients with different degrees of severity. We acknowledge that 2D US imaging of the human body is more challenging than a phantom in water bath. This is because propagation in homogeneous tissue will cause acoustic noise and the lung and ribs will reduce the acoustic window. Our future works will focus on the research about human body experiments and applications. Furthermore, besides phantom experiments in water tanks, we are developing the evaluation experiment of a beating high-reality heart phantom through different intervention routes and operators. We believe that the proposed US navigation system has great potential to provide surgeons with more abundant information for precise transcatheter aortic stent deployment.


