Article

Photoacoustic Tomography Imaging of the Adult Zebrafish by Using Unfocused and Focused High-Frequency Ultrasound Transducers

Bioimaging Core, Faculty of Health Sciences, University of Macau, Macau SAR, China
*
Author to whom correspondence should be addressed.
Appl. Sci. 2016, 6(12), 392; https://doi.org/10.3390/app6120392
Submission received: 26 September 2016 / Revised: 18 November 2016 / Accepted: 23 November 2016 / Published: 30 November 2016
(This article belongs to the Special Issue Biomedical Ultrasound)

Abstract

:
The zebrafish model provides an essential platform for the study of human diseases or disorders due to the possession of about 87% homologous genes with human. However, it is still very challenging to noninvasively visualize the structure and function of adult zebrafish based on available optical imaging techniques. In this study, photoacoustic tomography (PAT) was utilized for high-resolution imaging of adult zebrafish by using focused and unfocused high-frequency (10 MHz) ultrasound transducers. We examined and compared the imaging results from the two categories of transducers with in vivo experimental tests, in which we discovered that the unfocused transducer is able to identify the inner organs of adult zebrafish with higher contrast but limited regional resolution, whereas the findings from the focused transducer were with high resolution but limited regional contrast for the recovered inner organs.

1. Introduction

The zebrafish, which has around 87% homologous genes with human, is now widely adopted as a model organism of vertebrate biology [1]. Compared to the mouse model, the zebrafish has the advantage of the rapid embryonic development, and the embryos are also able to develop outside their mother, which provide a cost-effective model for the investigation of human diseases [2,3,4,5]. In addition, the in vivo optical imaging approaches such as confocal and two-photon microscopy have exhibited their merits in characterizing the structures and functions of the zebrafish at embryonic stages [6]. However, most of the zebrafish strains are able to lose their transparency after their first two weeks of development; consequently, the most available optical imaging techniques cannot successfully image the whole body of adult zebrafish [2]. Even if the transparent adult zebrafish model has been developed for different in vivo transplantation analysis, it is also very hard to break through the penetration limitations of traditional optical imaging methods [7]. As such, it is essential to adopt new optical imaging techniques that can achieve high-resolution imaging of adult zebrafish with good penetration depth [8,9,10,11,12,13,14].
To date, photoacoustic tomography (PAT) is widely recognized as a robust biomedical imaging method that combines the high optical contrast and the high acoustic resolution in a single imaging technique [11,12]. Interestingly, PAT has been non-invasively applied in the reconstruction of the structural and functional information of adult zebrafish [2,4,14]. In addition, PAT is concerned with an inverse problem, in which the absorption distributions of biological tissues can be reconstructed by using the recorded acoustic signals along the tissue surfaces. Very specifically, a high-frequency ultrasonic transducer is essential for imaging of the adult zebrafish with increased regional resolution. In particular, compared to an unfocused high-frequency transducer, a focused high-frequency ultrasonic transducer provides a narrower ultrasonic beam around the focal zone, which is able to further improve the resolution of photoacoustic (PA) imaging [13,15]. However, it is expected that the PA imaging sensitivity for the adult zebrafish may be influenced when PA signals are acquired by using the high-frequency focused ultrasound transducer. In this study, we examine and compare the PA imaging results from adult zebrafish based on high-frequency focused and unfocused ultrasound transducers. It is expected that the imaging results from combined focused and unfocused transducers can provide a more comprehensive and accurate characterization of the imaging volumes of adult zebrafish.

2. Methods and Materials

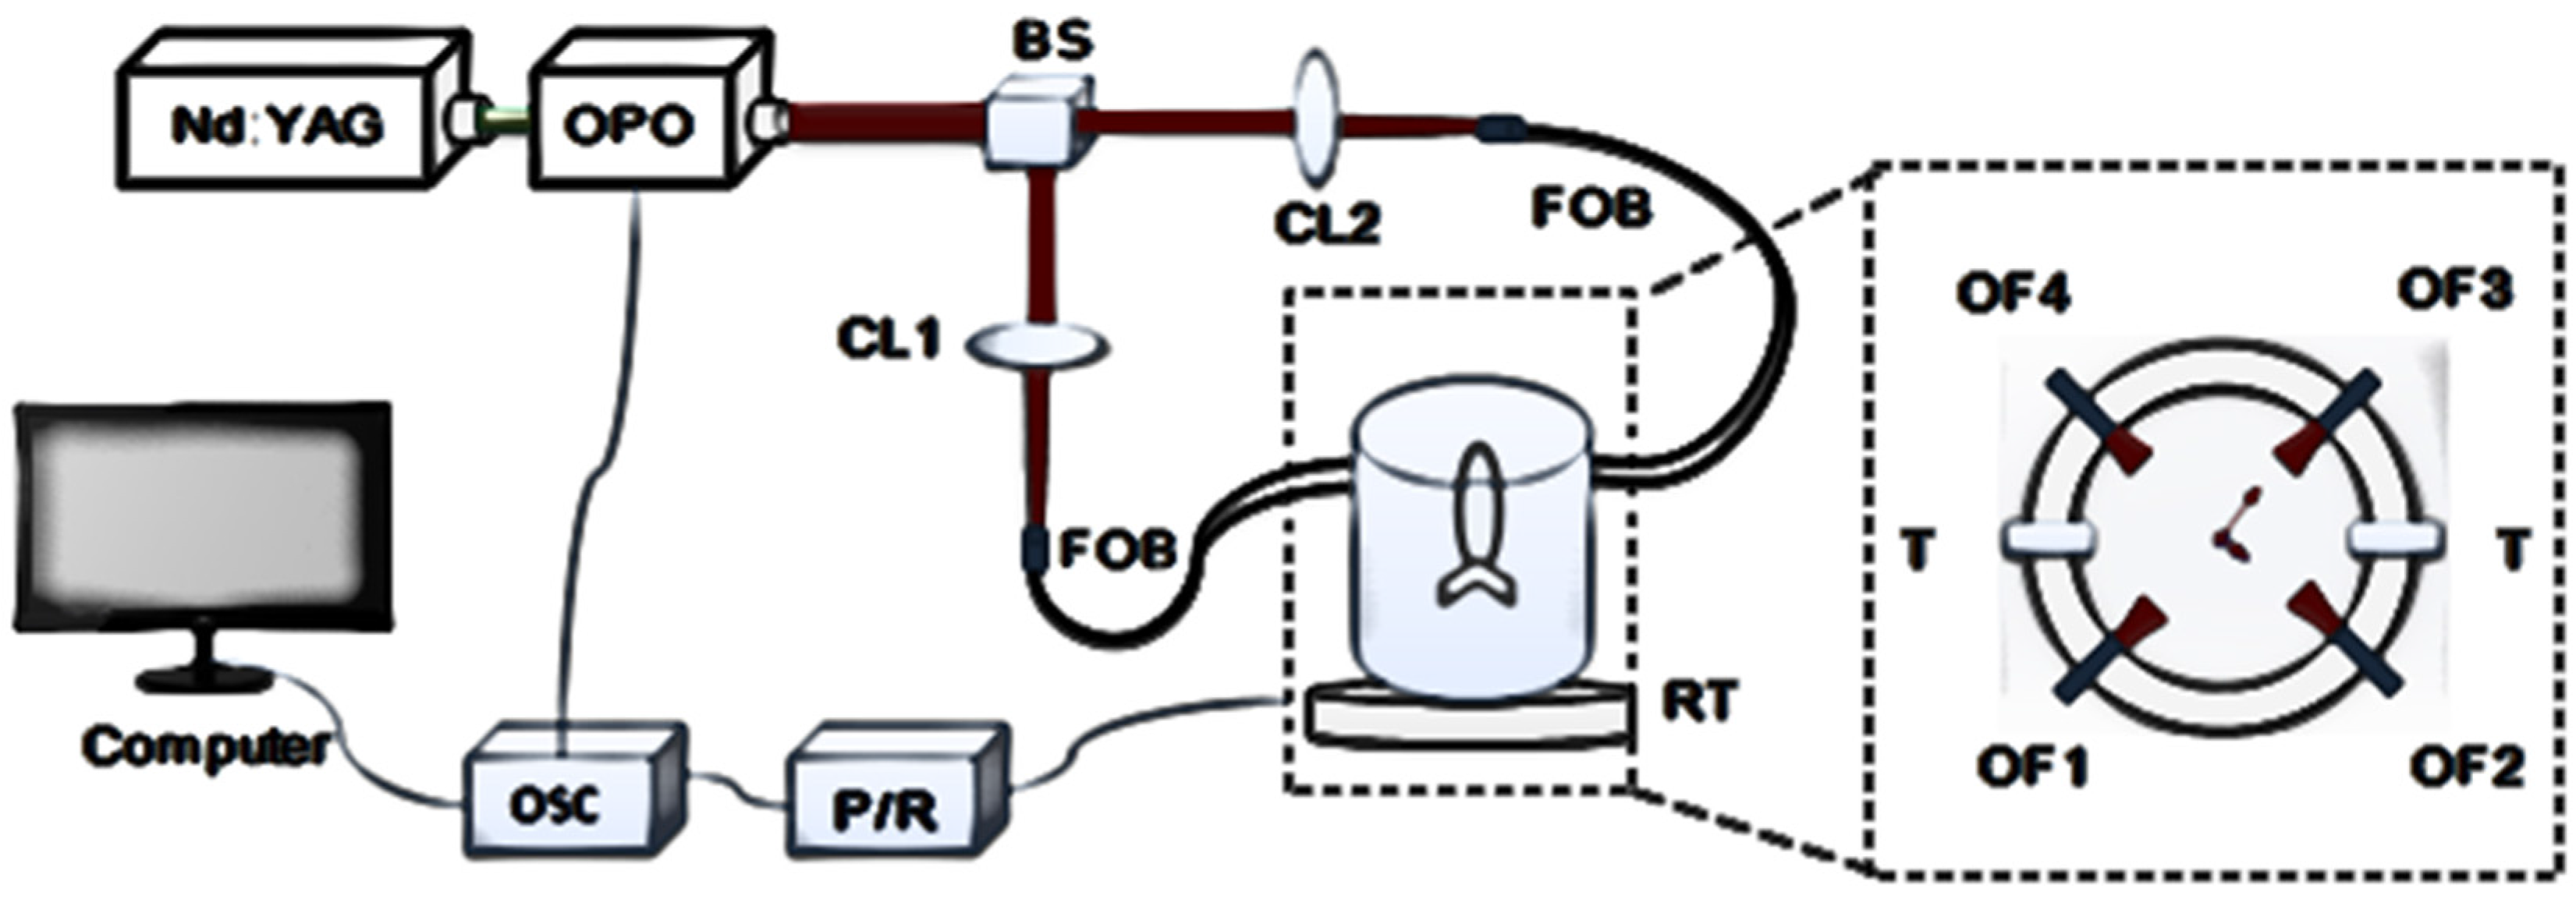
2.1. System Configuration

The schematic of the PA imaging system is provided in Figure 1. A pulsed light from OPO is pumped by the Nd:YAG laser (Surelite I-10, Continuum) with wavelengths of 680~1064 nm, pulse durations of 5~10 ns, and a repetition rate of 20 Hz. The laser beam from OPO is divided into two parts according to different paths, and the two-light beams (each beam has the energy density of 8 mJ/cm2) then go through Convex Lens 1 and Convex Lens 2, and finally are focused into two fiber optics bundles. The optical fiber bundles are custom-made silica fibers with one input fiber and two output fibers. The four output optical fibers and two ultrasound transducers (focused transducer: central frequency of 10 MHz, bandwidth range from 6.28 to 12.72 MHz, V327-SU-CF-1.00-IN, OLYMPUS NDT; unfocused transducer: central frequency of 10 MHz, bandwidth range from 6.80 to 12.31 MHz, V311, OLYMPUS NDT) are fastened on the holder. The holder and the sink are placed on the rotator. The element size of the focused transducer is 0.375 in., while the element size of unfocused transducer is 0.5 in. The focal length of the focused transducer is 1.014 in. For each cross-section imaging, we scanned 480 positions, and the interval of each step was 0.75°. The pulser/receiver (5073PR, Olympus Inc., Waltham, MA, USA) has the functions of reception, so the PA signals are finally received and amplified by the pulser/receiver apparatus. The output signals were shown on the oscilloscope with an average of 8 times and then stored on the computer for further data processing. For the present work, the delay-and-sum beam forming algorithm is used to generate the PA images of adult zebrafish.

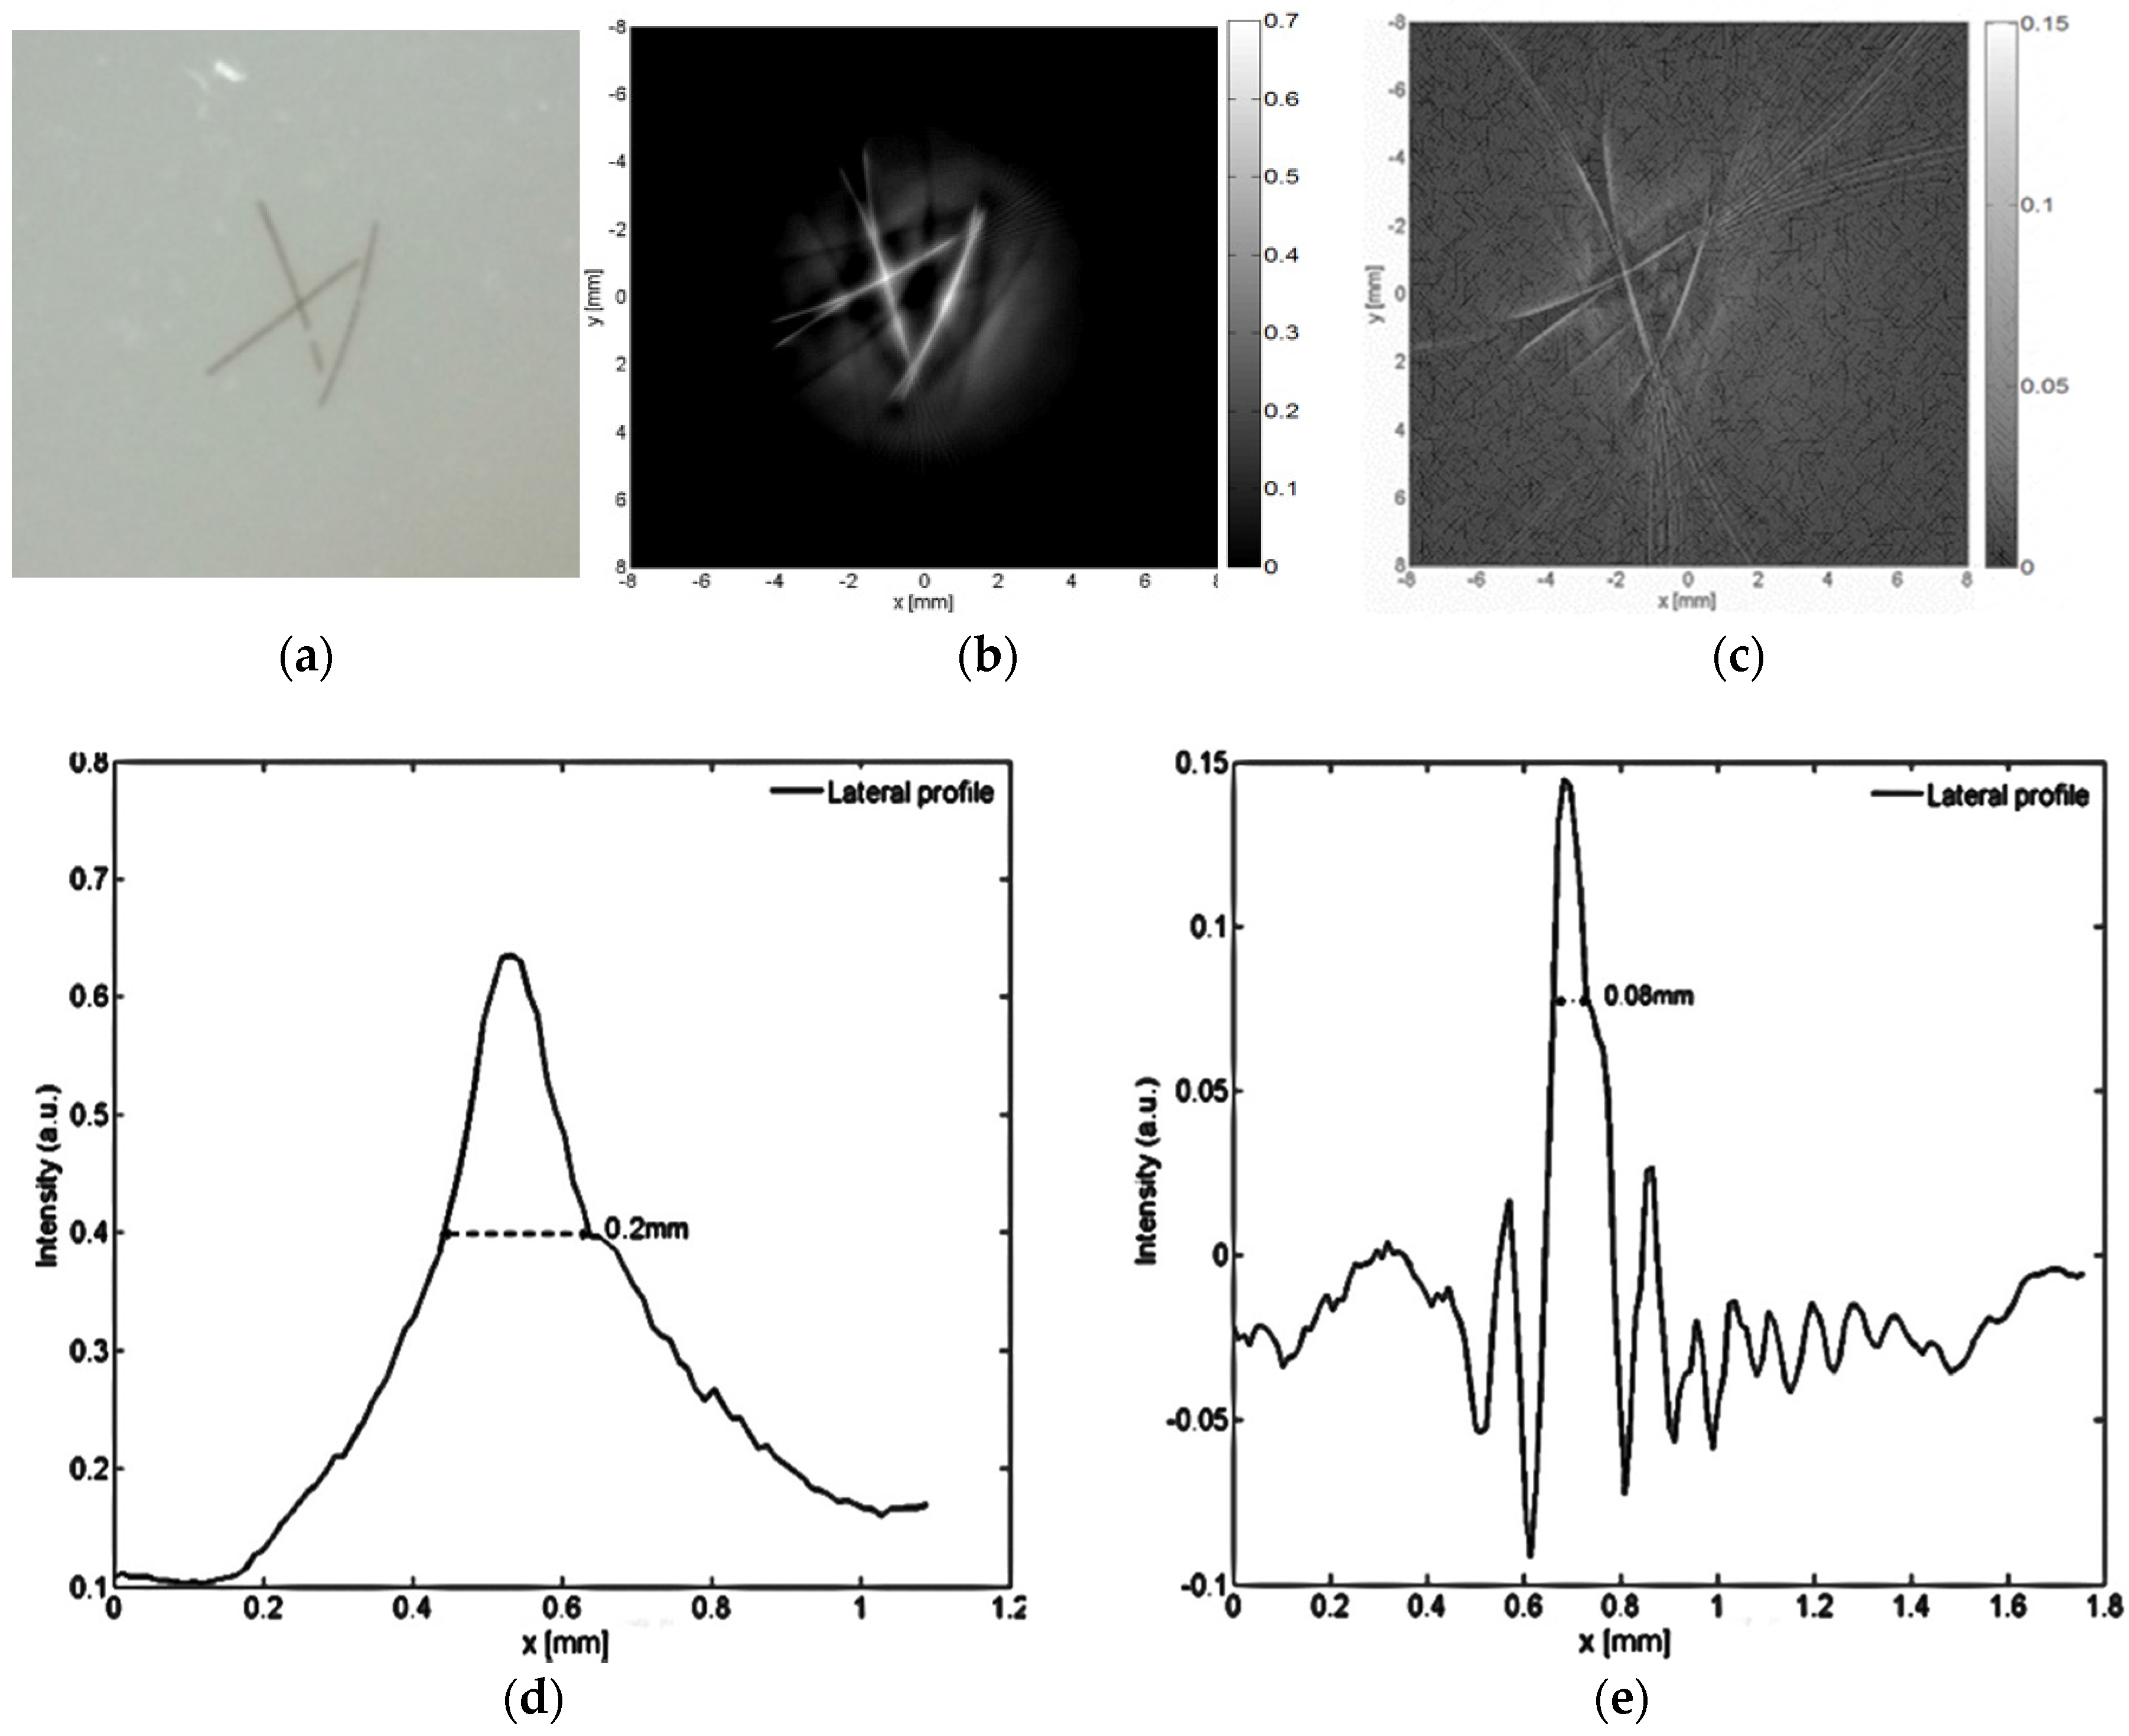
2.2. Phantom Expreimental Test

Before in vivo tests, a phantom experiment was performed to explore the imaging capabilities of the developed PA imaging system based on both the focused and unfocused ultrasound transducers. For the phantom experimental test, we placed human hair containing phantom (three hairs) into the water tank to examine the PA imaging resolution. The phantom materials utilized were composed of Intralipid as a scatterer and India ink as an absorber, with agar powder (1%–2%) to solidify the Intralipid and India ink solution [16], as shown in Figure 2a. We then immersed the object-bearing solid phantom into the water tank. The optical absorption coefficient and reduced scattering coefficient of the background phantom was 0.01 mm−1 and 1.0 mm−1, respectively.

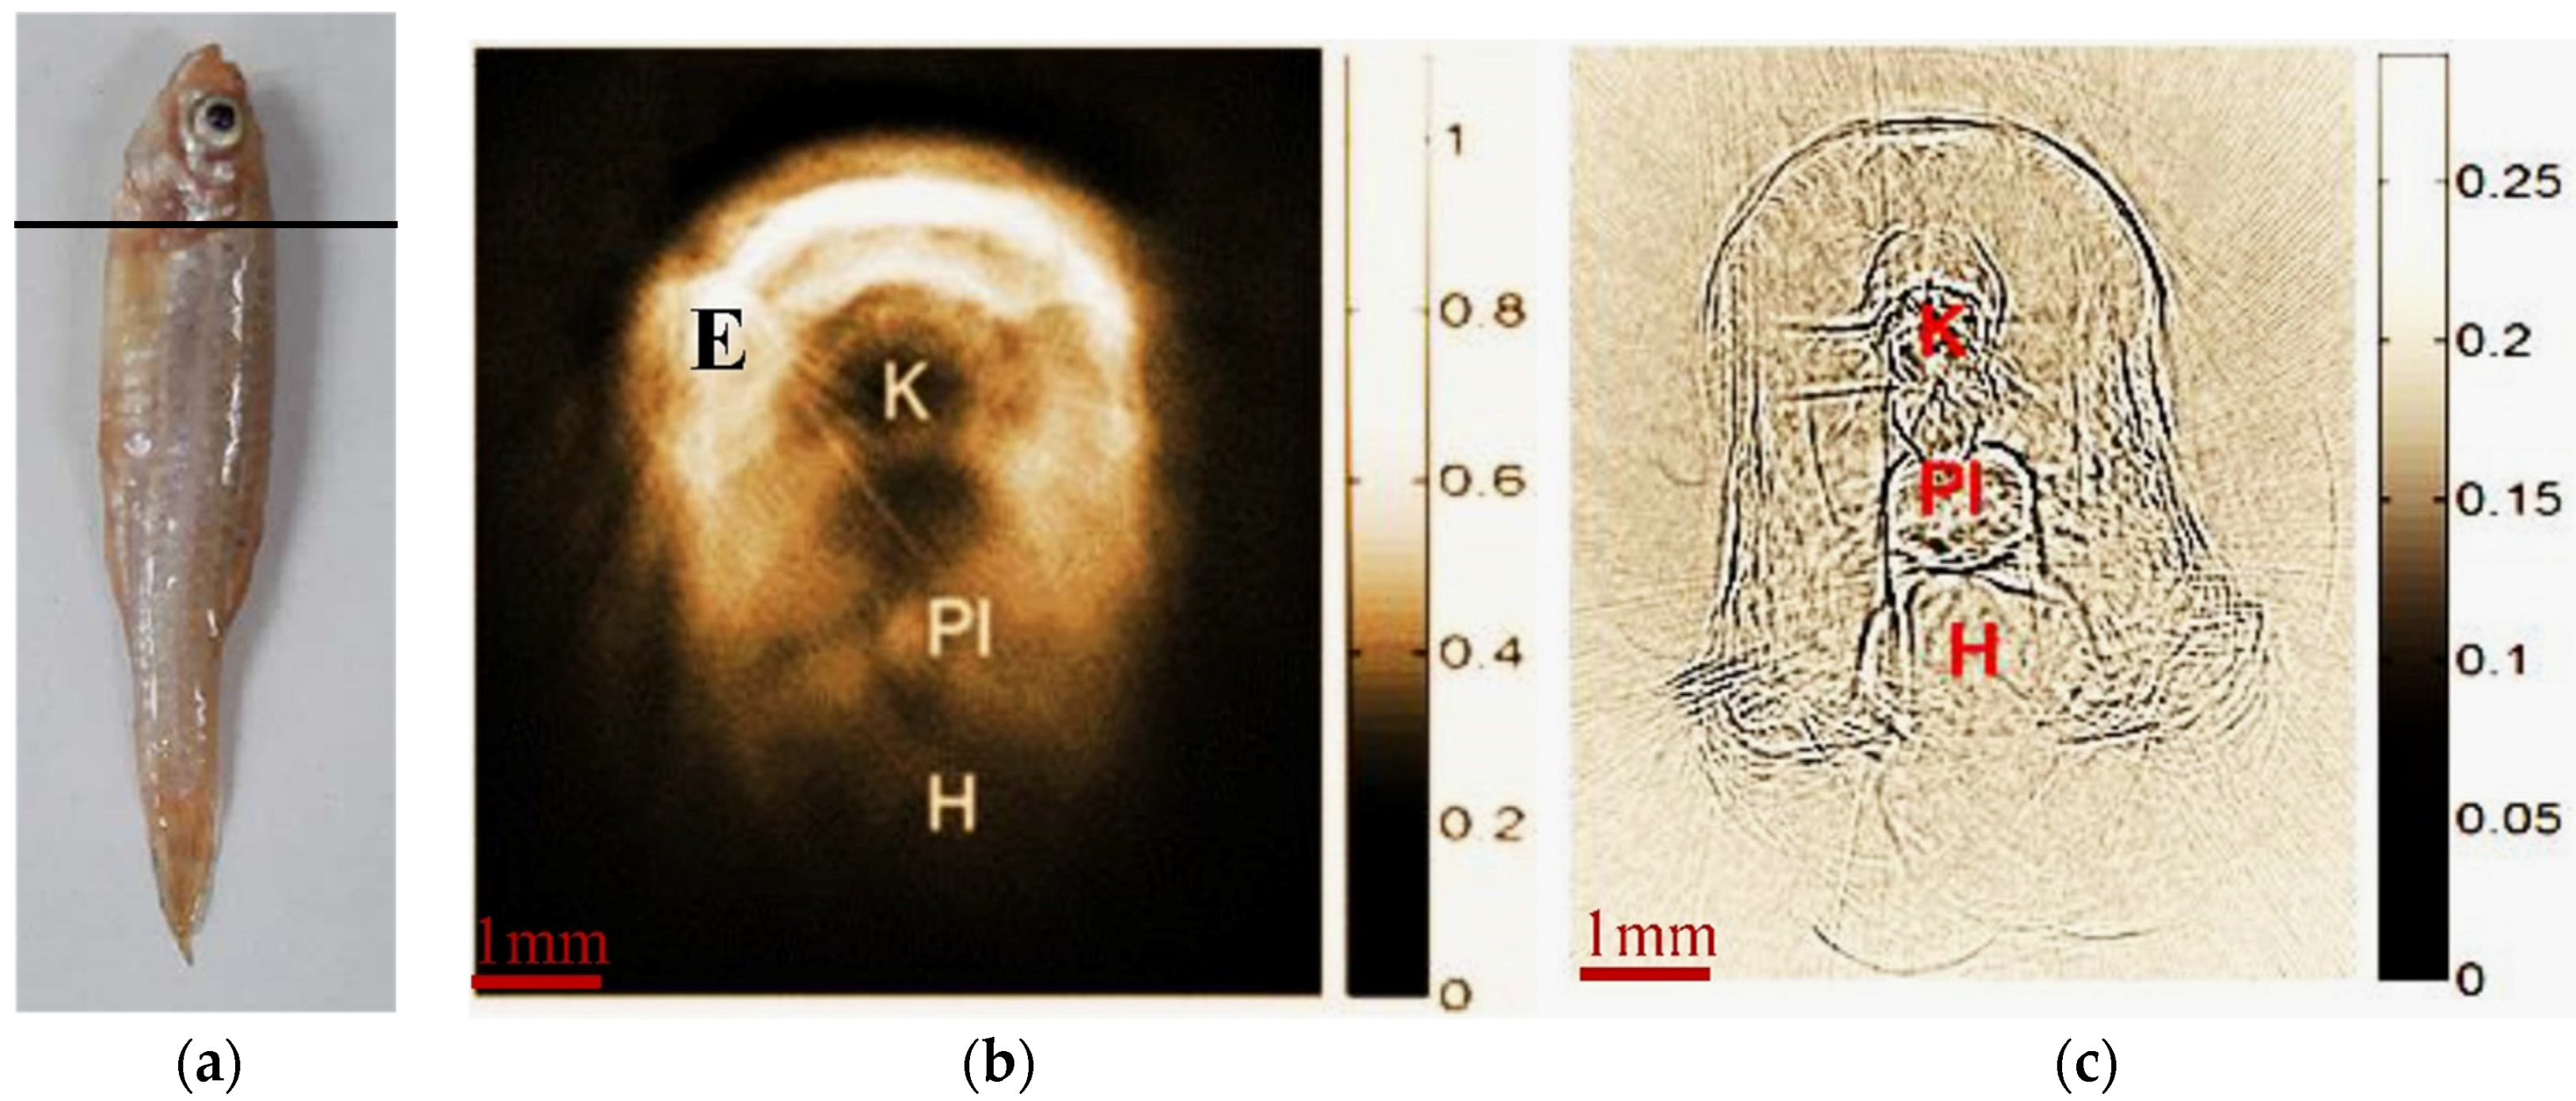
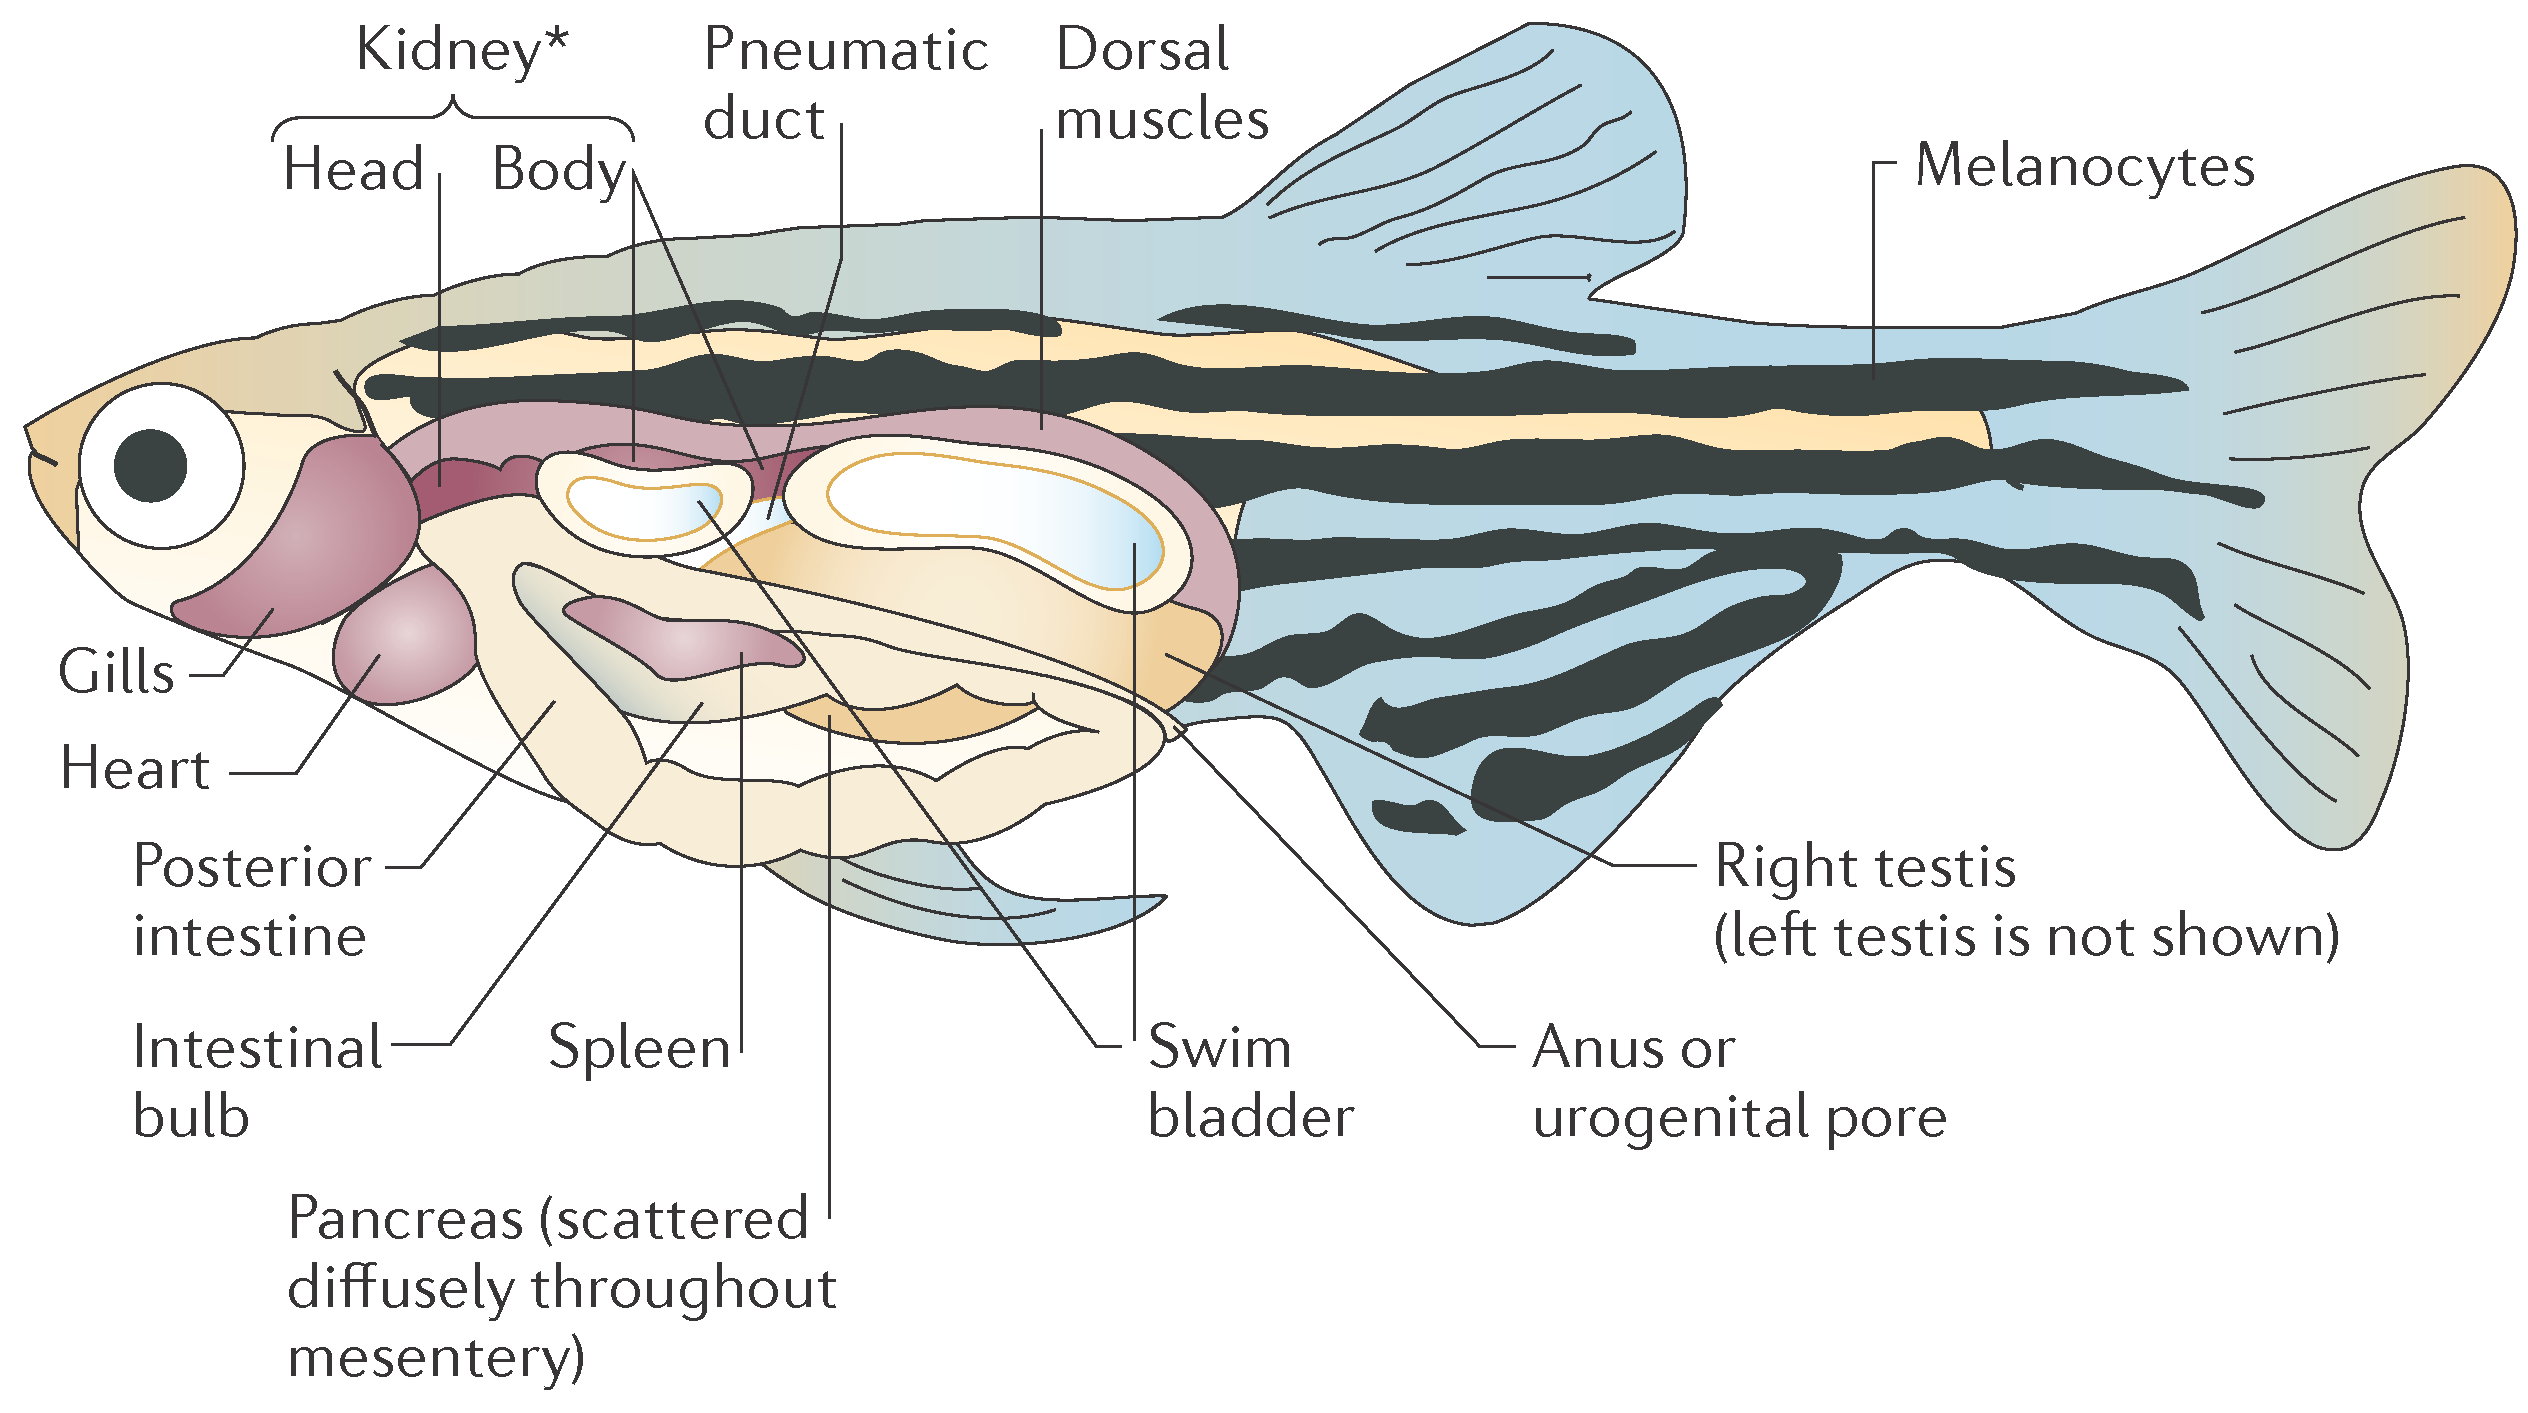
2.3. Photoacoustic Imaging of Adult Zebrafish

In this study, a wild-type zebrafish (male, four months old) was utilized for the in vivo tests. The anatomy for a very similar adult zebrafish is provided in Figure 3. The in vivo experiments were performed in compliance with the guidelines on animal research stipulated by the Animal Care and Use Committee at the University of Macau (identification code: Approved Protocol for MYRG MYRG2014-00093-FHS; date of approval: 1 October 2015). Before PA imaging, the fish were first anesthetized with 0.01% MS-222 in system water until it became unresponsive to touch. Subsequently, the fish body was embedded into a solid cylindrical phantom without covering its head. The phantom materials consisted of Intralipid as a scatterer and India ink as an absorber, with agar powder (1%–2%) to solidify the Intralipid and India ink solution [16].

3. Results and Discussion

The PA imaging results from the phantom test are shown in Figure 2a–e, where Figure 2b,c exhibit the recovered maps using the unfocused and focused 10 MHz transducer, respectively. It is evident from Figure 2 that the human hairs embedded in the phantom were clearly identified with submillimeter resolution using our PA imaging system. By estimating the full width at half maximum (FWHM) of the specific profiles for the images shown in Figure 2b,c, we discovered the recovered object size for a single hair was 0.2 mm (Figure 2d) and 0.08 mm (Figure 2e), respectively, for the unfocused and focused case. As expected, the reconstruction results with an unfocused transducer overestimated the target size because the measured size of the human hair size is around 0.1 mm. It is also evident from Figure 2 that, compared to the recoveries from the unfocused transducer, the imaging contrast of the hair to the background media based on the focused transducer was considerably reduced.
For the in vivo experiment, the PA imaging results from the different sections of an adult zebrafish are displayed in Figure 4, Figure 5 and Figure 6 by using the unfocused and focused high-frequency ultrasound transducers. We discovered from the imaging results in Figure 4b, Figure 5b, and Figure 6b that the major organs were clearly identified with high contrast using the unfocused ultrasound transducer. However, the detailed regional structures within the different organs were not clearly revealed due to the low resolution of the recovered PA images using the unfocused transducer.
By contrast, this is not the case for the PA images in Figure 4c, Figure 5c, and Figure 6c, which were reconstructed based on the focused high-frequency transducer. Interestingly, the location, size and detailed regional morphological information of the eyes, and other inner organs were effectively recovered, which is in good agreement with the anatomy of adult zebrafish in Figure 3. In particular, we discovered that the generated PA images from the focused high-frequency transducer enable us to more accurately characterize the sizes, locations, and shapes of the internal organs, compared to those from the unfocused one. The downside of the PA images generated with the focused transducer is that the contrast for the regional structures is worsened, compared to those from the unfocused one.
Interestingly, Figure 4 shows the reconstructed PA images from the top section of the zebrafish. The black line in Figure 4a denotes the imaging slice of adult zebrafish, whereas Figure 4b,c display the PA images reconstructed with the unfocused and focused transducer, respectively. Very specifically, the recovered PA images from the unfocused transducer have a higher contrast but a lower resolution, while the recovered PA images from the focused transducer exhibit higher resolution but lower contrast.
Figure 5 and Figure 6 show the PA images of different body sections of the adult zebrafish. Again, we found the kidney, heart, posterior intestine, mid intestine, dorsal muscles, intestinal bulb, and swim bladder were reconstructed with more detailed structures and good shapes when the focused transducer was used, but the imaging contrast for these recoveries was reduced.
It is essential to compare the imaging sensitivity including the contrast and resolution between the used focused and unfocused high-frequency ultrasound transducers in PAT. In this study, in vivo experiments were performed to examine and compare the performance of the focused and unfocused high-frequency transducers that can be employed for high-resolution PA imaging of adult zebrafish. The imaging results showed that the PA images recovered using focused and unfocused transducers exhibited different resolutions and contrasts, and a high PA imaging resolution and a low imaging contrast were revealed for the focused case. We think this is due to different bandwidths from different transducers, where the focused one was identified to have the narrow bandwidth, low PA signal strength, and high boundary noise. After combining two PA images recovered from both the focused and unfocused high-frequency transducers, we can obtain more comprehensive and more accurate structural information of the zebrafish that match its anatomy in Figure 3 very well. These in vivo results validate the merits and limitations of the used focused and unfocused transducers for PA imaging of adult zebrafish. Further work is warranted to perform histology analysis to confirm the PA findings.

Acknowledgments

This study was supported by grants MYRG2014-00093-FHS, MYRG 2015-00036-FHS and MYRG2016-00110-FHS from the University of Macau in Macau and grants FDCT 026/2014/A1 and FDCT 025/2015/A1 from the Macao government. We also thank Wei Ge at Faculty of Health Sciences with the University of Macau for providing the zebrafish and technical support for in vivo animal experiments.

Author Contributions

Y.L. and Z.Y. developed the PAT system and wrote the manuscript. Y.L., D.L., and Z.Y. contributed to the design of experiments and processed the data. Z.Y. and D.L. performed all experiments. All authors read and edited the manuscript.

Conflicts of Interest

The authors declare no conflict of interest.

References

  1. Ye, S.; Yang, R.; Xiong, J.; Shung, K.K.; Zhou, Q.; Li, C.; Ren, Q. Label-free imaging of zebrafish larvae in vivo by photoacoustic microscopy. Biomed. Opt. Express 2012, 3, 360–365. [Google Scholar] [CrossRef] [PubMed]
  2. Ma, R.; Distel, M.; Deán-Ben, X.L.; Ntziachristos, V.; Razansky, D. Non-invasive whole-body imaging of adult zebrafish with optoacoustic tomography. Phys. Med. Biol. 2012, 57, 7227–7237. [Google Scholar] [CrossRef] [PubMed]
  3. Krumholz, A.; Shcherbakova, D.M.; Xia, J.; Wang, L.V.; Verkhusha, V.V. Multicontrast photoacoustic in vivo imaging using near-infrared fluorescent proteins. Sci. Rep. 2014, 4, 3939. [Google Scholar] [CrossRef] [PubMed]
  4. Huang, N.; Guo, H.; Qi, W.; Zhang, Z.; Rong, J.; Yuan, Z.; Ge, W.; Jiang, H.; Xi, L. Whole-body multispectral photoacoustic imaging of adult zebrafish. Biomed. Opt. Express 2016, 7, 3543–3550. [Google Scholar] [CrossRef] [PubMed]
  5. Li, G.; Li, L.; Zhu, L.; Xia, J.; Wang, L.V. Multiview Hilbert transformation for full-view photoacoustic computed tomography using a linear array. J. Biomed. Opt. 2015, 20, 066010. [Google Scholar] [CrossRef] [PubMed]
  6. White, R.; Sessa, A.; Burke, C. Transparent adult zebrafish as a tool for in vivo transplantation analysis. Cell Stem Cell 2008, 2, 183–189. [Google Scholar] [CrossRef] [PubMed]
  7. O’Brien, G.S.; Rieger, S.; Martin, S.M.; Cavanaugh, A.M.; Portera-Cailliau, C.; Sagasti, A. Two-photon axotomy and time-lapse confocal imaging in live zebrafish embryos. J. Vis. Exp. 2009, 24. [Google Scholar] [CrossRef]
  8. Liu, Y.; Jiang, H.; Yuan, Z. Two schemes for quantitative photoacoustic tomography based on Monte Carlo simulation. Med. Phys. 2016, 43, 3987–3997. [Google Scholar] [CrossRef] [PubMed]
  9. Zhang, J.; Liu, J.; Wang, L.M.; Li, Z.Y.; Yuan, Z. Retroreflective-type Janus microspheres as a novel contrast agent for enhanced optical coherence tomography. J. Biophotonics 2016. [Google Scholar] [CrossRef] [PubMed]
  10. Zhang, J.; Zhang, Z.W.; Ge, W.; Yuan, Z. Long-term in vivo monitoring of injury induced brain regeneration of the adult zebrafish by using spectral domain optical coherence tomography. Chin. Opt. Lett. 2016, 14, 081702. [Google Scholar] [CrossRef]
  11. Liu, Y.; Yuan, Z. Multi-spectral photoacoustic elasticity tomography. Biomed. Opt. Express 2016, 7, 3323–3334. [Google Scholar] [CrossRef] [PubMed]
  12. Liu, Y.; Yuan, Z. Dual-modality imaging of the human finger joint systems by using combined multi-spectral photoacoustic computed tomography and ultrasound computed tomography. Biomed. Res. Int. 2016. [Google Scholar] [CrossRef]
  13. Zhang, J.; Chen, H.; Zhou, T.; Wang, L.; Gao, D.; Zhang, X.; Liu, Y.; Wu, C.; Yuan, Z. A PIID-DTBT based semiconducting polymer dot with broad and strong optical absorption in the visible-light region as a highly-effective contrast agent for multiscale and multi-spectral photoacoustic imaging. Nano Res. 2016. [Google Scholar] [CrossRef]
  14. Liu, M.; Schmitner, N.; Sandrian, M.G. In vivo three-dimensional dual wavelength photoacoustic tomography imaging of the far red fluorescent protein E2-Crimson expressed in adult zebrafish. Biomed. Opt. Express 2013, 4, 1846–1855. [Google Scholar] [CrossRef] [PubMed]
  15. Ma, T.; Zhang, X.; Chiu, C.T.; Chen, R.; Shung, K.K.; Zhou, Q.; Jiao, S. Systematic study of high-frequency ultrasonic transducer design for laser-scanning photoacoustic ophthalmoscopy. J. Biomed. Opt. 2014, 19, 016015. [Google Scholar] [CrossRef] [PubMed]
  16. Yuan, Z.; Zhang, Q.; Sobel, E.; Jiang, H. Image-guided optical spectroscopy in diagnosis of osteoarthritis: A clinical study. Biomed. Opt. Express 2010, 1, 74–86. [Google Scholar] [CrossRef] [PubMed]
  17. White, R.; Rose, K.; Zon, L. Zebrafish cancer: The state of the art and the path forward. Nat. Rev. Cancer 2013, 13, 624–636. [Google Scholar] [PubMed]
Figure 1. Experimental configuration of the photoacoustic tomography (PAT) system. OPO: Optical Parametric Oscillator; OSC: Oscilloscope; P/R: Pulser/Receiver; BS: Beam Splitter; CL: Convex Lens; FOB: Fiber Optics bundle; RT: Rotary Table; T: Transducer; OF: Optical Fiber.
Applsci 06 00392 g001
Figure 2. Photograph of the phantom used for the phantom test (a); the photoacoustic (PA) images recovered by using the 10 MHz unfocused transducer (b) and focused one (c). The imaging profiles were plotted along the center of one hair for the unfocused transducer (d) and focused one (e). The axis (bottom) denotes the spatial scale in mm whereas the axis (left) records the PA signals in a relative unit.
Applsci 06 00392 g002
Figure 3. The anatomy of a typical adult zebrafish. Reproduced with permission from [17], Copyright Nature Publishing Group, 2013.
Applsci 06 00392 g003
Figure 4. (a) The photograph of the adult zebrafish, in which the black line denotes the imaging slice of the zebrafish. The PA images were recovered using a 10 MHz unfocused transducer (b) and a focused one (c). Here, E represents the eye and B denotes the brain. The gray scale (right) records the PA signals in a relative unit, whereas the color scale (right) illustrates the spatial scale, in mm.
Applsci 06 00392 g004
Figure 5. (a) The photograph of the adult zebrafish, in which the black line denotes the imaging slice of the zebrafish. The PA images were recovered using a 10 MHz unfocused transducer (b) and a focused one (c). Here, K denotes kidney, P denotes posterior intestine, H denotes heart, and E denotes eyes. The gray scale (right) records the PA signals in a relative unit, whereas the color scale (right) illustrates the spatial scale, in mm.
Applsci 06 00392 g005
Figure 6. (a) The photograph of the adult zebrafish, in which the black line denotes the imaging slice of the zebrafish. The PA images were recovered by using 10 MHz unfocused transducer (b) and focused one (c). Here DM denotes dorsal muscles, SB denotes swim bladder, IB denotes intestinal bulb, PI denotes posterior intestine, and MI denotes mid intestine. The gray scale (right) records the PA signals in a relative unit whereas the color scale (right) illustrates the spatial scale, in mm.
Applsci 06 00392 g006

