
Prediction of Cone Crusher Performance Considering Liner Wear

1
School of Mechanical Engineering, Shanghai Jiao Tong University, Shanghai 200240, China
2
State Key Laboratory of Mechanical System and Vibration, Shanghai Jiao Tong University, Shanghai 200240, China
*
Author to whom correspondence should be addressed.
Appl. Sci. 2016, 6(12), 404; https://doi.org/10.3390/app6120404
Submission received: 26 September 2016
/
Revised: 21 November 2016
/
Accepted: 29 November 2016
/
Published: 3 December 2016
Abstract
:Cone crushers are used in the aggregates and mining industries to crush rock material. The pressure on cone crusher liners is the key factor that influences the hydraulic pressure, power draw and liner wear. In order to dynamically analyze and calculate cone crusher performance along with liner wear, a series of experiments are performed to obtain the crushed rock material samples from a crushing plant at different time intervals. In this study, piston die tests are carried out and a model relating compression coefficient, compression ratio and particle size distribution to a corresponding pressure is presented. On this basis, a new wear prediction model is proposed combining the empirical model for predicting liner wear with time parameter. A simple and practical model, based on the wear model and interparticle breakage, is presented for calculating compression ratio of each crushing zone along with liner wear. Furthermore, the size distribution of the product is calculated based on existing size reduction process model. A method of analysis of product size distribution and shape in the crushing process considering liner wear is proposed. Finally, the validity of the wear model is verified via testing. The result shows that there is a significant improvement of the prediction of cone crusher performance considering liner wear as compared to the previous model.
1. Introduction
Cone crusher performance is usually defined by the terms particle size distribution (PSD), capacity and particle shape. In this paper, the crusher performance refers to PSD and particle shape. While the cone crusher is working, the mantle moves around the axis of the crushing chamber. As the mantle swings between the closed and open sides, the rock material is squeezed and crushed between two liners. When rock material is getting crushed in the crushing chamber, there is pressure on the liner, which leads to more serious liner wear over time. The geometry of crushing chamber is crucial for the performance. Due to wear, the geometry of the liner changes, which causes the close side setting (CSS) to gradually increase. Hence, cone crusher performance is affected by gradually deteriorating performance over time [1,2,3]. This will affect the PSD curve and the flakiness index curve [4,5]. Thus, in order to compensate the working process of liner wear and enhance its working performance, it is meaningful for studying the impact of liner wear on cone crusher performance.
Evertsson [6,7] developed a flow model, a size reduction model and a pressure response model, which made it possible to model the behavior of a cone crusher [8,9,10,11]. Some researchers have investigated the wear model of crushers [12]. Lindqvist and Evertsson [13] showed that the liner wear is proportional to the crushing pressure, which is mainly dependent on compression ratio and particle size distribution index. Rahul [14] performed experiments based on full factorial design adopted from statistical modelling software, and the input parameters like load, sliding distance, hardness of coal, and hardness of liner material are taken into consideration, and weight loss was considered as the output response. Lindqvist and Evertsson [15] introduced the method of calculating the compression ratio and the pressure distribution angle of each crushing zone, which were key parameters for calculating the distribution of the pressure on the liner. In addition, a wear model was developed by Lindqvist [16]. Recently, wear prediction using Discrete Element Method (DEM) was proposed [17] with a wear model to predict wear on the liner of a mill, obtaining very good agreement using an abrasion measure as the wear predictor. Delaney and Morrison [18] present computational simulation results of a new DEM breakage model for an industrial cone crusher. The model incorporates non-spherical particles represented as superquadrics, which are broken based on the compressive energy at a contact into non-spherical progeny particles. Asbjörnsson [1] presented a wear function with data obtained from an actual crusher operating at gradually increasing CSS. Therefore, it is very meaningful to further study the effect of liner wear on cone crusher performance.
The main objective of the present work is to investigate how the liner wear affects cone crusher performance using the crushing plant test. A model relating a coefficient of material hardness, compression ratio and particle size distribution to a corresponding pressure is presented. Then, combining the empirical model for predicting liner wear with time parameter, a new wear prediction model is proposed. The model is important for predicting cone crusher performance along with liner wear. This work can be used for improving cone crusher performance. In addition, this paper describes a method for modelling cone crusher performance along with liner wear. The results of crushing plant test are compared with the corresponding results from the prediction.
2. Experimental Setup
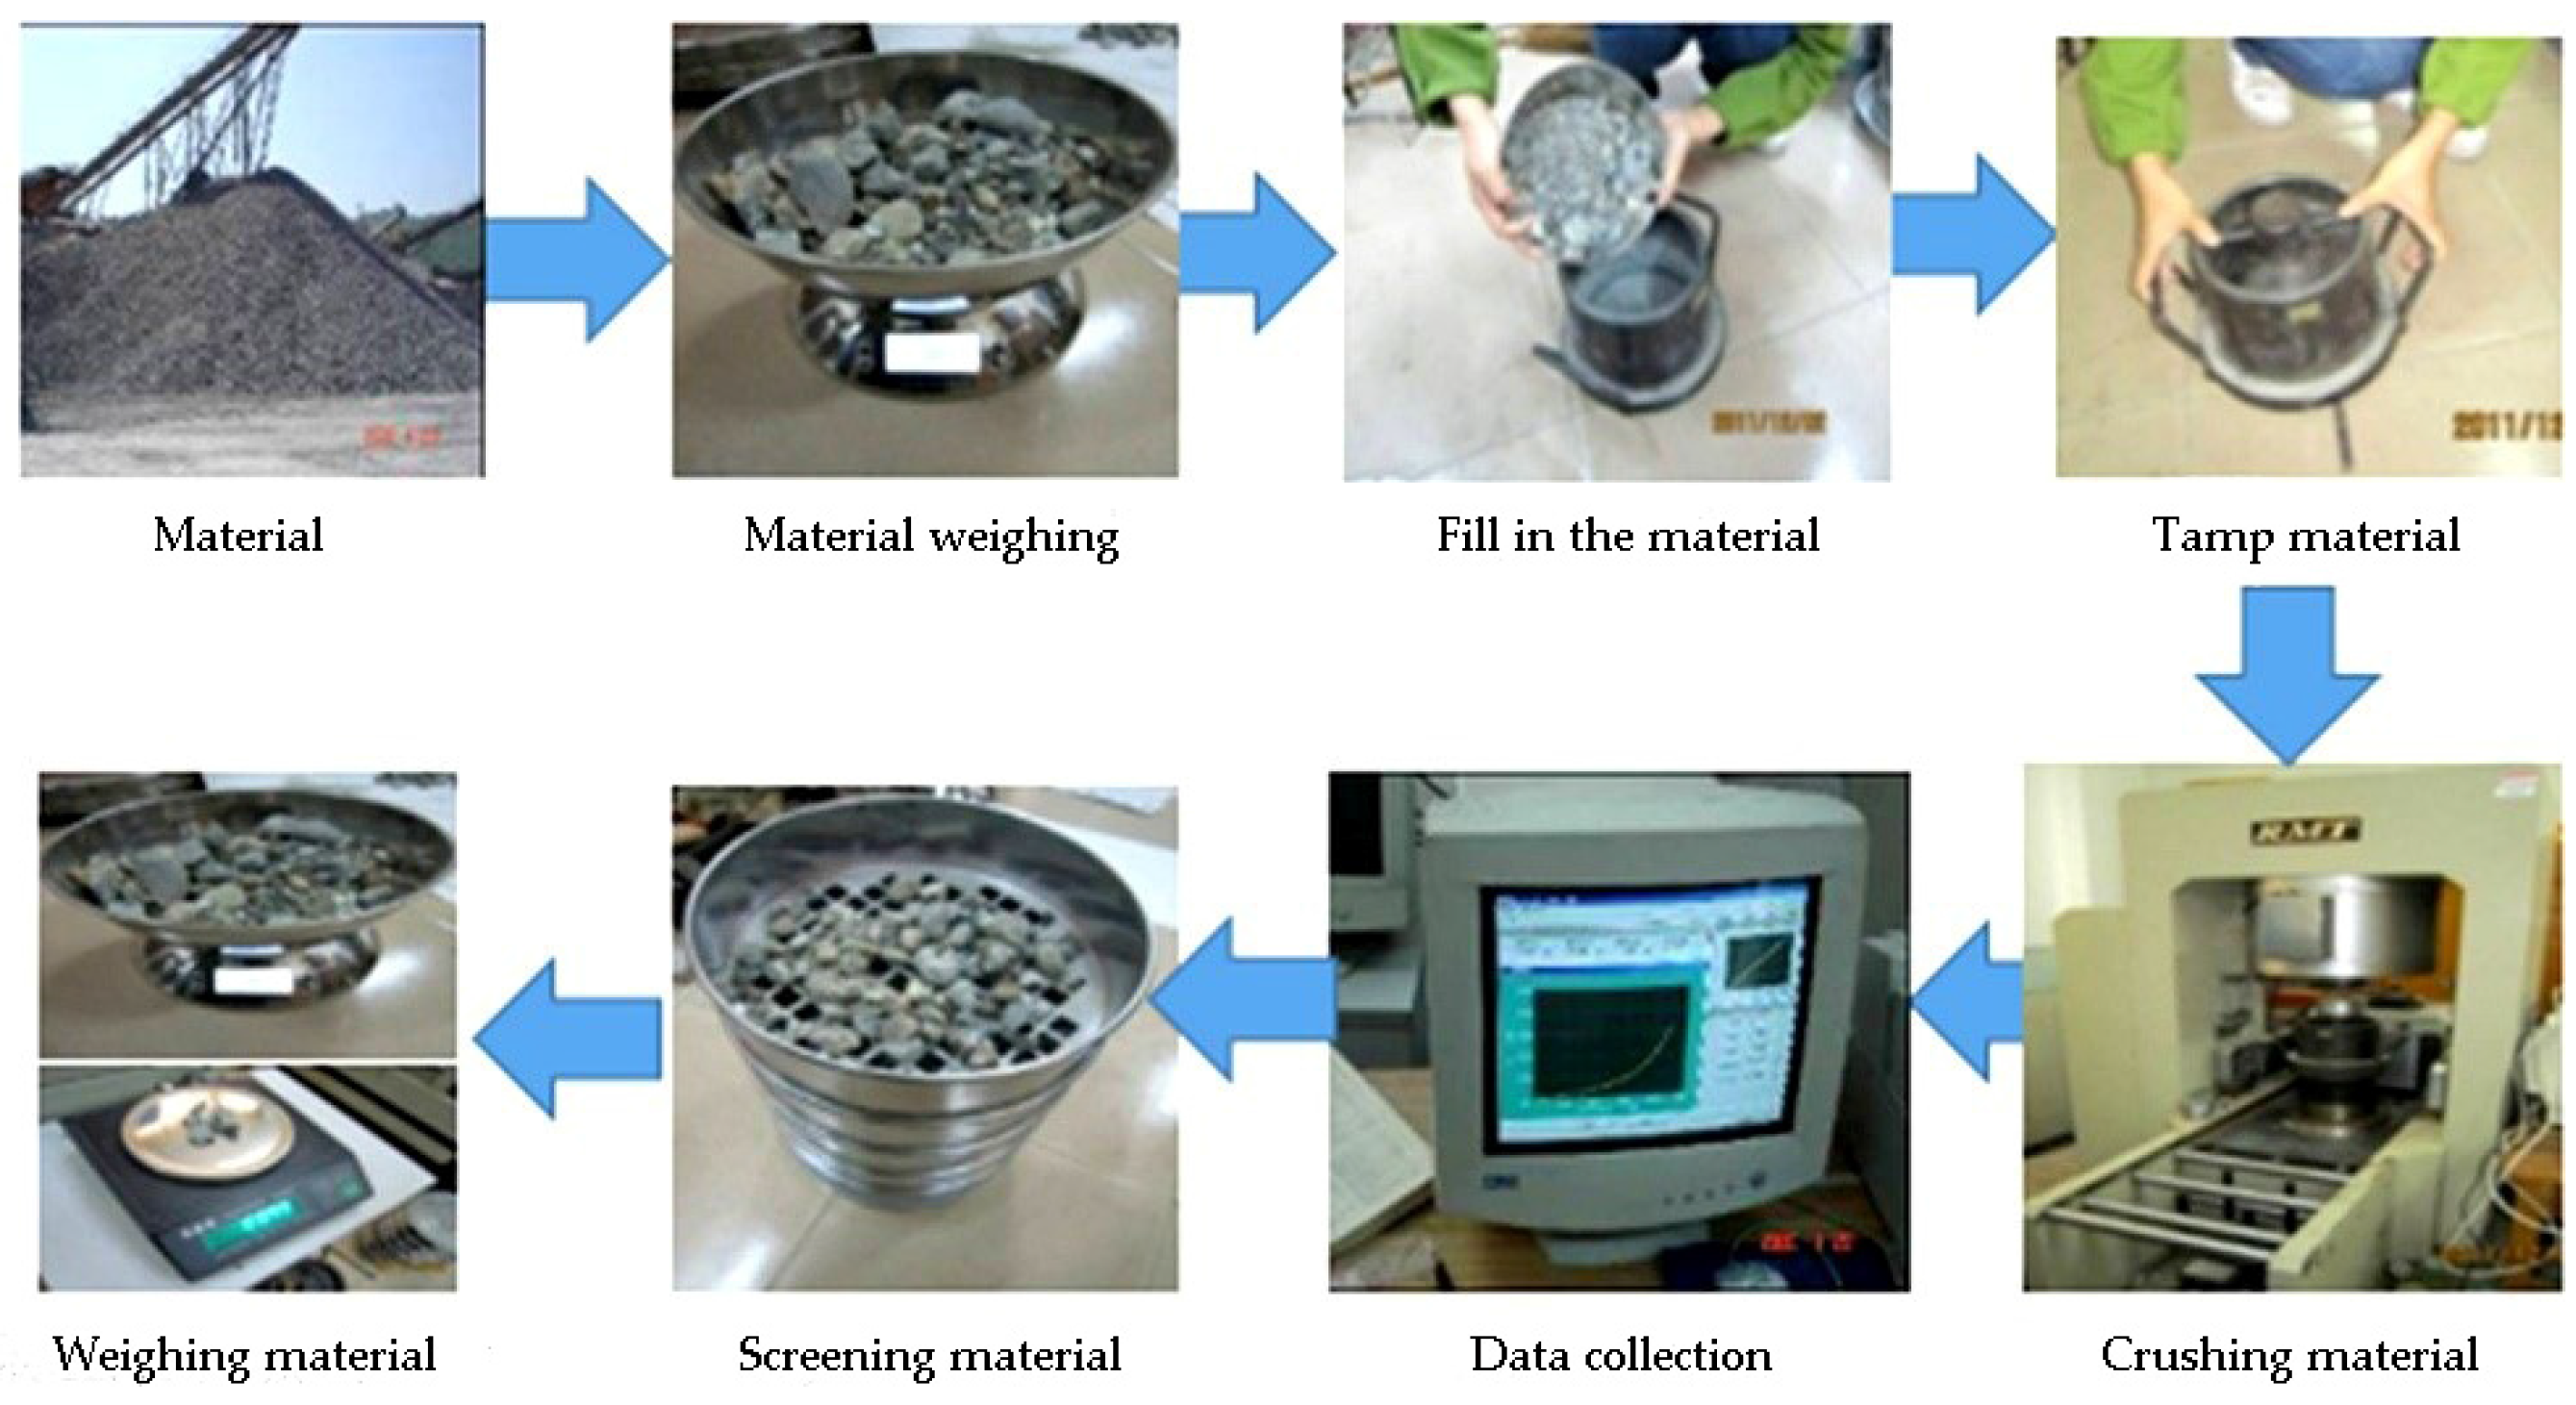
In order to improve cone crusher output, the modern cone crusher chamber should guarantee that the rock in the crushing chamber be crushed by interparticle breakage and flow through the chamber via free falling [6,19,20]. In the process of crushing, rock material enters the crushing chamber and keeps falling until it reaches the choke level. As the mantle moves away from the concave, the rock material becomes loose and falls again. Then rock material meets the mantle and is pushed against the concave by the mantle. The rock material is squeezed and crushed between the liners. After several cycles, the crushed rock material falls out of the crushing chamber. All traces of the particle in the crushing chamber can be obtained. Based on kinematics of free falling, the chamber was studied by dividing it into several crushing zones [21]. To obtain the pressure model, the corresponding experiments were designed and performed with a RMT-150B rock mechanics testing system (Chinese Academy of Sciences, Wuhan, China). In Figure 1, the RMT-150B rock mechanics testing system, a cylindrical container (Chinese Academy of Sciences, Wuhan, China) and a standard sieve (Zhejiang Yingchao Instrument Co. Ltd., Shaoxing, China) are shown. The rock material (Shanghai Jianshe Luqiao Machinery Co. Ltd., Shanghai, China) was compressed in the cylindrical container. The height and the diameter of the container were 110 mm and 150 mm. The particle size distribution was measured with the standard sieve. The experiment was designed to simulate the conditions to which a volume of material was subjected in a real crushing chamber using the RMT-150B rock mechanics testing system, which can crush rock material according to the experimental parameters including compression velocity and compression ratio. The control system of the RMT-150B rock mechanics testing system is capable of recording compression pressure and stroke data.
The material chosen for the experiment is basalt, granite, iron ore and limestone, taken from a quarry in northern China where the Shanghai Jianshe Luqiao Machinery Co. Ltd. has a test plant. The first experiment in each series was performed on a sized material of fraction +9.5−31.5 mm. The remaining experiments were done on the material originating from preceding experiments. The experiments were carried out as shown in Figure 1. The particle size distribution of the material was measured first, then the rock material was piled into the container. The container was shaken so that the rock material was distributed in the container evenly and the top surface of rock material was flattened. The bed height was measured, then the container was set in the RMT-150B. The experimental parameters including compression velocity and compression ratio were set. After compression the particle size distribution was measured with sieves, and the results were recorded. Subsequently, the steps above were repeated until the rock material could not be compressed any more. After setting with a specific compression ratio, the compression ratio was changed to another given value and the whole process above was repeated.
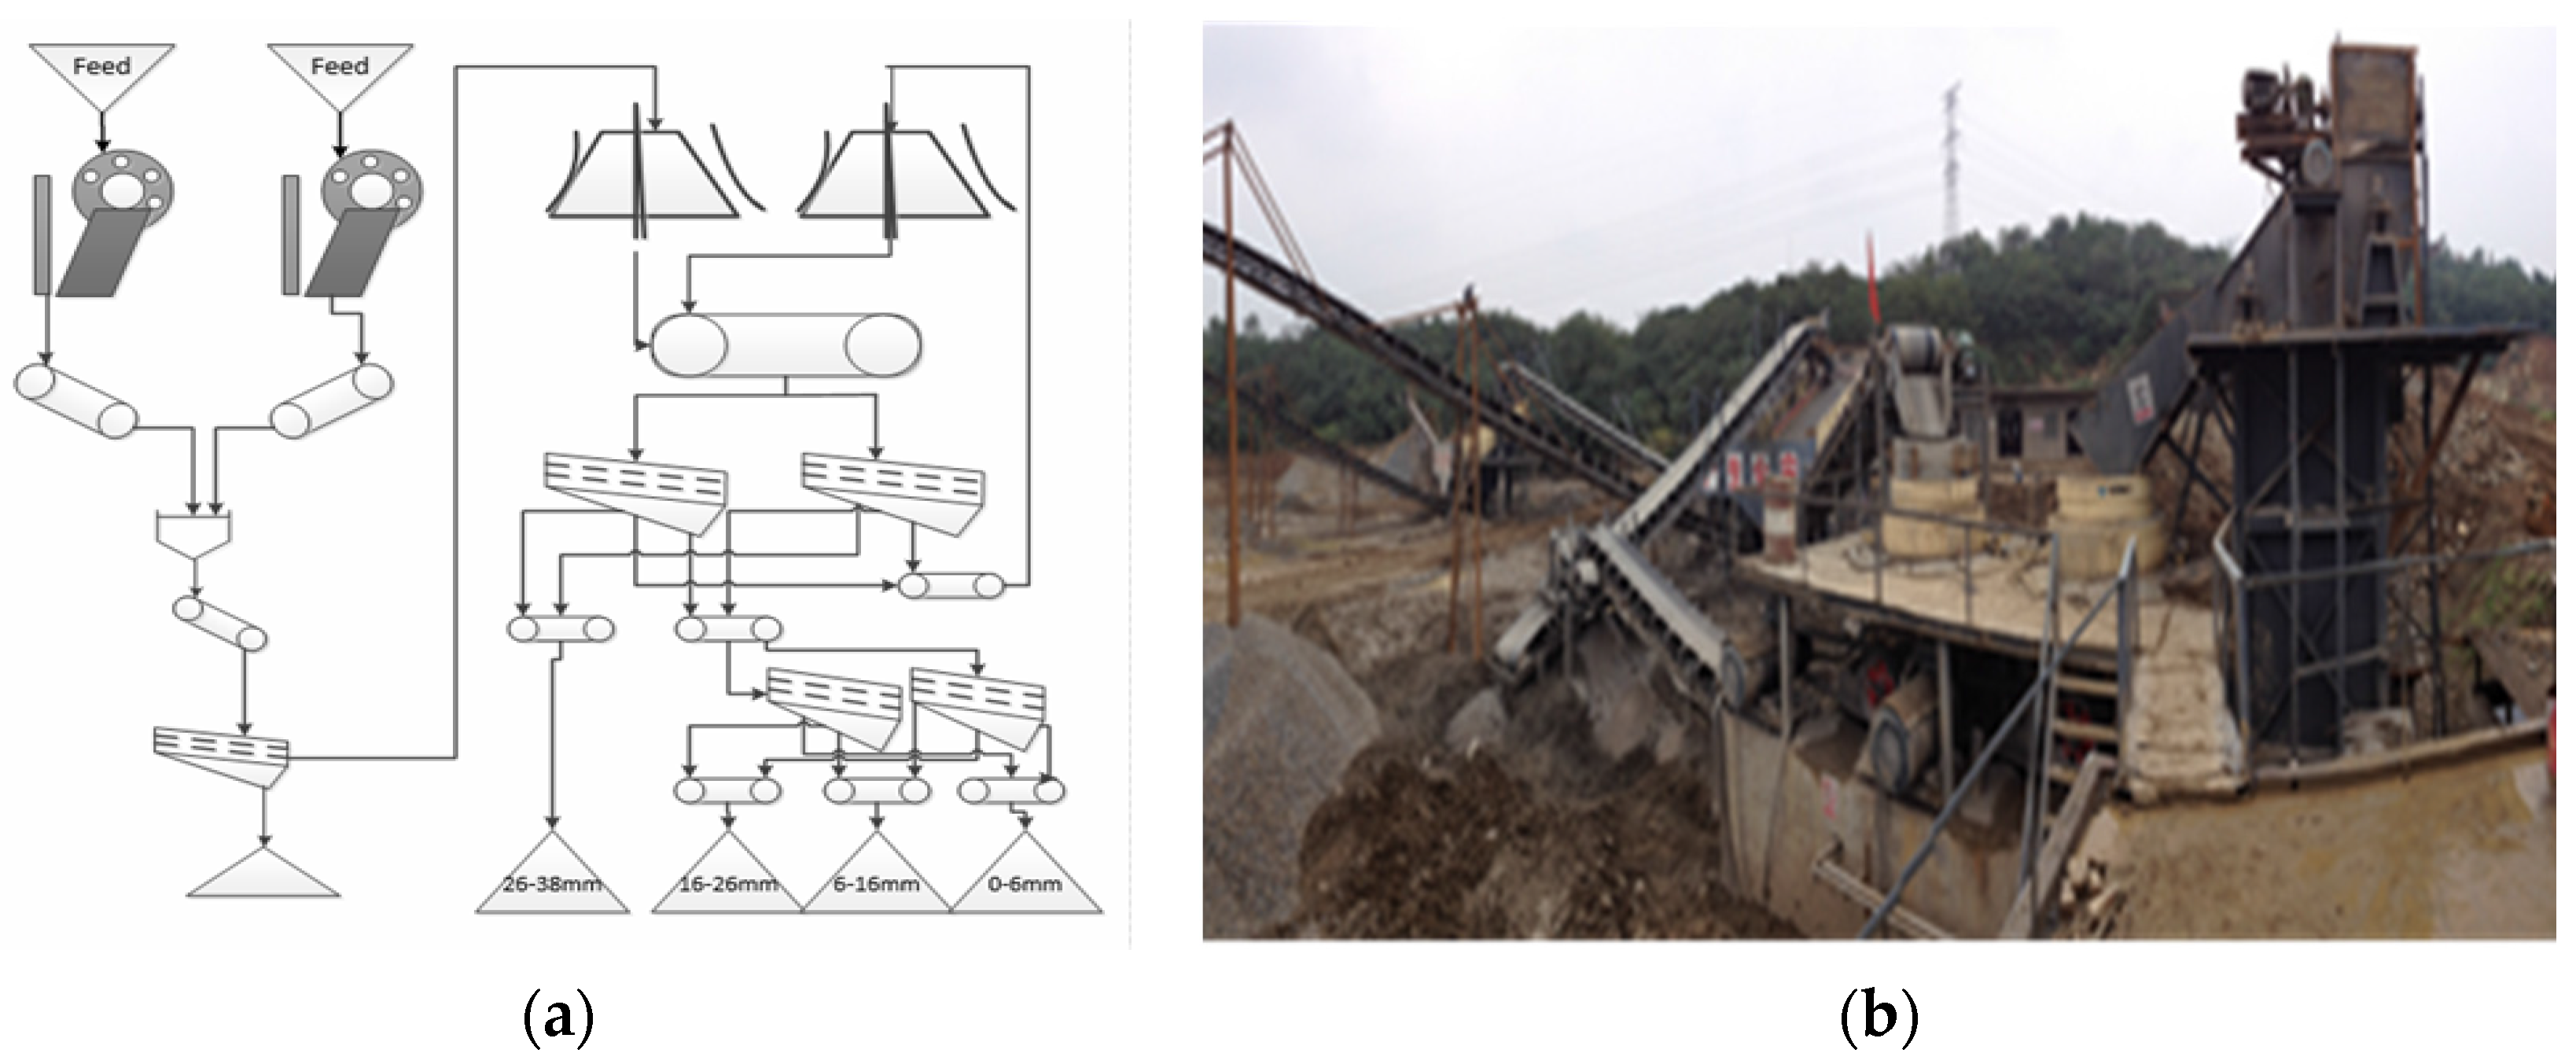
In order to study changes of cone crusher performance along with liner wear, a series of experiments were conducted on processing the full scale crushing plant located in Anhui province, China. The rock from Anhui province processed on this processing production line is used for road and building. This crushing plant is in a quarry that produces approximately 1,100,000 tons of aggregate each year, as is shown in Figure 2a,b. The crushing behavior of the quarry is similar to a mining plant. The compressive strength of Anshan stone (Anhui Huagang Quarry Co. Ltd., Maanshan, China) is 110–140 MPa. In its third crushing stage, the plant produces high-quality aggregate products, ranging in size from 0 mm to 38 mm. The cone crushers are equipped with medium chambers of VSC54-C (Shanghai Veking Heavy Industry Co. Ltd., Shanghai, China) and VSC54-F (Shanghai Veking Heavy Industry Co. Ltd., Shanghai, China), of which the feed size are 19–215 mm and 13–115 mm, respectively.
Specifically, the third crushing stage was studied. This final stage in the crushing plant produces high quality aggregate. The working time of actual production line is about 15 h per day; the experiment procedure was as follows: Firstly, the CSS was adjusted to initial value. Then, equipment of the plant was started, and rock materials were crushed. In order to compensate for wear and guarantee product quality, the adjustment of the CSS was implemented manually in 45 h intervals and took approximately 8–10 min. From 9:00 a.m. to 6:00 p.m., the totals of 27 samples were taken every 2 h, of which 4 samples were taken before the material crushing. The data of wear was obtained over time.
It is essential to minimize the production of particles sized 0 mm to 4.15 mm and to produce as many cubic particles as possible for all fraction sizes larger than 4.15 mm. Until recently, the flakiness index measured the flakiness by means of the Chinese standard T0312-2005. The flakiness index refers to the percentage of flaky particles, which is used to evaluate the particle shape.
3. Theoretical Models and Results
The crushing process was simulated in cone crusher chamber using the laboratory compression crushing experiment. After compression, the particle size distribution was measured with sieves. The results were recorded. Subsequently, the pressure data of materials related to different compression ratio and particle size distribution were obtained from the experiment. These experimental data can be used for the development of pressure model and wear models.
3.1. Pressure Model
The pressure model is supposed to describe the relationship between the pressure and the key factors including compression ratio and particle size distribution. The compression ratio is used to describe how much the rock material is compressed. Its value can be calculated using Equation (1). The size distribution index represents the particle size distribution of rock material. It can be calculated using Equations (2) and (3),
where s is the stroke of the RMT-150B rock mechanics testing system and its unit is mm, b is the height of rock material in the container and its unit is mm, wj is the mass percentage of the material in size range j, j is the average size of the material in size range j and its unit is mm, m is the total number of size ranges, and is the average size of all material and its unit is mm. Generally, for cone crushers the value range of compression ratio is from 0 to 0.4 and the value range of size distribution index is from 0 to 1.
ε = s/b,
After every compression experiment the material is sieved. The pressure data related to different compression ratio and particle size distribution can be obtained from the experiments as shown in Table 1.
As the three variable factors can affect values of the compressive pressure, the relationship of materials between the pressure and the compressive ratio is analyzed qualitatively to observe the change trend of the pressure with the compressive ratio and compression strength. A second order polynomial is fitted to the test data in Table 1. These fitting curves are obtained as shown in Figure 3, and relationship between pressure of single factor multi-material crushing and compressive ratio can be analyzed as shown in Figure 3.
The crushing pressure increases with the increase of compressive ratio in the compression experiment. When the compression ratio is constant, pressure value of basalt is the largest of the four materials. The largest compression strength of crushing materials is basalt in the construction industry, and the value of compression strength of basalt is less than 350 MPa. Thereby, the relative coefficient of material hardness is determined by Equation (4).
where K is compression strength and its unit is MPa, λ is a relative coefficient of material hardness.
The scatter plots of pressure are obtained using the experimental data, and it is analyzed that the relationship between these parameters is nonlinear. The relationship between pressure and size distribution index is exponential change with the increase of compressive ratio. Therefore, based on nonlinear regression analysis of experimental data, the equation of pressure model was determined and the coefficients of the model were identified as shown in Equation (5).
where a1 = 1.0378, a2 = 0.3071, a3 = 7.8752, a4 = 0.8891, a5 = 1.1117.
The evaluation index of the fitting model is R-square and Adjusted R-square. The values of R-square and Adjusted R-square are 0.9871 and 0.9851 respectively, which shows that the model can better fit the experimental data. Four kinds of material pressure model are drawn respectively as shown in Figure 4.
Based on Figure 4, it can be concluded that the pressure will increase, while the size distribution index is increasing. That is because the smaller particles move into the interspace of bigger particles and protect them from getting crushed.
3.2. Wear Model
In compressive crushing, rock particles of various sizes are squeezed and crushed against the liner of the crushing chamber. The geometry of the crushing chamber is changed due to the wear of crusher liner, which is related with the types of rock material and the pressure distribution on the liner. In order to indicate the worn crusher liner influence on the product size distribution and shape change, it is necessary to know the previous research on wear model.
Lindqvist and Evertsson [15] developed a wear model to predict the worn geometry of cone crushers. In the model, it is proposed that wear is proportional to the maximum average pressure which occurs during the crushing event. The effect of shear forces along the crushing surfaces was implemented in the model. The wear is computed according to Equation (6).
Fn represents normal pressure at the surface, Fs represents shear-stress at the surface, here Q is a model parameter that scales the effect of the shear force when there is no slip, W is the wear resistance coefficient depending on the type of liner material and rock, and ∆ω is expressed in mm, pressure in MPa.
However, Equation (6) does not contain a time variable. Actually the liner wear is affected by some other factors, such as working time and the pressure of crushing zones. The liner wear not only concentrates near the point of the CSS but also distributes the surface of the liner.
In order to solve this problem, a new model of liner wear is proposed, as shown in Equation (7):
where ∆ωi(t) represents the wear loss of crushing zone i in t hours and its unit is mm, t represents the working time and its unit is hour , Fn,i represents the normal pressure of crushing zone i, Fs,i represents the shear-stress of crushing zone i, Fn,p represents the normal pressure near the point of the CSS, Fs,p represents the shear-stress near the point of the CSS, μ represents the wear rate depending on the amount of crushed material per hour, m(t) represents the crushed product and its unit is kg, pressure in MPa.
The Equation (7) is obtained combining the empirical model for predicting liner wear with the time parameter. The new model of liner wear contains the productivity variable which is a function of time variable. Therefore, this model can calculate liner wear with the crusher working, which provides a theoretical model for a significant improvement of the prediction of cone crusher performance considering liner wear.
3.3. Product Quality Model Considering Liner Wear
In mineral engineering, particle size and shape are two key factors that reflect the quality of product [22]. In previous research, the process of the material flowing through the crushing chamber could be modeled as a series of successive crushing events [20]. On the basis of this research and the wear model, equations were formulated for PSD as the liner wear. Size distribution of the final product can be described by Equations (8) and (9), as shown in:
where P(t) is the product size distribution of t time, K0 is the total number of all crushing zones, Si(t) is the selection function and Bi(t) is the breakage function. Si(t) and Bi(t) can be respectively obtained by relevant compression experiments. εi(t) is the compression ratio in the crushing zone i, which describes how much the rock material is compressed in the crushing zone i over time.
Piston and die tests were performed to obtain selection function and breakage function [12,23], which were determined by the compression ratio. The compression ratio in crushing zone could be calculated with parameters of the cone crusher structure and wear model. The basalt was used to study the selection function Si and breakage function Bi. The selection function model and breakage function model was developed, as shown in Equations (10) to (12):
where xmin is the minimum particle diameter of the feed material, x0 is the maximum particle diameter of the feed material, x is the particle diameter needed to solve the relevant weight percentage undersize passing, and the units of these variables are mm.
The model for particle shape prediction was firstly described by Bengtsson and Evertsson [24]. Dong and Fan [25,26] developed a model able to directly calculate the mass percentage of flakiness in the product. The particle shape is also affected by liner wear. Thus, a model of particle shape is developed considering liner wear as shown in Equations (13) and (14):
In this constitutive equation Pj is a component of the vector which represents the proportion of particles in the size range j compared to the total product, and n is the total number of size classes. is the average size of the particles in the size range j, and is the average particle size of the feed, FITOTAL is just the percentage of flakiness in the total product.
Based on the cone crusher design, the maximum compression ratio in each crushing zone was calculated and the compression ratio and size distribution index entered into the pressure model, thus, the pressure distribution in the first crushing zone could be achieved. Then, the pressure distribution in each crushing zone and working time of crusher was entered into the wear model, and the liner wear of crusher was emulated. The product size distribution and flakiness index considering liner wear could be obtained by the calculation of models established previously; see Equations (7) to (14). The PSD and particle shape could be estimated from the parameters of data obtained. In this process, it is assumed that the screening operation is ideal, which is a reasonable for assumption of the data normally used in the test. Therefore, cone crusher performance considering liner wear can be predicted using the method for calculating the PSD and particle shape.
4. Discussion
A two-variable selection function model and breakage function model were given in Equations (10) to (12) with t as parameter, and constants can be fitted to the experimental data. In order to investigate the effect of compression ratio and size distribution index on the change of the rock size in size reduction process, numerical calculation analysis of the selection function model and breakage function model are implemented. In Figure 5, it is obvious that the curvature of the selection function decreases with increase of size distribution index.
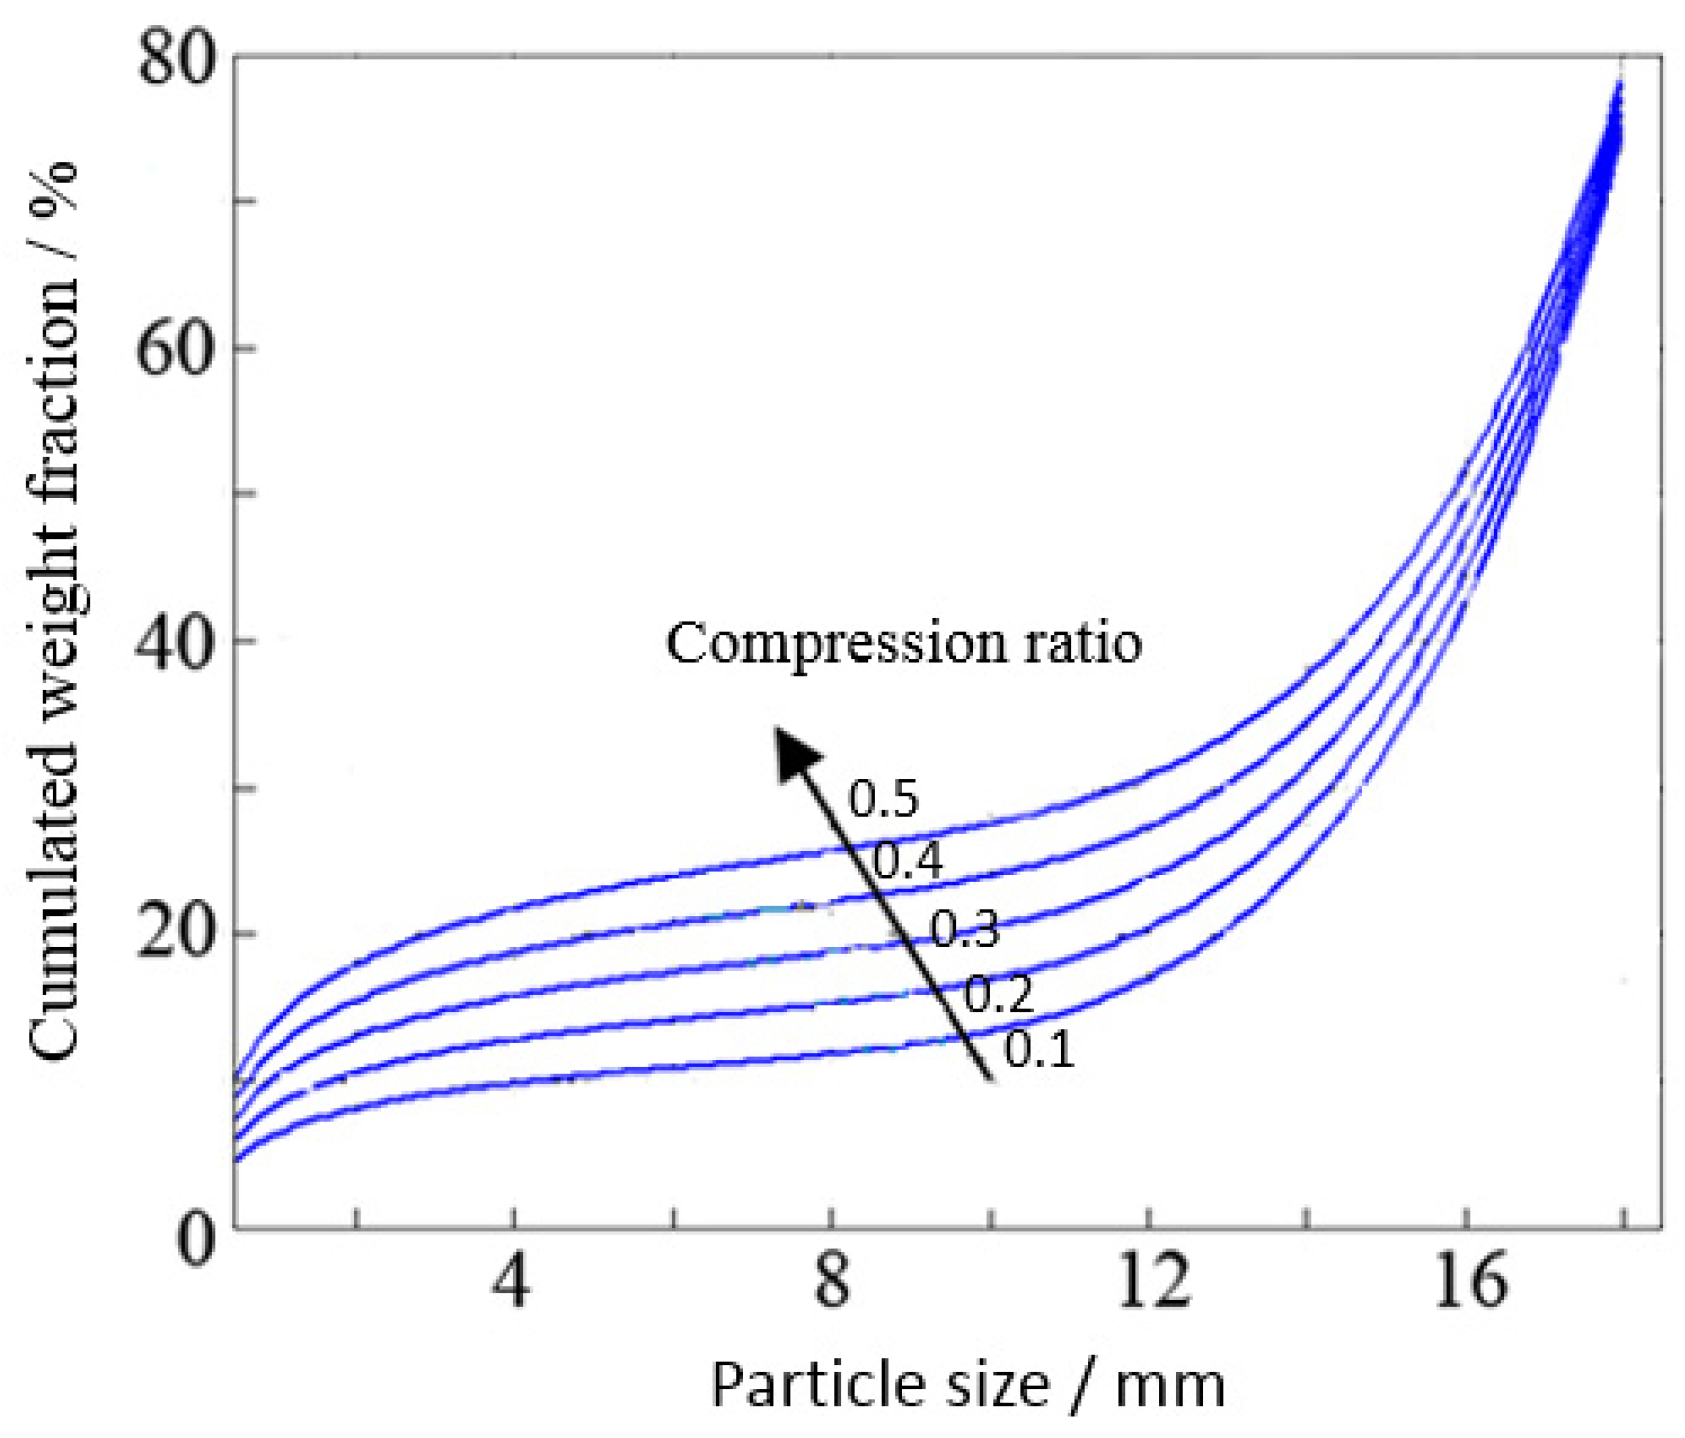
This means that the particle size is of more uneven distribution with an increase of size distribution index, which will result in a coarse particle not easily broken due to the protection of the tiny particle in the breakage of rock. In Figure 6, a curve denotes the weight percentage of undersized particles passing a certain particle size, which corresponds to representation of parameters in the breakage function and how they are affected by the compression ratio. The size reduction of particles is greatly improved when compression ratio is larger.
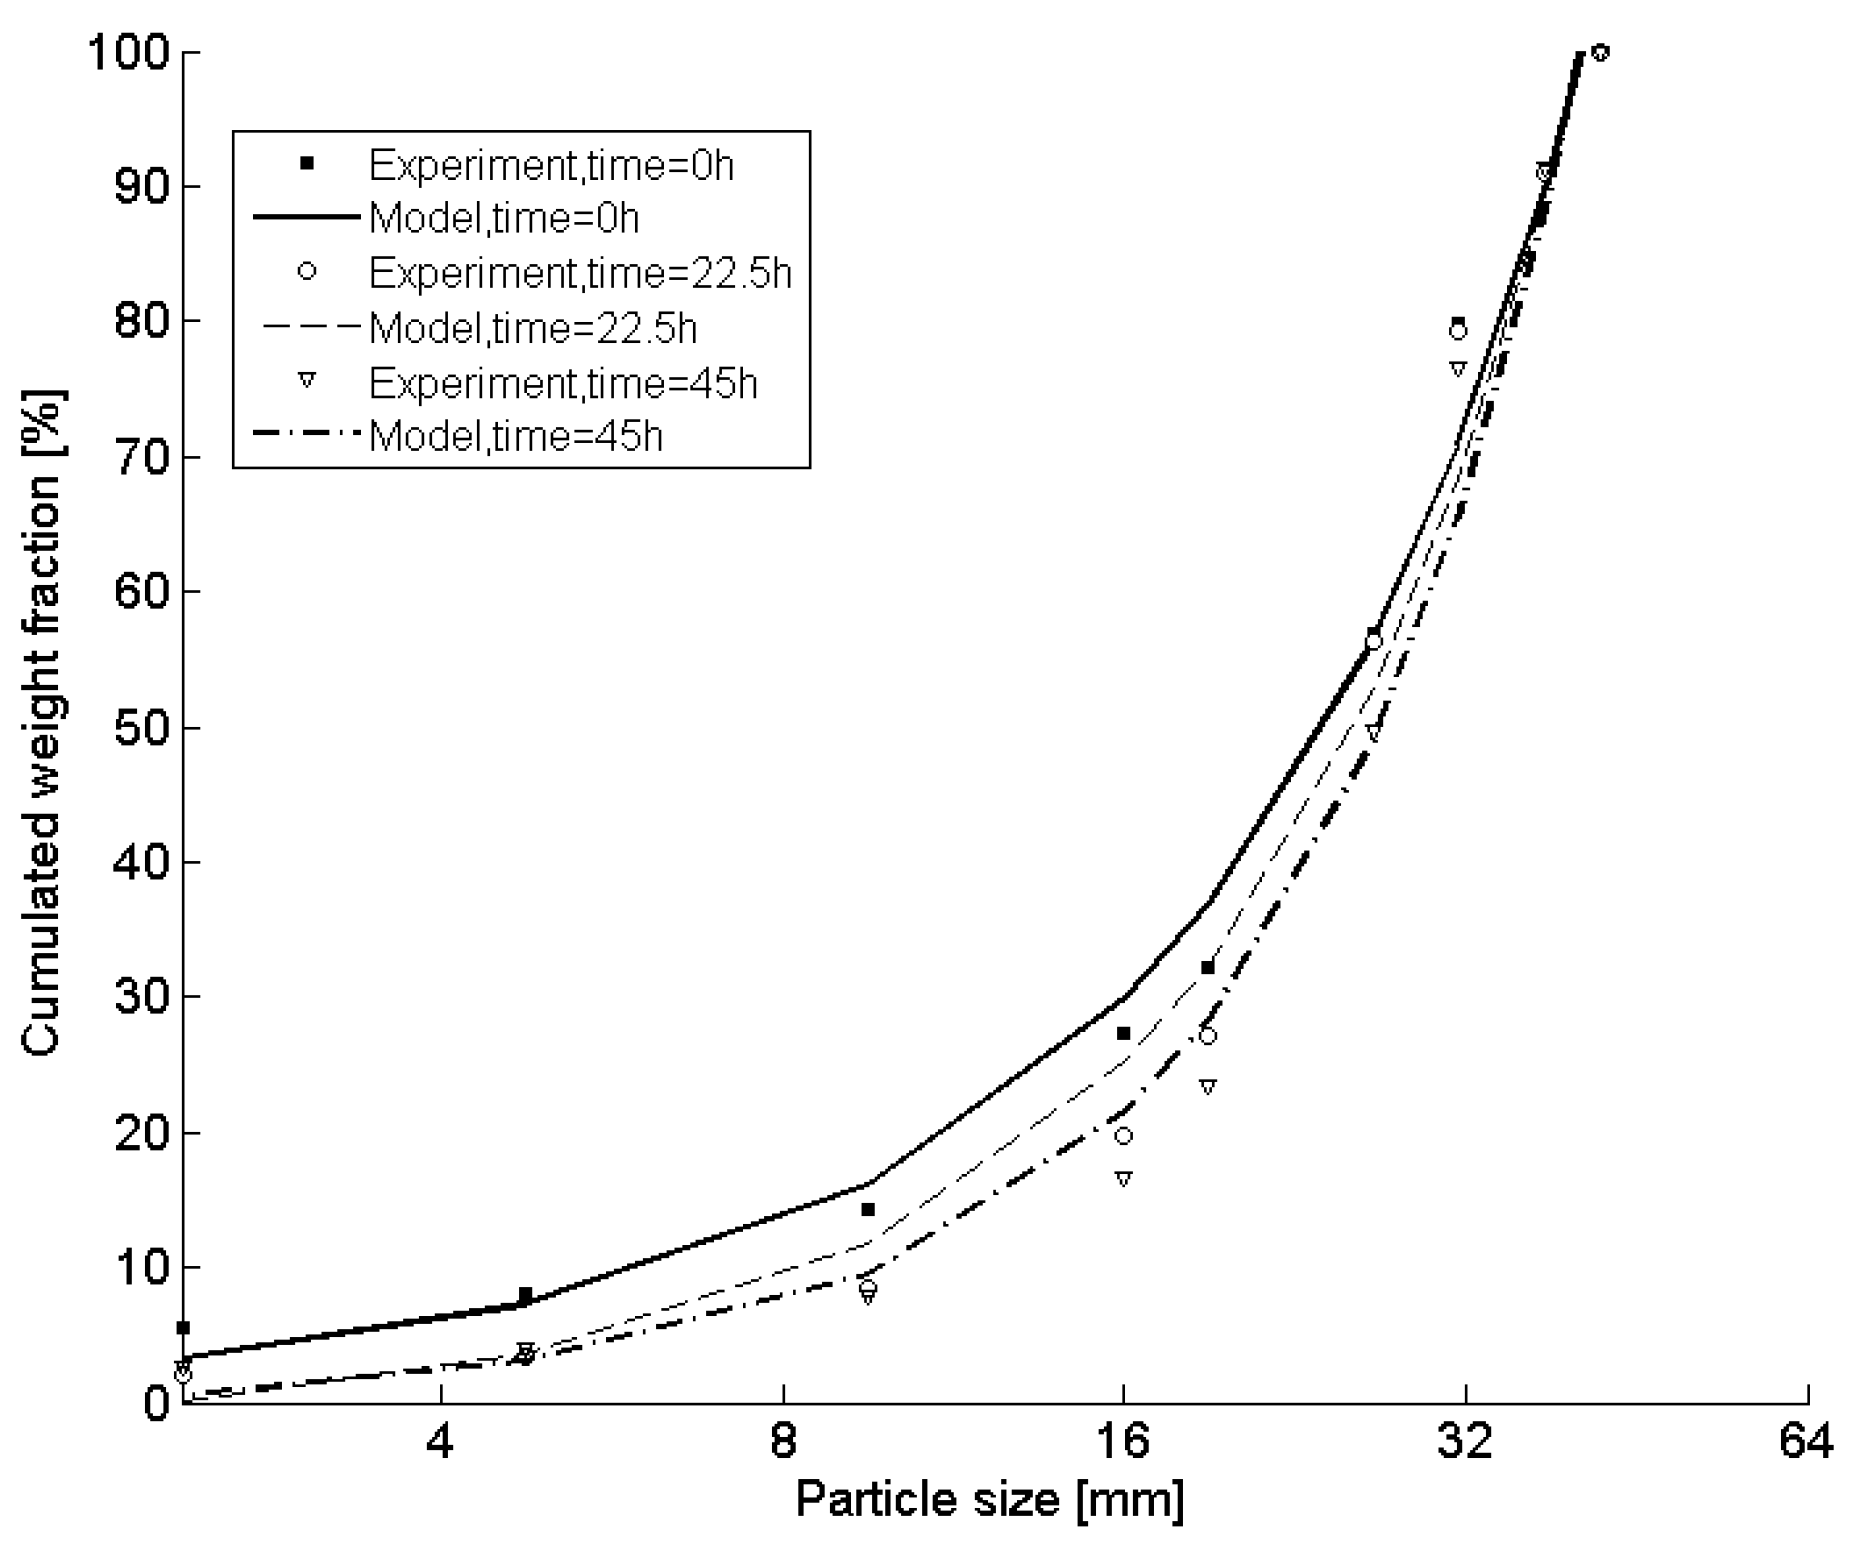
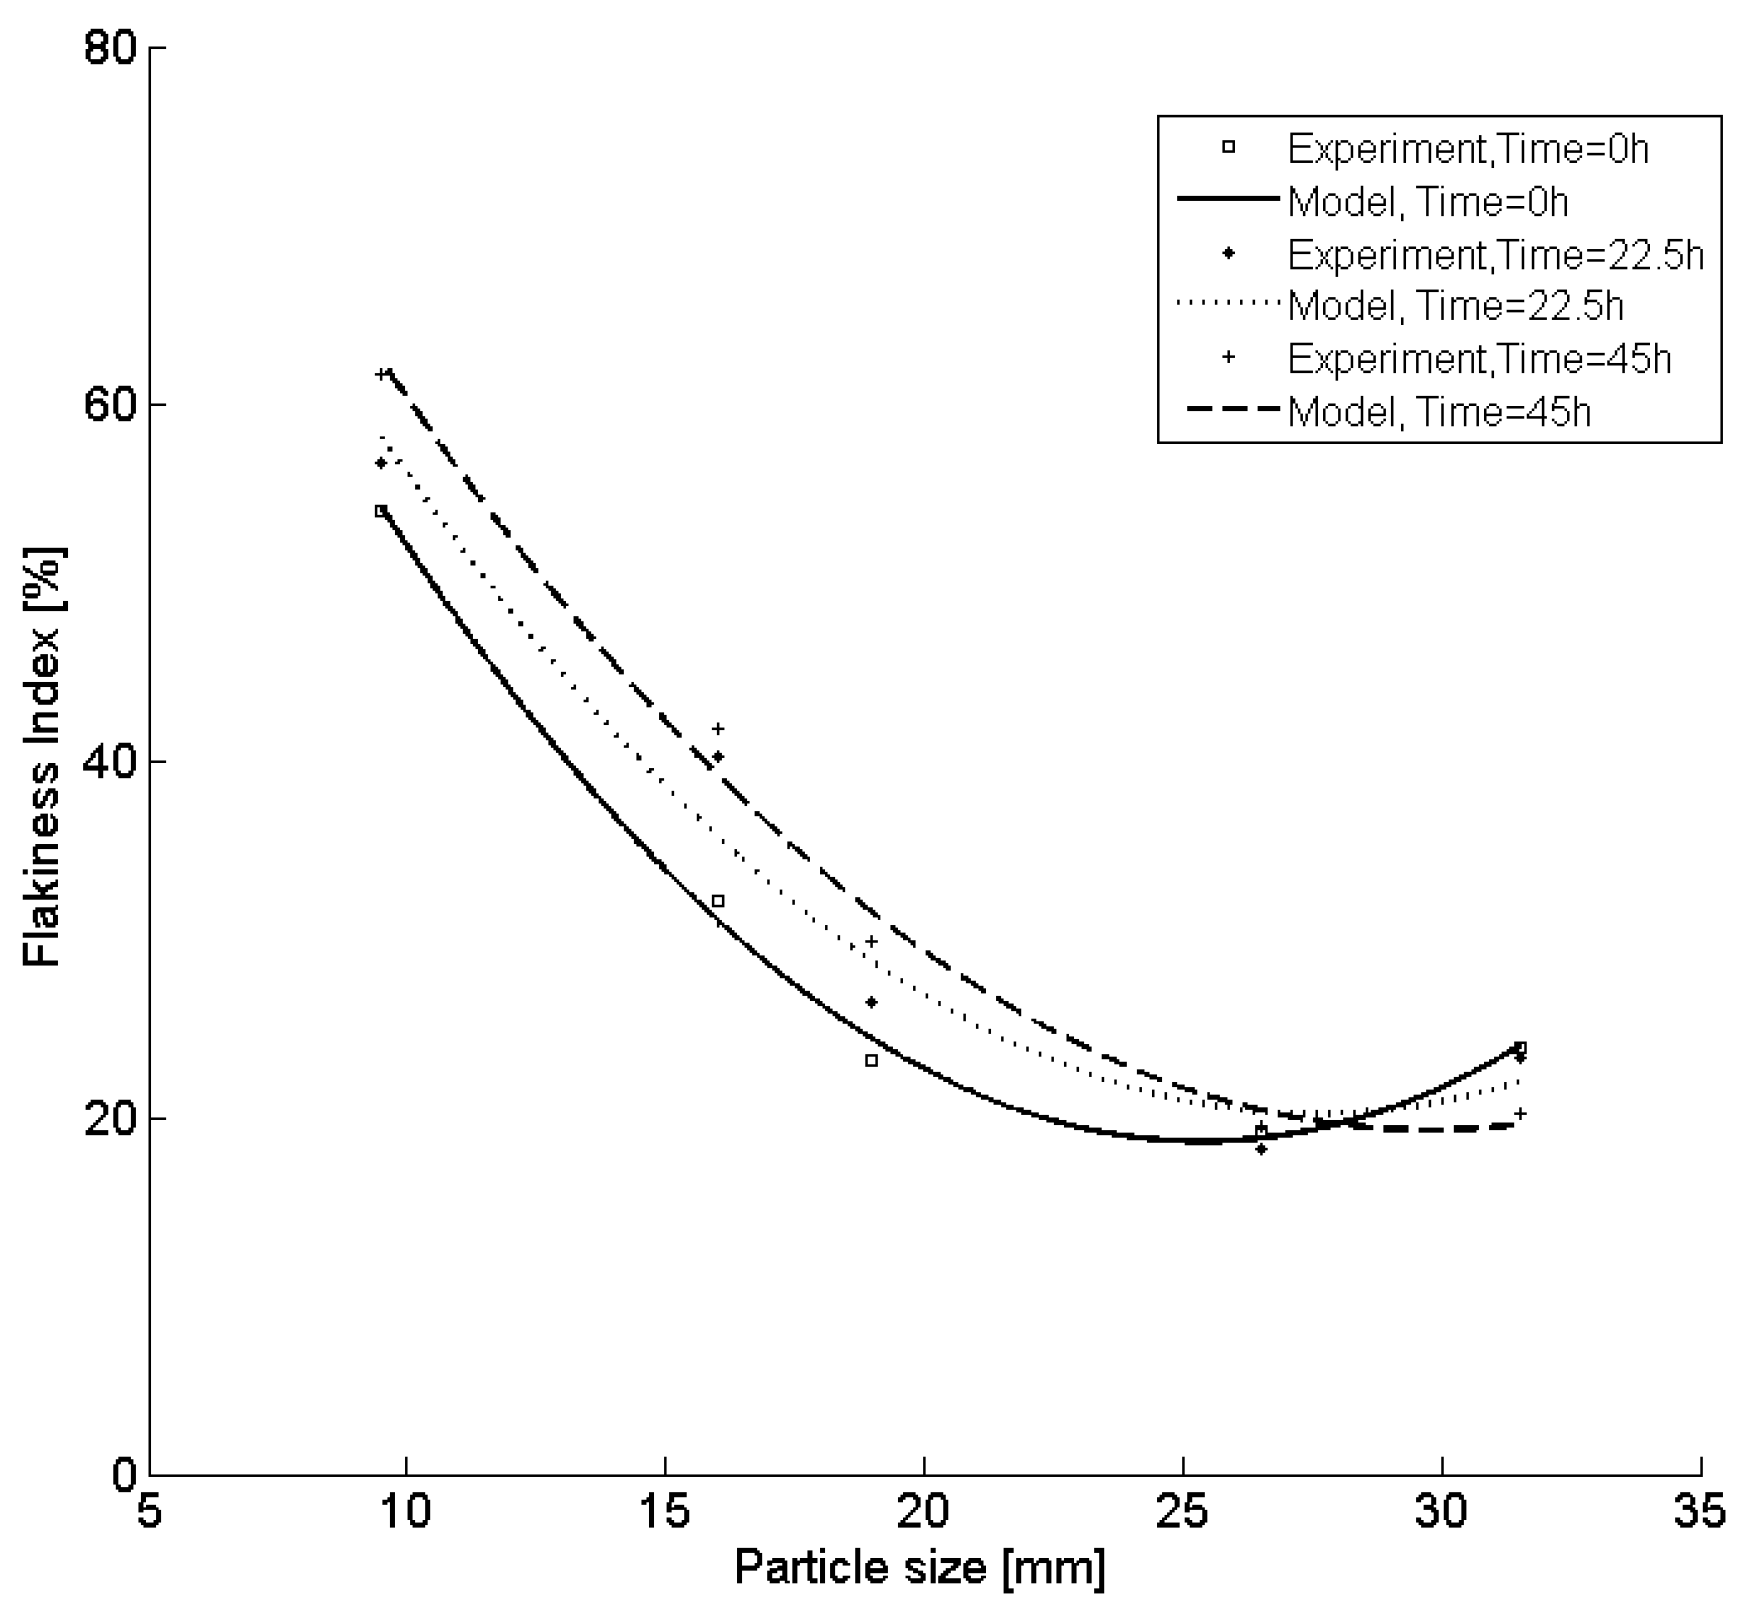
In order to verify the validity and reliability of the wear model in this work, VSC54-F, a Chinese cone crusher (Shanghai Veking Heavy Industry Co. Ltd., Shanghai, China), is selected as an example and the relevant models are produced, as shown in Equations (7) to (14). According to the test, the relevant test data are obtained, as shown in Figure 7 and Figure 8.
Typical results from fitting curves of the test data in 45 h are presented in Figure 7 and Figure 8, which demonstrate the size distribution curve and flakiness index curve movement over time, and cone crusher performance changes over time. It should be noted that a change moves the size distribution curves along the vertical, while a change moves the flakiness index curve along the horizontal axis, as shown in Figure 7 and Figure 8.
The prediction data of product size distribution are obtained by Equations (7) to (14), and the measured data are obtained from field test, as shown in Table 2.
The measured data of flakiness index are obtained by Equations (7) to (14), and the measured data are obtained from field test, as shown in Table 3.
Table 2 and Table 3 summarize the results from the tests and compute at 45 h under normal feed conditions. They show the comparison between computed results of product size distribution and flakiness index considering liner wear and those without considering liner wear. The errors could be calculated to analyze the accuracy of the results.
By analyzing the measured and predicted results of size distribution and flakiness index, the errors in the predicted values can be calculated, as illustrated in Table 2 and Table 3. Table 2 summarizes the results from the tests and predicted values of the PSD. It shows that the absolute values of errors in predicted values of the PSD without considering liner wear are less than 46.9% and those considering liner wear are less than 13.9%, with respect to the test values. This demonstrates the predicted values considering liner wear are better than those without considering liner wear. Table 3 shows measured and predicted results of the flakiness index of the product. Compared to results without considering wear, the predicted results considering wear shows significant improvement in representing the measured data, showing an only 8.6% maximum deviation from the measured results. Therefore, cone crusher performance considering liner wear is predicted using the proposed new model in this paper, which can improve the accuracy of the prediction results.
5. Conclusions
In order to compute the product size distribution and flakiness index along with liner wear, tests are performed both to collect data and to validate the method in this paper. A wear model for the prediction of cone crusher performance is presented, which is able to be improved in order to better represent the actual process. By considering the wear model for prediction of cone crusher performance in the crushing process, the agreement between predicted and measured crusher performance is significantly improved. This work will be useful for future dynamical optimization of the crushing plant, which can serve to increase plant insensitivity to variations, such as wear and malfunctions. These tests give a clear indication that there is a correlation between liner wear and a change of the flakiness index and PSD. However, it is not possible to say that this change is only related to liner wear. There are several other factors, such as rock properties and feed size distribution that also could promote the change of the flakiness index and PSD. The purpose of this paper is not only to create a general model for all crushers but also to obtain a way to better represent the actual size reduction process.
Future work should focus on utilization of the model for dynamic plant performance optimization and evaluating the effects of plant design.
Acknowledgments
The work was supported by Doctoral Program of Higher Education Research Fund (Grant No. 20090073110038).
Author Contributions
Yanjun Ma, Xiumin Fan and Qichang He designed the experiments; Yanjun Ma performed the experiments; Yanjun Ma and Qichang He analyzed the data; Xiumin Fan contributed anlysis tools; Yanjun Ma wrote the paper.
Conflicts of Interest
The authors declare no conflict of interest.
Appendix A
The following symbols are used in this manuscript:
| Symbols | Symbolic Meaning | Units |
| s | Stroke of the RMT-150B system | mm |
| b | Height of rock material in the container | mm |
| Compression ratio | - | |
| Size distribution index | - | |
| wj | Mass percentage of the material in size range j | - |
| j | Average size of the material in size range j | - |
| m | Total number of size ranges | - |
| Average size of all material | mm | |
| K | Compression strength | MPa |
| λ | A relative coefficient of material hardness | - |
| F | Compression pressure | MPa |
| Fn | Normal pressure at the surface | MPa |
| Fs | Shear-stress at the surface | MPa |
| Q | A model parameter | - |
| W | Wear resistance coefficient | - |
| ∆ω | Liner wear | mm |
| ∆ωi(t) | Wear loss of crushing zone i in t hours | mm |
| t | Working time | hour |
| Fn,i | Normal pressure of crushing zone i | MPa |
| Fs,i | Shear-stress of crushing zone i | MPa |
| Fn,p | Normal pressure near the point of the CSS | MPa |
| Fs,p | Shear-stress near the point of the CSS | MPa |
| μ | Wear rate | - |
| m(t) | Crushed product | kg |
| P(t) | Product size distribution of t time | - |
| K0 | Total number of all crushing zones | - |
| Si(t) | Selection function | - |
| Bi(t) | Breakage function | - |
| εi(t) | Compression ratio in the crushing zone i | - |
| xmin | Minimum particle diameter of the feed material | mm |
| x0 | Maximum particle diameter of the feed material | mm |
| x | Particle diameter needed to solve the relevant weight percentage undersize passing | mm |
| Pj | A component of the vector which represents the proportion of particles in the size range j | - |
| n | Total number of size classes | - |
| Average particle size of the feed | mm | |
| FITOTAL | Percentage of flakiness | - |
References
- Asbjörnsson, G.; Hulthén, E.; Evertsson, M. Modelling and dynamic simulation of gradual performance deterioration of a crushing circuit-Including time dependence and wear. Miner. Eng. 2012, 33, 13–19. [Google Scholar] [CrossRef]
- Jens, L.; King, L.; Alex, P.; Dean, K. New developments in cone crusher performance optimization. Miner. Eng. 2009, 22, 613–617. [Google Scholar]
- Numbi, B.P.; Xia, X. Optimal energy control of a crushing process based on vertical shaft impactor. Appl. Energy 2016, 162, 1653–1661. [Google Scholar] [CrossRef]
- Asbjörnsson, G.; Hulthén, E.; Evertsson, M. Modelling and simulation of dynamic crushing plant behavior with MATLAB/Simulink. Miner. Eng. 2013, 43, 112–120. [Google Scholar] [CrossRef]
- Itävuo, P.; Vilkko, M.; Jaatinen, A. Dynamic modeling and simulation of cone crushing circuits. Miner. Eng. 2013, 43–44, 29–35. [Google Scholar]
- Evertsson, C.M. Cone Crusher Performance. Ph.D. Thesis, Chalmers University of Technology, Gothenburg, Sweden, July 2000. [Google Scholar]
- Atta, K.T.; Johansson, A.; Gustafsson, T. Control oriented modeling of flow and size distribution in cone crushers. Miner. Eng. 2014, 56, 81–90. [Google Scholar] [CrossRef]
- Quist, J.; Evertsson, C.M. Cone crusher modelling and simulation using DEM. Miner. Eng. 2016, 85, 92–105. [Google Scholar] [CrossRef]
- Cleary, P.W.; Sinnott, M.D. Simulation of particle flows and breakage in crushers using DEM: Part 1—Compression crushers. Miner. Eng. 2015, 74, 178–197. [Google Scholar] [CrossRef]
- Sinnott, M.D.; Cleary, P.W. Simulation of particle flows and breakage in crushers using DEM: Part 2—Impact crushers. Miner. Eng. 2015, 74, 163–177. [Google Scholar] [CrossRef]
- Simeon, S.; Petko, N.; Ivan, M. Crushing Force Theoretical Examination in One Cone Inertial Crusher. J. Multidiscip. Eng. Sci. Technol. 2015, 2, 430–437. [Google Scholar]
- Lee, E.; Evertsson, M. Implementation of optimized compressive crushing in full scale experiments. Miner. Eng. 2013, 43–44, 135–147. [Google Scholar] [CrossRef]
- Lindqvist, M.; Evertsson, C.M. Prediction of worn geometry in cone crushers. Miner. Eng. 2003, 16, 1355–1361. [Google Scholar] [CrossRef]
- Rahul, S.; Mukhopadhyay, A.K. Wear characterization and modelling of Mn–steel liners used in rock crushers. Perspect. Sci. 2016, 8, 374–376. [Google Scholar]
- Lindqvist, M.; Evertsson, C.M. Improved flow-and pressure model for cone crushers. Miner. Eng. 2004, 17, 1217–1225. [Google Scholar] [CrossRef]
- Lindqvist, M.; Evertsson, C.M. Development of wear model for cone crushers. Wear 2006, 261, 435–442. [Google Scholar] [CrossRef]
- Jochen, F.; Paul, W.C.; Matthew, D.S. How to account for operating condition variability when predicting liner operating life with DEM–A case study. Miner. Eng. 2015, 73, 53–68. [Google Scholar]
- Delaney, G.W.; Morrison, M.D.; Cummins, S.; Cleary, P.W. DEM modelling of non-spherical particle breakage and flow in an industrial scale cone crusher. Miner. Eng. 2015, 74, 112–122. [Google Scholar] [CrossRef]
- Huang, D.M.; Fan, X.M.; Wu, D.L.; Yao, F.S. Multi-objective planning of cone crusher chamber, output and size reduction. Miner. Eng. 2007, 20, 163–172. [Google Scholar] [CrossRef]
- Evertsson, C.M. Modelling of flow in cone crushers. Miner. Eng. 1999, 12, 1479–1499. [Google Scholar] [CrossRef]
- Huang, D.M.; Wu, D.L.; Fan, X.M. Design for multiobjective planning of cone crusher. J. Mech. Eng. 2007, 43, 204–211. [Google Scholar] [CrossRef]
- Bengtsson, M.; Hulthén, E.; Evertsson, C.M. Size and shape simulation in a tertiary crushing stage, a multi objective perspective. Miner. Eng. 2015, 77, 72–77. [Google Scholar] [CrossRef]
- Ma, Y.J.; Fan, X.M.; He, Q.C. Mathematical Modeling of Particle Size and Particle Shape of Crushing Quality for Cone Crusher. Chin. J. Mech. Eng-en. 2013, 49, 95–102. [Google Scholar] [CrossRef]
- Bengtsson, M.; Evertsson, C.M. An empirical model for predicting flakiness in cone crushing. Int. J. Miner. Process 2006, 79, 49–60. [Google Scholar] [CrossRef]
- Dong, G.; Fan, X.M.; Huang, D.M. Analysis and optimization of cone crusher performance. Miner. Eng. 2009, 22, 1091–1093. [Google Scholar]
- Dong, G.; Huang, D.M.; Fan, X.M. Cone crusher chamber optimization using multiple constraints. Int. J. Miner. Process 2009, 93, 204–208. [Google Scholar]
Figure 1.
Experimental processes of rock material interpartical breakage.

Figure 2.
(a) Typical flow sheet of crushing plant; (b) Typical flow sheet of two-stage aggregates production plant in China.
Figure 2.
(a) Typical flow sheet of crushing plant; (b) Typical flow sheet of two-stage aggregates production plant in China.

Figure 3.
Relationship between pressure of single factor multi-material crushing and compressive ratio.
Figure 3.
Relationship between pressure of single factor multi-material crushing and compressive ratio.
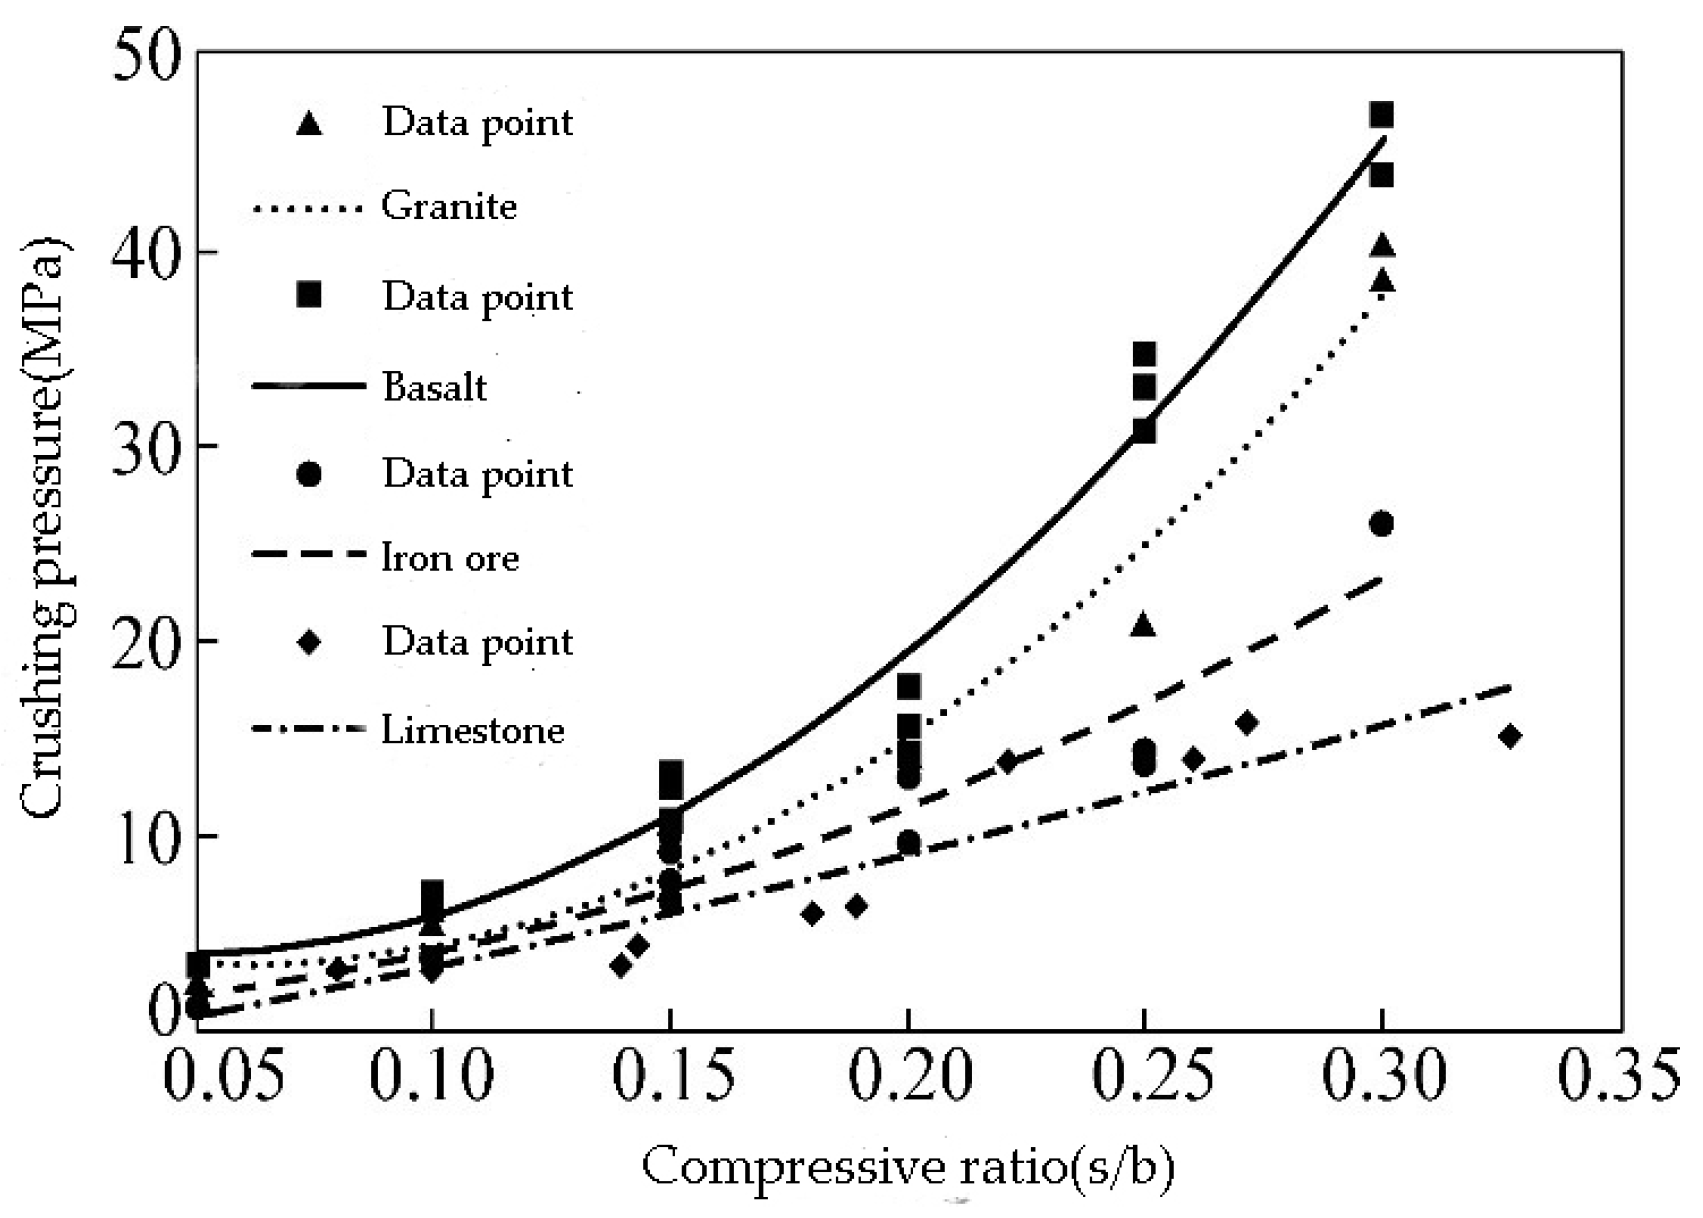
Figure 4.
Multi-material crushing pressure model.
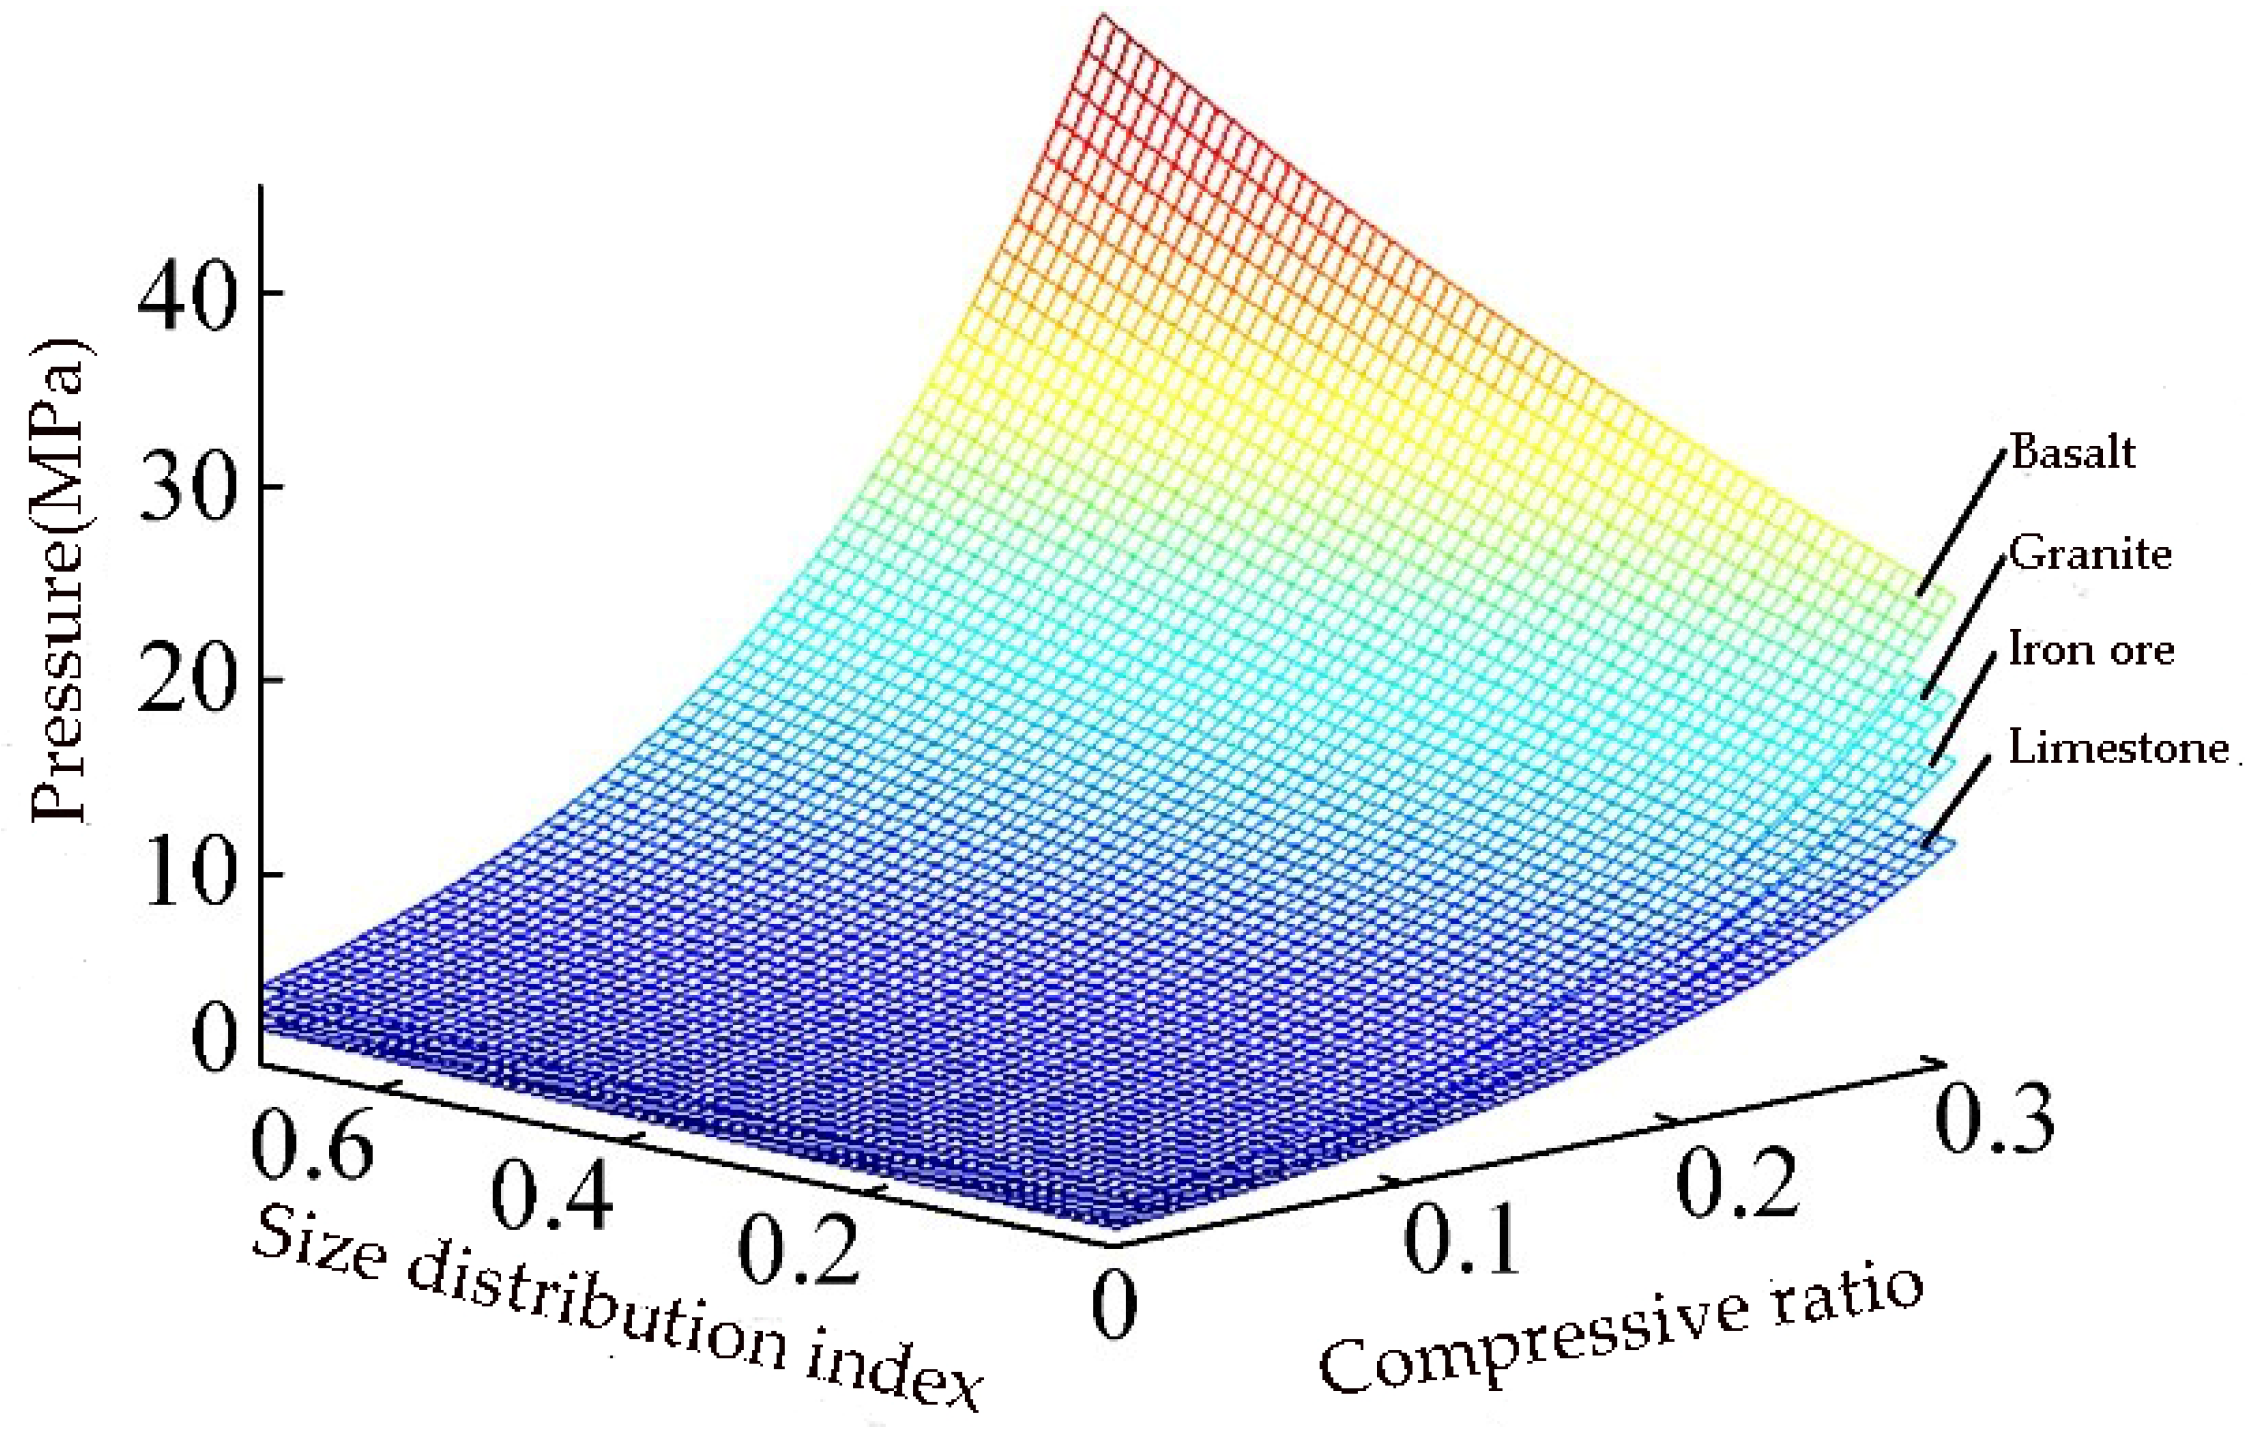
Figure 5.
Selection function model.
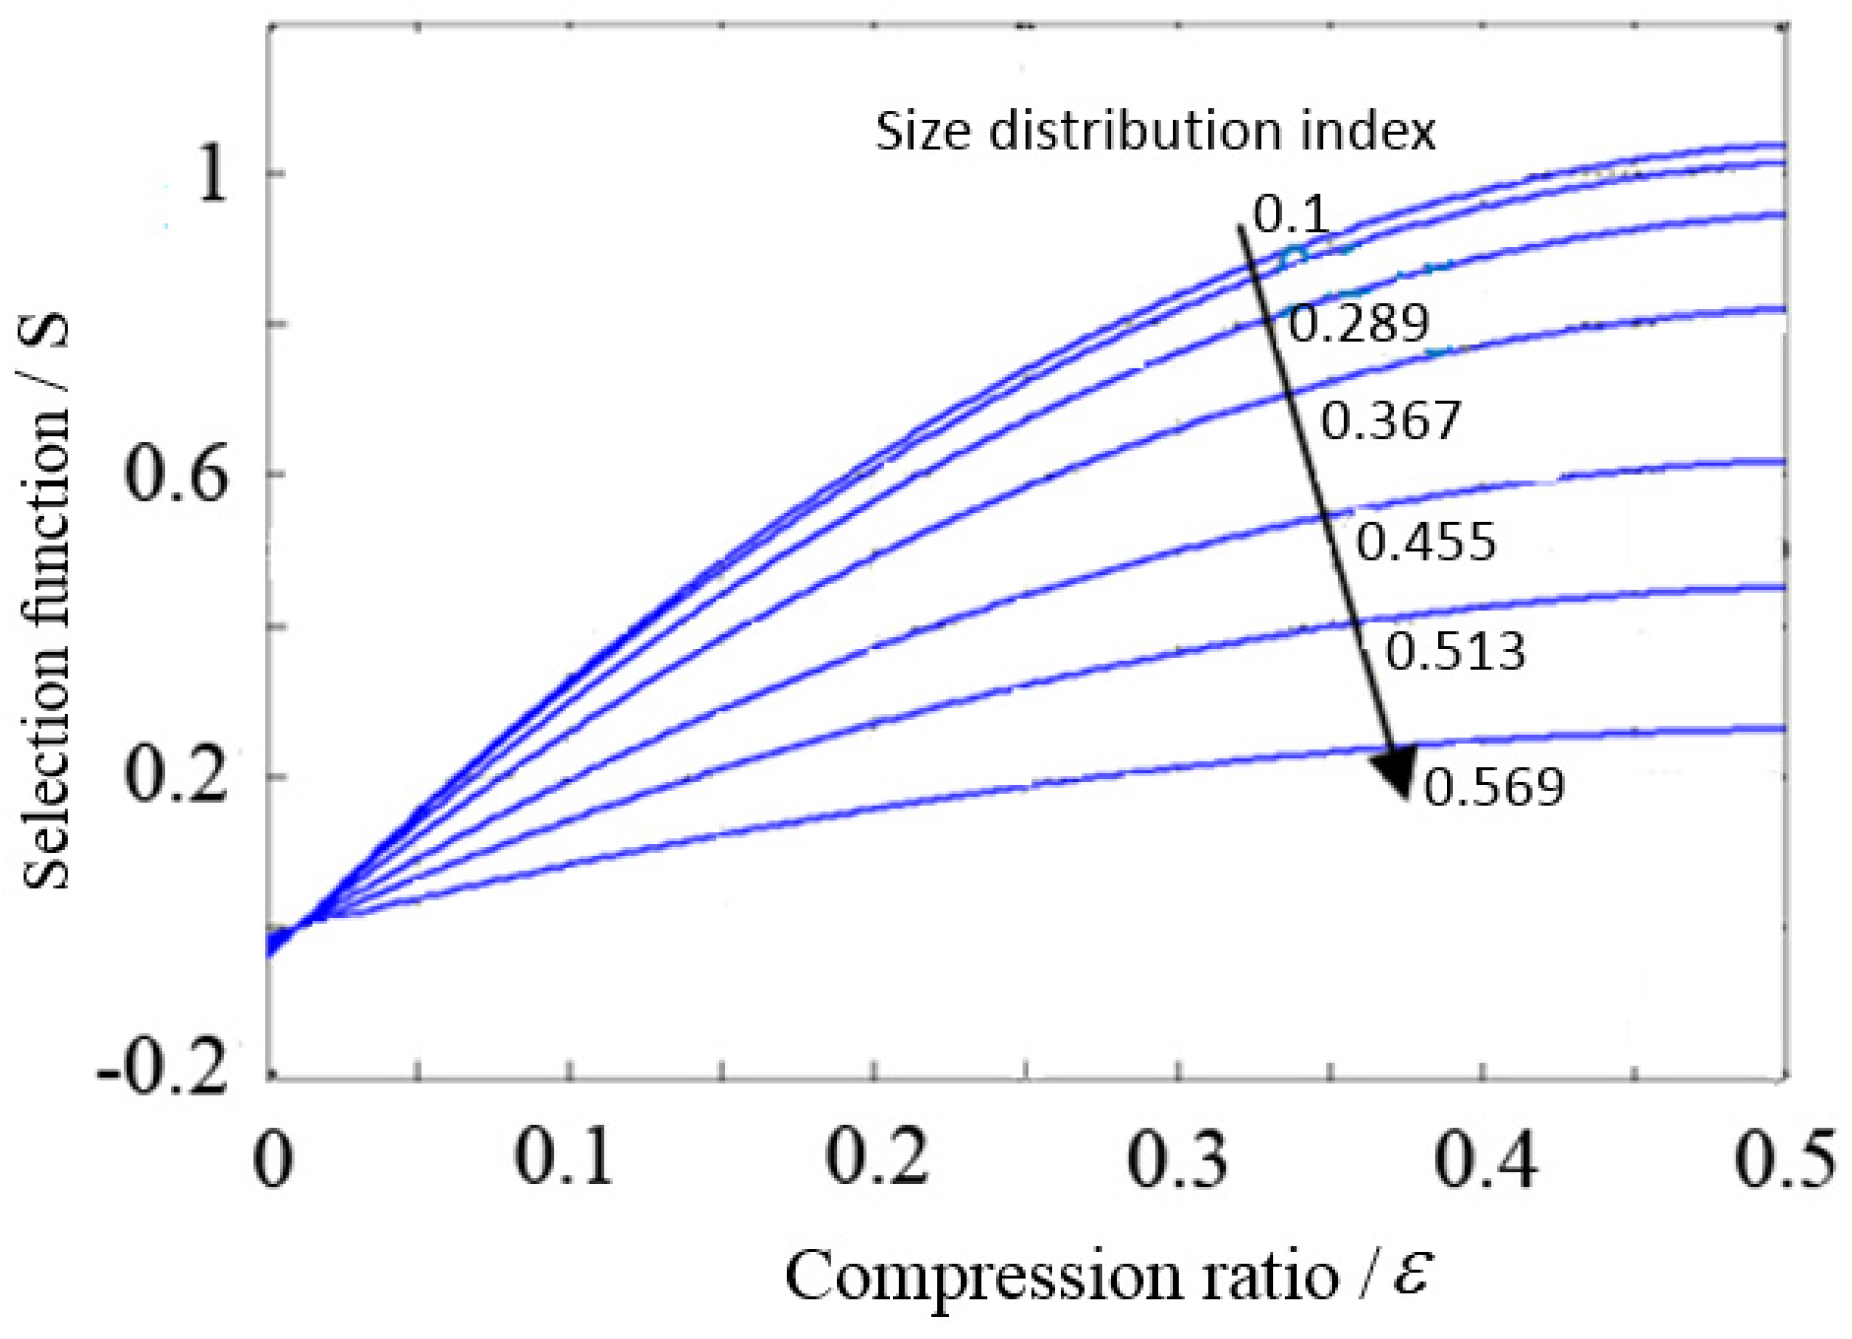
Figure 6.
Breakage function model.

Figure 7.
Worn liner causes the size distribution curve to change over time.

Figure 8.
Worn liner causes the flakiness curve to change over time.


| Granite | Basalt | ||||||
| Test Number | Compressive Ratio (s/b) | Size Distribution Index (σ) | Compression Pressure (MPa) | Test Number | Compressive Ratio (s/b) | Size Distribution Index (σ) | Compression Pressure (MPa) |
| 1 | 0.050 | 0.2621 | 2.2476 | 1 | 0.050 | 0.2696 | 3.2248 |
| 2 | 0.050 | 0.3324 | 2.5687 | 2 | 0.050 | 0.2533 | 3.3924 |
| 3 | 0.050 | 0.2577 | 2.5268 | 3 | 0.050 | 0.2387 | 3.2388 |
| 4 | 0.100 | 0.3701 | 5.6819 | 4 | 0.100 | 0.3219 | 7.0081 |
| 5 | 0.100 | 0.3777 | 5.3329 | 5 | 0.100 | 0.3094 | 6.4218 |
| 6 | 0.100 | 0.3844 | 5.9890 | 6 | 0.100 | 0.3107 | 6.7428 |
| 7 | 0.150 | 0.4253 | 9.2278 | 7 | 0.150 | 0.4498 | 13.2344 |
| 8 | 0.150 | 0.4478 | 10.0933 | 8 | 0.150 | 0.4383 | 10.7634 |
| 9 | 0.200 | 0.5408 | 14.0301 | 9 | 0.200 | 0.5308 | 14.1000 |
| 10 | 0.200 | 0.5564 | 13.9464 | 10 | 0.200 | 0.5208 | 15.6077 |
| 11 | 0.200 | 0.5429 | 14.0720 | 11 | 0.200 | 0.5312 | 17.6598 |
| 12 | 0.250 | 0.6127 | 20.5915 | 12 | 0.250 | 0.6801 | 32.8906 |
| 13 | 0.300 | 0.6619 | 38.2932 | 13 | 0.300 | 0.6852 | 43.9053 |
| 14 | 0.300 | 0.6893 | 40.2058 | 14 | 0.300 | 0.7567 | 46.9207 |
| Iron Ore | Limestone | ||||||
| Test Number | Compressive Ratio (s/b) | Size Distribution Index (σ) | Compression Pressure (MPa) | Test Number | Compressive Ratio (s/b) | Size Distribution Index (σ) | Compression Pressure (MPa) |
| 1 | 0.050 | 0.2793 | 1.2704 | 1 | 0.050 | 0.0263 | 1.7590 |
| 2 | 0.050 | 0.2944 | 1.8009 | 2 | 0.080 | 0.0263 | 3.0852 |
| 3 | 0.050 | 0.3275 | 1.8148 | 3 | 0.097 | 0.1461 | 3.0992 |
| 4 | 0.100 | 0.3231 | 3.7414 | 4 | 0.100 | 0.0263 | 3.1550 |
| 5 | 0.100 | 0.3618 | 3.6855 | 5 | 0.140 | 0.0263 | 3.4901 |
| 6 | 0.100 | 0.4595 | 3.5878 | 6 | 0.143 | 0.2677 | 4.5371 |
| 7 | 0.150 | 0.4141 | 6.7847 | 7 | 0.154 | 0.2678 | 6.3520 |
| 8 | 0.150 | 0.5427 | 7.5665 | 8 | 0.180 | 0.0263 | 6.2124 |
| 9 | 0.150 | 0.6503 | 9.9398 | 9 | 0.186 | 0.4103 | 8.2785 |
| 10 | 0.200 | 0.4903 | 9.5349 | 10 | 0.189 | 0.2104 | 6.4497 |
| 11 | 0.200 | 0.6561 | 13.1646 | 11 | 0.221 | 0.4623 | 13.7649 |
| 12 | 0.250 | 0.5483 | 13.7091 | 12 | 0.260 | 0.3013 | 14.1977 |
| 13 | 0.250 | 0.7064 | 14.1558 | 13 | 0.271 | 0.4987 | 15.8869 |
| 14 | 0.300 | 0.6490 | 26.1198 | 14 | 0.281 | 0.4763 | 16.1191 |
s: stroke of the RMT-150B system; b: height of rock material in the container.
| Size (mm) | Measured (%) | Considering Liner Wear | Without Considering Liner Wear | ||
|---|---|---|---|---|---|
| Predicted (%) | Error (%) | Predicted (%) | Error (%) | ||
| +37.5 | 88.2 | 86.4 | 2.0 | 90.8 | −3.0 |
| +31.5−37.5 | 65.5 | 65.1 | 0.6 | 71.6 | −9.3 |
| −26.5+31.5 | 49.0 | 49.8 | −1.6 | 57.1 | −16.5 |
| +19−26.5 | 28.5 | 30.8 | −8.1 | 38.0 | −33.3 |
| +16−19 | 21.6 | 24.6 | −13.9 | 31.3 | −44.9 |
| +9.5−16 | 9.6 | 10.8 | −12.5 | 14.1 | −46.9 |
| Size (mm) | Measured (%) | Considering Liner Wear | Without Considering Liner Wear | ||
|---|---|---|---|---|---|
| Predicted (%) | Error (%) | Predicted (%) | Error (%) | ||
| +31.5 | 19.5 | 19.9 | −2.1 | 23.9 | −22.6 |
| +26.5−31.5 | 20.4 | 19.1 | 6.4 | 18.8 | 7.8 |
| +19.0−26.5 | 31.4 | 28.7 | 8.6 | 24.7 | 21.3 |
| +16.0−19 | 39.2 | 36.3 | 7.4 | 31.6 | 19.4 |
| +9.5−16 | 62.4 | 59.9 | 4.0 | 55.4 | 11.2 |
© 2016 by the authors; licensee MDPI, Basel, Switzerland. This article is an open access article distributed under the terms and conditions of the Creative Commons Attribution (CC-BY) license (http://creativecommons.org/licenses/by/4.0/).
Share and Cite
MDPI and ACS Style
Ma, Y.; Fan, X.; He, Q. Prediction of Cone Crusher Performance Considering Liner Wear. Appl. Sci. 2016, 6, 404. https://doi.org/10.3390/app6120404
AMA Style
Ma Y, Fan X, He Q. Prediction of Cone Crusher Performance Considering Liner Wear. Applied Sciences. 2016; 6(12):404. https://doi.org/10.3390/app6120404
Chicago/Turabian StyleMa, Yanjun, Xiumin Fan, and Qichang He. 2016. "Prediction of Cone Crusher Performance Considering Liner Wear" Applied Sciences 6, no. 12: 404. https://doi.org/10.3390/app6120404
Note that from the first issue of 2016, this journal uses article numbers instead of page numbers. See further details here.