Article

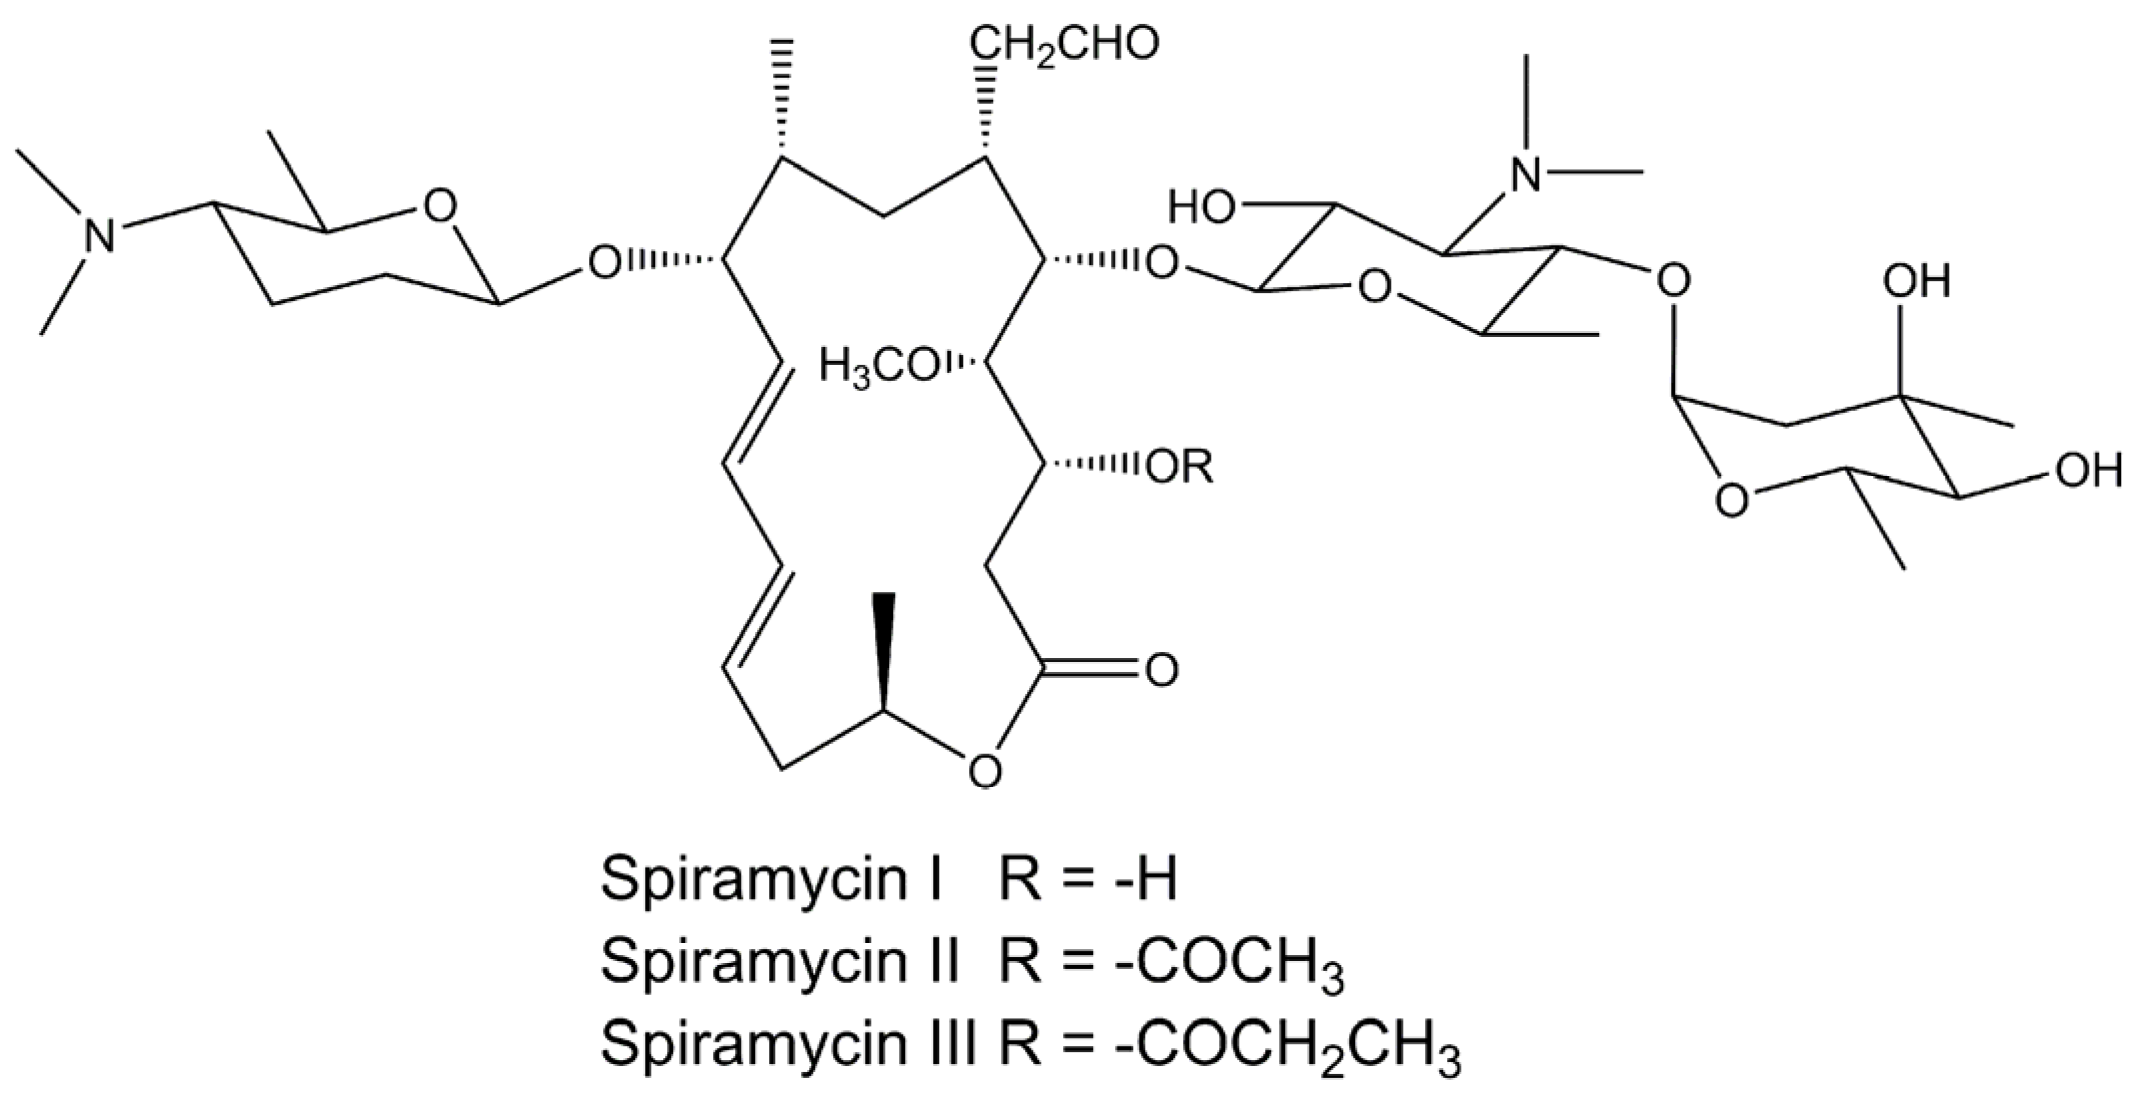
Physicochemical Properties and In Vitro Dissolution of Spiramycin Microparticles Using the Homogenate-Antisolvent Precipitation Process

Key Laboratory of Soybean Biology in Chinese Ministry of Education, Northeast Agricultural University, Harbin 150030, China
*
Authors to whom correspondence should be addressed.
Appl. Sci. 2017, 7(1), 10; https://doi.org/10.3390/app7010010
Submission received: 5 November 2016 / Revised: 14 December 2016 / Accepted: 19 December 2016 / Published: 22 December 2016
(This article belongs to the Special Issue Nanomanufacturing of Biomedical Systems and Devices)

Abstract

:
Due to its low bioavailability and slow dissolution rate, the micronized spiramycin powder was thus prepared by the homogenate-antisolvent precipitation (HAP) process. The optimum micronization conditions of the HAP process were found to be as follows: precipitation temperature of 4.6 °C, precipitation time of 10 min, spiramycin concentration of 20 mg/mL, dripping speed of the added solvent into the antisolvent of 44 mL/h, antisolvent (water) to solvent (dimethyl sulfide (DMSO)) volume ratio of 7:1, and shear rate of 5000 rpm. With this HAP process, the mean particle size was 228.36 ± 3.99 nm. The micronized spiramycin was characterized by scanning electron microscopy, Fourier transform infrared spectroscopy, X-ray diffraction, high-performance liquid chromatography, and gas chromatograph analyses. In comparison with the raw drug, the chemical structure of micronized spiramycin was not changed. The dissolution rate experiments showed that the dissolution rate of the spiramycin was significantly increased after micronization.

1. Introduction

Spiramycin, a mixture of three 16-membered macrolide antiparasitics and antibiotics [1,2,3], is produced by Streptomyces ambofaciens. Spiramycin I (over 85%) is the main derivative of spiramycin, while spiramycin II and III, with percentages respectively lower than 5% and 10%, are minor derivatives. The chemical structures are presented in Figure 1. The quantity of each component varies according to the manufacturer. It has been widely used in the treatment of various infections of soft tissues, such as digestive [4], respiratory [4], urinary, and reproductive systems [5], as well as toxoplasmosis [6] and cryptosporidiosis [7]. Spiramycin also shows antimicrobial activities toward Gram-positive cocci and rods, Gram-negative cocci, and also mycoplasmas, chlamydiae, and spirochetes. In addition, the antibiotic activity of spiramycin has been found to inhibit the protein synthesis in the bacterial cell during translocation [8,9]. Spiramycin is also an important veterinary drug in China, Europe, and some other countries.
Several factors potentially influencing the bioavailability of the drug include membrane permeability, solubility, and the dissolution rate of the drug; among these factors the solubility and dissolution rate of the poorly water-soluble drug are two key factors for its bioavailability. Spiramycin (BCS-class III) with low solubility and slow dissolution rate in water, results in its variable and incomplete oral bioavailability [5]. In recent years, many studies have committed to improving the solubility and dissolution rate of poorly water-soluble drugs through solid dispersion [10,11,12] and micronization [13]. The reduction of the drug particle size to submicron range will lead to a higher oral bioavailability, which has gained much attention.
According to Noyes-Whitney equation [14], the dissolution rate of drug is proportional to the surface area of drug particles exposed to the dissolution medium. Therefore, application of some techniques for reducing the particles size of spiramycin is conducive to facilitating the dissolution through enlarging the effective surface area of spiramycin. For the preparation of microparticles, many traditional approaches have been applied, including ball milling [15], mechanical comminution [16], air jet pulverization [17,18], supercritical fluid technology [19,20,21,22,23], high pressure homogenization [24,25], reactive crystallization [26], spray drying [27,28], and the antisolvent precipitation process [29]. The mechanical comminution process is a widely used method for micronizing drugs in pharmaceutical manufacturing. However, some disadvantages exist in these techniques, such as the large capital equipment investment for the application of supercritical fluid technology, expensive equipment, and solvent requirements for the technique of high pressure homogenization. By contrast, the antisolvent precipitation technique has some advantages, such as lower reagent consumption, higher process efficiency, and easy operation [30,31], and has been widely applied. Particle size is an important factor influencing the dissolution rate, the reduction of which can essentially shorten the dissolution time and improve the overall dissolution rate. Homogenization, an effective pulverization technique, has been widely applied in the pretreatment of animal and plant tissues, and the extraction of plant ingredients. The homogenate process has good pulverization efficiency because of stronger mechanical shearing forces and fluid cutting action, and smashing without heating and pressure. In the antisolvent precipitation process, simultaneous use of the homogenate technique for treatment will further prevent the formation and growth of crystal particles. However, the homogenate technique, in combination with antisolvent precipitation, has not been reported in the literature.
Here, we prepare spiramycin microparticles using a homogenate-antisolvent precipitation (HAP) process, and evaluate its physicochemical properties and dissolution in vitro. The homogenate-antisolvent precipitation process was optimized by investigating the effects of spiramycin concentration, the volume ratio of antisolvent to solvent, and the antisolvent precipitation time on the mean particle size (MPS) of the spiramycin microparticles using a response surface methodology (RSM) with Box-Behnken design (BBD) for data processing. The microparticles were further characterized by scanning electron microscopy (SEM), Fourier transform infrared spectroscopy (FTIR), and X-ray diffraction (XRD). The dissolution in vitro of spiramycin microparticles prepared was also evaluated.

2. Materials and Methods

2.1. Materials

The raw spiramycin was obtained from Beijing Mediking Biopharm Co., Ltd. (Beijing, China), containing spiramycin I 94.60%, spiramycin II 3.45% and spiramycin III 1.84%. Dimethyl sulfide (DMSO) of analytical grade was purchased commercially from Shanghai Aladdin Bio-Chem Technology Co., Ltd. (Shanghai, China). Deionized water was prepared with a Hitch-K Flow Water Purification System (Hitch Instruments Co., Ltd., Shanghai, China).

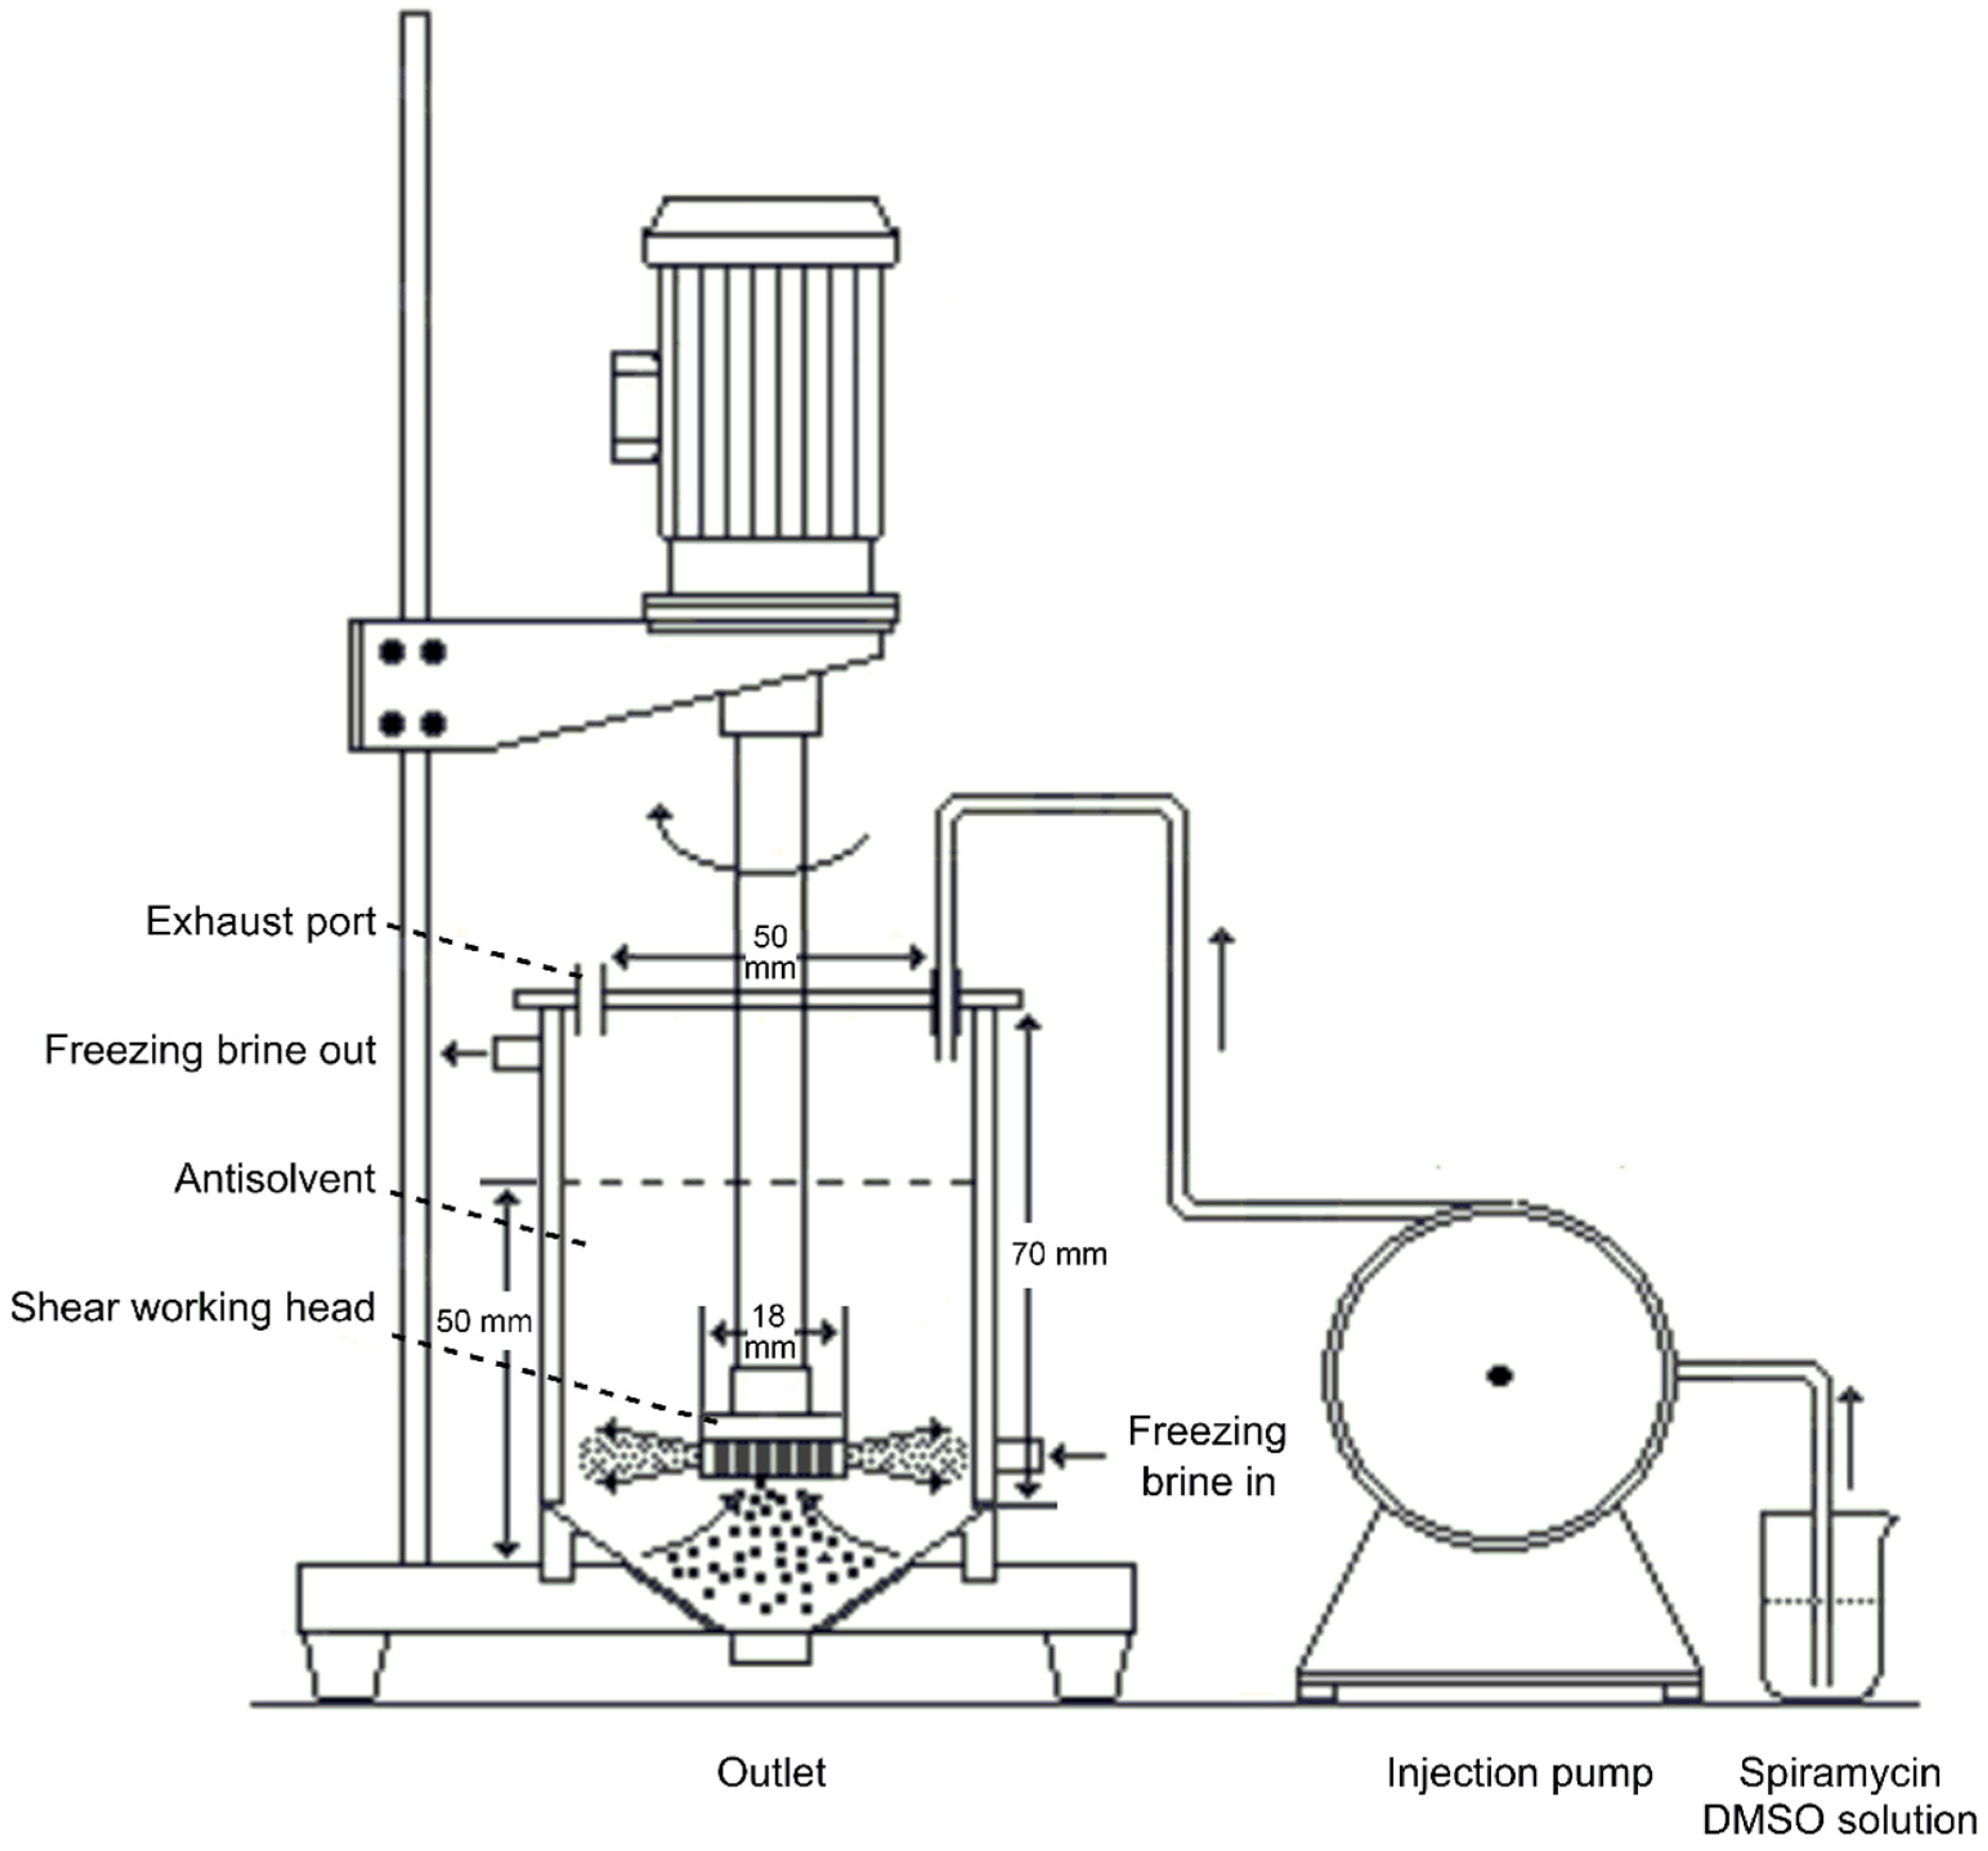
2.2. Homogenate-Antisolvent Precipitation Procedure

The schematic diagram of the HAP apparatus is presented in Figure 2. Briefly, the solution of raw spiramycin dissolved in DMSO was filtrated through a membrane (0.45 μm) for removing the possible particulate impurities. Then all of the spiramycin solution (5–60 mg/mL) prepared was pumped into an aqueous solution (antisolvent) by an injection pump (P230p, Dalian Elite Analytical Instruments Co., Ltd., Dalian, China) at a certain flow rate (10–70 mL/h), with a volume ratio of antisolvent to solvent of 1–11 mL/mL. After stirring the solution using a homogenate rotor at a certain speed (100–15,000 rpm), and bathing under a certain temperature (−12 to 25 °C) for a certain time (2–120 min), a milk-like suspension was formed. Then the suspension was centrifuged at 5000 rpm for 5 min and then washed by water, the process of which was repeated three times in order to remove the DMSO organic solvent completely. The precipitate was lyophilized at −50 °C for 48 h, and the spiramycin microparticles were obtained.
Many parameters have affect the mean particle size (MPS) of spiramycin microparticles, including precipitation temperature, precipitation time, spiramycin concentration, dripping speed of the solvent adding into the antisolvent, volume ratio of the antisolvent to the solvent, shear rate, type of solvent and antisolvent, and so on.
The parameter optimization process for spiramycin micronization was realized using RSM experiment which performed with three3 factors and three levels. Based on the results of preliminary experiments and single factor experiments, spiramycin concentration (X1), the volume ratio of antisolvent to solvent (X2), and the dripping speed of the solvent adding into the antisolvent (X3) were selected and analyzed using a BBD with Design Expert 8.0 software (Stat-Ease, Minneapolis, MN, USA). The boundaries for the three factors were 10–30 mg/mL for X1, 3–7 mL/mL for X2, and 40–60 mL/h for X3. We used the same solvent (DMSO) and antisolvent (pure water), precipitation temperature of 4.6 °C, precipitation time of 10 min, and shear rate of 5000 rpm for all HAP experiments. The 17 combinations of different factors for the BBD are presented in Table 1, with the MPS of micronized spiramycin as the response. Each experiment was performed in triplicate. The full second-order polynomial equation, listed as follows, was used as the RSM model, which used for regression analysis:
Y = β 0 + i = 1 3 β i X i + i = 1 3 β i i X i 2 + i = 1 2 j = i + 1 3 β i j X i X j ,
where Y is the predicted response; β0, βi, βii, and βij are the regression coefficients of variables for intercept, linear, quadratic, and interaction terms, respectively; and Xi and Xj are the coded independent variables.

2.3. Determination of Spiramycin Content by High-Performance Liquid Chromatography (HPLC)

Both the unprocessed and processed spiramycin contents were determined by high-performance liquid chromatography (HPLC) using a Waters 1525-2489 series system (Waters, Milford, MA, USA), equipped with a HiQ sil-C18 reversed-phase column (4.6 mm × 250 mm, 5 µm, KYA TECH, Tokyo, Japan). The mobile phase consisted of 2.5% phosphoric acid in acetonitrile-water (27:73, v/v) with 2 g/L of heptane sulfonic acid sodium salt. The injection volume was 10 μL, the flow rate was 1 mL/min, and the determined wavelength for response signal was 232 nm [32].

2.4. Residual Solvent Determination

In order to detect the residual content of DMSO in the micronized spiramycin, gas chromatography (GC) (Agilent 7890A, Palo Alto, CA, USA) was performed, equipped with a G1540N-210 flame-ionization detector and an HP-5 capillary column (film thickness 0.25 μm, 30 m × 320 μm) was applied. The micronized spiramycin samples (10 mg) were suspended in 1 mL methanol and centrifuged at 10,000 rpm for 5 min. 10 μL of the supernatant was then injected. The detecting conditions for DMSO analysis were: injector temperature of 200 °C, detector temperature of 280 °C; flow rate for H2, N2, and airflows of 30, 2.2, and 400 mL/min, respectively; the initial oven temperature was set at 40 °C for 5 min, and was then increased to 240 °C at 40 °C/min and maintained for 5 min.

2.5. Physicochemical Evaluation of Spiramycin

2.5.1. Fourier Transform Infrared Spectroscopy

The unprocessed and processed spiramycin were mixed with KBr powder at a ratio of 1%, and the mixture was then pressed into self-supporting disks. The FTIR spectrum was detected by a MAGNA-IR560 E.S.P. (Nicolet, Madison, WI, USA) in the wavenumber range of 4000–500 cm−1 at a resolution of 4 cm−1.

2.5.2. Powder X-ray Diffraction

The powder X-ray diffraction patterns of spiramycin samples were obtained using an X-ray diffractometer with a rotating anode (Philips, X pert-Pro, Eindhoven, The Netherlands) with Cu KL1 radiation generated at 30 mA and 40 kV. The 2θ scan range was 5–90°, with a step size of 0.02° and scan speed of 3°/min. The unprocessed spiramycin and processed spiramycin were filled to the same depth inside the sample holder by leveling with a spatula, and the scanning rate was kept constant for all XRD analyses.

2.5.3. Scanning Electron Microscope

The morphology of unprocessed spiramycin and processed spiramycin was visualized by scanning electron microscope (Quanta 200, FEI, Hillsboro, ND, USA). The drug particles were sputter coated with gold–palladium (5 to 10 nm; 10 mA; 40 s) before observation.

2.5.4. Particle Size Analysis

The mean particle size (MPS) of processed samples was measured by dynamic light scattering (DLS) using particle size analyzer laser (ZetaPALS/90plus, Brookhaven Instruments Corporation, Holtsville, NY, USA). Excessive micronized spiramycin was taken into filtered pure water to avoid dissolution of the micronized particles and treated by sonication for 3 min to avoid the aggregation of particles. Every measurement was repeated three times. The particle size of unprocessed spiramycin was directly estimated according to the scale of the SEM image.

2.6. Dissolution Test

A dissolution test was conducted according to the stirring method (VK 7010 dissolution apparatus, VARIAN, Agilent, Santa Clara, CA, USA) with rotation speed of 100 rpm and a bath temperature of 36.5 ± 0.5 °C. Thirty milligrams of unprocessed and processed spiramycin powders were mixed with 30 mL solution medium in a vessel. The solution medium used was artificial simulation gastric juices, which was prepared based on the Chinese Pharmacopoeia [33]. Diluted hydrochloric acid was prepared by diluting 234 mL concentrated hydrochloric acid to 1000 mL with water. Then 16.4 mL diluted hydrochloric acid was mixed with water to about 800 mL, which was then combined with 10 g pepsase. After shaking, the mixture was diluted to 1000 mL using water. Then, a 1.0 mL aliquot of the solution was sampled at specific intervals, filtered, and analyzed by HPLC system.

3. Results and Discussion

3.1. Optimization of Single HAP Conditions

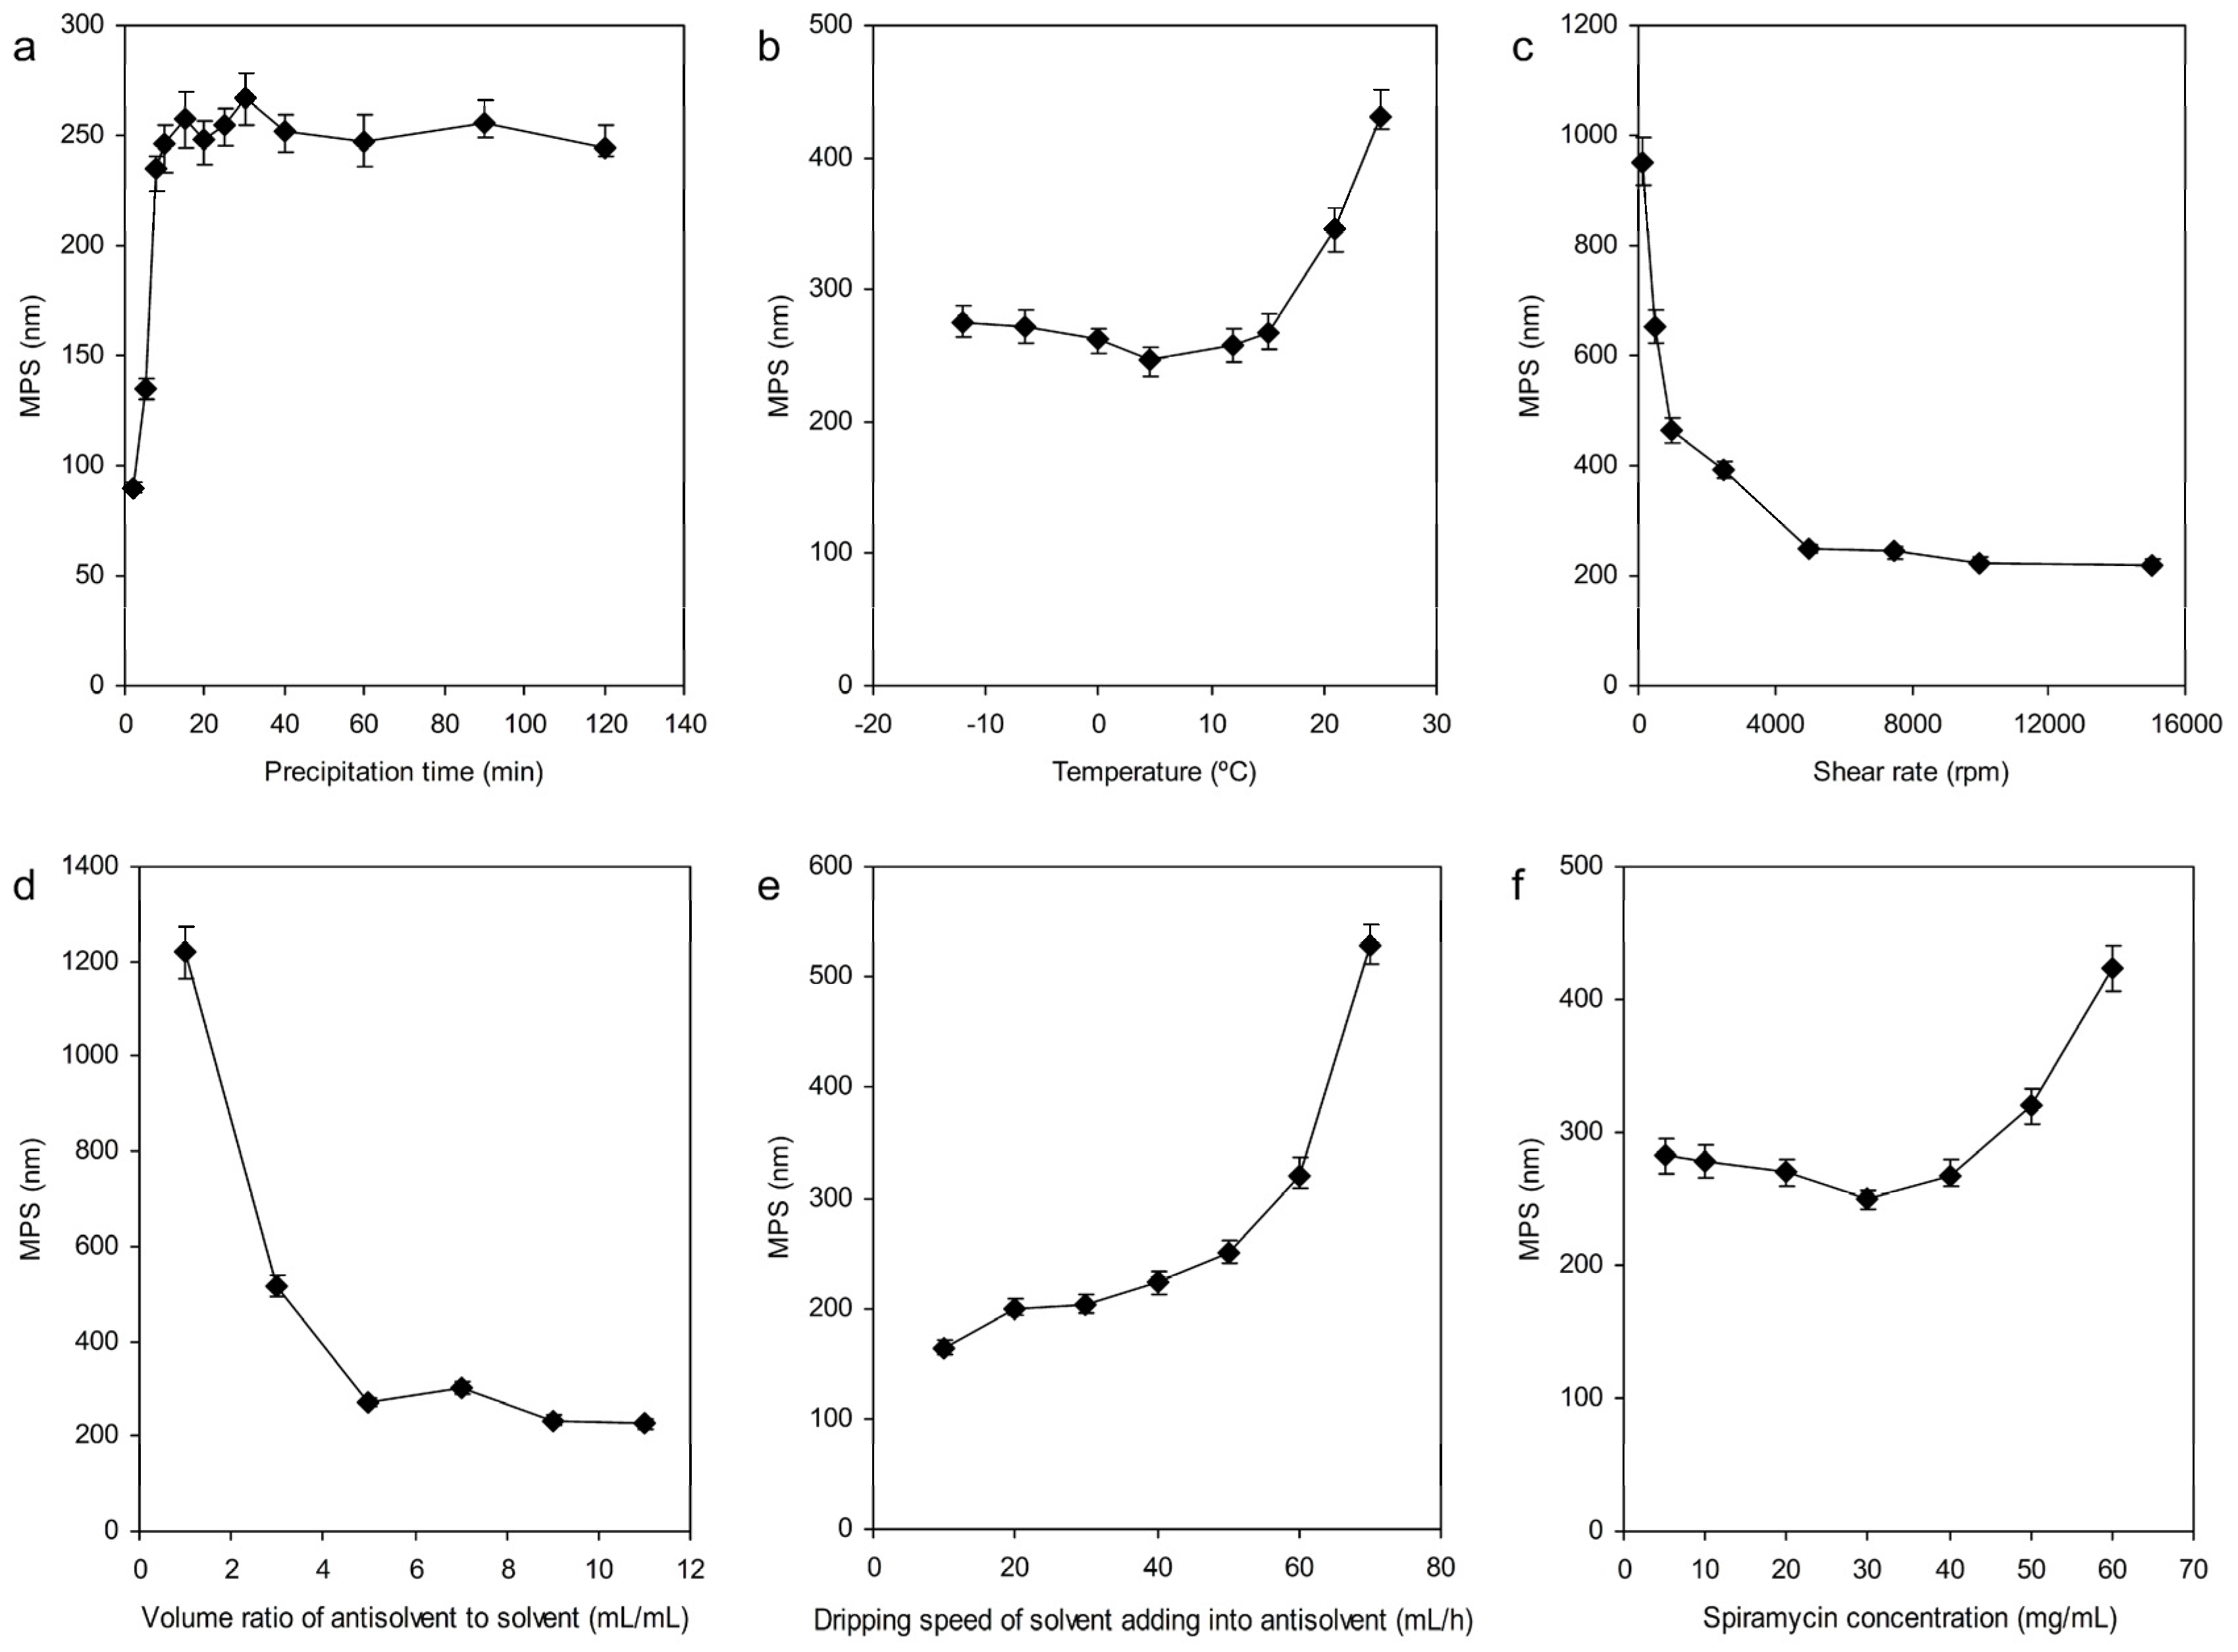
3.1.1. Effect of Precipitation Time

Figure 3a shows the influence of precipitation time on the MPS of spiramycin, from which we can see that the MPS of spiramycin increased from 90 ± 2 nm to 246 ± 11 nm when the precipitation time increased from 2 min to 10 min. However, no significant change in MPS of spiramycin was observed with further increase in precipitation time to 120 min. The reason for this result was interpreted as follows: Small particles were formed immediately when adding spiramycin solution into the antisolvent, but the small particles formed would aggregate together to grow into larger ones during the homogenate process, owing to the Ostwald ripening effect [34,35], whereas, no further obvious increase of the MPS with further increase in precipitation time was attributed to the destruction of larger crystals into smaller particles by homogenization [36]. As for the precipitation time of 2–8 min, although the MPS was smaller, the precipitates dissolved out incompletely, resulting in a lower yield. Considering both the effect of the precipitation time on the yield and MPS, 10 min was selected as the optimum precipitation time for obtaining small particles and applied in the further experiments.

3.1.2. Precipitation Temperature

Precipitation temperature was a crucial factor for the solubility and crystallization rate, the influence of which was evaluated with various levels, −12, −6.5, 0, 4.6, 12, 15, 21, and 25 °C. Other conditions adopted were a spiramycin concentration of 10 mg/mL, shear rate of 5000 rpm, volume ratio of antisolvent to solvent of 5 mL/mL, precipitation time of 10 min, and a dripping speed of solvent of 50 mL/h. From Figure 3b, the MPS decreased slowly and then increased drastically when the precipitation temperature ranged from −12 to 4.6 °C and 4.6–25 °C, respectively. The spiramycin solubility in DMSO and water-mixed solution was improved under high temperatures, thus leading to a low supersaturation and a slow nucleation rate. Larger numbers of nuclei formed hindering the diffusion between solvent to antisolvent, causing the aggregation of spiramycin particles [36,37]. Supersaturation highly influenced nucleation, thus further affecting the particle size of spiramycin. Under low temperatures, an improvement of the supersaturation and nucleation rate occurred, resulting in smaller particles. The minimum MPS was achieved at the precipitation temperature of 4.6 °C; thus, the optimum precipitation temperature was 4.6 °C.

3.1.3. Shear Rate

Shear rate plays an important role in obtaining particle sizes with low MPS during the antisolvent process. Figure 3c showed that a notable reduction of MPS of spiramycin occurred when the shear rate increased from 100 to 5000 rpm. By contrast, a shear rate over 5000 rpm had only a weak influence on the MPS. It is perfect that the micromixing time is less than the nucleation time, which plays a crucial role in preparing ultrafine particles with uniform particle size distribution [38]. A fast nucleation rate is conducive to producing drugs with smaller particles [36]. A higher shear rate can lead to the materials being mixed more homogeneously, which contributes to creating a uniform space distribution of concentration and improves the micromixing between the multiphases. Moreover, the homogenate at a high shear rate can break the agglomeration between particles; thus, 5000 rpm was considered as the optimum shear rate.

3.1.4. The Volume Ratio of Antisolvent to Solvent

Another important factor is the volume ratio of antisolvent to solvent, and the influence of it on the crystal growth has been evaluated, with MPS as the response. The results shown in Figure 3d illustrated that a sharp decrease in the MPS of spiramycin from 1220 ± 55 nm to 270 ± 9.5 nm with the volume ratio of antisolvent to solvent ranged from 1 to 5. However, no significant effect was obtained when the volume ratio of antisolvent to solvent further increased up to 11. For a given temperature, the addition of antisolvent contributes to reducing the drug solubility in the mixed solution and enhances the supersaturation, thus leading to the reduction of the drug particle size. By contrast, the change in the supersaturation with the further increase of the volume ratio of antisolvent to solvent is non-significant, followed by a minor change in particle size. In addition, for further comparison, the spiramycin particles were centrifuged and dried to calculate the yield of spiramycin, and the maximum yield (95% ± 2.2%) was obtained with the volume ratio of antisolvent to solvent of 5 mL/mL. Therefore, with the antisolvent amount enhanced, not only the supersaturation was increased for improving yield, but also the drug concentration in the crystallization system and nucleation rate were reduced. Thus, a volume ratio of antisolvent to solvent in the range of 3–7 mL/mL is used in the further optimization study.

3.1.5. The Dripping Speed of Solvent Adding into Antisolvent

From Figure 3e, it is evident that the MPS of spiramycin increased with the increasing of the dripping speed from 10 mL/h to 70 mL/h. The amount of antisolvent and solvent per unit time was increased with a higher dripping speed, which was due to the increase of nucleation rate. However, the micromixing time was relatively prolonged with a high dipping speed, thus, further resulting in nonuniform supersaturation and growth of particles. An appropriate increase in the dripping speed is conducive to improving the overall efficiency of the manufacturing process, considering the gradual increase of MPS in the range of 20–60 mL/h, 40–60 mL/h is taken for further optimization experiments.

3.1.6. Concentration of Spiramycin

The result presented in Figure 3f indicated that an initial slight decrease of the MPS of spiramycin was followed by a sharp enhancement of MPS when the spiramycin concentration increased from 5 mg/mL to 30 mg/mL, and 30 mg/mL to 60 mg/mL. For interpreting this phenomenon, three points were listed as follows: Firstly, higher supersaturation can be formed with a higher spiramycin concentration, which is conducive to promoting the nucleation rate and leads to small particle size [39,40]; secondly, the viscosity of the spiramycin solution also increased with the increase of concentration to 30 mg/mL, which retards the diffusion between solution and antisolvent, thereby facilitating the particles being aggregated [41,42]; finally, a large number of nuclei can be formed at the interface of the antisolvent and solvent at high concentration, 30 mg/mL, thus decreasing the diffusion from solvent to antisolvent and accelerating agglomeration [40,41]. In view of this, a 10–30 mg/mL spiramycin concentration was selected for further optimization experiments.

3.2. Optimization Parameters by Response Surface Methodology

In order to further investigate the interactions between the variables, including spiramycin concentration, the volume ratio of antisolvent to solvent and the dripping speed of solvent adding into antisolvent, RSM with BBD was applied in this study. As can be seen in Table 1, the model with an F-value of 113.00 and p-value of less than 0.0001 implied the model term was significant and appeared to reasonably represent the data, with only a <0.01% chance that a value of this size was due to noise. A p-value less than 0.05 generally indicates that a model term is significant, and non-significant otherwise. In this case, eight terms of X1, X2, X3, X1X2, X2X3, X12, X22, and X32 performed significantly, whereas X1X3 with p-value greater than 0.10 indicated that the model term was not significant. The “Lack of fit” with F-value of 1.00 and p-value of 0.3970 indicated that the lack of fit was not significant relative to the pure error. A 39.70% chance for a “lack of fit” this large could occur due to noise. Non-significant lack of fit is desired, which implied that the model could fit the data adequately. The “Pred R2” of 0.9410 was in reasonable agreement with the “Adj R2” of 0.9843. “Adequacy precision” was used to measure the signal to noise ratio. A ratio of 31.94, greater than 4, implied an adequate signal. This model can be used to navigate the design space.
The final MPS of spiramycin microparticle (Y) was given by:
Y = 1497.84 − 7.83X1 − 70.88X2 − 43.28X3 − 0.69X1X2 − 0.06X1X3 + 0.76X2X3 + 0.38X12 + 3.61X22 + 0.48X32
The mutual influences of the three independent variables and their interactions on MPS of spiramycin were visualized and studied by three-dimensional response surfaces, which are shown in showed in Figure 4. Figure 4a–c presented the interaction of spiramycin concentration and volume ratio of antisolvent to solvent, spiramycin concentration and dripping speed of solvent adding into antisolvent, and the volume ratio of antisolvent to solvent and dripping speed of solvent adding into antisolvent, respectively.
The optimum conditions predicted by software were: a spiramycin concentration of 20 mg/mL, a volume ratio of antisolvent to solvent of 7 mL/mL, and a dripping speed of solvent adding into antisolvent of 44 mL/h. Under these conditions of point prediction, the MPS of spiramycin microparticles can reach 224.37 nm.
The verification tests were conducted three times under the optimum conditions mentioned above. The actual MPS was 228.36 nm with an error about 3.99 nm.

3.3. Physicochemical Evaluation of Spiramycin

The solid-state properties of the drug, including solubility and dissolution rate, were very important. Thus, the micronized spiramycin powders obtained were characterized by SEM, FTIR, and XRD to show the solid-state properties of spiramycin.

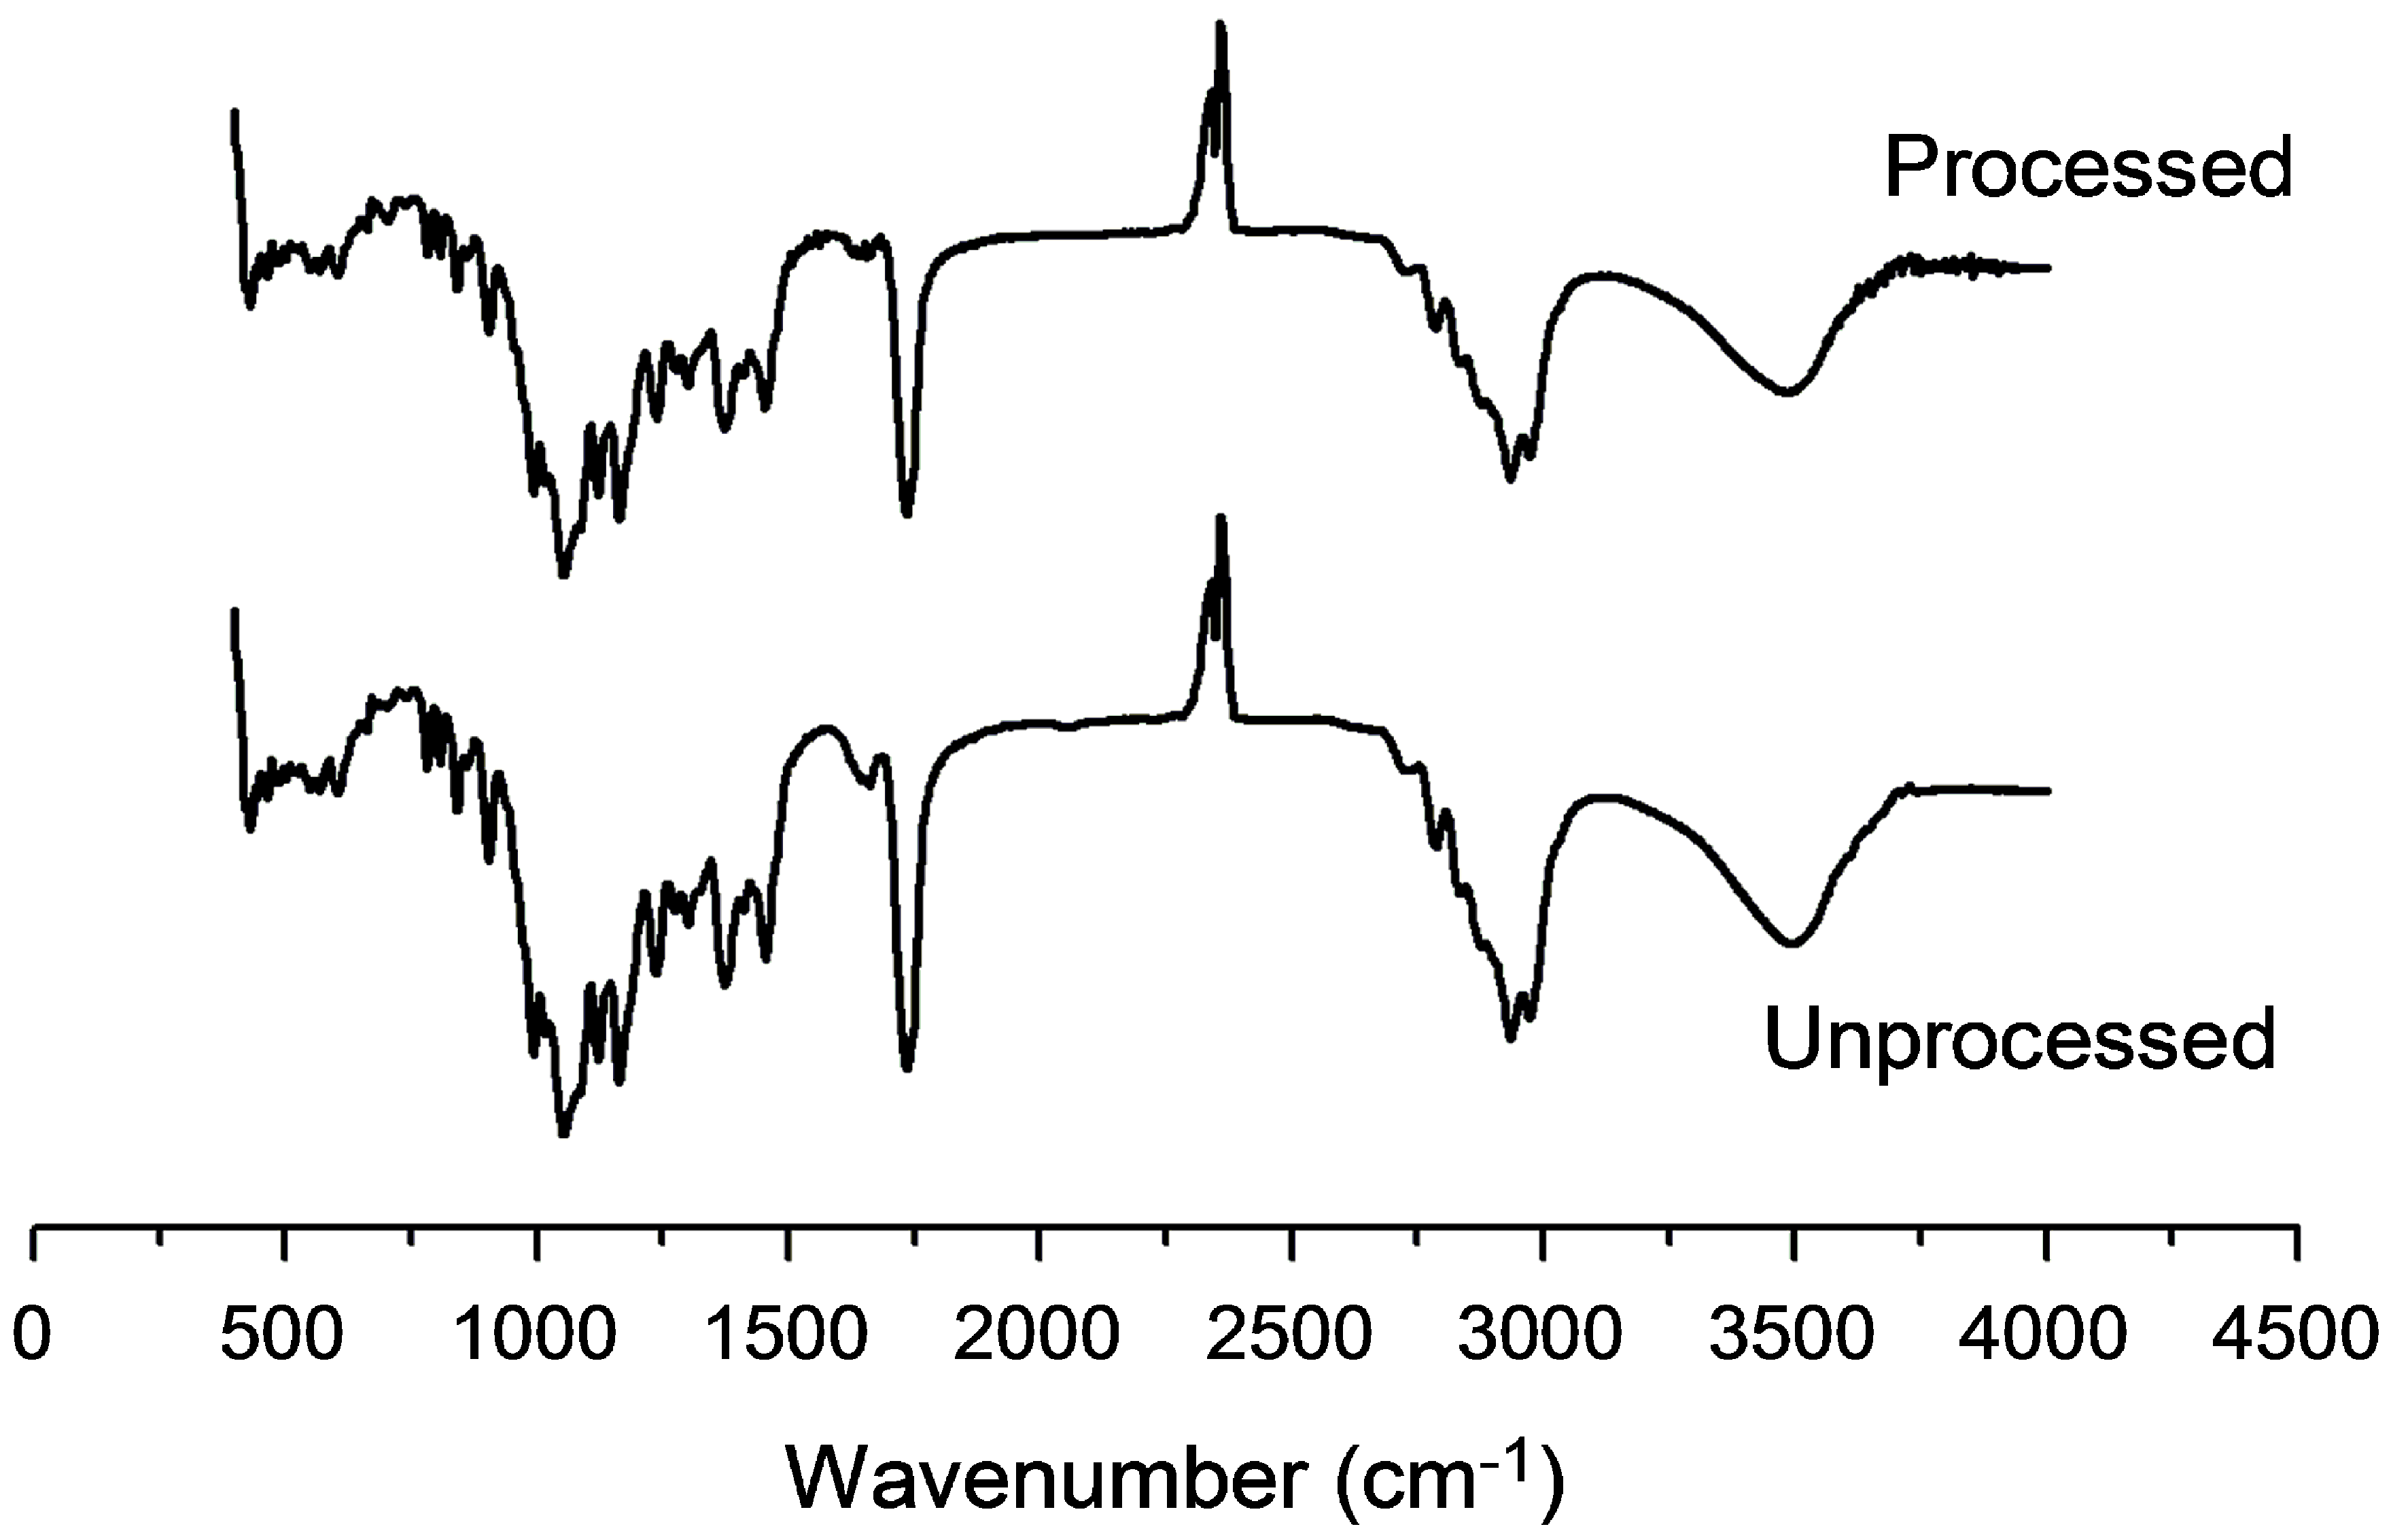
3.3.1. Fourier Transform Infrared Spectroscopy Analysis

Figure 5 is the FTIR spectrum of the unprocessed and processed spiramycin. FTIR spectra between raw spiramycin and processed spiramycin show no significant differences, combined with the HPLC result (unprocessed spiramycin contains spiramycin I, 94.60%; spiramycin II, 3.45%; and spiramycin III, 1.84%; spiramycin microparticles contains spiramycin I, 95.38%; spiramycin II, 3.53%; and spiramycin III, 0.96%), indicating that the chemical structure of the spiramycin was not changed after the processing process.

3.3.2. Powder X-ray Diffraction Analysis

XRD analysis was carried out to further evaluate the occurrence of eventual structural changes at the crystal level. The XRD results for unprocessed and micronized spiramycin are presented in Figure 6. In the XRD, a low intensity distinct peak of both unprocessed and processed spiramycin at the diffraction angles of 2θ = 23.68° reveals the presence of only weak crystalline form, which implied that both unprocessed and processed spiramycin mainly existed in an amorphous state. The reason why spiramycin existed in an amorphous state was speculated, in that spiramycin itself was composed of a mixture of spiramycin I, spiramycin II, spiramycin III, and other derivatives.

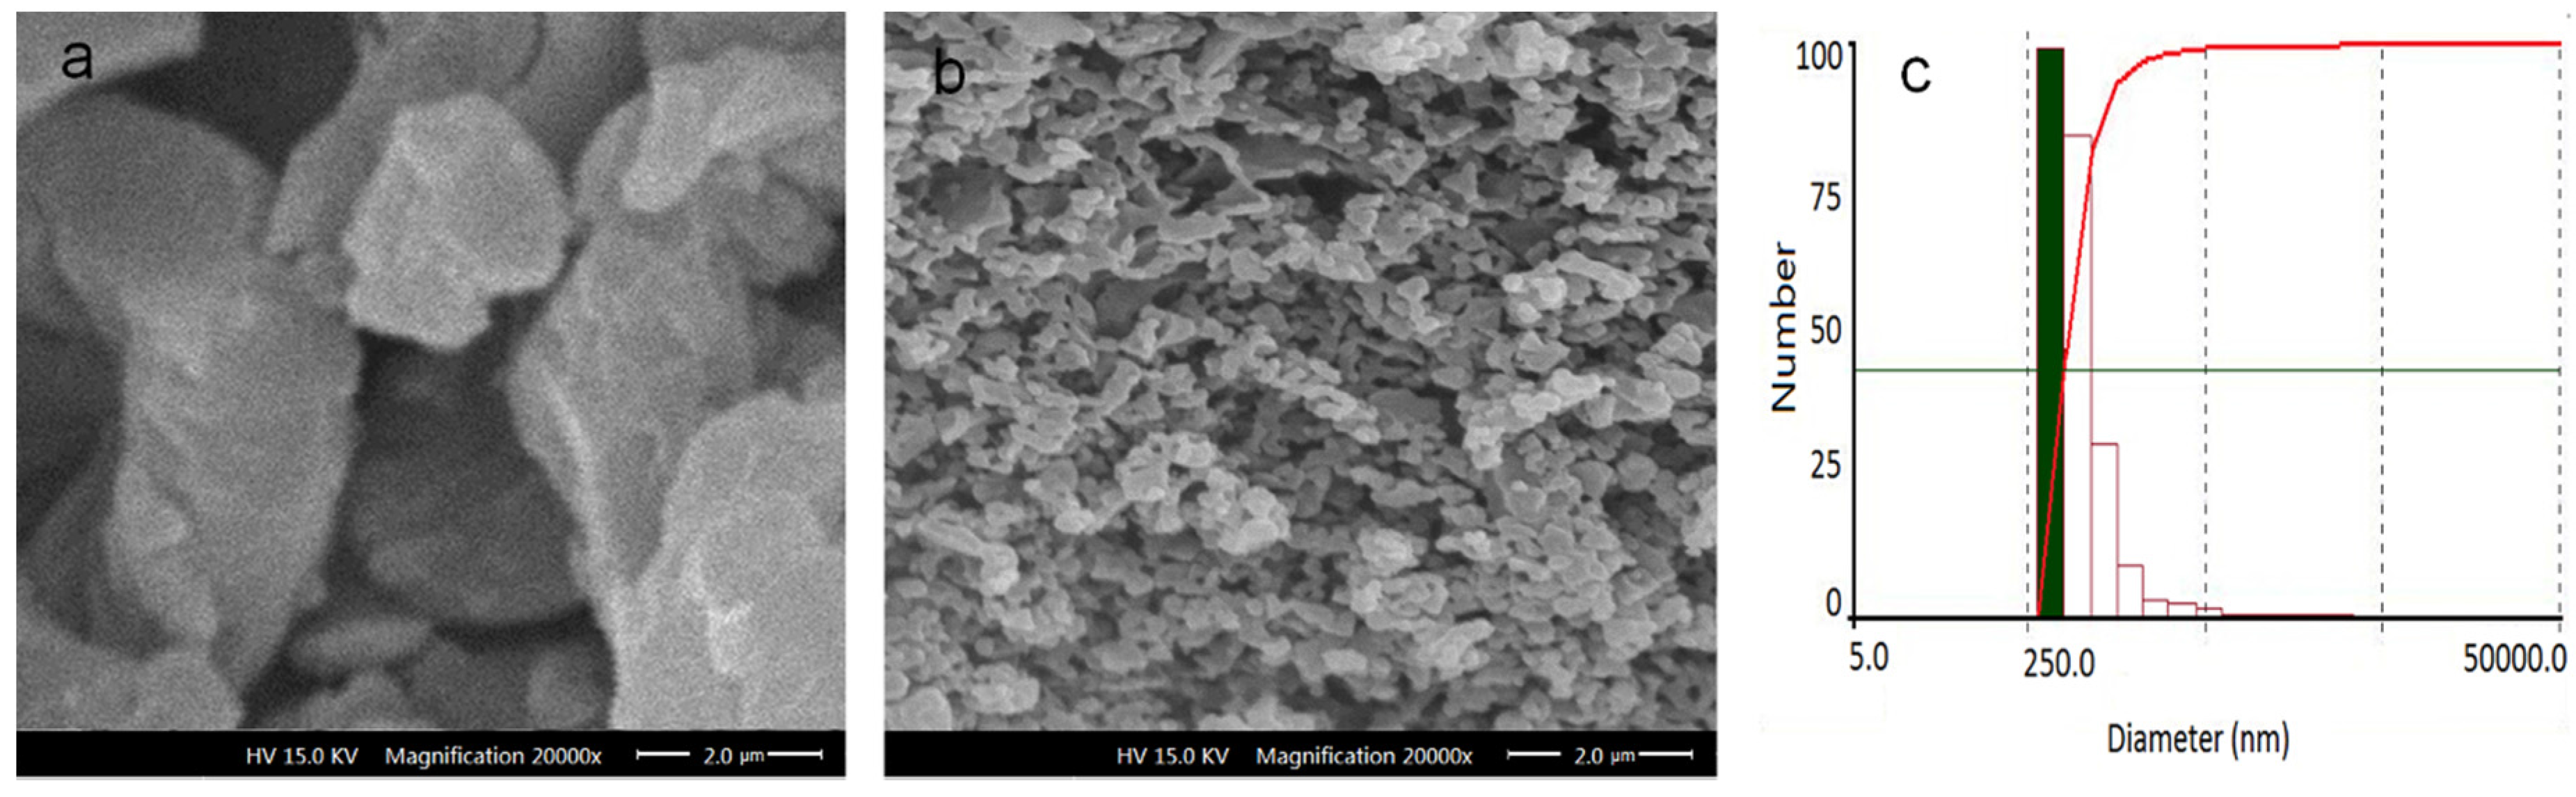
3.3.3. Scanning Electron Microscope (SEM)

Figure 7a,b shows the SEM images of unprocessed and processed spiramycin particles. Raw spiramycin particles have appeared as irregular-shaped large granules with the diameter ranging from about 2–8 μm. The morphology and shape of processed spiramycin particles changed drastically. Particles from HAP process were observed as sub-spherical shape with particle size of about 0.25 μm (Figure 7c). The results pointed out that the particle size of spiramycin reduced significantly after the HAP process, reduced at least eight times.

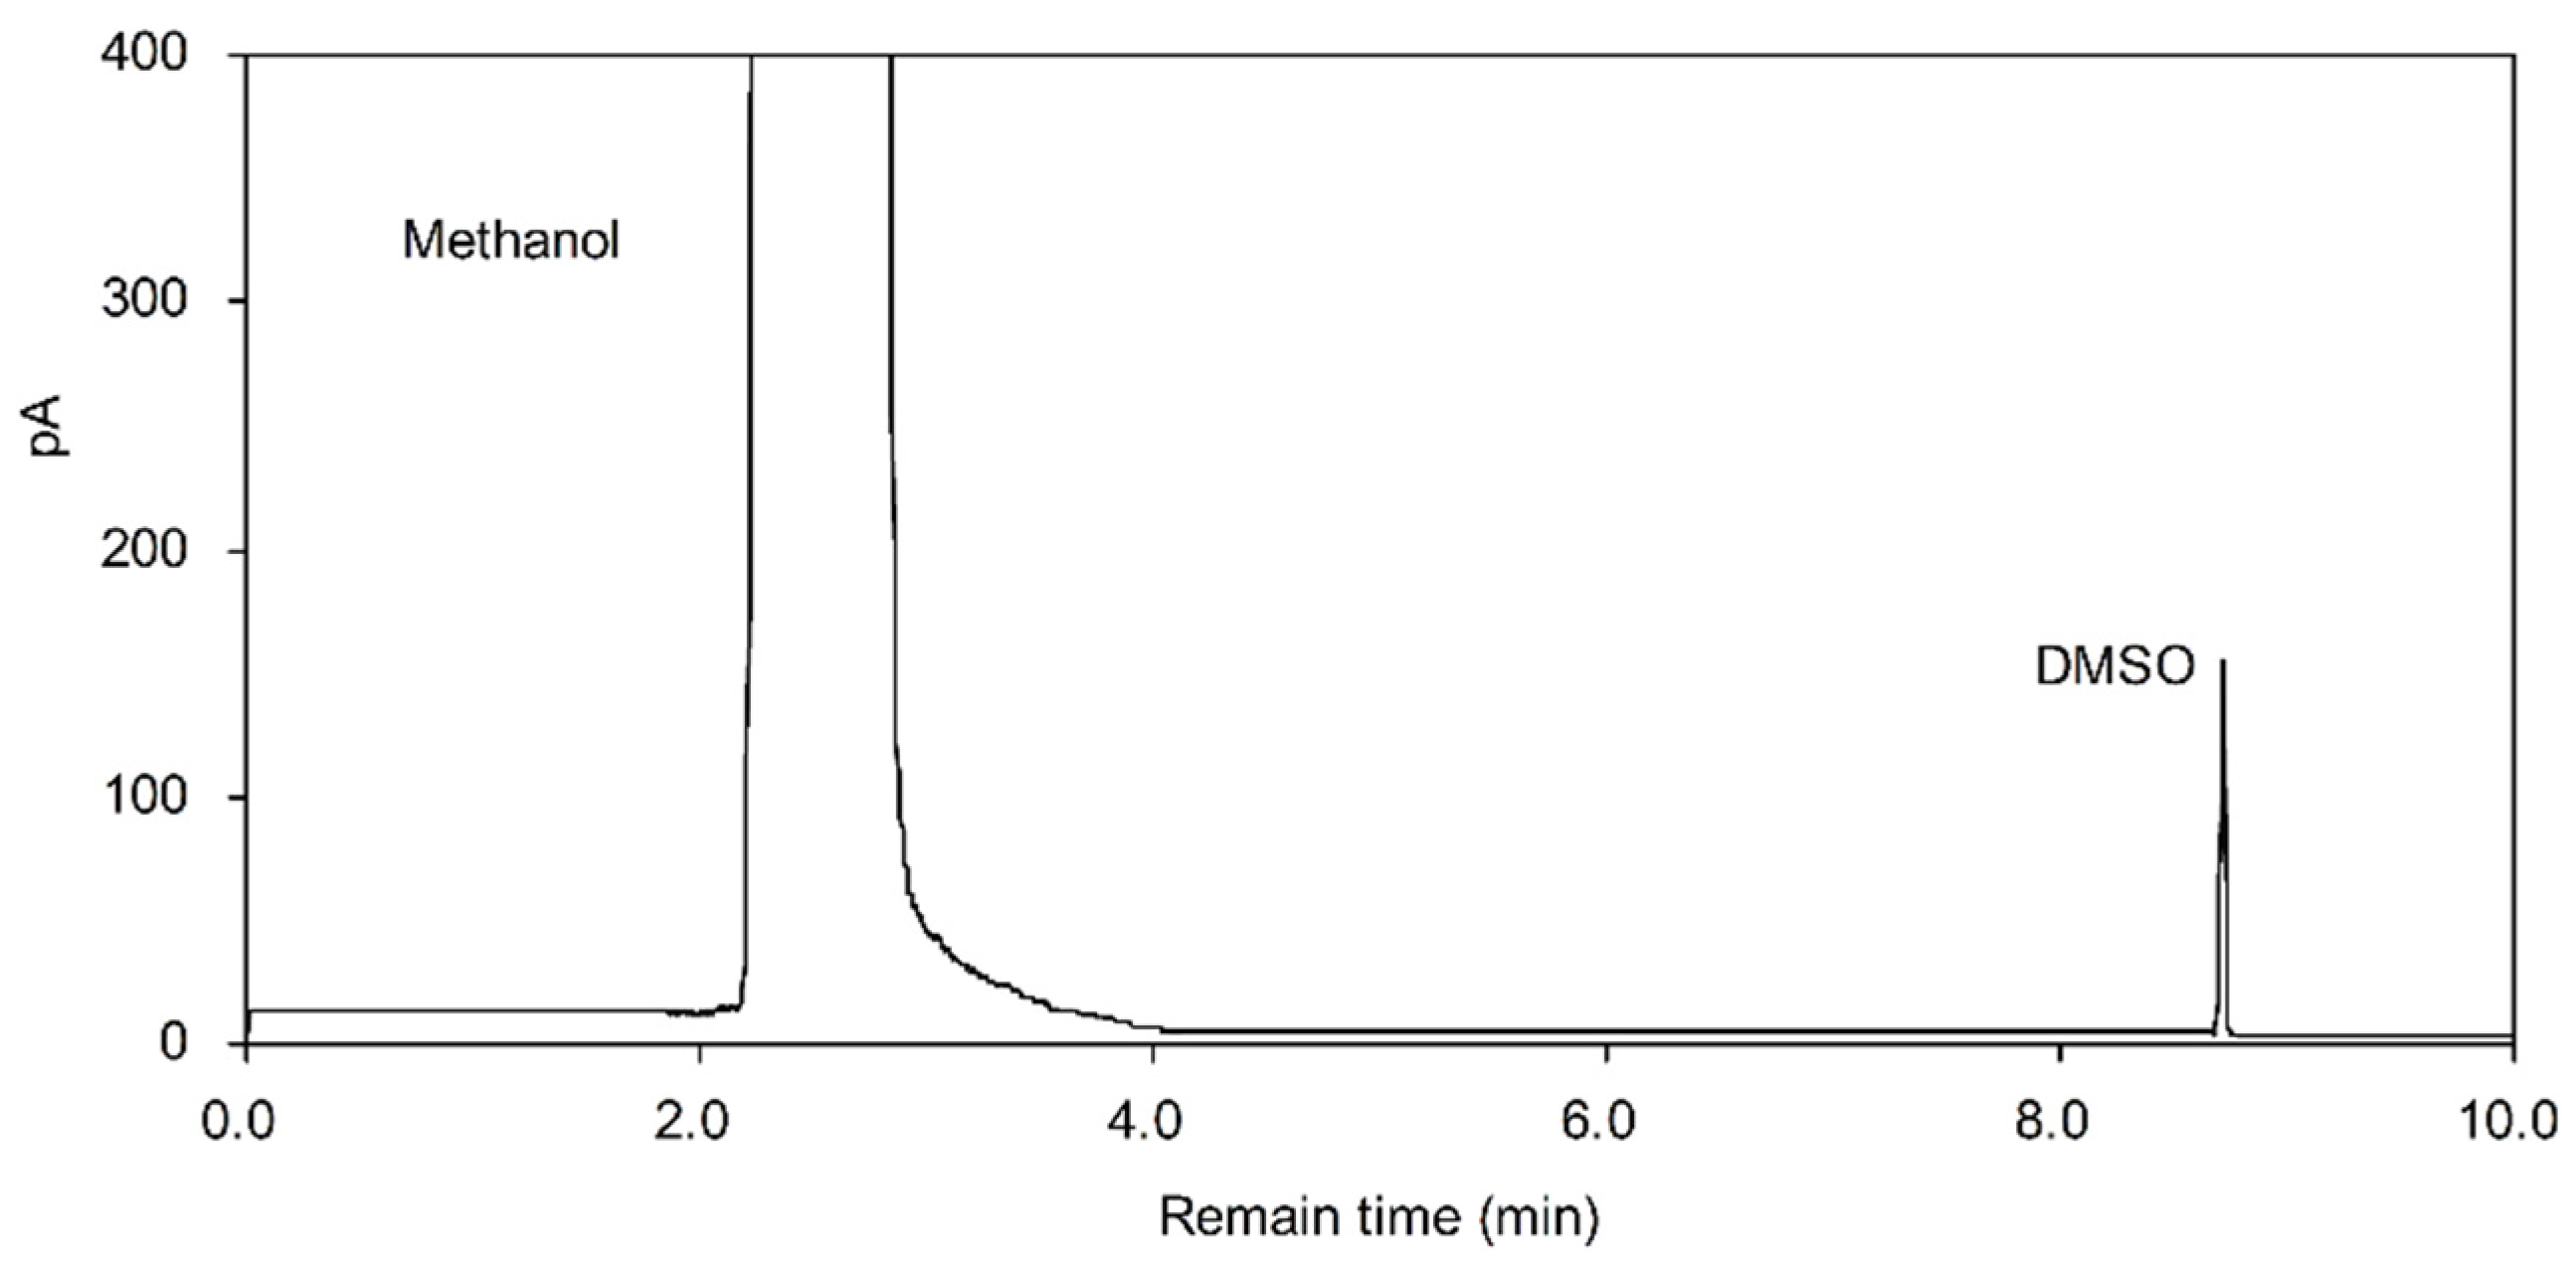
3.4. Solvent Residues Analysis

In pharmaceutical products, the solvent residue is a serious problem and is under consideration. In this work, the preparation of spiramycin particles was realized by the HAP process using the International Conference on Harmonization (ICH) class III solvent DMSO with low toxicity [43]. As shown in Figure 8, the residual DMSO content in the spiramycin (prepared using DMSO as the solvent) was determined by GC analysis, DMSO with retention time of 8.45 min, and a standard curve of Y = 341.68X + 2.02 (R2 = 0.9997), where Y is the peak area and X is the DMSO concentration. The residual DMSO concentration in the spiramycin microparticles was calculated to be 0.33%, according to this regression equation. The spiramycin microparticles conform to the ICH standard and are, therefore, suitable for pharmaceutical utilization.

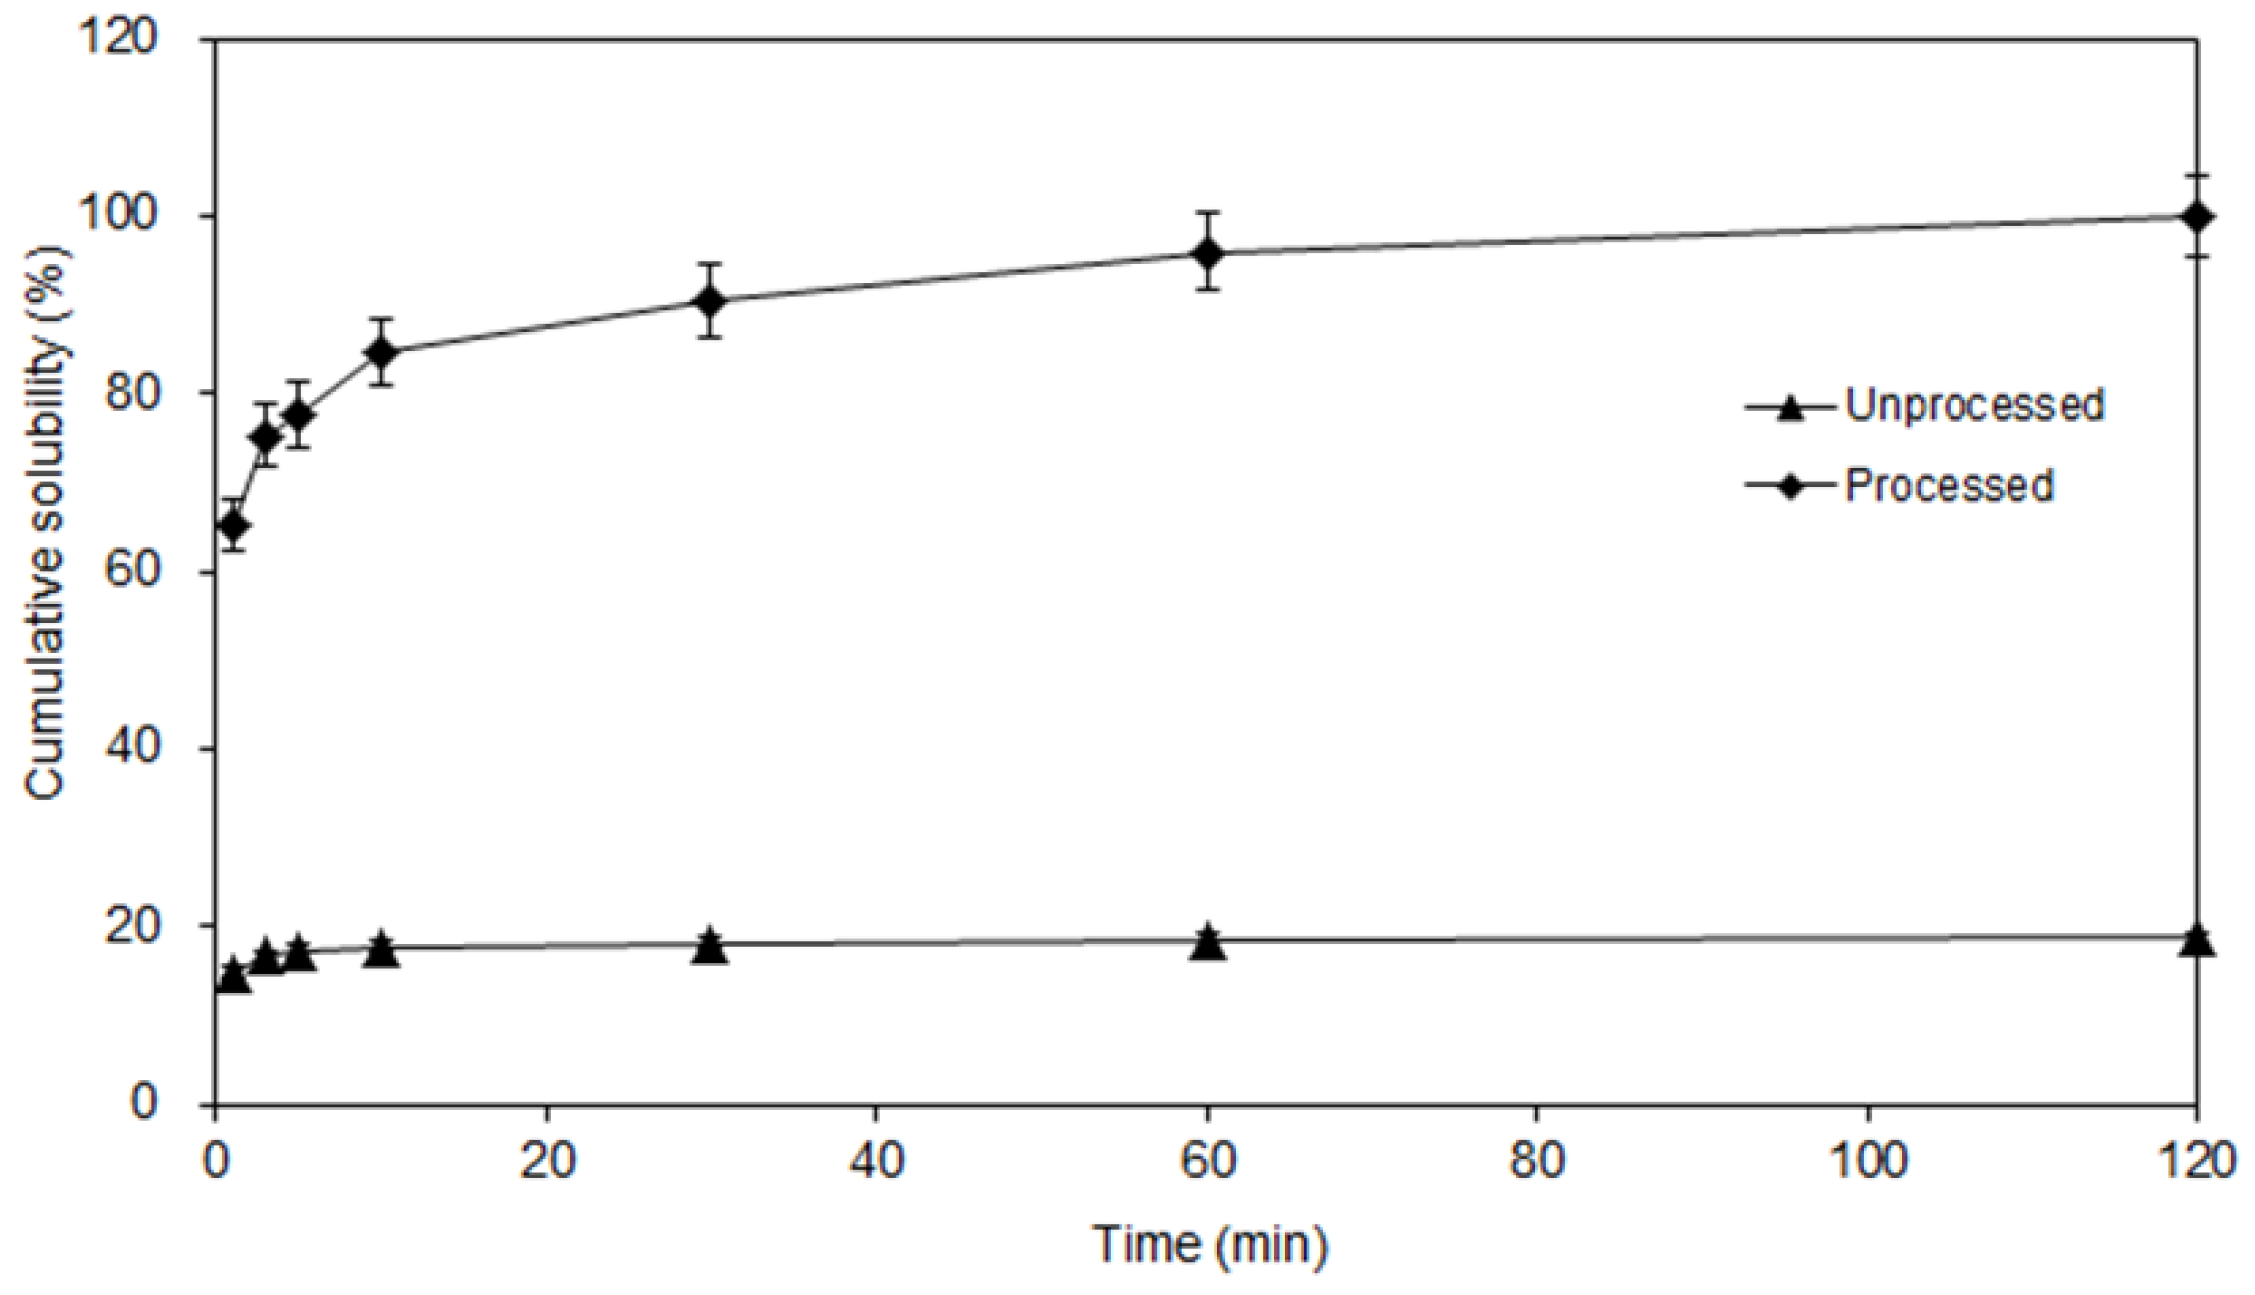
3.5. Dissolution Studies

The dissolution profiles of the raw spiramycin particles and spiramycin microparticles are shown in Figure 9, the data of which was represented by spiramycin I. A higher dissolution rate was produced by the micronized spiramycin than the raw spiramycin particles. The concentration of micronized spiramycin at 120 min was taken as 100%, and the cumulative solubility of raw spiramycin particles and micronized spiramycin after different times was expressed as a percentage of the concentration obtained in the concentration of micronized spiramycin at 120 min. As depicted in Figure 9, the process required 60 min for raw spiramycin particles to reach the maximum saturation concentration (approximately 18.57%). By contrast, at 60 min, the concentration of micronized spiramycin just reached saturation point with the maximum saturation concentration of about 95.90%. According to the Kelvin equation, the surface tension and the molar free energy of particles change when the particle becomes gradually smaller, thus leading to the increased solubility [44].

5. Conclusions

In the six parameters that affect the HAP micronization of spiramycin, spiramycin concentration, the volume ratio of antisolvent to solvent, and the dripping speed of the solvent adding into the antisolvent have a significant effect on the MPS of micronized spiramycin, but the other three factors contributed an insignificant effect. According to the evaluation using BBD, the MPS of the processed spiramycin can reach 228.36 ± 3.99 nm. The optimum conditions for micronization are as follows: the precipitation temperature is 4.6 °C, the precipitation time is 10 min, the spiramycin concentration is 20 mg/mL, the dripping speed of the solvent adding into the antisolvent is 44 mL/h, the volume ratio of antisolvent to solvent is 7 mL/mL, and the shear rate is 5000 rpm. The characterization data of the micronized spiramycin using SEM and FTIR indicated that no degradation of spiramycin is induced by the HAP process. The XRD result showed that both the unprocessed and processed spiramycin were mainly in an amorphous state. Moreover, the residual content of DMSO in micronized spiramycin is less than the ICH limit for class 3 solvents.

Acknowledgments

This work is supported by open fund of Key Laboratory of Soybean Biology in Chinese Ministry of Education (Serial Number: SB16C03).

Author Contributions

Xiuling Zhang, and Lianzhou Jiang conceived the underlying idea of the paper. Xiaonan Zhang, Xia Wu, Fengying Xie and Zhongjiang Wang contributed to the practical aspects of the research work; Xiaonan Zhang and Xiuling Zhang analyzed the data; Xiaonan Zhang and Xiuling Zhang wrote the manuscript.

Conflicts of Interest

The authors declare no conflict of interest.

References

  1. Kernbaum, S. Susceptibility of mycoplasmas and chlamydiae to macrolides. J. Antimicrob. Chemother. 1985, 16, 199–200. [Google Scholar] [CrossRef] [PubMed]
  2. Rubinstein, E.; Keller, N. Spiramycin renaissance. J. Antimicrob. Chemother. 1998, 42, 572–576. [Google Scholar] [CrossRef] [PubMed]
  3. Rocha, R.T.; Awad, C.E.; Ali, A.; Matyas, R.; Vital, A.C.; Silva, C.O. Comparison of spiramycin and clarithromycin for community-acquired lower respiratory tract infections. Int. J. Clin. Pract. 1996, 53, 433–436. [Google Scholar]
  4. Bunetel, L.; Guerin, J.; Agnani, G.; Piel, S.; Pinsard, H.; Corbel, J.C.; Bonnaure-Mallet, M. In vitro study of the effect of titanium on porphyromonas gingivalis in the presence of metronidazole and spiramycin. Biomaterials 2001, 22, 3067–3072. [Google Scholar] [CrossRef]
  5. Mourier, P.; Brun, A. Study of the metabolism of spiramycin in pig liver. J. Chromatogr. B 1997, 704, 197–205. [Google Scholar] [CrossRef]
  6. Engel, G.; Farid, N.; Faul, M.; Richardson, L.; Winneroski, L. Salt form selection and characterization of LY333531 mesylate monohydrate. Int. J. Pharm. 2000, 198, 239–247. [Google Scholar] [CrossRef]
  7. Perng, C.; Kearney, A.; Palepu, N.; Smith, B.; Azzarano, L. Assessment of oral bioavailability enhancing approaches for SB-247083 using flow-through cell dissolution testing as one of the screens. Int. J. Pharm. 2003, 250, 147–156. [Google Scholar] [CrossRef]
  8. Ahmed, A. Mechanism of inhibition of protein synthesis by spiramycin. Biochim. Biophys. Acta 1968, 166, 205–217. [Google Scholar] [CrossRef]
  9. Brisson-Noel, A.; Trieu-Cuot, P.; Courvalin, P. Mechanism of action of spiramycin and other macrolides. J. Antimicrob. Chemother. 1988, 22, 13–23. [Google Scholar] [PubMed]
  10. Choi, W.S.; Kim, H.I.; Kwak, S.S.; Chung, H.Y.; Chung, H.Y.; Yamamoto, K.; Oguchi, T.; Tozuka, Y.; Yonemochi, E.; Terada, K. Amorphous ultrafine particle preparation for improvement of bioavailability of insoluble drugs: Grinding characteristics of fine grinding mills. Int. J. Miner. Process. 2004, 74, S165–S172. [Google Scholar] [CrossRef]
  11. Chen, Y.; Zhang, G.; Neilly, J.; Marsh, K.; Mawhinney, D.; Sanzgiri, Y. Enhancing the bioavailability of ABT-963 using solid dispersion containing Pluronic F-68. Int. J. Pharm. 2004, 286, 69–80. [Google Scholar] [CrossRef] [PubMed]
  12. Paradkar, A.; Ambike, A.; Jadhav, B.; Mahadik, K. Characterization of curcumin-PVP solid dispersion obtained by spray drying. Int. J. Pharm. 2004, 271, 281–286. [Google Scholar] [CrossRef] [PubMed]
  13. Farinha, A.; Bica, A.; Tavares, P. Improved bioavailability of amicronizedmege strol acetate tablet formulation in humans. Drug Dev. Ind. Pharm. 2000, 26, 567–570. [Google Scholar] [CrossRef] [PubMed]
  14. Hattori, Y.; Haruna, Y.; Otsuka, M. Dissolution process analysis using model-free Noyes-Whitney integral equation. Colloids Surf. B 2013, 102, 227–231. [Google Scholar] [CrossRef] [PubMed]
  15. Chen, D.; Li, D.Y.; Zhang, Y.Z.; Kang, Z.T. Preparation of magnesium ferrite nanoparticles by ultrasonic wave-assisted aqueous solution ball milling. Ultrason. Sonochem. 2013, 20, 1337–1340. [Google Scholar] [CrossRef] [PubMed]
  16. Krause, K.P.; Müller, R.H. Production and characterization of highly concentrated nanosuspensions by high pressure homogenization. Int. J. Pharm. 2001, 214, 21–24. [Google Scholar] [CrossRef]
  17. Aoki, M.; Nishimura, H.; Mimura, A.; Kita, S.; Yasuzawa, T.; Terada, K. Identification of the degradation products of the steroid sulfatase inhibitor KW-2581 in jet mill-micronized powder. J. Pharm. Sci. 2013, 102, 1760–1772. [Google Scholar] [CrossRef] [PubMed]
  18. Chan, L.W.; Lee, C.C.; Heng, P.W. Ultrafine grinding using a fluidized bed opposed jet mill: Effects of feed load and rotational speed of classifier wheel on particle shape. Drug Dev. Ind. Pharm. 2002, 28, 939–947. [Google Scholar] [CrossRef] [PubMed]
  19. Yang, L.; Huang, J.; Zu, Y.; Ma, C.; Wang, H.; Sun, X.; Sun, Z. Preparation and radical scavenging activities of polymeric procyanidins nanoparticles by a supercritical antisolvent (SAS) process. Food Chem. 2011, 128, 1152–1159. [Google Scholar] [CrossRef]
  20. Yang, L.; Sun, Z.; Zu, Y.; Zhao, C.; Sun, X.; Zhang, Z.; Zhang, L. Physicochemical properties and oral bioavailability of ursolic acid nanoparticles using supercritical anti-solvent (SAS) process. Food Chem. 2012, 132, 319–325. [Google Scholar] [CrossRef] [PubMed]
  21. Prosapio, V.; de Marco, I.; Scognamiglio, M.; Reverchon, E. Folic acid-PVP nanostructured composite microparticles by supercritical antisolvent precipitation. Chem. Eng. J. 2015, 277, 286–294. [Google Scholar] [CrossRef]
  22. Majerik, V.; Charbit, G.; Badens, E.; Horváth, G.; Szokonya, L.; Bosc, N.; Teillaud, E. Bioavailability enhancement of an active substance by supercritical antisolvent precipitation. J. Supercrit. Fluids 2007, 40, 101–110. [Google Scholar] [CrossRef]
  23. Chen, F.; Li, T.; Li, S.; Hou, K.; Liu, Z.; Li, L.; Cui, G.; Zu, Y.; Yang, L. Preparation and characterization of Tripterygium wilfordii multi-glycoside nanoparticle using supercritical anti-solvent process. Int. J. Mol. Sci. 2014, 15, 2695–2711. [Google Scholar] [CrossRef] [PubMed]
  24. Li, Y.; Zhao, X.; Zu, Y.; Zhang, Y. Preparation and characterization of paclitaxel nanosuspension using novel emulsification method by combining high speed homogenizer and high pressure homogenization. Int. J. Pharm. 2015, 490, 324–333. [Google Scholar] [CrossRef] [PubMed]
  25. Homayouni, A.; Sadeghi, F.; Varshosaz, J.; Afrasiabi, G.H.; Nokhodchi, A. Promising dissolution enhancement effect of soluplus on crystallized celecoxib obtained through antisolvent precipitation and high pressure homogenization techniques. Colloids Surf. B 2014, 122, 591–600. [Google Scholar] [CrossRef] [PubMed]
  26. Gao, Y.; Wang, J.; Wang, Y.; Yin, Q.; Glennon, B.; Zhong, J.; Ouyang, J.; Huang, X.; Hao, H. Crystallization methods for preparation of nanocrystals for drug delivery system. Curr. Pharm. Des. 2015, 21, 3131–3139. [Google Scholar] [CrossRef] [PubMed]
  27. Anand, K.; Varghese, S.; Kurian, T. Preparation of ultra-fine dispersions of zinc oxide by simple ball-milling: Optimization of process parameters. Powder Technol. 2015, 71, 187–192. [Google Scholar] [CrossRef]
  28. De Paiva, L.B.; de Oliveira, A.M.; Gavioli, R.R. Preparation and properties of rubber powder from modified-SBR latex by spray drying process. Powder Technol. 2014, 264, 507–513. [Google Scholar] [CrossRef]
  29. Tenorio, A.; Gordillo, M.D.; Pereyra, C.; de la Ossa, E.J.M. Controlled submicro particle formation of ampicillin by supercritical antisolvent precipitation. J. Supercrit. Fluids 2007, 40, 308–316. [Google Scholar] [CrossRef]
  30. Fodor-Kardos, A.; Toth, J.; Gyenis, J. Preparation of protein loaded chitosan microparticles by combined precipitation and spherical agglomeration. Powder Technol. 2013, 244, 16–25. [Google Scholar] [CrossRef]
  31. Ober, C.A.; Kalombo, L.; Swai, H.; Gupta, R.B. Preparation of rifampicin/lactose microparticle composites by a supercritical antisolvent-drug excipient mixing technique for inhalation delivery. Powder Technol. 2013, 236, 132–138. [Google Scholar] [CrossRef]
  32. Nielsen, P.; Gyrd-hansen, N. Bioavailability of spiramycin and lincomycin after oral administration to fed and fasted pigs. J. Vet. Pharmacol. Ther. 1998, 21, 251–256. [Google Scholar] [CrossRef] [PubMed]
  33. Pharmacopoeia of the People’s Republic of China; China Medical Science and Technology Press: Beijing, China, 2015.
  34. Prieto, G.; Meeldijk, J.D.; de Jong, K.P.; de Jongh, P.E. Interplay between pore size an d nanoparticle spatial distribution: Consequences for the stability of CuZn/SiO2 methanol synthesis catalysts. J. Catal. 2013, 303, 31–40. [Google Scholar] [CrossRef]
  35. Moura, A.P.; Cavalcante, L.S.; Sczancoski, J.C.; Stroppa, D.G.; Paris, E.C.; Ramirez, A.J.; Varela, J.A.; Longo, E. Structure and growth mechanism of CuO plates obtained by microwave-hydrothermal without surfactants. Adv. Powder Technol. 2010, 21, 197–202. [Google Scholar] [CrossRef]
  36. Zhang, H.; Wang, J.; Zhang, Z.; Le, Y.; Shen, Z.; Chen, J. Micronization of atorvastatin calcium by antisolvent precipitation process. Int. J. Pharm. 2009, 374, 106–113. [Google Scholar] [CrossRef] [PubMed]
  37. Wang, Z.; Chen, J.; Le, Y.; Shen, Z.; Yun, J. Preparation of ultrafine beclomethasone dipropionate drug powder by antisolvent precipitation. Ind. Eng. Chem. Res. 2007, 46, 4839–4845. [Google Scholar] [CrossRef]
  38. Chen, J.; Zheng, C.; Chen, G. Interaction of macro- and micromixing on particle size distribution in reactive precipitation. Chem. Eng. Sci. 1996, 51, 1957–1966. [Google Scholar] [CrossRef]
  39. Chen, J.; Zhou, M.; Shao, L.; Wang, Y.; Yun, J.; Chew, N.; Chan, H. Feasibility of preparing nanodrugs by high-gravity reactive precipitation. Int. J. Pharm. 2004, 269, 267–274. [Google Scholar] [CrossRef] [PubMed]
  40. Matteucci, M.E.; Hotze, M.A.; Johnston, K.P.; Williams, R.O. Drug nanoparticles by antisolvent precipitation: Mixing energy versus surfactant stabilization. Langmuir 2006, 22, 8951–8959. [Google Scholar] [CrossRef] [PubMed]
  41. Kakran, M.; Sahoo, N.; Li, L.; Judeh, Z.; Wang, Y.; Chong, K.; Loh, L. Fabrication of drug nanoparticles by evaporative precipitation of nanosuspension. Int. J. Pharm. 2010, 383, 285–292. [Google Scholar] [CrossRef] [PubMed]
  42. Zhang, J.; Shen, Z.; Zhong, J.; Hu, T.; Chen, J.; Ma, Z.; Yun, J. Preparation of amorphous cefuroxime axetil nanoparticles by controlled nanoprecipitation method without surfactants. Int. J. Pharm. 2006, 323, 153–160. [Google Scholar] [CrossRef] [PubMed]
  43. Du, X.; Zu, S.; Chen, F.; Liu, Z.; Li, X.; Yang, L.; Zu, Y.; Zhao, X.; Zhang, L. Preparation and characterization of cefquinome sulfate microparticles for transdermal delivery by negative-pressure cavitation antisolvent precipitation. Powder Technol. 2016, 294, 429–436. [Google Scholar] [CrossRef]
  44. Nelson, K.G. The Kelvin equation and solubility of small particles. J. Pharm. Sci. 1972, 61, 479–480. [Google Scholar] [CrossRef] [PubMed]
Figure 1. Molecular structure of spiramycins.
Applsci 07 00010 g001
Figure 2. Schematic drawing of homogenate-antisolvent precipitation apparatus to prepare the micronized spiramycin.
Applsci 07 00010 g002
Figure 3. The effects of each parameter on the MPS of micronized spiramycin (a) precipitation time; (b) precipitation temperature; (c) shear rate; (d) volume ratio of the antisolvent to solvent; (e) dripping speed of the solvent adding into the antisolvent; and (f) spiramycin concentration. Each value represents means ± SD (n = 6).
Applsci 07 00010 g003
Figure 4. The response surface for the effect of independent variables on MPS of micronized spiramycins: (a) the spiramycin concentration and volume ratio of antisolvent to solvent; (b) the spiramycin concentration and dripping speed of the solvent adding into the antisolvent; and (c) the volume ratio of the antisolvent to solvent and dripping speed of the solvent adding into the antisolvent.
Applsci 07 00010 g004
Figure 5. FTIR spectra of unprocessed and processed spiramycin (spiramycin microparticles are the micronized spiramycin by homogenate-antisolvent precipitation under optimum conditions).
Applsci 07 00010 g005
Figure 6. XRD patterns of unprocessed and processed spiramycin (spiramycin microparticles are the micronized spiramycin by homogenate-antisolvent precipitation under optimum conditions).
Applsci 07 00010 g006
Figure 7. Scanning electron micrographs of (a) unprocessed and (b) processed spiramycin (spiramycin microparticles are the micronized spiramycin by homogenate-antisolvent precipitation under optimum conditions), and particle size distribution of processed spiramycin under optimized experiment conditions (c).
Applsci 07 00010 g007
Figure 8. Gas chromatograms of spiramycin microparticles, indicating the presence of residual DMSO (spiramycin microparticles are the micronized spiramycin by the homogenate-antisolvent precipitation under optimum conditions).
Applsci 07 00010 g008
Figure 9. Dissolution profiles of unprocessed and processed spiramycin (spiramycin microparticles are the micronized spiramycin by homogenate-antisolvent precipitation under optimum conditions).
Applsci 07 00010 g009
Table 1. Experimental design matrix to screen for variables that determine the MPS of spiramycin microparticles and ANOVA results a.
NoBBD ExperimentsANOVA
X1 bX2X3Y1Y2SourceSum of SquaresDegree of FreedomMean SquareFp
110 (−1)3 (−1)50 (0)294297Model36,570936,570113<0.0001 c
230 (+1)3 (−1)50 (0)349346X19031903250.0016 c
310 (−1)7 (+1)50 (0)280283X234451344596<0.0001 c
430 (+1)7 (+1)50 (0)280277X313,695113,695380<0.0001 c
510 (−1)5 (0)40 (−1)279274X1X27561756210.0025 c
630 (+1)5 (0)40 (−1)305306X1X3121112130.1097
710 (−1)5 (0)60 (+1)368367X2X39301930260.0014 c
830 (+1)5 (0)60 (+1)372378X12598415984166<0.0001 c
920 (0)3 (−1)40 (−1)300302X228791879240.0017 c
1020 (0)7 (+1)40 (−1)228230X32841318413233<0.0001 c
1120 (0)3 (−1)60 (+1)357355Residual252736
1220 (0)7 (+1)60 (+1)346344Lack of fit12334110.3970
1320 (0)5 (0)50 (0)240249Pure error129432
1420 (0)5 (0)50 (0)247249Corrected total36,82216
1520 (0)5 (0)50 (0)255249Credibility analysis of the regression equations
1620 (0)5 (0)50 (0)249249Standard deviationMeanCV (%)R2Adjust R2Predicted R2Adequacy precision
1720 (0)5 (0)50 (0)2522496.01294.182.040.99310.98430.941031.94
a The results were obtained with Design Expert 8.0 software; b X1 is the spiramycin concentration (mg/mL), X2 is the volume ratio of antisolvent to solvent (mL/mL), X3 is the dripping speed of the solvent adding into the antisolvent (mL/h), Y1 is the actual MPS of the spiramycin microparticles (nm), Y2 is the predicted MPS of the spiramycin microparticles (nm); c Significant at p < 0.05.

