1. Introduction
Unmanned aerial vehicles (UAVs), commonly known as drones, are gaining a considerable amount of attention in the field of structural health monitoring (SHM). The visual inspection method with image processing is a common concept when using drones to find cracks, rusts, or other damage types that can be visually identified. Due to the nature of the aforementioned method, damages is usually identified when it has been noticeably progressed. For this reason, a new concept is required to allow drones to identify damage at an earlier stage, or detect internal damage such as thickness loss due to corrosion. To date, various authors have investigated structural health monitoring using the electromechanical impedance (EMI) method, including monitoring of drones. However, there are only a few studies available where drones are utilized to monitor structures which are focused on image processing [
1,
2,
3]. Ellenberg et al. performed an investigation on remote sensing capabilities of a commercialized UAV (Parrot AR 2.0) for crack detection from various distances [
1]. An algorithm was developed in MATLAB for image post-processing where a field test was conducted on a pedestrian bridge in order to evaluate the performance of the UAV. Sankarasrinivasan et al. introduced an approach involving a combination of hat transform and HSV thresholding technique for detecting cracks using UAV for a real time SHM [
2]. Field testing was conducted in the outdoor environment at Vel Tech University in India to evaluate the performance for the proposed study, during which factors such as wind and random image noises resulted in a few erroneous results. Eschmann et al. used an octocopter (a UAV with eight blades weighing 2.5 kg) for a building inspection where photos were taken at high speed and frequency [
3]. During the study, more than 12,000 photos were taken over the four day period for crack inspection of the target structure.
In this work, a new concept of converging a drone with a vibration-based non-destructive evaluation (NDE) method is proposed. Such a concept will allow one to potentially identify damage at an earlier stage, reducing the overall maintenance cost of a structure. With the advancement in measurement technologies, the equipment used for conducting NDE methods are becoming smaller, lighter, and cheaper. Thus, with the new concept of equipping a drone with a vibration-based NDE method, possibilities are created for new research areas in the field of remote sensing-based structural health monitoring.
2. Equipping a Vibration-Based NDE Method onto a Drone
The vibration-based NDE method introduced in this study uses a single piezoelectric (PZT) material to act as both actuator and sensor. The method is known as the EMI technique, first proposed by Liang et al. [
4]. Currently, this technique requires one to permanently attach a PZT transducer onto the surface of the target structure, usually in 10 mm square sizes for performing the NDE method [
5,
6,
7,
8,
9,
10,
11,
12,
13,
14,
15,
16,
17]. Electrical impedance of the attached PZT transducer is usually measured using equipment such as 4294A (Agilent Technologies, Santa Clara, CA, USA) costing up to 50,000 USD, or the AD5933 evaluation board (Analog Devices, Norwood, MA, USA) costing less than 100 USD, which is light enough for a drone to carry. The attached PZT excites the structure (thickness and radial vibration modes) within a selected frequency range (usually between 20 and 400 kHz), creating a standing wave at each frequency, whilst also acquiring data. By observing the 1-D equation introduced by Liang et al. [
4], the measured electrical admittance (inverse of impedance) of the PZT,
Y(ω) is directly related to the mechanical impedance of the host structure,
. Thus, any changes in the structure can be detected by measuring the electrical impedance. The rest of the variables, including
,
,
,
,
and
represent the excitation frequency geometric constant, dielectric constant, dielectric loss tangent, coupling constant, and the PZT Young’s modulus.
Data analysis of the EMI method is achieved by comparing two impedance signatures, before and after damage measurements have been recorded. A statistical technique known as the root mean square deviation (RMSD) is used to quantify the variations for the two impedance signatures into a single number. The RMSD equation is shown in Equation (2), where
is the real part of the reference impedance signature, and
is the real part of the corresponding impedance signature for each measurement time at the
kth measurement step. In general, the real part of an impedance signature is used as it has been experimentally proven by the authors of this study that it performs better than the imaginary part for damage identification [
18]. Here, large variations in the two impedance signatures will result in a higher RMSD value.
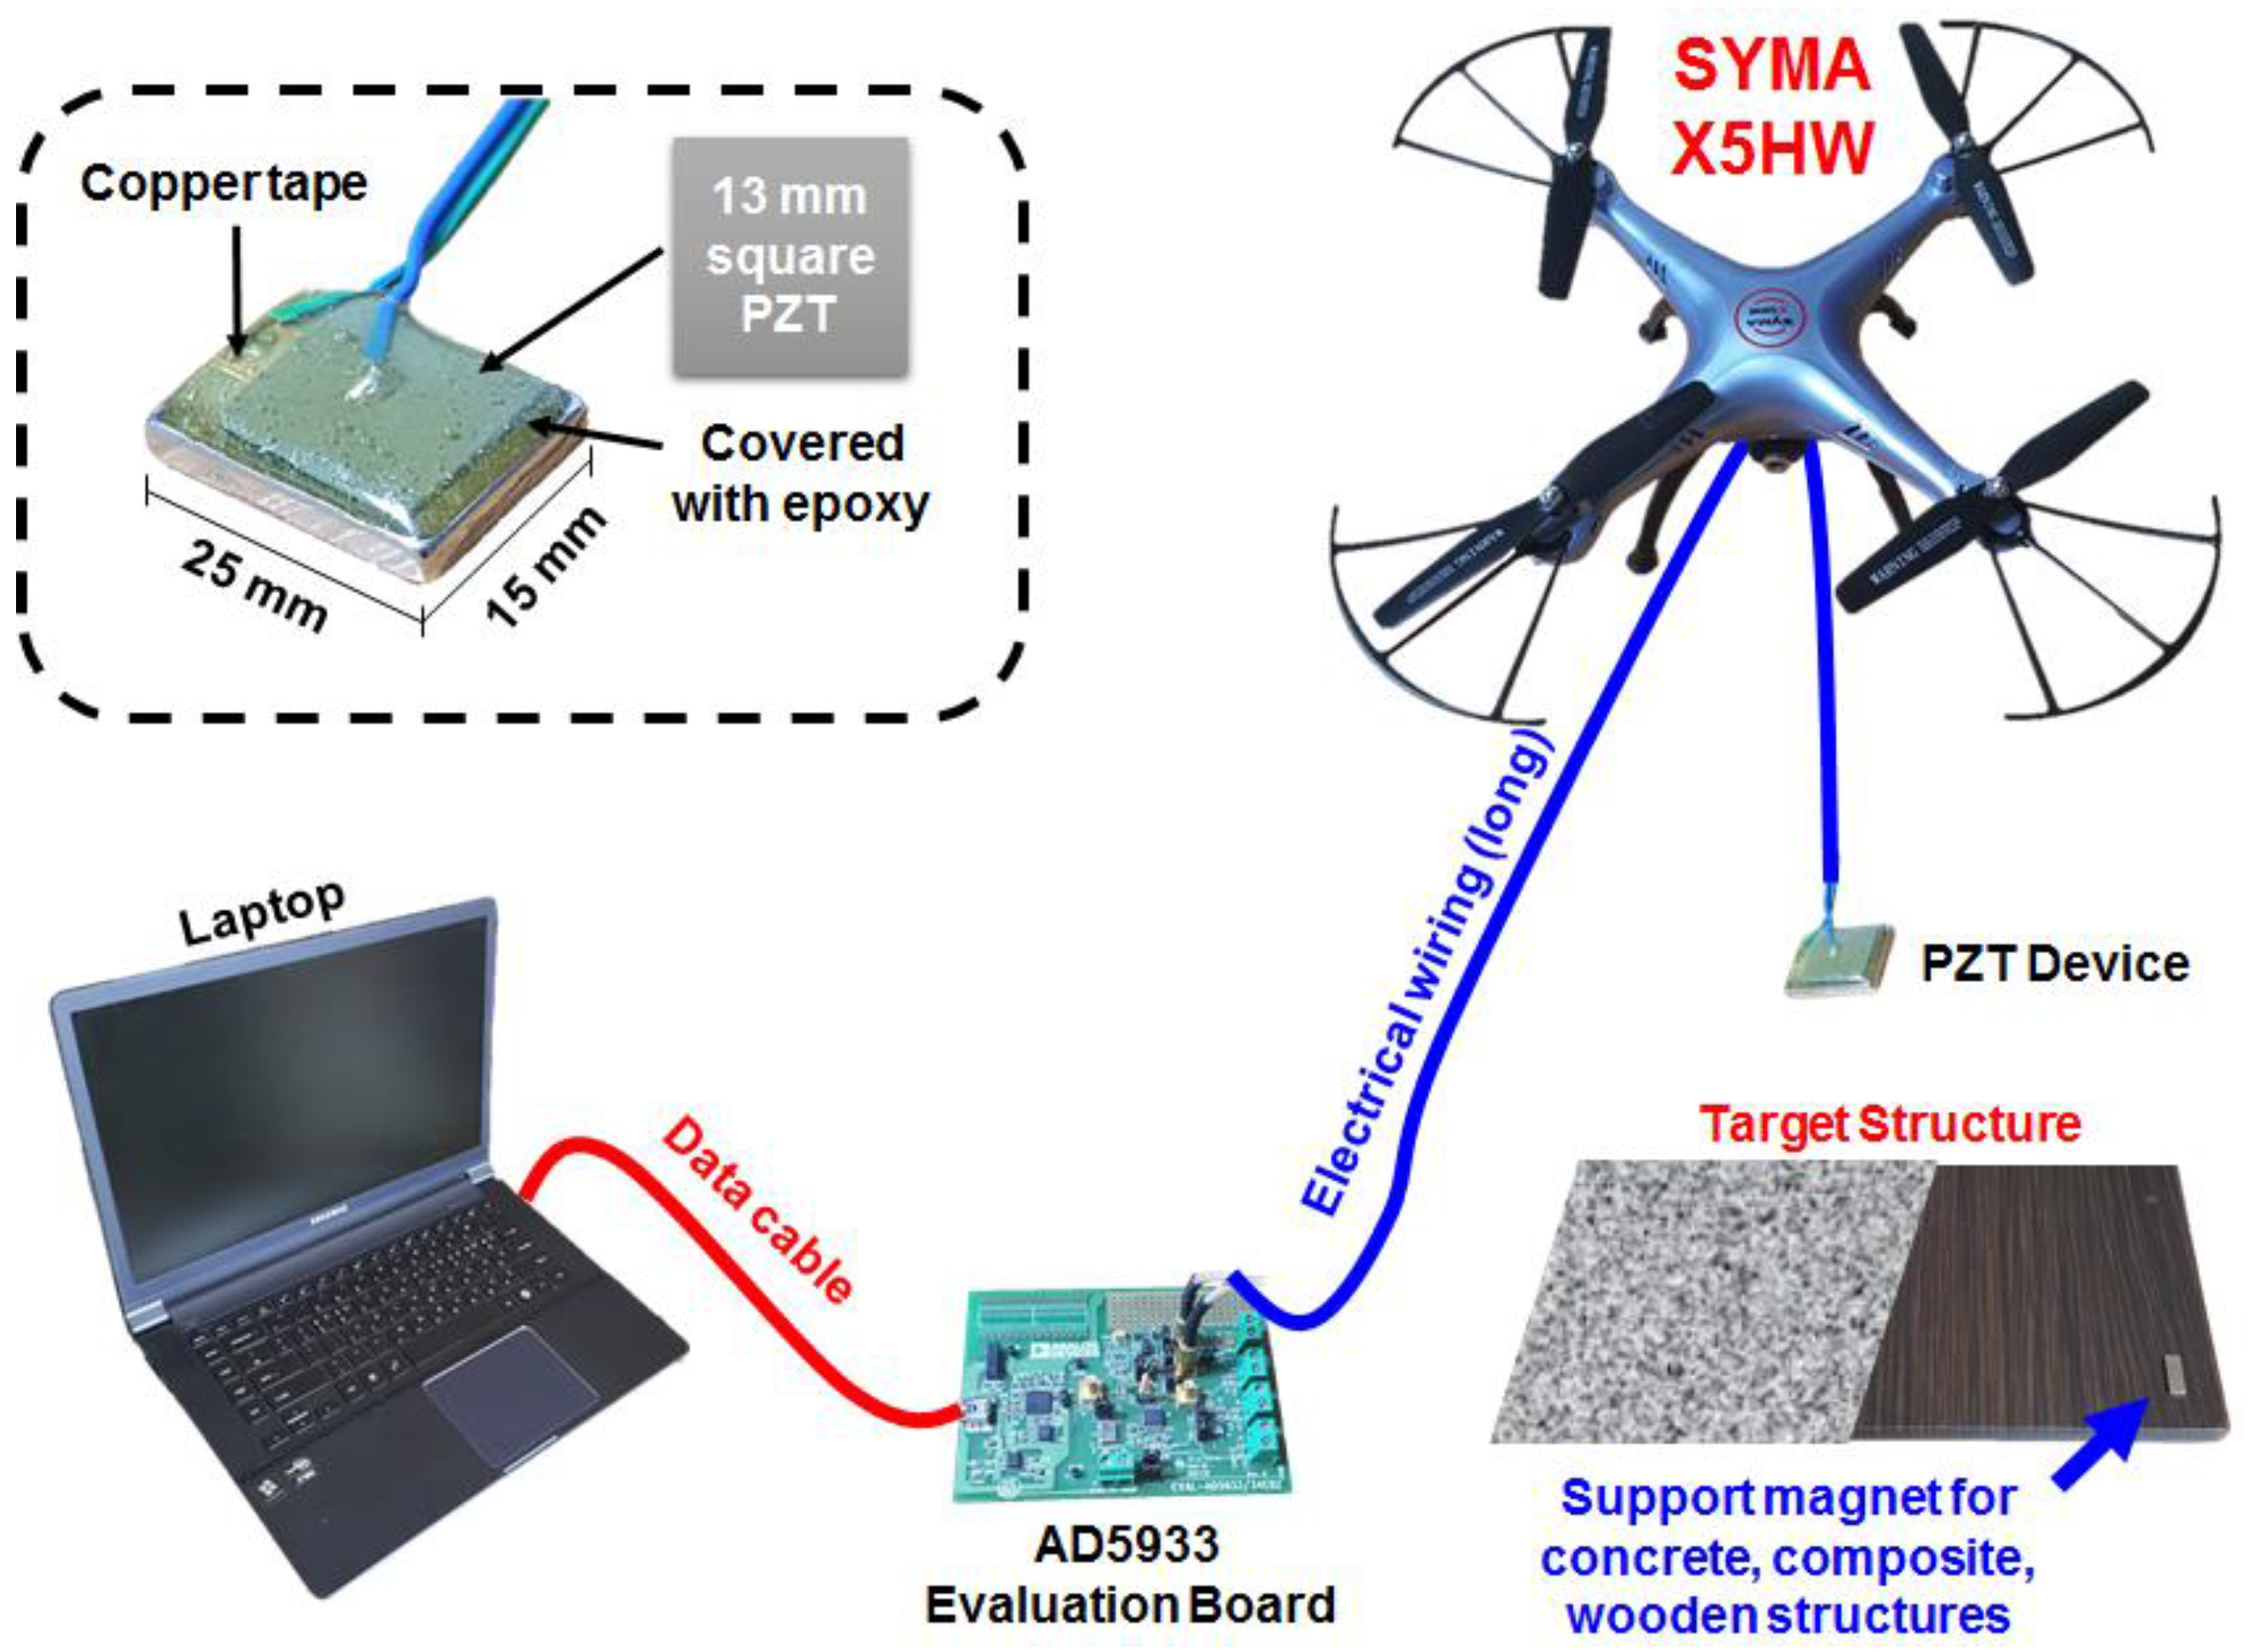
One of the advantages of the EMI method is the use of the high frequency range, allowing one to detect small defects. However, the sensing area at this frequency range is relatively small and a large number of PZT transducers are required for monitoring large infrastructures. The concept introduced here, for using a drone to monitor structures, requires the modification of the PZT transducer so that it is re-attachable. This means that it should be able to be temporarily attached to a structure, with a connection strong enough for a successful damage detection. To achieve this, the conventional method of permanently attaching the PZT is modified so that it allows temporary attachment to a host structure using magnetic force. This concept is shown in the red box in
Figure 1, where the PZT (5A4E, 0.5 mm thickness type purchased from piezo.com) is attached on top of a magnet (size 25 mm × 15 mm × 3 mm). This allows the PZT device to be easily attached and detached from a structure, as long as the target structure is ferromagnetic. However, if the host structure is non-metallic (e.g., concrete, composite, wooden structure etc.), a support magnet must be attached to the host structure, as shown in
Figure 1. The experiment setup is also shown in the figure, where a laptop is connected to the AD5933 evaluation board with the positive and negative wires connected to the PZT device. The drone used for the study is the commercial product model SYMA X5HW, costing 60 USD. The package provides an application for a smart phone for real time visualization through a Wi-Fi connection. The wires of the PZT device are attached to the drone, where it is controlled by the user.
Although the PZT device is connected to the laptop through the AD5933 evaluation board, it is possible for one to convert the board into a wireless system, eliminating the USB data cable shown in the figure. Such a system has been investigated by several authors for attempting to create a wireless impedance measuring device using the AD5933 chip. Some of the first wireless impedance measuring devices using this chip were created by Mascarenas et al. (2007) and Overly et al. (2008). Mascarenas et al. presented a wireless system using the AD5933 impedance measuring chip with an Xbee 2.4 GHz radio (MaxStream, Lindon, Utah, USA) and an ATmega128L microcontroller (Atmel, San Jose, CA, USA). The performance of the proposed system was demonstrated by comparing the results with those from the data acquisition system (National Instruments, Austin, TX, USA), measuring the impedance up to 90 kHz [
19]. Overly et al. created an extremely compact wireless impedance measuring system with dimensions of 52 mm × 3.7 mm, using an ATmega128L microcontroller. The performance of the system was compared to an Agilent 4294A impedance analyzer protecting against corrosion, loosening and tightening bolts. Due to its small size, the system has a very low power consumption, which would be suitable for the drone monitoring concept shown in this study [
20].
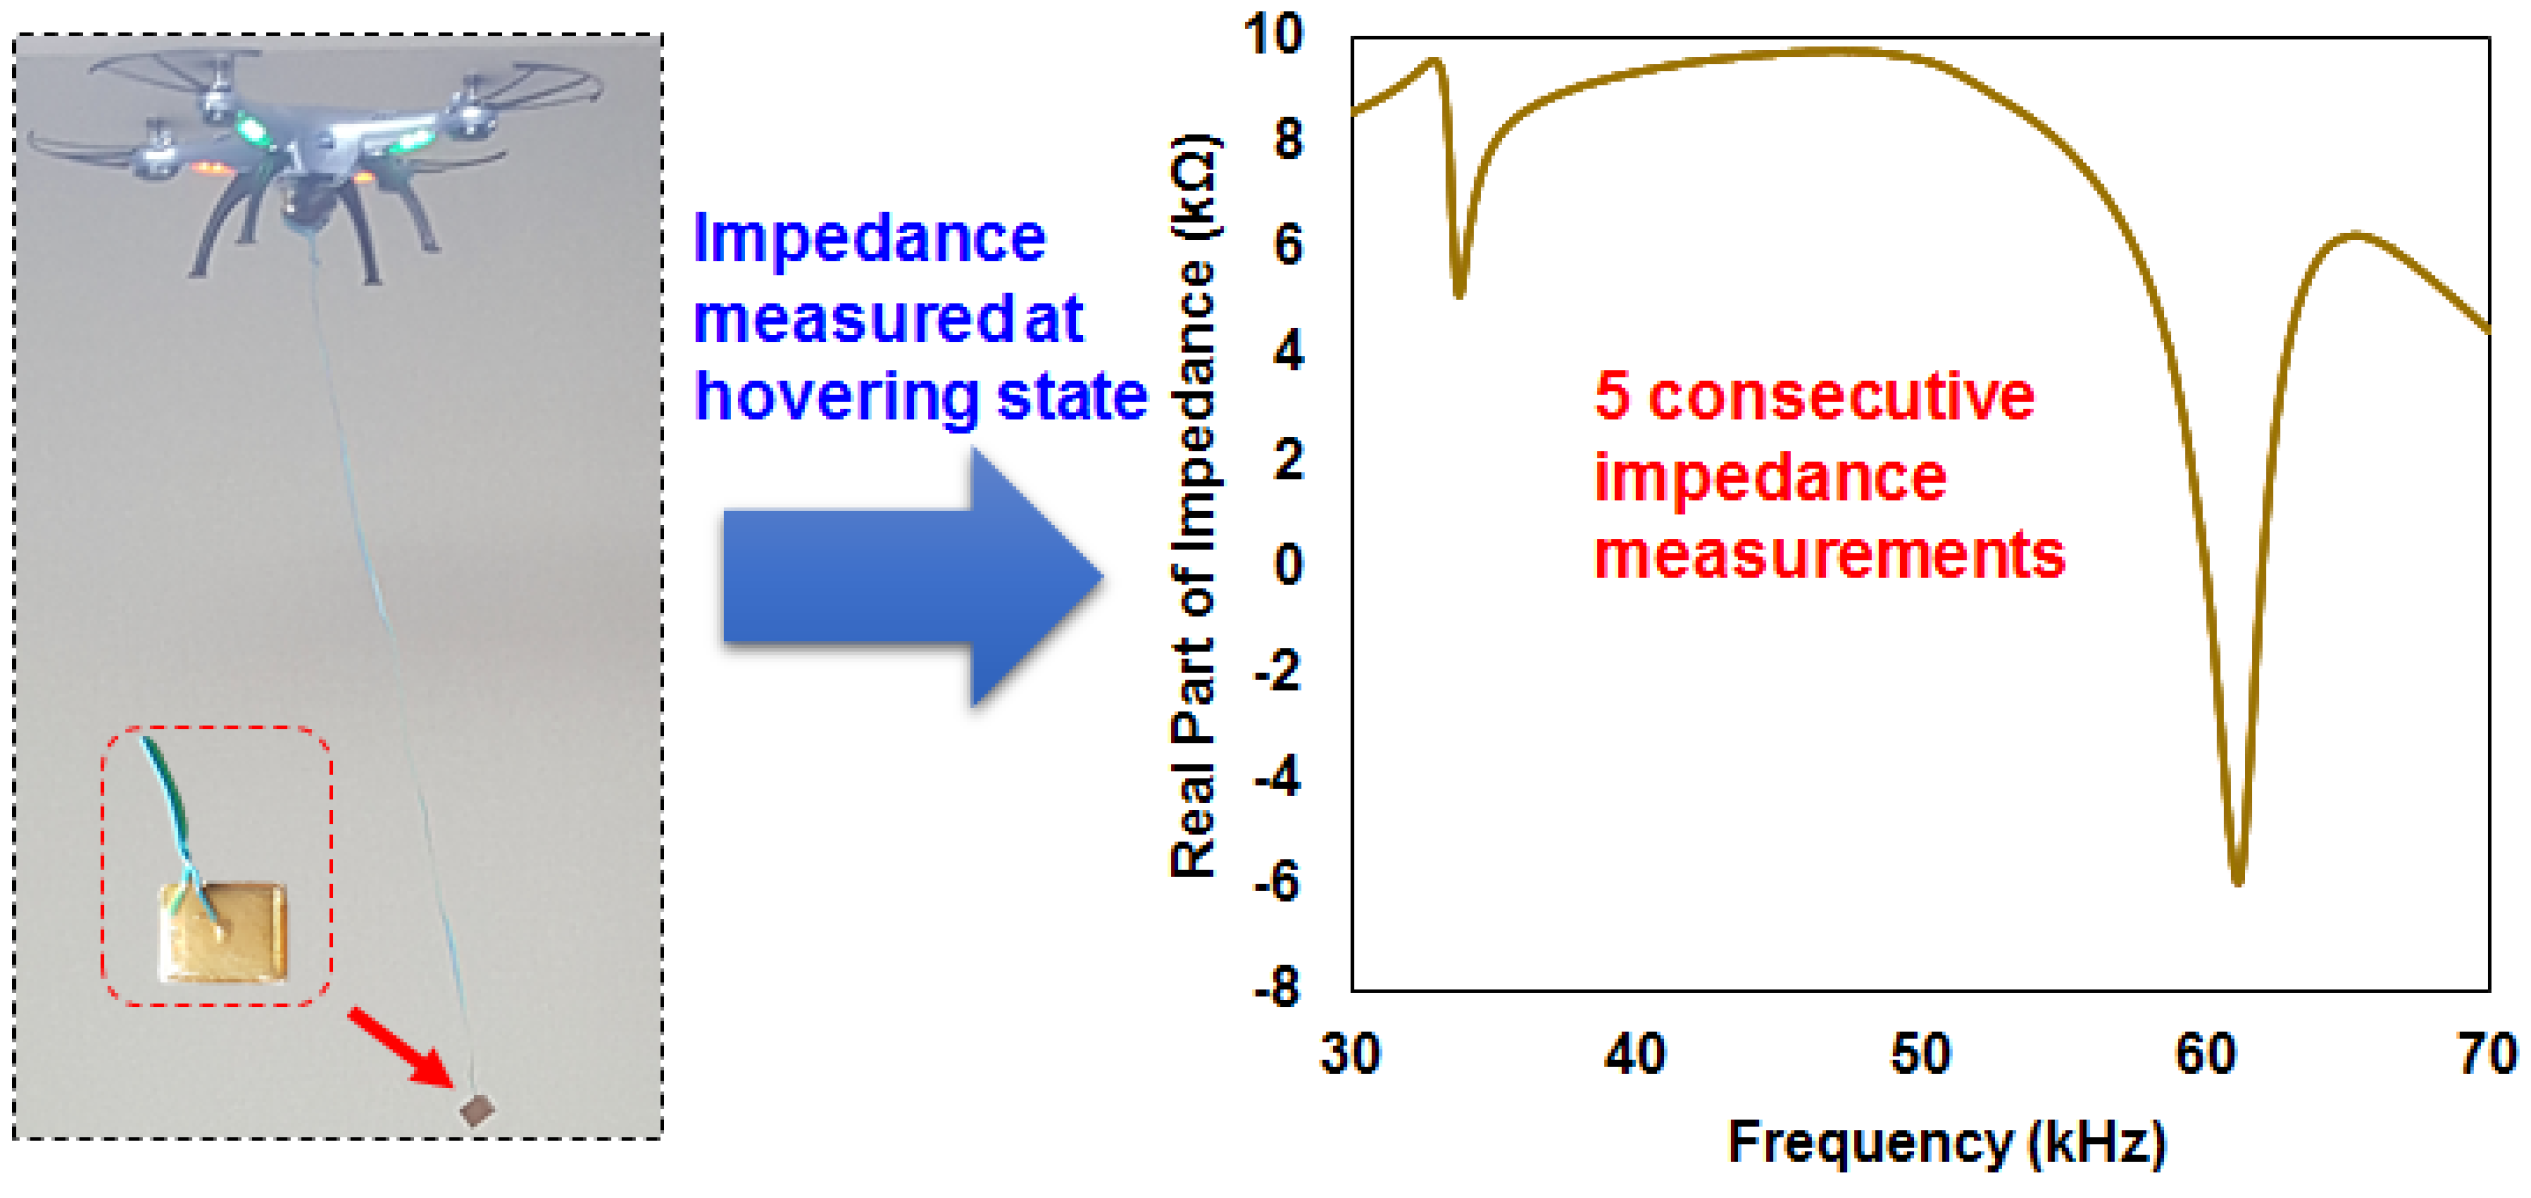
First, since the EMI method is a vibration-based technique, it is vital to investigate whether vibrations caused from the drone (wind or motor spinning) have any effect on the impedance signatures. In order to check this, five impedance signatures were measured at hovering state in order to evaluate the repeatability performance of the drone equipped with the EMI method.
Figure 2 shows the results of measuring the impedance signatures in the frequency range from 30 to 70 kHz, during which virtually no change in the signatures can be seen. This is an expected result as the EMI method uses a high frequency range over 20 kHz and vibrations from the drone (e.g., motor blade, wind) are assumed to be much lower than this value. Here, the largest difference between any two impedance signatures did not exceed the value of 0.66%. Thus, this value can be defined as the threshold value for the study and any values below 0.66% should be ignored when identifying damage.
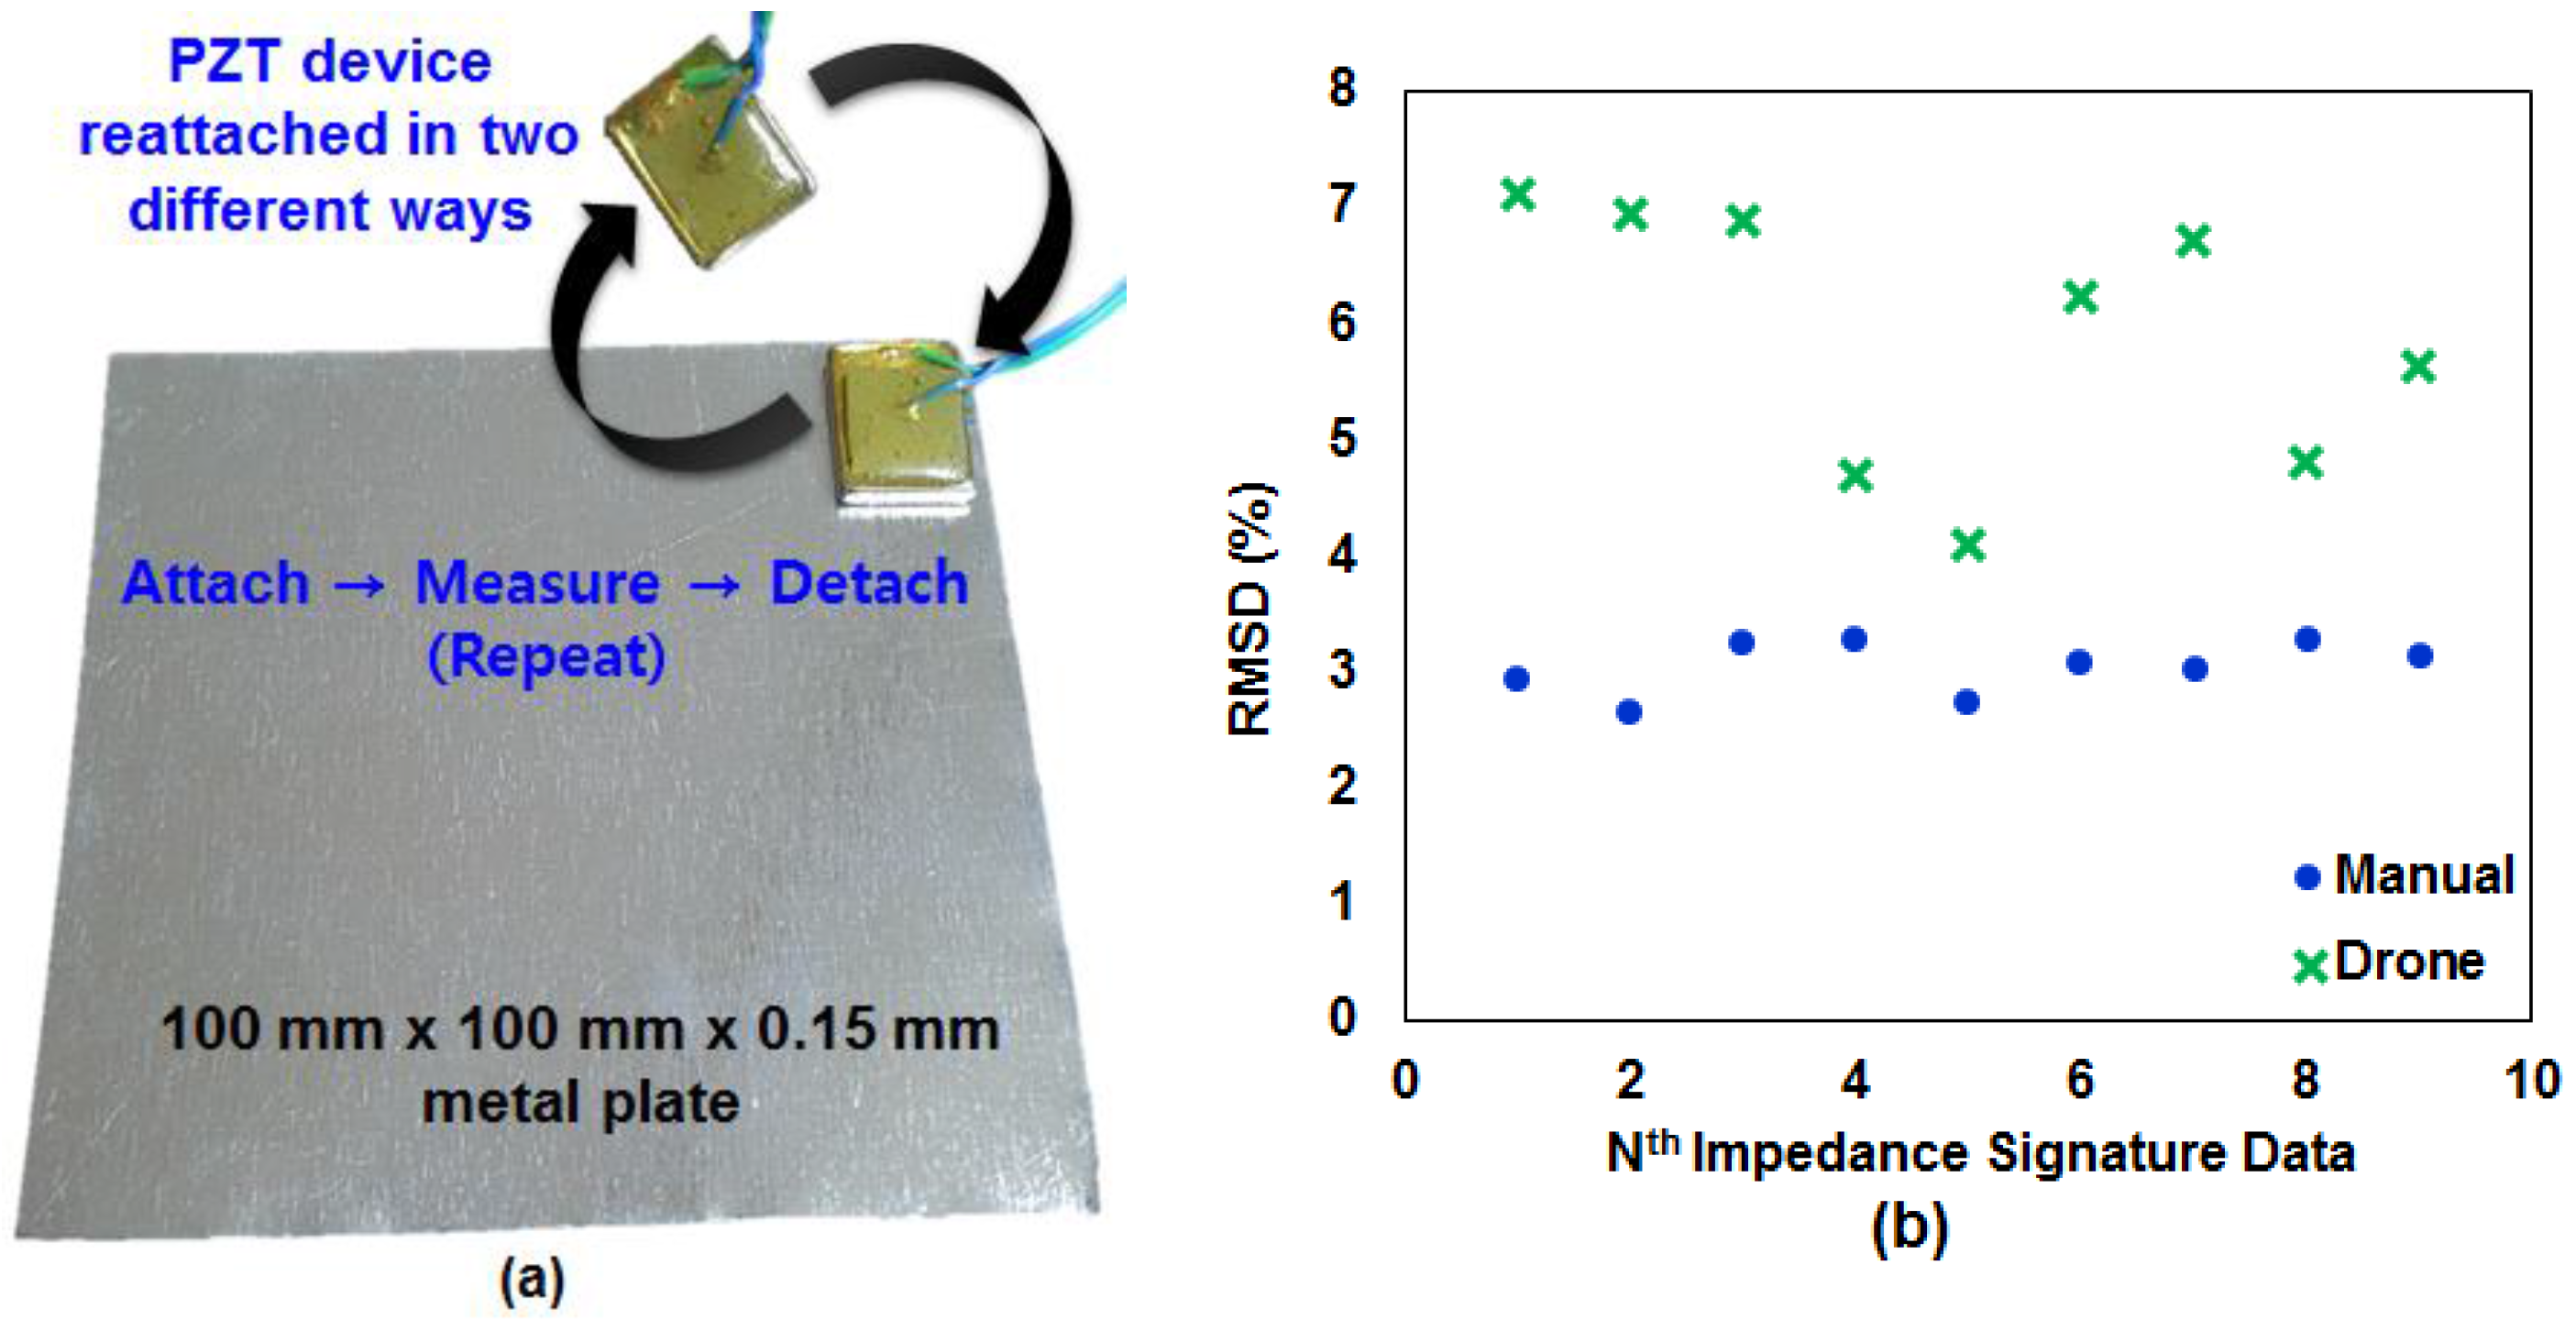
Having established that the impedance measurements are barely affected by the vibrations created from the drone, the next step was to evaluate the repeatability of attaching and reattaching the PZT device onto a structure. Since the impedance signatures are highly sensitive, reattaching the PZT device can have a significant impact on the impedance signature. In order to investigate this matter, the PZT device is detached and reattached to a metal plate with dimensions of 100 mm × 100 mm × 0.15 mm, with impedance signatures being measured each time in the 55 kHz to 70 kHz range. For the purpose of the test, the reattachment was conducted in two ways. First, the reattachment was achieved by manually controlling the drone when placing the PZT device at the corner of the metal plate, where the magnetic force of the device allowed it to be temporarily attach to the surface. This process is shown in
Figure 3a where the impedance signatures were measured 10 times for every reattachment of the PZT device. The second method of detaching and reattaching the PZT device was done manually, by using the hands to try and achieve exactly the same location placement of the device each time, at the corner of the plate. Again, 10 impedance signatures were acquired for a comparison with the results of the previous 10 signatures.
Figure 3b shows the RMSD values calculated from these two sets of data, where the first measurements were used as the reference signatures and the remaining signatures were then compared to these values. The difference in the RMSD values for the two sets of data is clearly visible, with the drone reattachment method being noticeably higher (between 4% and 7%) than when the PZT device is reattached by the hands (2.5%~3.5%). This proves that replacement of the PZT device onto the same location is a vital factor. However, the RMSD values in the range of 2.5% to 3.5% can still be considered as high, and additional research is required to minimize the impedance signature variations caused by replacement of the PZT device.
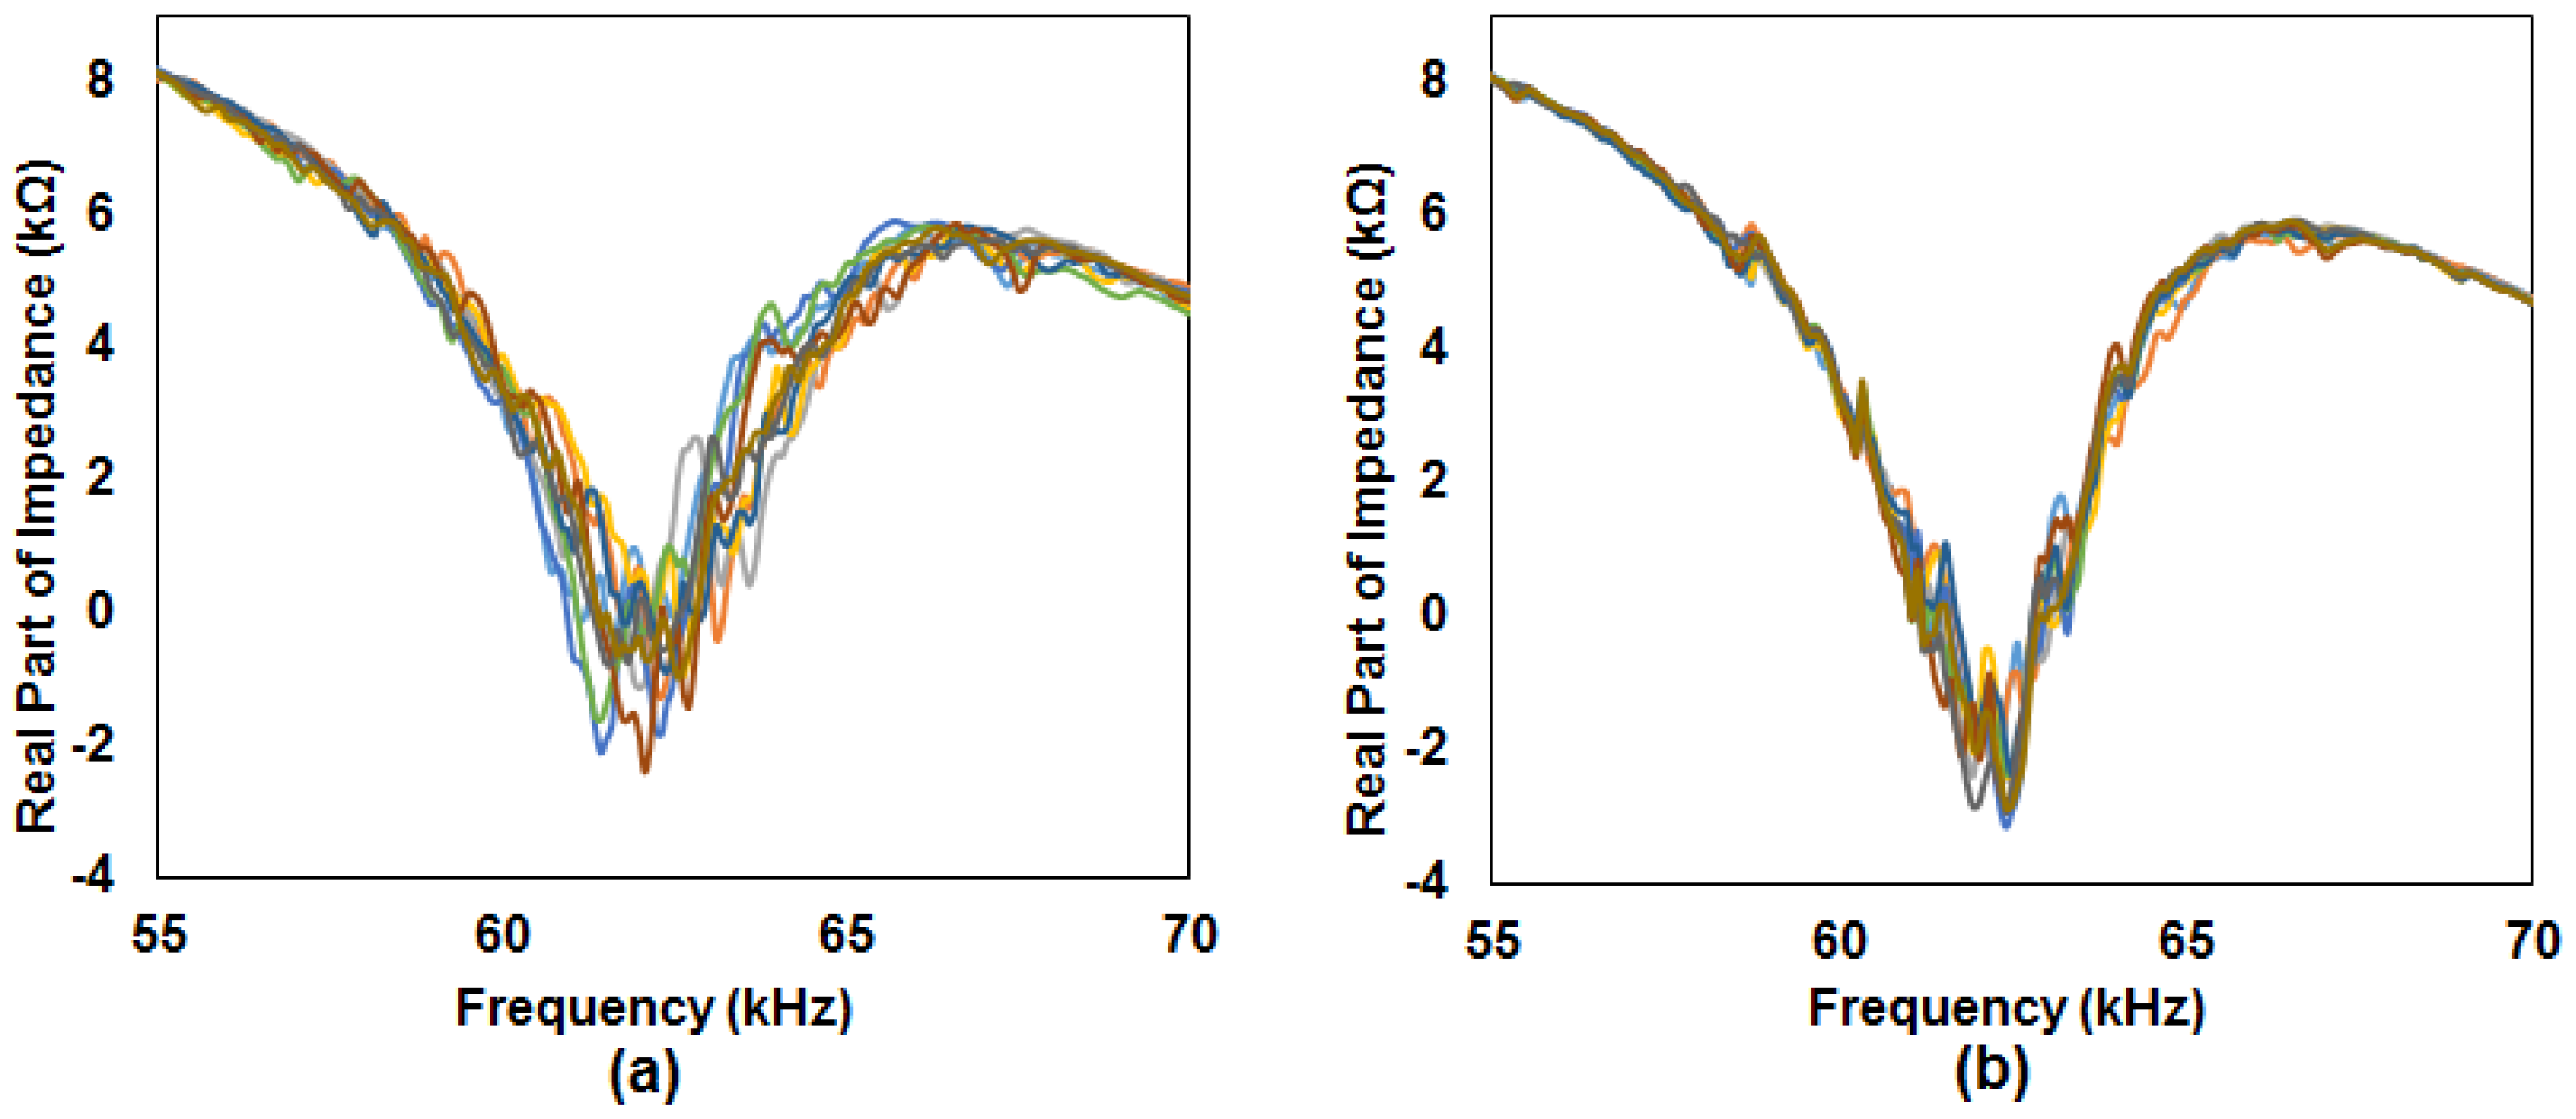
Figure 4 shows the impedance signatures used to obtain the RMSD values just discussed, in the frequency ranges from 55 to 70 kHz. As expected, the reattachment of the PZT device using the drone (
Figure 4a) has higher signature variations than those in
Figure 4b. Regardless, the general shape of the impedance signatures is maintained with downward peaks being located at 63 kHz.
3. Damage Detection Problems and Possibilities
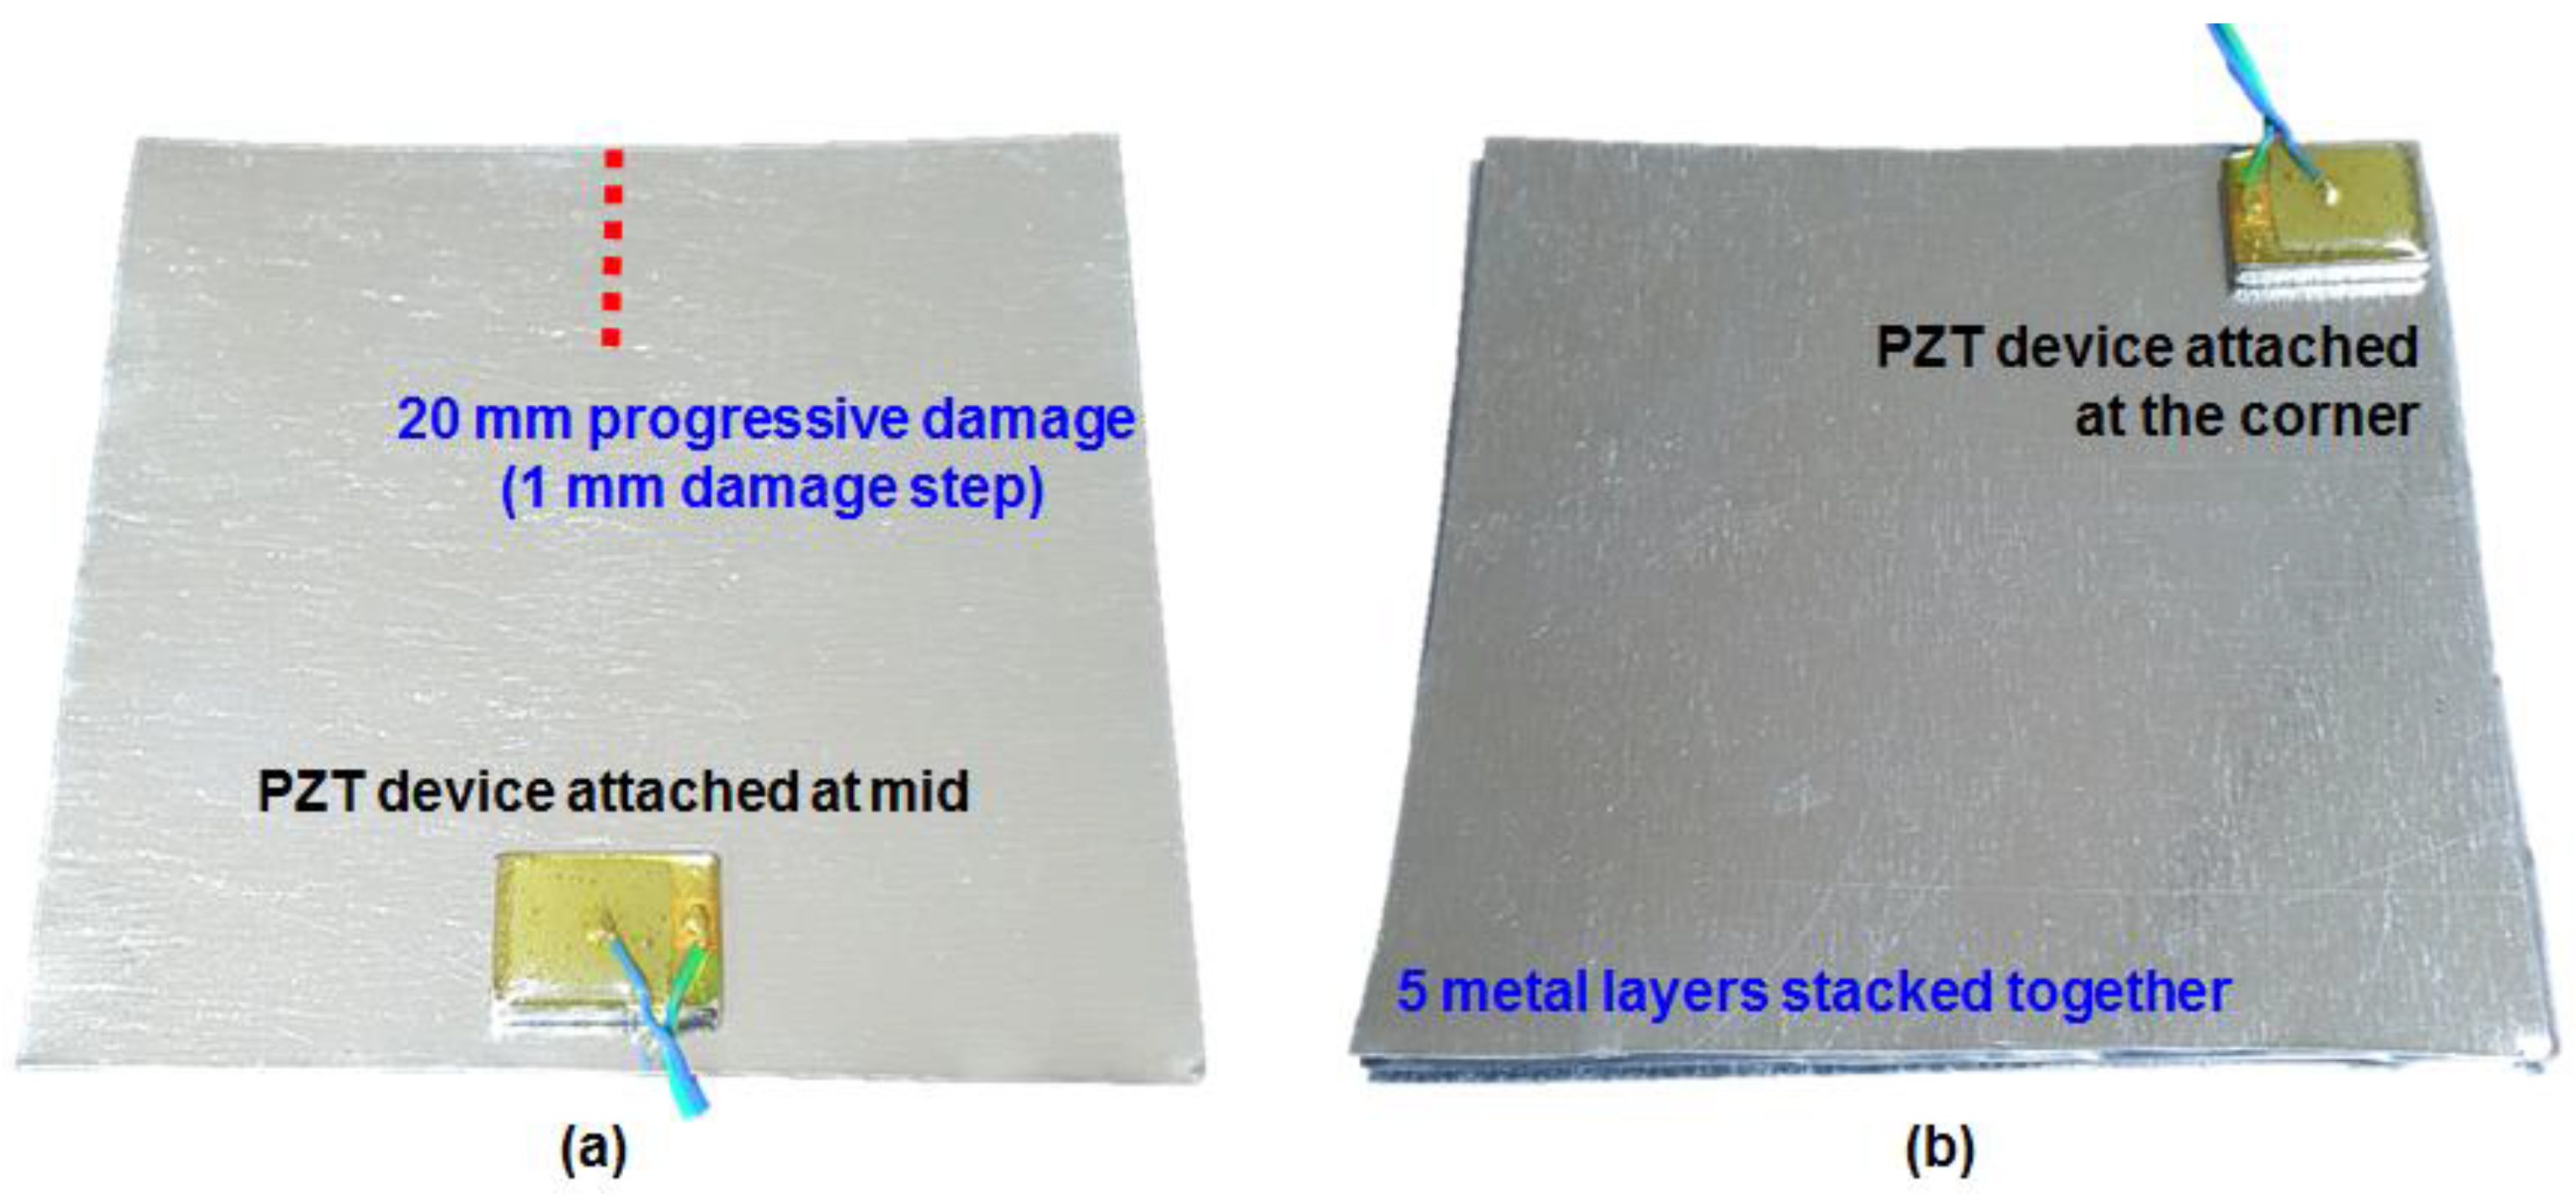
In the previous section, the reattachment of the PZT device caused the impedance signatures to vary, which can result in difficulty when identifying damage. The highest RMSD values produced for the two different reattachment methods were approximately 7% when using the drone and 3.5% for manual placement. Thus, it would be ideal for a structure experiencing damage to have higher values as these two values can be defined as the threshold values, in order to differentiate between an intact case and a damage case. Keeping this in mind, the purpose of this section is to conduct two experiments involving a progressive damage case and a thickness loss damage case. The setup of the test specimens is shown in
Figure 5.
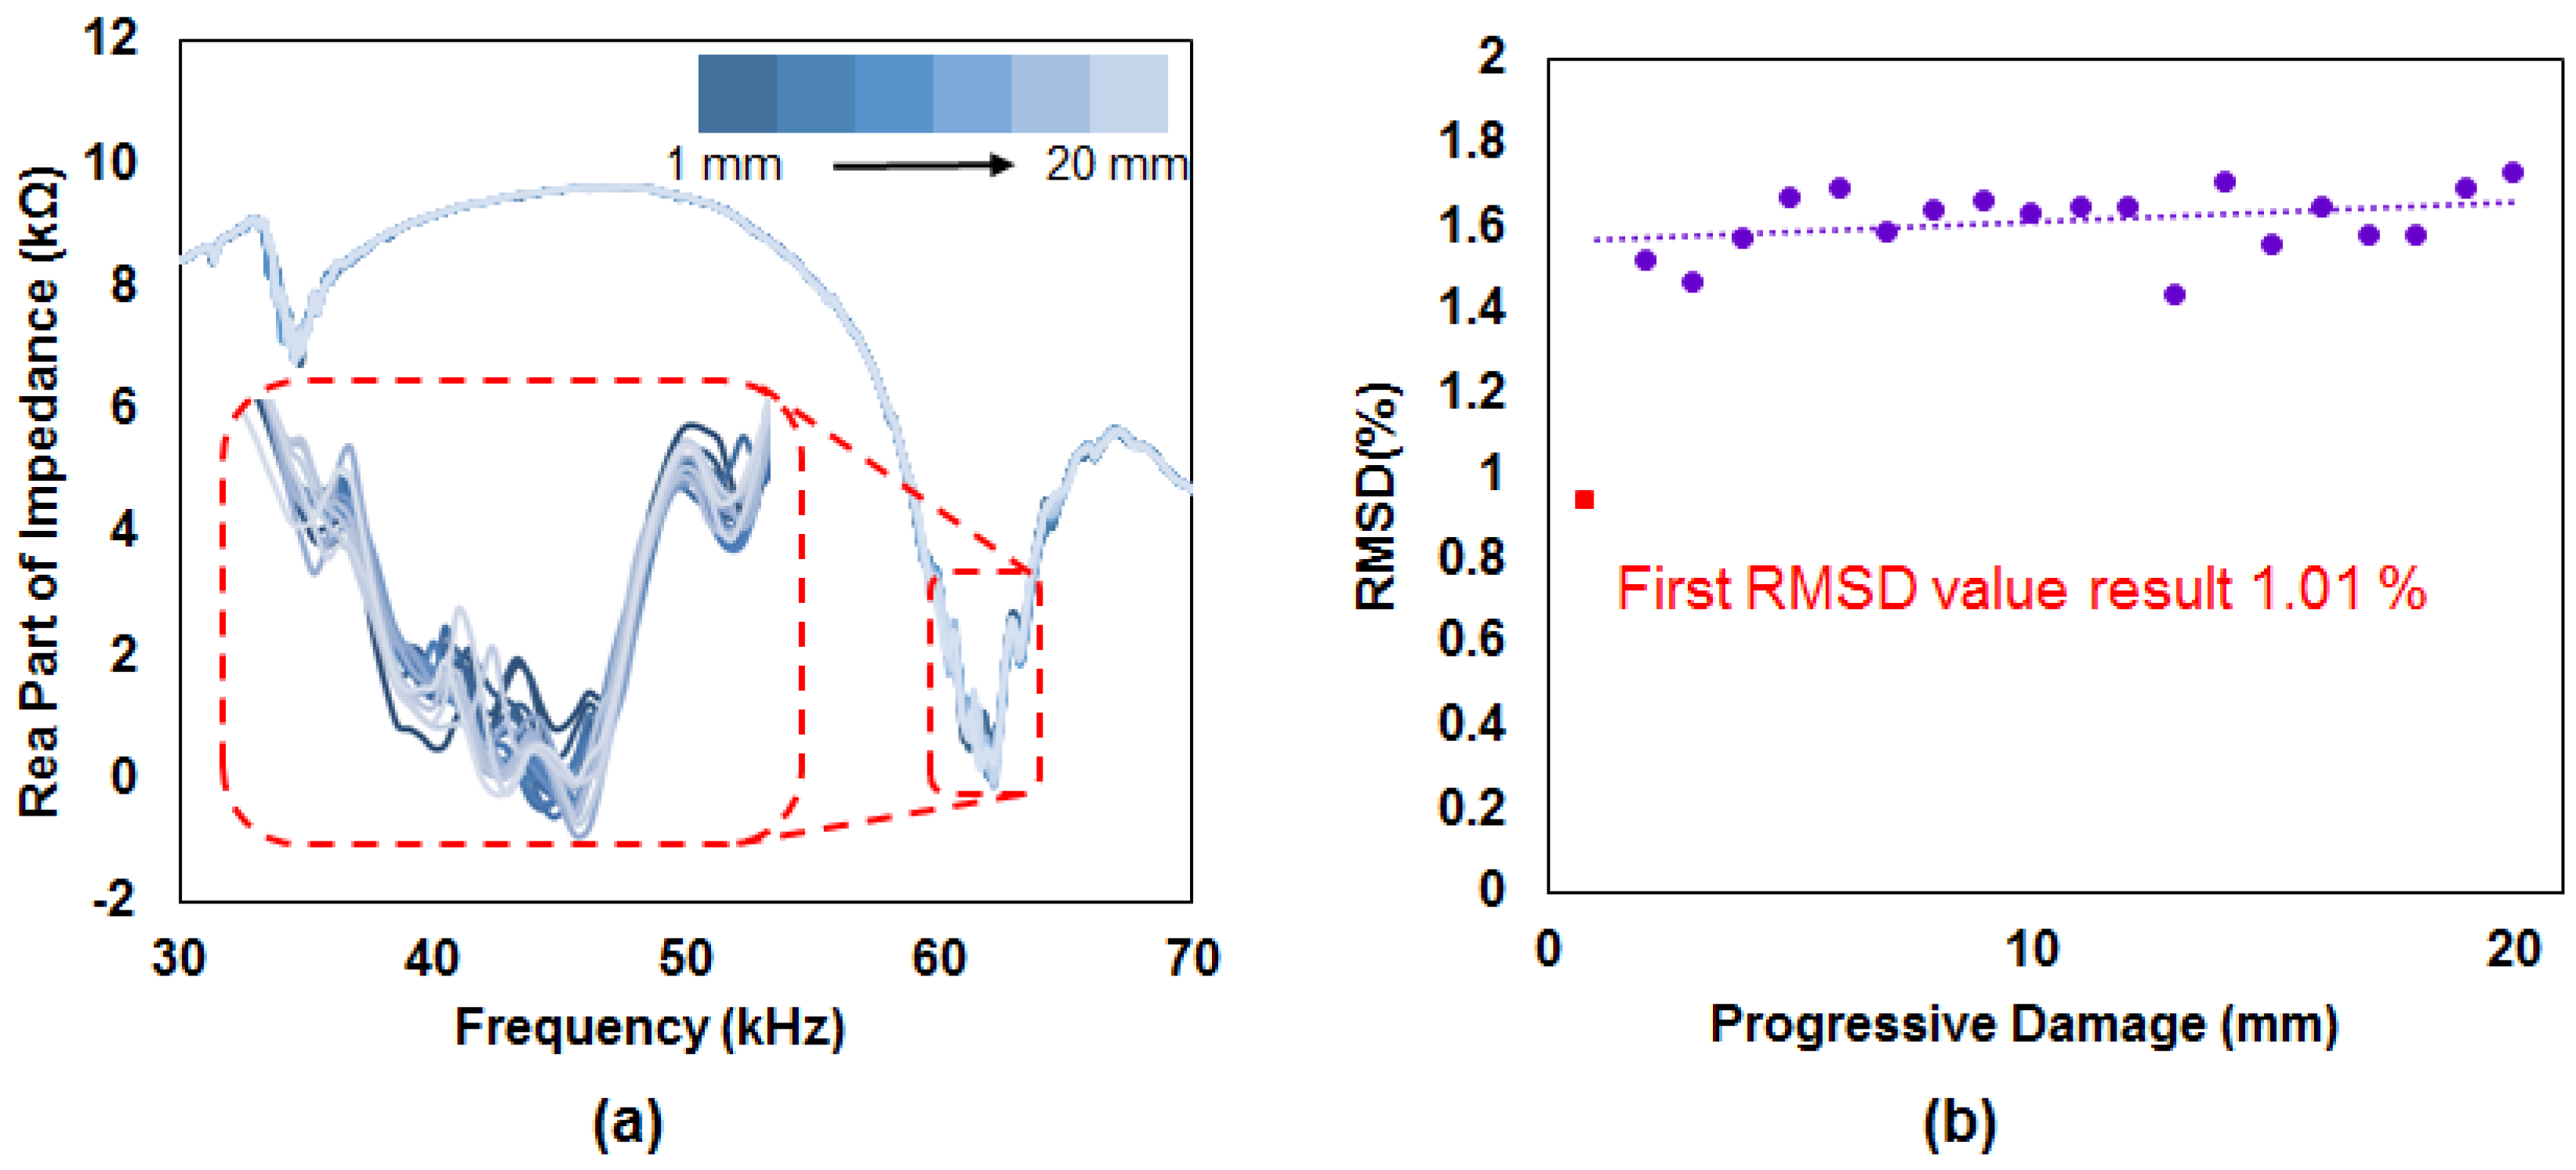
Figure 5a shows the PZT device attached to the metal plate, where damage is introduced by cutting 1 mm each time (up to 20 mm), with the impedance signatures being measured at every step. In
Figure 5b, five plates are stacked with the PZT device attached at one end of the stack. The stack is held together by the magnetic force (without any additional magnet) of the PZT device, where it is detached and reattached 10 times for acquiring impedance signatures. After measuring the impedance signature, a single layer of the metal plate is removed from the stack and the PZT device is detached and reattached another 10 times, with the impedance signatures being measured at each step. This process is repeated until the last plate of the stack is remaining, totaling 50 impedance signatures.
Figure 6a shows the impedance signatures for the experiment in
Figure 5a, where 21 impedance signatures (including the reference signature) can be observed. Although the signatures vary subject to progressive damage, the intensity of signature variations are less severe compared to
Figure 4. Thus, this causes difficulty when identifying damage as damaged structure results in smaller signature variations than variations caused from reattachment of the PZT device.
Figure 6b shows RMSD values by selecting the intact case as the reference signature, with all other signatures being compared to this reference. The first RMSD value which is calculated from the initial 1 mm cut damage results in 1.01% (red square dot), and the remaining RMSD values range between 1.4% and 1.8% (purple circle dots). One possible explanation for the relatively low RMSD result (1.01%) for the first RMSD value is that the damage was conducted near a node (a point that vibrates with minimum amplitude), causing small variations in the impedance signature. Using a line of best fit (excluding the first RMSD value), shows a rising trend with an increase in damage intensity. For this progressive damage case, the RMSD values are smaller than the values calculated from manually reattaching the PZT device (2.5%~3.5%). Thus, a different approach other than using the RMSD equation, needs to be researched in order to differentiate between an intact case and a progressive damage case using the presented PZT device.
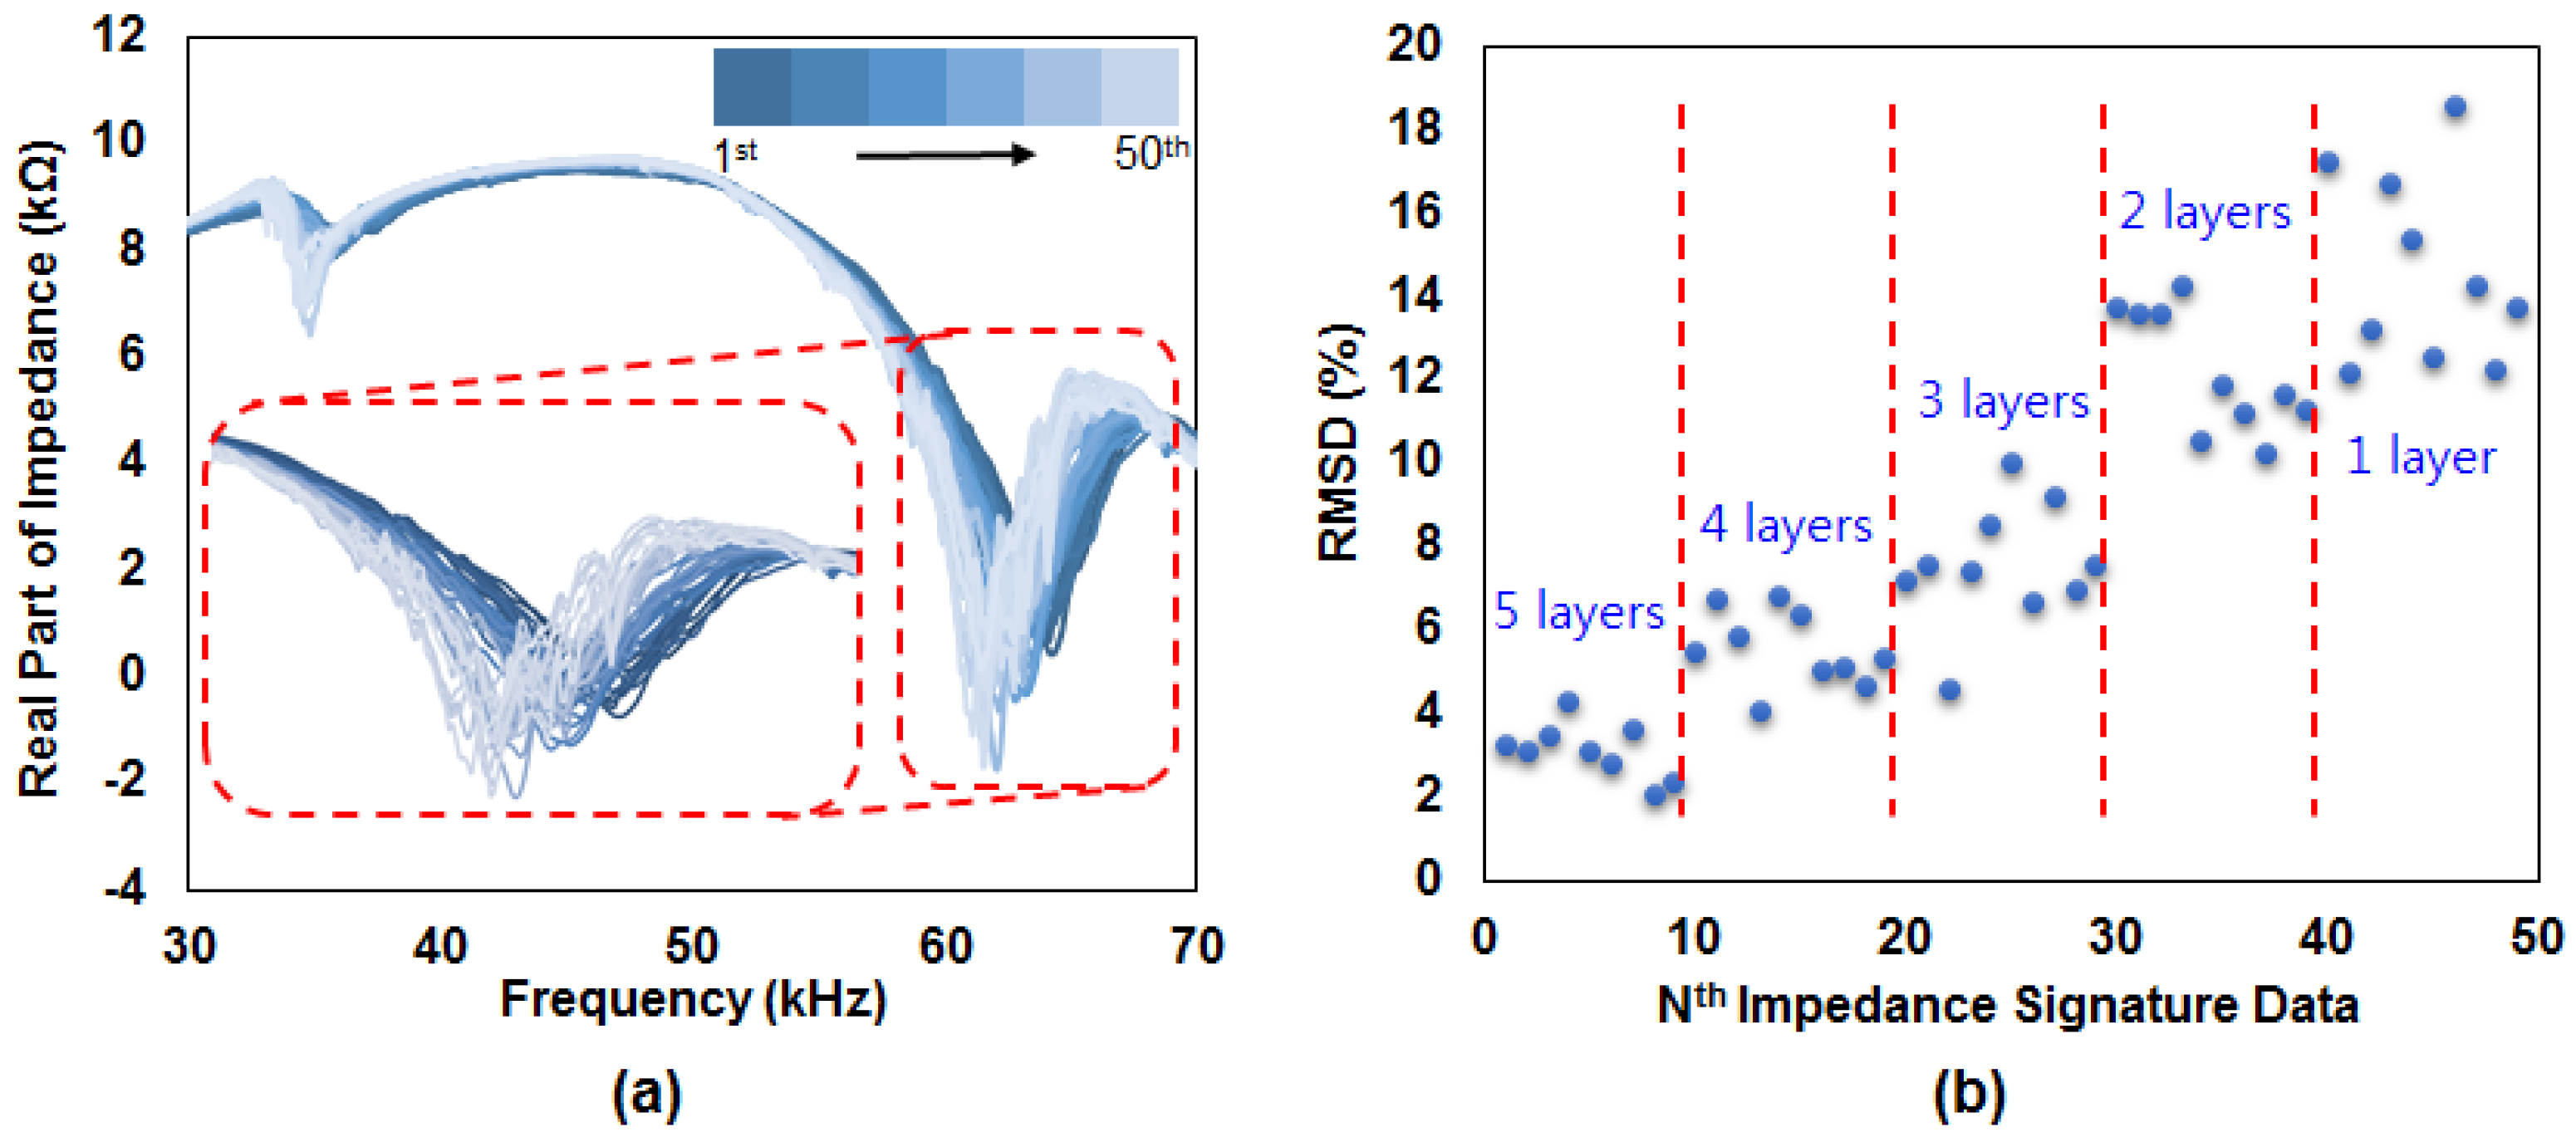
Figure 7a shows 50 impedance signatures measured for the experiment conducted in
Figure 5b. When observing this, a trend exists for the resonance peaks located at 35 kHz and 63 kHz, where both peaks show a decrease in the amplitudes and a shift to the left direction as the thickness of the metal stack layer is reduced.
Figure 7b shows the RMSD values calculated using the first impedance signature, with the remaining signatures being compared to this value. The red dotted lines in the figure separate the RMSD values from a stack of five metal layers, to a single metal layer (first nine dots are measured from a stack with five layers, the next 10 dots are from a stack with four layers, and so forth). Here, there is a clear difference in the RMSD values for the different number of layers, where five layers (0.75 mm) result in values of 2%~4%, four layers in 4%~7%, three layers in 6%~10% (except for the 23rd measurement), two layers in 10%~14%, and one layer in 12%~18%. Thus, for this metal stack case, one can first acquire the impedance signature at five layers for use as a reference signature, then detach the PZT device for it to be used again in the future. When the stack experiences reduction in thickness, the PZT device should be attached to the same spot for measuring the impedance signature again. If the stack thickness has reduced to only two layers, a high possibility exists for the RMSD value to be within the range of 10%~14%. In addition, one can increase the accuracy of the result by simply measuring the impedance signature multiple times before averaging the RMSD values, as a single measurement can result in an unexpected RMSD value, leading to a wrong prediction. Based on this finding, it becomes possible for one to identify thickness reduction of structures subjected to corrosion such as bridges, buildings, and offshore structures, by using a drone equipped with a re-attachable PZT device.
4. Conclusions
This study proposes a new concept of employing UAV for structural health monitoring of civil infrastructures, using a vibration-based NDE method. The concept surpasses the current limitations of using a drone in combination with a visual inspection method and image processing. The vibration-based method can detect small damages which are difficult to identify, and internal damages such as thickness reduction. The key idea of the concept is to make a PZT transducer that can be temporarily attached and detached to a structure, which is a different way of conducting the EMI method, in which the PZT transducer is permanently attached to the host structure for damage identification.
The first part of the study investigates the effect of measured impedance signature while the drone is in a hovering state. Due to the high frequency usage of the NDE method, the effect on the impedance signature can be ignored. The second part of the study evaluated the repeatability performance of the PZT device which is attached, detached, and reattached, to a stack of metal plates, where the RMSD values were calculated and analyzed. The last section of the study investigated the performance of the PZT device against two different damage types. During the first, the PZT device was attached to a metal plate with 1 mm progressive damage being introduced up to 20 mm, and during the second, the PZT device was tested against a stack of metal plates subjected to a thickness loss. The RMSD values for the progressive damage case were noticeably less than the RMSD values calculated from the signatures acquired by reattaching the PZT device on an undamaged plate. Thus, more research is needed to solve this problem. However, the case of thickness reduction on a metal stack showed results which validates the drone SHM concept. For each reduction in metal layers, the RMSD values were within a specific range for all five layers. These were 2%~4%, 4%~7%, 6%~10%, 10%~14% and 12%~18% for 5 layers, 4, 3, 2, and 1 layer, respectively. Therefore, through a consideration of the concept of using a drone equipped with a vibration-based NDE method, new possibilities have been realized and existing problems will need solutions for turning this new concept into reality.

