Article

Leak Detection in Water-Filled Small-Diameter Polyethylene Pipes by Means of Acoustic Emission Measurements †

Department of Engineering for Industry (DIN), University of Bologna, V.le del Risorgimento 2, Bologna 40136, Italy
*
Author to whom correspondence should be addressed.
A preliminary and partial version of this paper was presented at the 8th International Conference on Urban Rehabilitation and Sustainability (URES’16), Rome, Italy, 21–23 October 2016.
Appl. Sci. 2017, 7(1), 2; https://doi.org/10.3390/app7010002
Submission received: 24 November 2016 / Revised: 13 December 2016 / Accepted: 16 December 2016 / Published: 22 December 2016

Abstract

:
The implementation of effective strategies to manage leaks represents an essential goal for all utilities involved with drinking water supply in order to reduce water losses affecting urban distribution networks. This study concerns the early detection of leaks occurring in small-diameter customers’ connections to water supply networks. An experimental campaign was carried out in a test bed to investigate the sensitivity of Acoustic Emission (AE) monitoring to water leaks. Damages were artificially induced on a polyethylene pipe (length 28 m, outer diameter 32 mm) at different distances from an AE transducer. Measurements were performed in both unburied and buried pipe conditions. The analysis permitted the identification of a clear correlation between three monitored parameters (namely total Hits, Cumulative Counts and Cumulative Amplitude) and the characteristics of the examined leaks.

1. Introduction

The efficiency of urban water distribution networks is limited by significant leakage issues, which result in large water losses possibly exceeding 30% of the input volume [1,2,3]. Hence, the implementation of proper policies to control water leaks represents a challenging but essential target for all the utilities involved with drinking water supply.
Many approaches for leak detection and location have been investigated in order to implement effective Leakage Management strategies (e.g., thermography, Ground Penetrating Radar, tracer gas techniques, noise and vibration monitoring, Electrical Resistivity Tomography, Time Domain Reflectometry, etc.) [4,5,6,7,8,9,10,11,12,13,14]. This paper focuses on Acoustic Emission (AE) methods, which belong to the family of techniques based on vibro-acoustic phenomena.
According to the ASTM E1316 Standard [15], the term Acoustic Emission defines “the class of phenomena whereby transient elastic waves are generated by the rapid release of energy from localized sources within a material, or the transient waves so generated”. In particular, AE refers to vibro-acoustic phenomena in the sonic and ultrasonic frequency range (up to 1 MHz) which propagate in solid materials. Monitoring of AE is a highly non-intrusive nondestructive testing and evaluation method, which is applied to several processes identified as sources of AE (e.g., crack formation and growth). In general, AE methods are based on the analysis of the parameters that characterize the waveforms of the measured AE signals. Some of these parameters are [15]: (i) Hit—“any signal that exceeds the threshold and causes a system channel to accumulate data”; (ii) Counts—“the number of times the Acoustic Emission signal exceeds a preset threshold during any selected portion of a test”; (iii) signal Amplitude—“the peak voltage of the largest excursion attained by the signal waveform from an emission event”. AE methods were originally developed for pressure vessels, both to inspect them during pressure testing and to detect leakages (e.g., loss of coolant in nuclear reactor vessels). Also, water flows leaking from pipelines generate AE, which propagate along the pipe walls. Indeed, AE methods for leak detection have been successfully applied also to water pipelines, in particular, for medium/large-diameter distribution pipes made of steel or plastic or prestressed concrete [16,17,18,19], even if the technique’s effectiveness may be considerably affected by the specific boundary conditions of the system under investigation [20]. In general, better detection capabilities could be achieved by applying procedures for artificially amplifying the leak noise (e.g., gas injection or fluid pressure variation) [14,18]. It is worth mentioning, however, that such procedures may be unsuitable for practical use in some existing pipeline networks, since they require significant modifications of the system working conditions (which are not always allowed during normal operation, as in the case considered in this study).
This work investigates the detection of water leaks occurring in polyethylene (PE) small-diameter service pipes of water supply networks, by means of AE measurements. Indeed, this class of pipes represents a significant percentage of the service pipes installed in the distribution network managed by the Italian multi-utility that promoted the research, namely a network that supplies about 3 × 10⁸ m3 per year of drinking water to 237 municipalities (total population of about 4 million), through 35,150 km of water mains. In particular, PE pipes have been used over roughly the last two decades for all the new connections. Furthermore, all the leaks currently detected in service pipes are repaired by completely replacing the old pipes with new PE ones. Leaks in customers’ connections are generally characterized by low flow rates but long total runtime (i.e., the total period from the leak initiation to the burst repair). Since thousands of service pipes are present in each water district, these leaks can result in high overall losses. Implementing an effective active control strategy for this kind of leak is therefore as crucial as managing larger bursts in the water main pipelines.
The long-term objective of the research is the development of a system for automatic early detection of unreported burst leaks occurring in the service connections running from the water main to the users’ metering points [21]. To the authors’ best knowledge, no studies have specifically investigated the use of AE methods for leak detection purposes in plastic small-diameter service pipes. The desired system is meant to be installed next to the customer water meter and to operate with the normal functioning conditions of the network. In order to keep costs as low as possible, the system should rely on relatively simple hardware components and, consequently, computationally demanding signal processing is not suitable for this application. Hence, the investigation took into account only basic signal processing techniques.
An experimental campaign was performed to assess the suitability of AE methods for the application of interest. The experiments were conducted on a test rig featuring a small-diameter polyethylene pipe, which simulated a typical customer connection branch of the network. The test bed replicated the main characteristics of buried service pipes of the network of interest. AE events were monitored by means of a wideband AE sensor. Water leaks were artificially induced at different distances from the transducer measuring location. Measurements in both leaking and non-leaking conditions were carried out. Two different boundary conditions of the pipeline were taken into account. Firstly, measurements were performed on the unburied pipe. Then the pipe was covered with backfill soil and further tests were conducted.
This paper is organized as follows. Section 2 describes the experimental setup and procedures, and reports the most relevant results of the analysis for the unburied pipeline. The tests on the buried pipe are presented and discussed in Section 3. The last section draws the conclusions of the investigation.

2. Unburied Pipe Tests

An experimental facility with unburied pipes was arranged to define the test protocols and perform the first measurements.

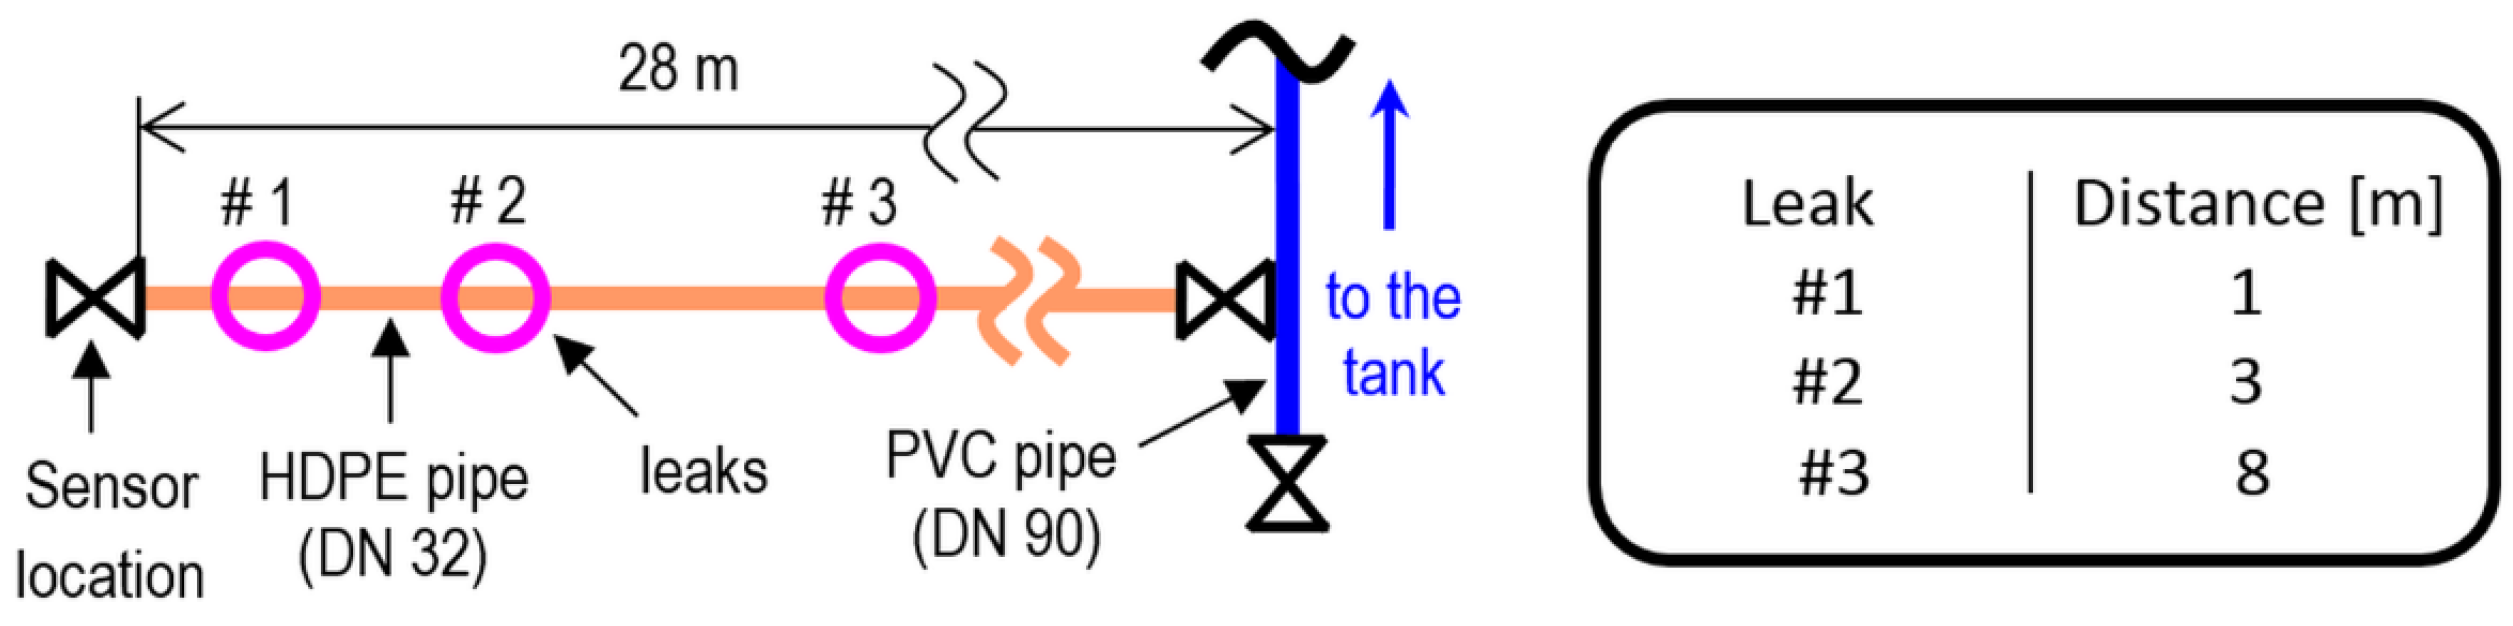
2.1. Experimental Setup and Tests

The test bed, sketched in Figure 1, simulated a section of the water supply network. A polyvinyl chloride (PVC) pipe with an outer diameter of 90 mm (DN 90) was used as the water main. A high-density polyethylene (HDPE) pipe of length 28 m and smaller diameter (DN 32) was connected to the larger one as customers’ service pipe. It was placed at a depth of about 0.5 m on a layer of backfill soil, but left unburied. Two-way shut-off valves were installed at both its extremities. A pressure tank, equipped with a pressure gauge and a pressure regulation system, fed the facility at a constant pressure of about 3.5 bar, which replicates the typical network operation.
Artificial 20 mm longitudinal cuts (parallel to the pipe axis) were generated at three different locations along the pipe (Figure 1). The distance of each leak from the terminal valve is reported in Figure 1. The induced damages simulated one of the most common kinds of cracks characterizing burst leaks occurring in the HDPE service pipes managed by the local multi-utility, based on its maintenance records. Such cracks are expected to generate a leaking flow of about 200 L/h in the typical network functioning conditions, which is the target leak rate to detect. Pipe repair clamps were installed to rapidly switch between leaking and non-leaking conditions, and vice versa (Figure 2).
An AE sensor (Mistras WSα, sensitivity 55 dB, ref. 1 V/(m/s)) operating in the frequency range of 0.1–1 MHz was installed on the pipe terminal valve (Figure 3). This arrangement simulated the sensor setup possibly achievable in actual service pipes (with the sensor mounted near the customer water meter, i.e., distant from the water main). Indeed, as for the water supply network of interest, customers’ water meters are typically installed inside manholes or concrete boxes to be easily accessible for reading operations. The sensor was mounted by using a silicone rubber compound as the coupling agent. Adhesive tape held the sensor in place and provided proper preload during the curing process of the bond. Acquisition and conditioning of the signals were performed by means of a Mistras system, namely the USB AE NodeTM (MISTRAS Group Inc., Princeton Junction, NJ, USA) device and its related software AEwinTM [22]. A wideband analysis was performed, since these experiments were meant as a preliminary investigation and, to the authors’ best knowledge, no studies on small-diameter plastic pipes could be found in the literature, thus only few data were available.
The acquisition setup featured a threshold of 28 db (which defines the minimum signal amplitude considered for identifying an AE event) and a sampling frequency of 5 MHz. Different sets of values were tested for the timing parameters that control the extraction of the signal features and waveform recording, namely [22]: Peak Definition Time (PDT), which determines the detection of both the peak amplitude and the rise time of an AE event; Hit Definition Time (HDT), which is related to the AE event duration; and Hit Lockout Time (HLT), which sets the minimum time interval between two consecutive AE events. The best results, here presented, were obtained by setting PDT = 200 μs, HDT = 800 μs, and HLT = 1000 μs. Time-driven measurements were adopted, namely acquisitions with a preset duration of 90 s. Indeed, water leaks are expected to cause continuous AE signals (although some exceptions have been documented [14]). This expression qualitatively describes AE waveforms characterized by time-overlapping emissions, as opposed to burst AE (i.e., a discrete sequence of AE events), which are typically associated with processes such as crack growth.
Measurements were performed in three conditions:
  • The non-leaking state (referred to as NL), set by stopping all the leaks with the repair clamps;
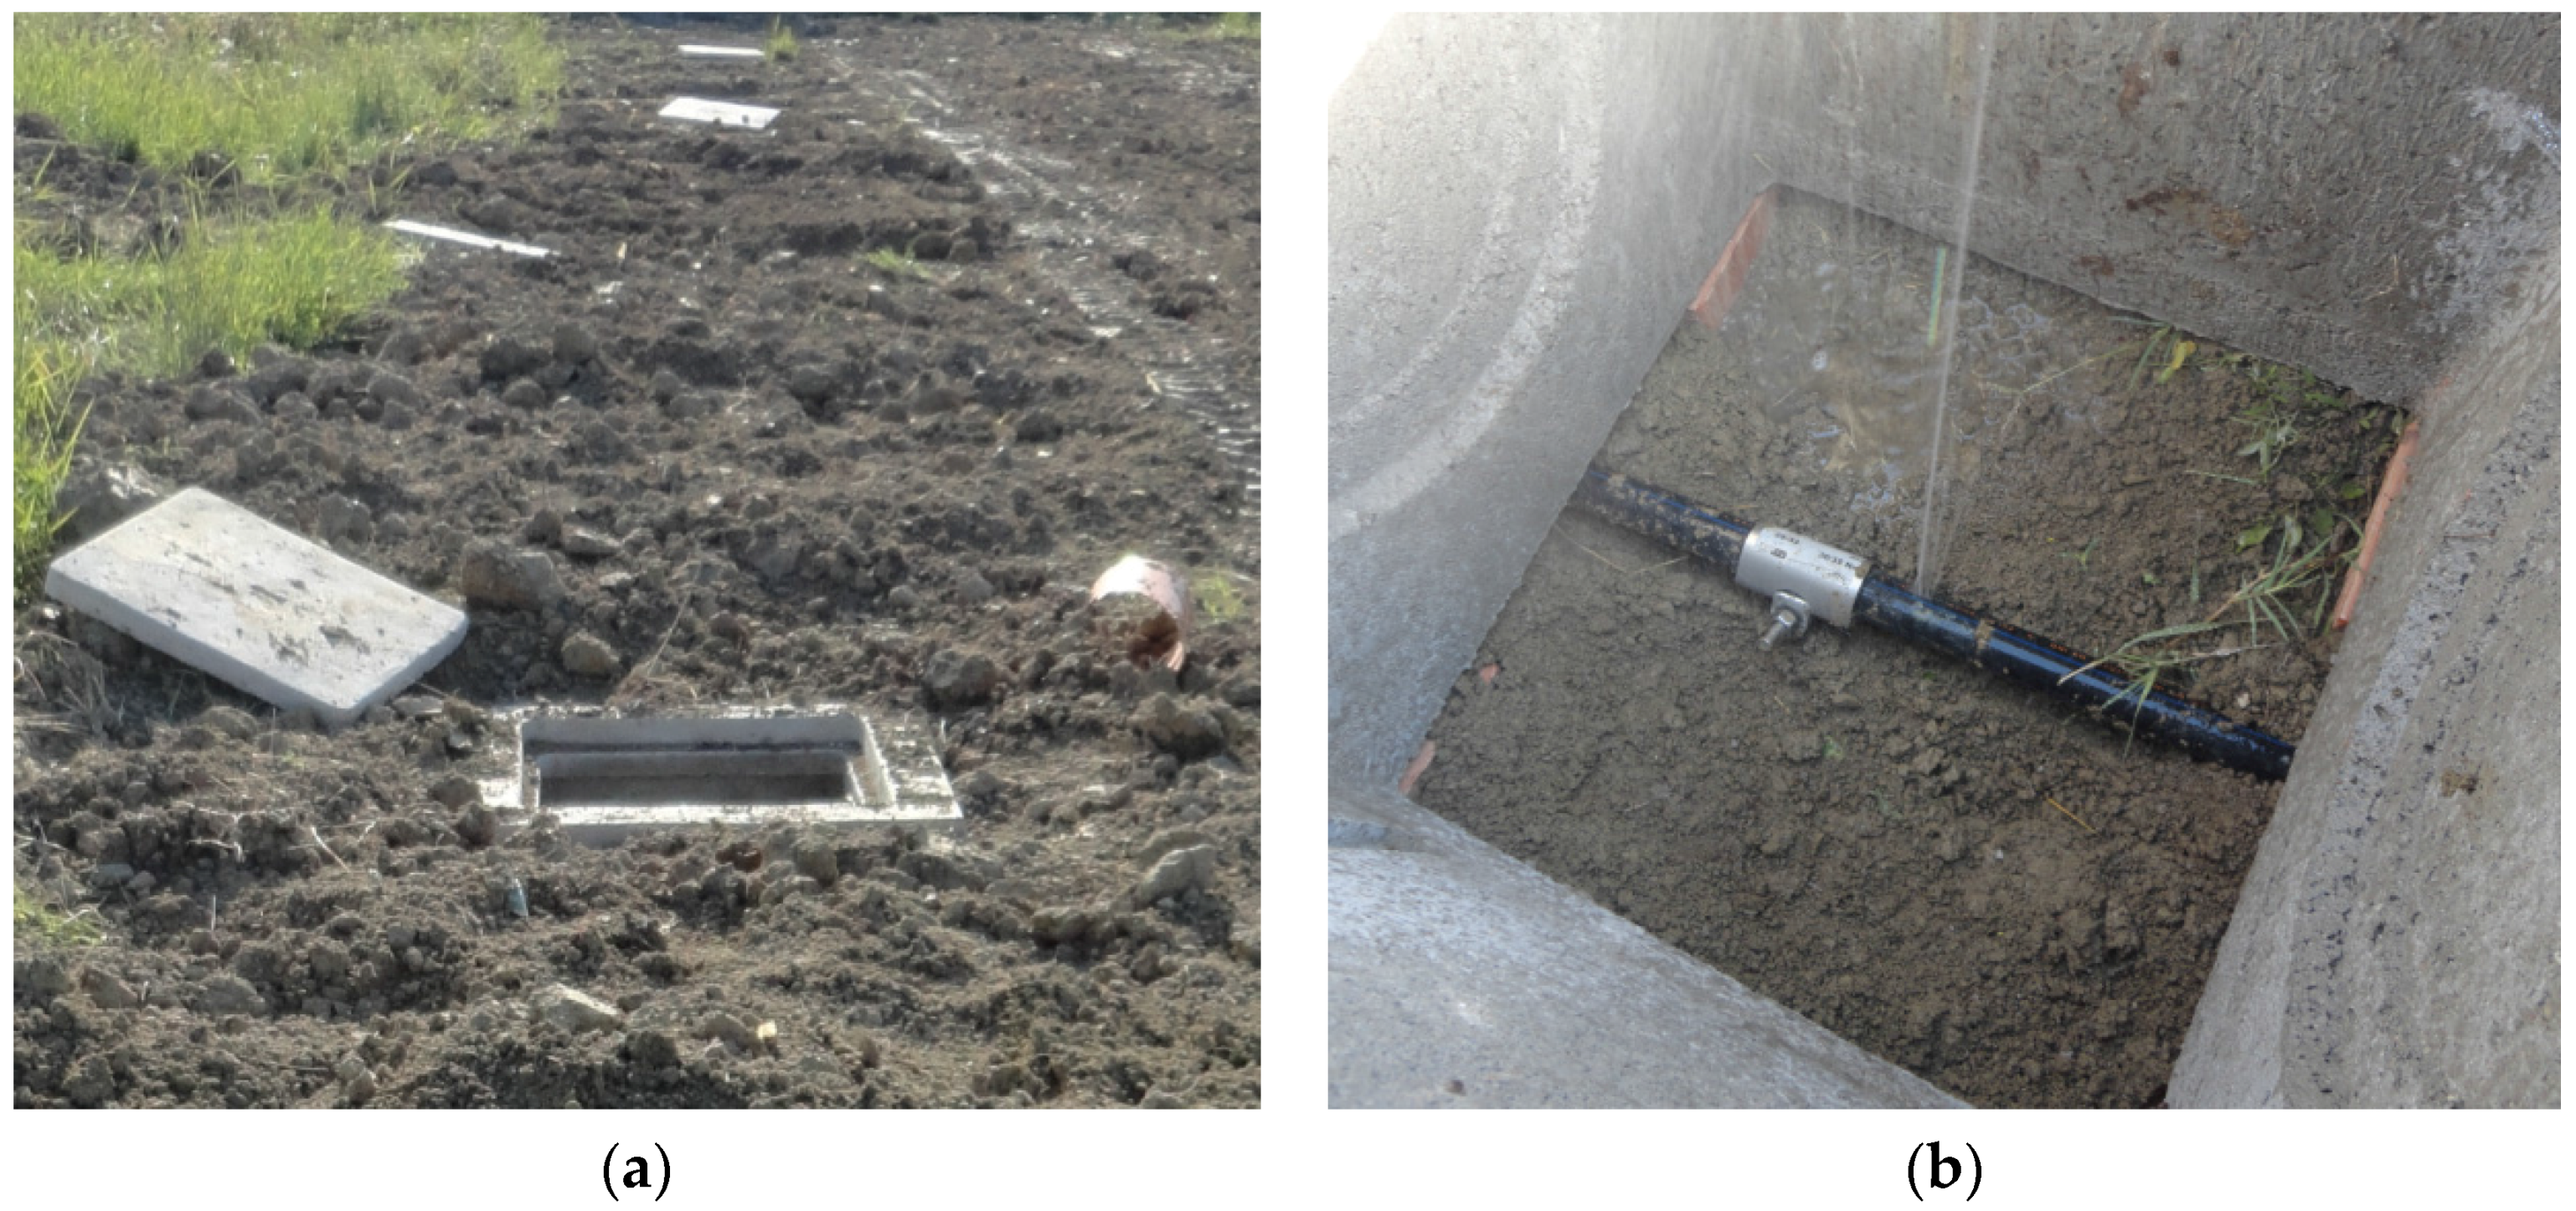
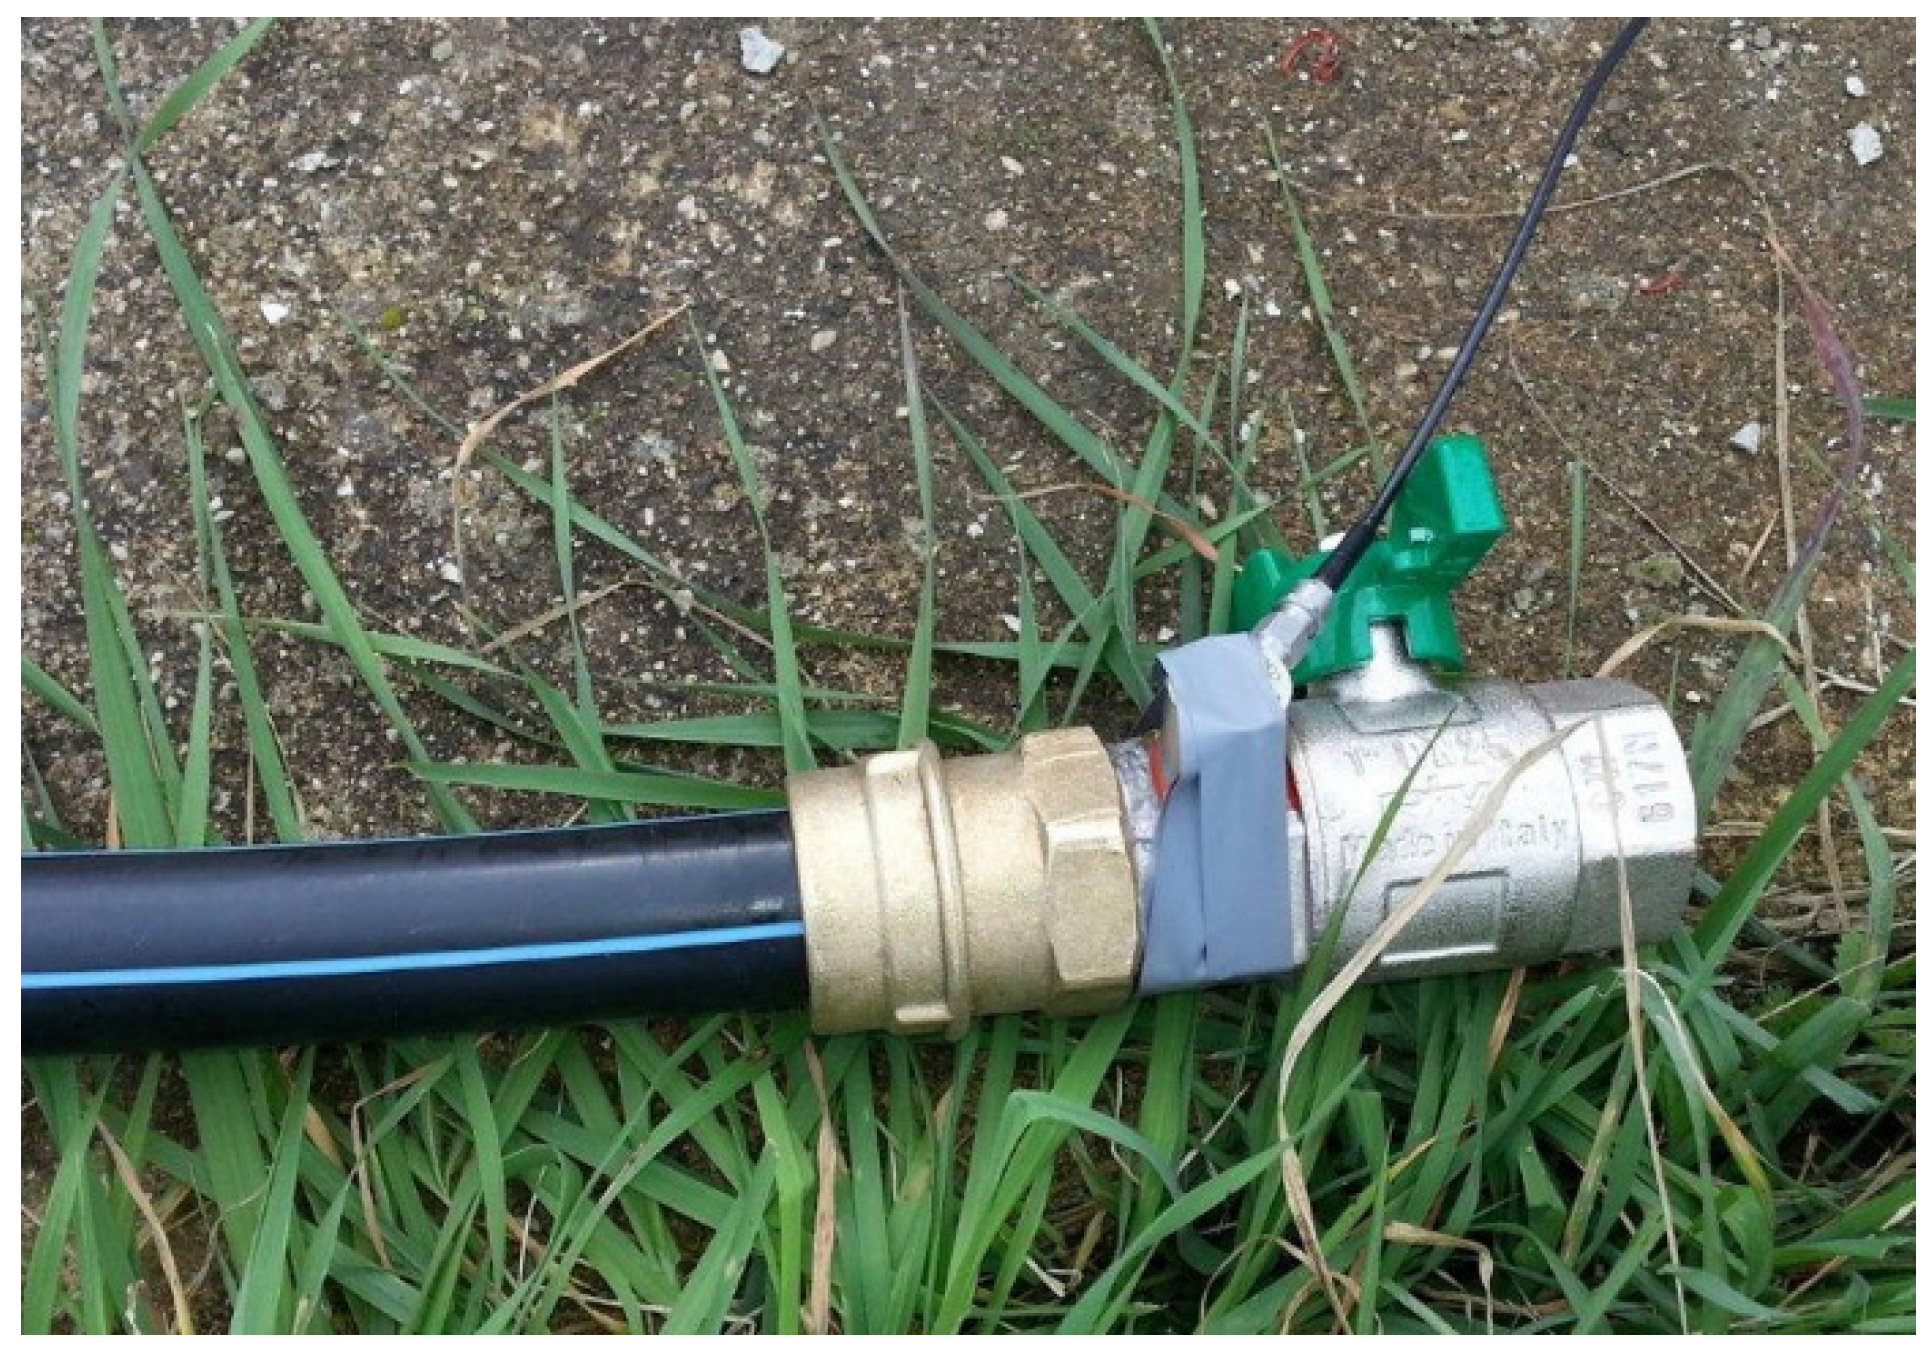
  • Water leaking from the j-th active leak (Lk-j), a condition set by temporarily removing the corresponding repair clamp (Figure 2a);
  • All the leaks activated simultaneously (Lk-123).
The first condition provided data on the environmental noise. The pressure gauge installed in the pressure tank did not reveal any pressure drop occurring over time, thus confirming that the non-leaking state had been correctly restored. The second and the third conditions permitted the assessment of AE events related to active leaks. Three acquisitions were collected for each condition, separated by proper time intervals, for the sake of statistical confidence. The terminal valve was kept closed in all tests. Consequently, on one hand, the flow rate inside the pipe was entirely ascribable to the leaking flow of an active leak, in order to simulate a condition of null water consumption by the customers. On the other hand, no flow was present at the sensor location.
All the relevant parameters characterizing AE were investigated to find possible correlations with the leaking conditions. In particular, the analysis focused on the trend of three parameters that appeared more sensitive to the presence of leaks, namely:
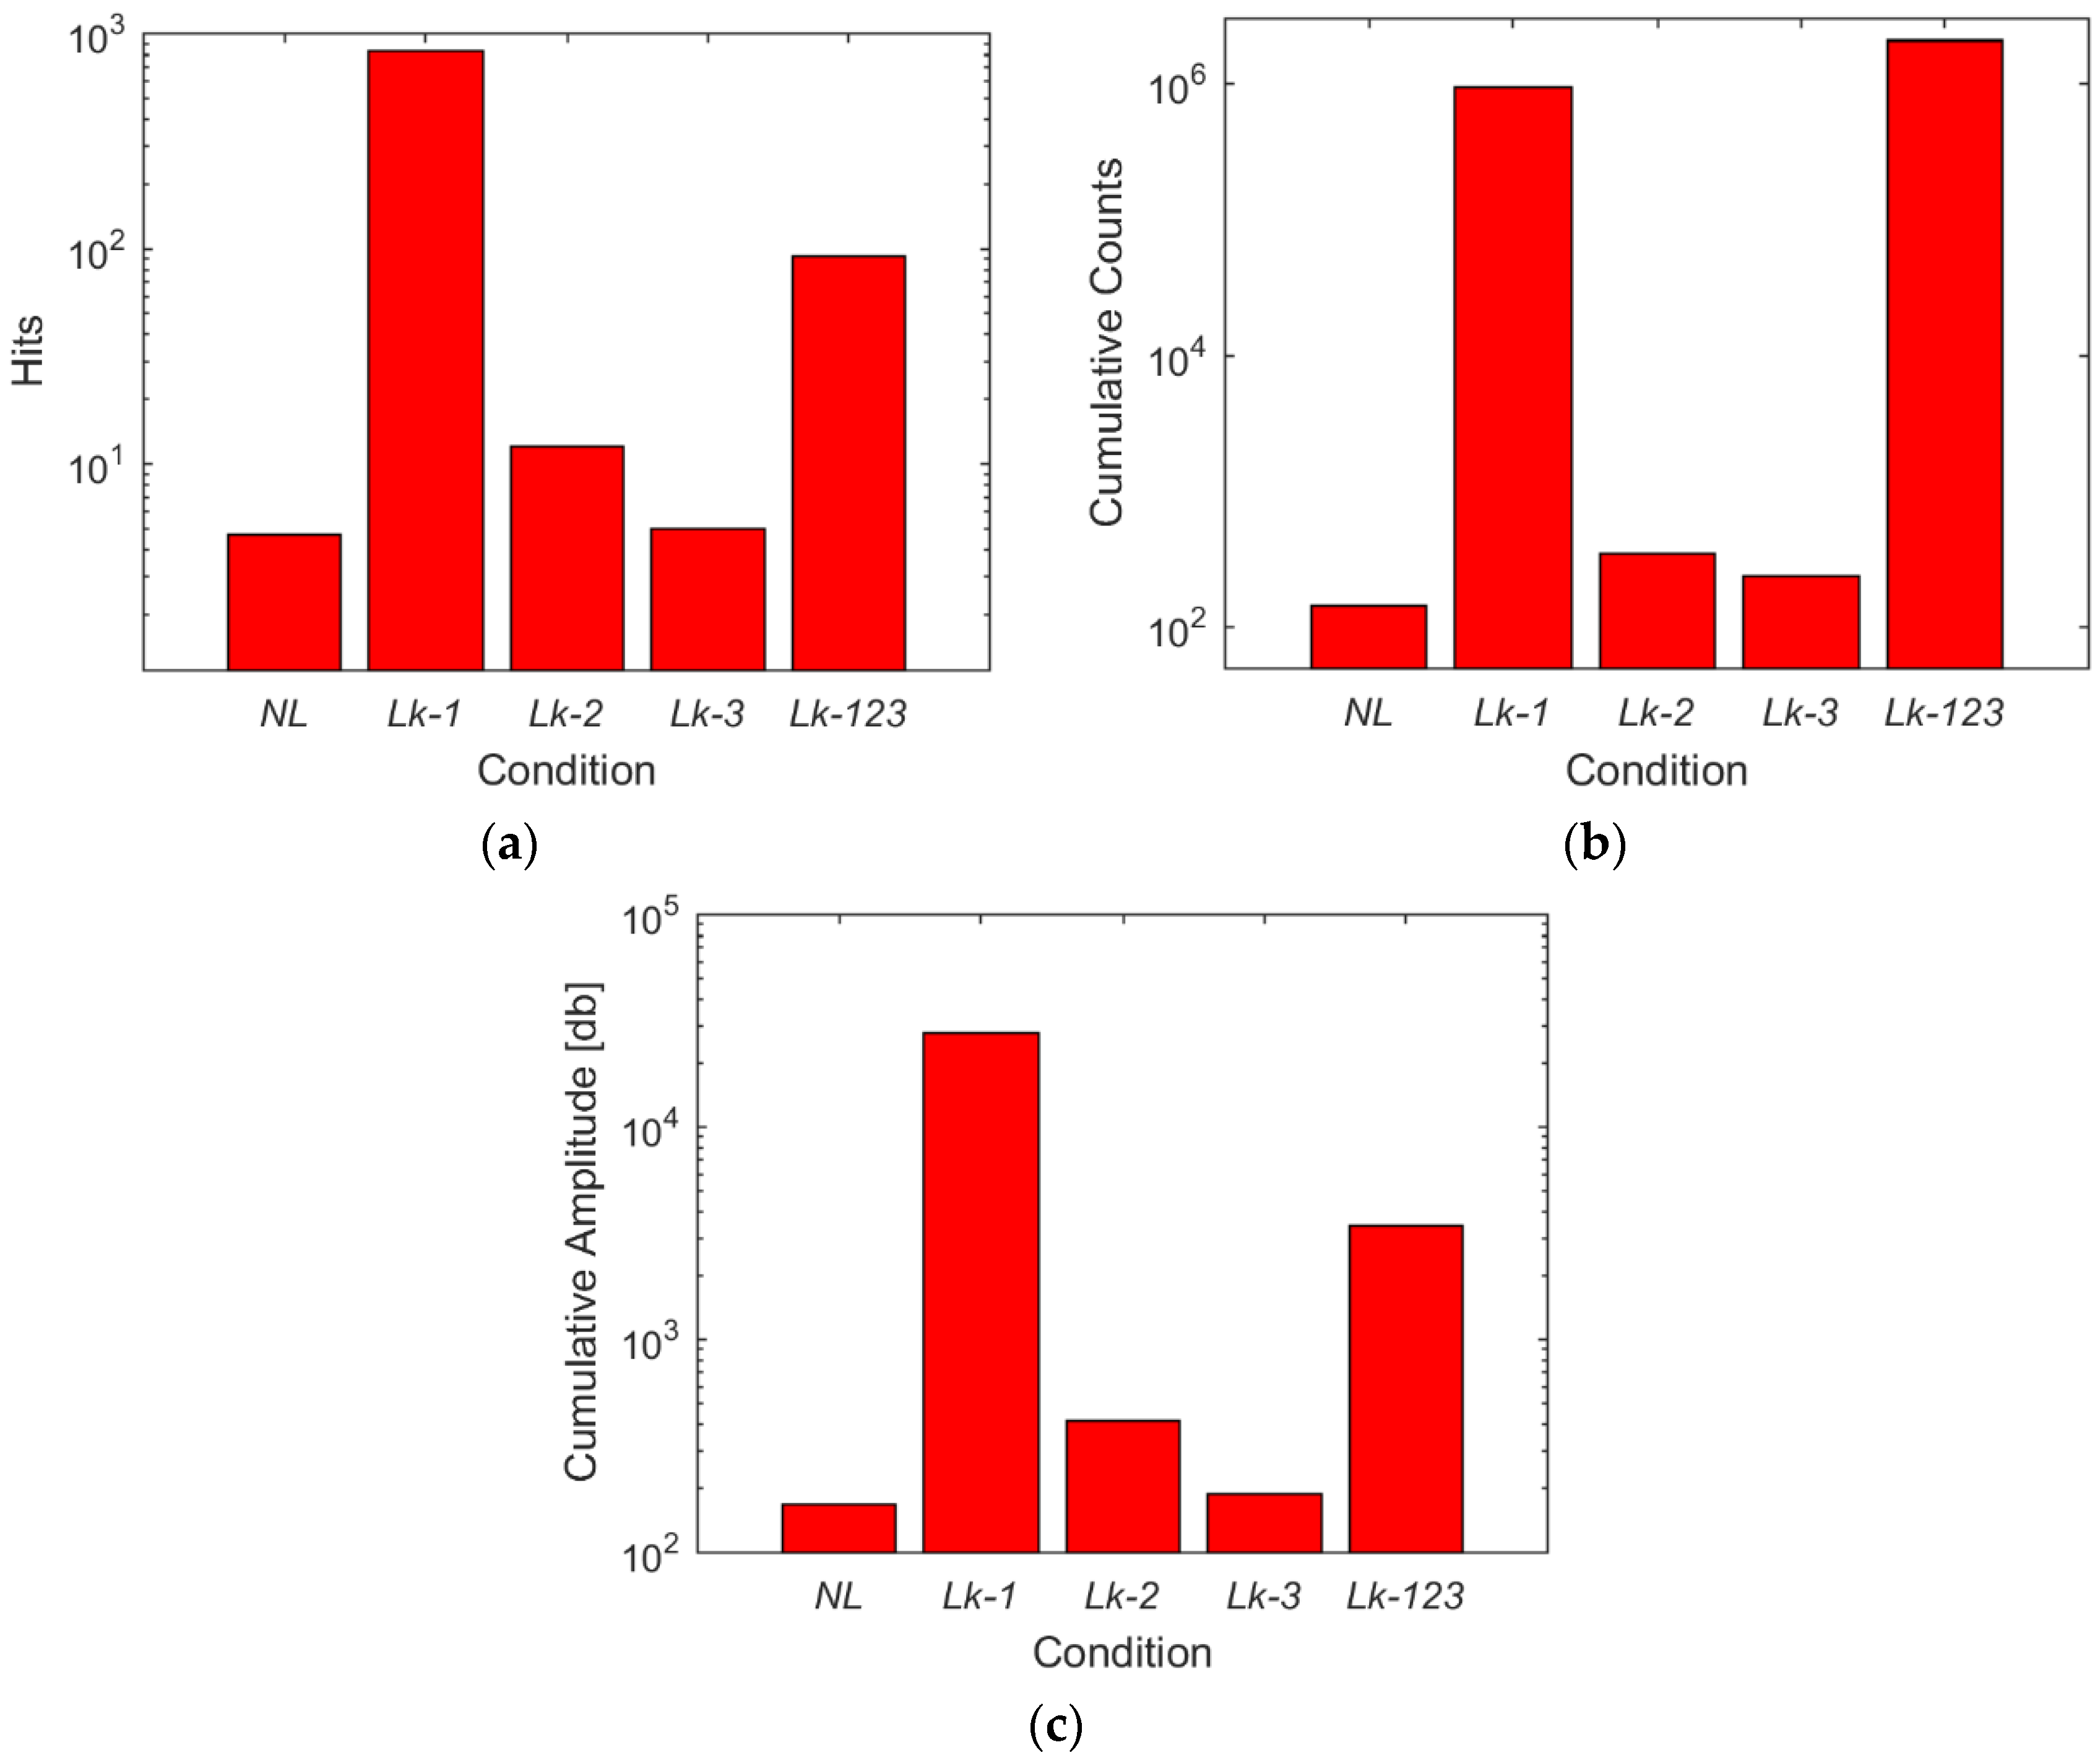
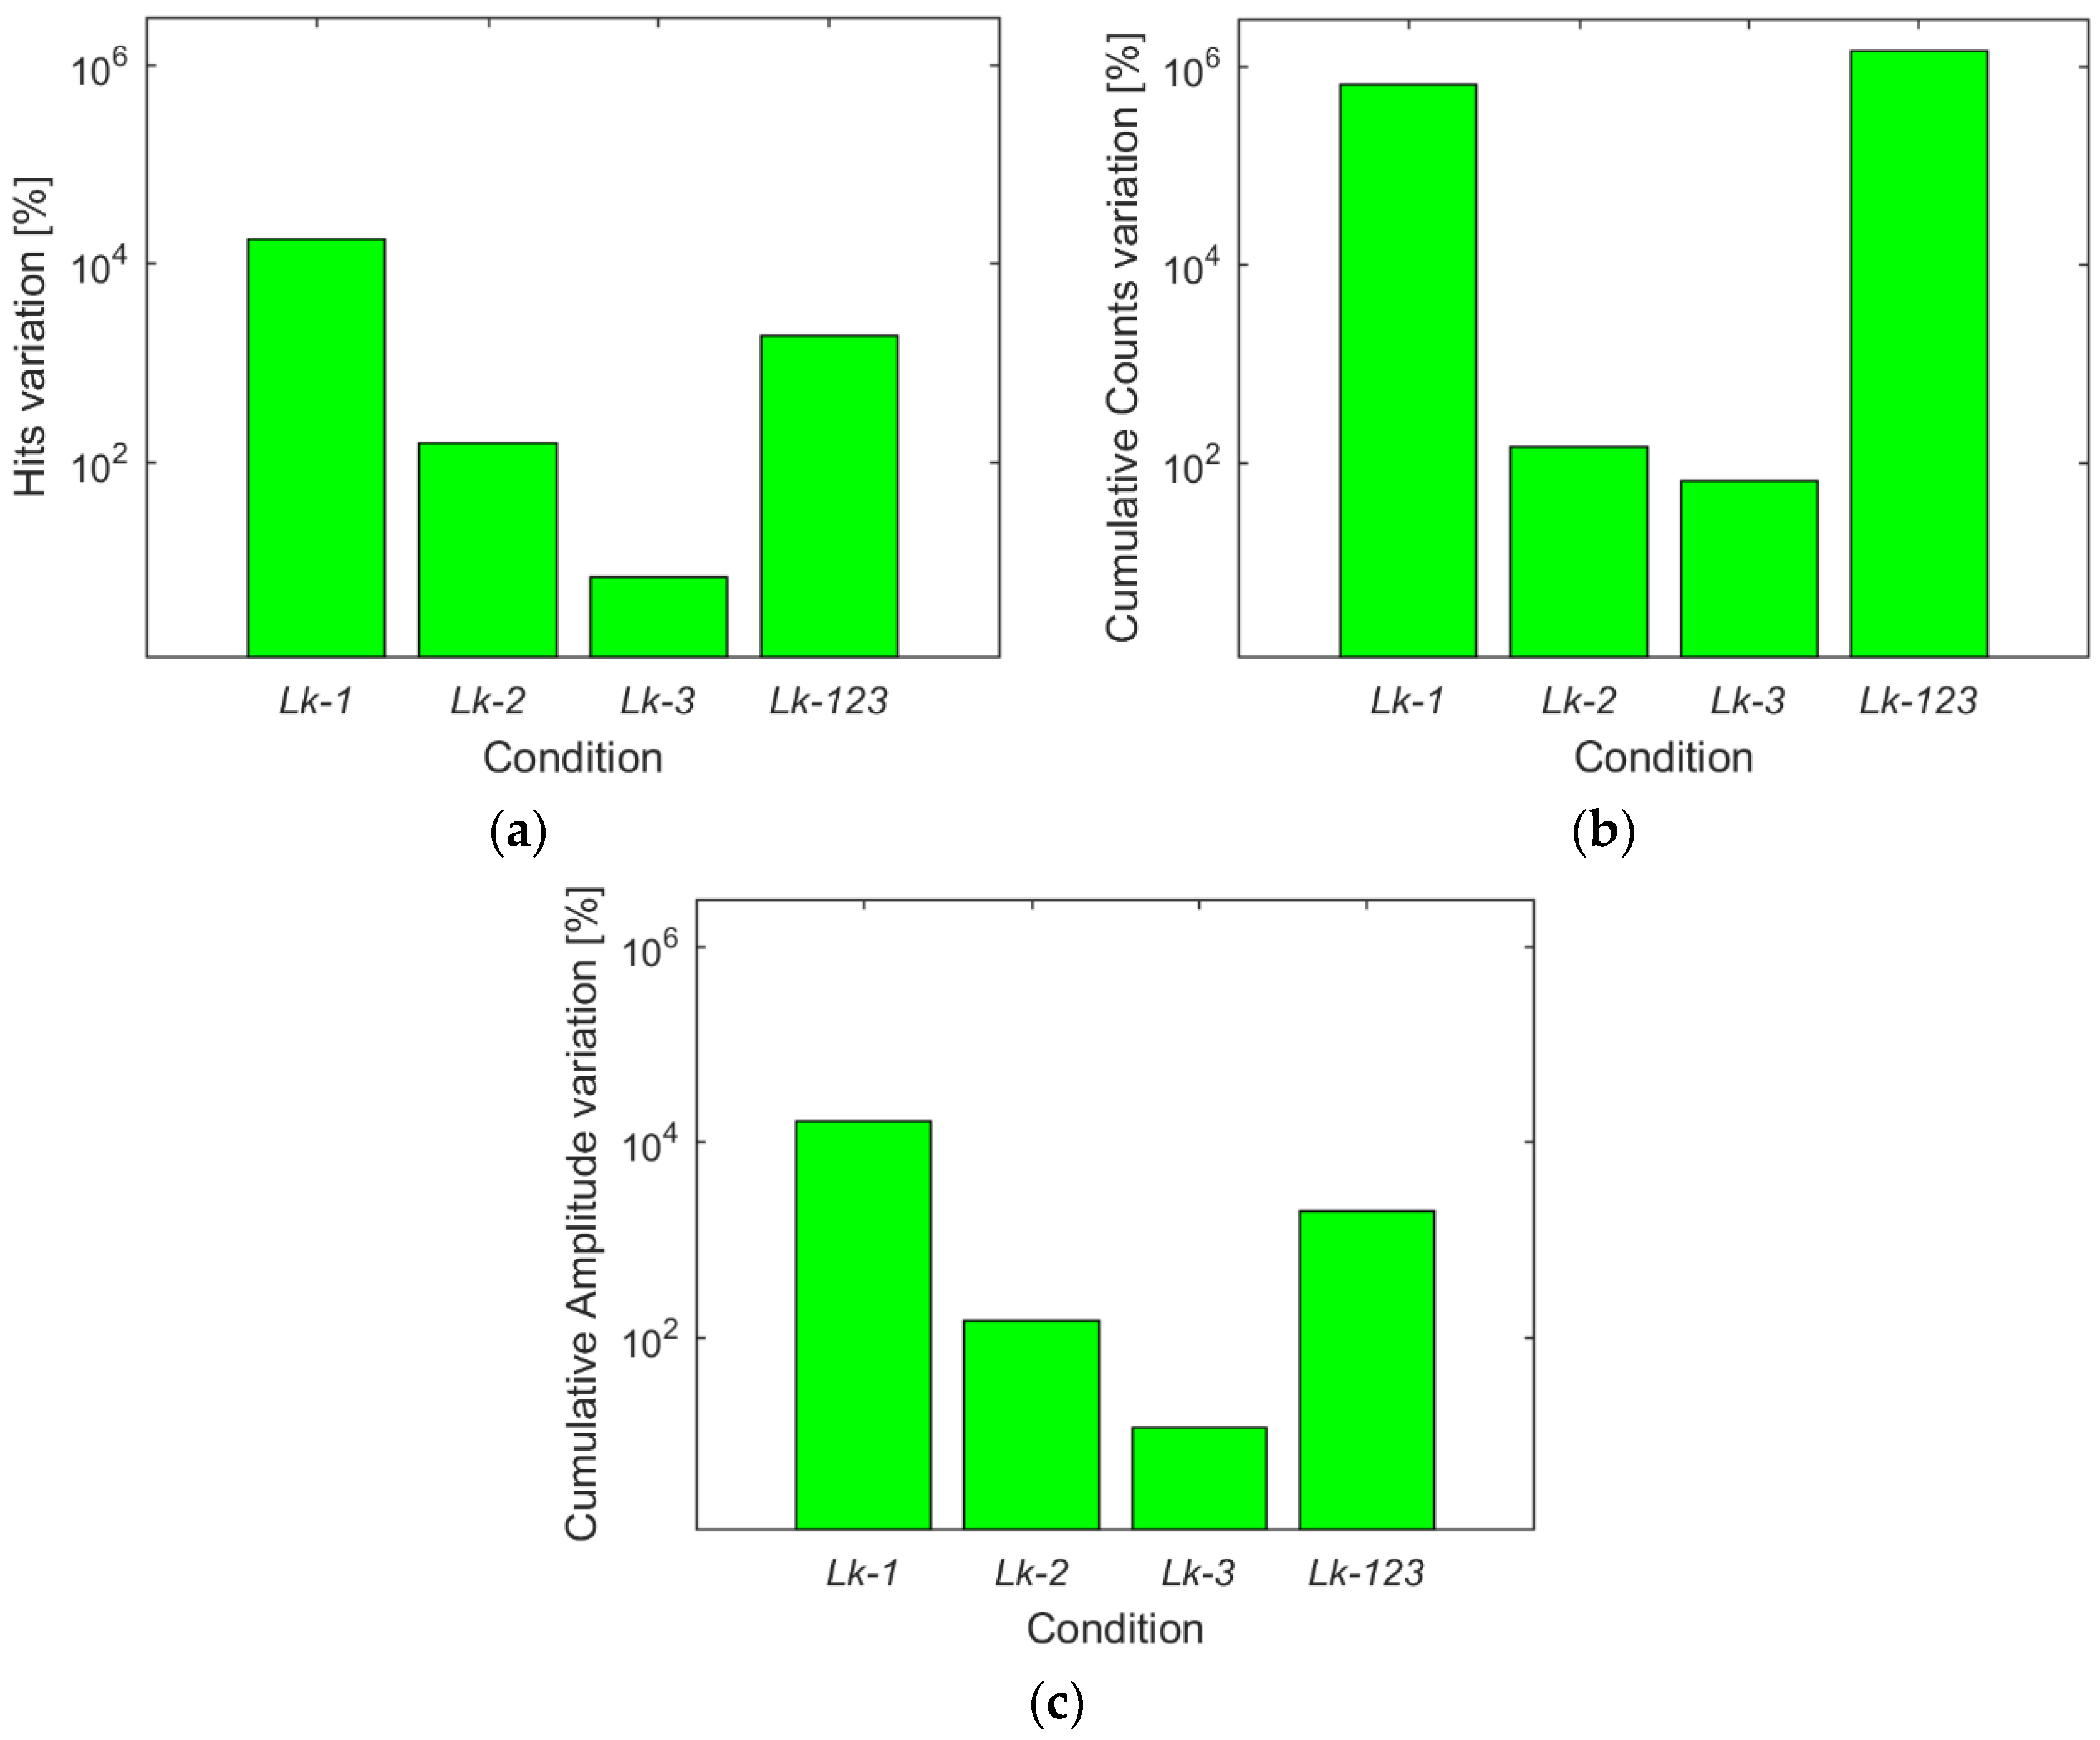
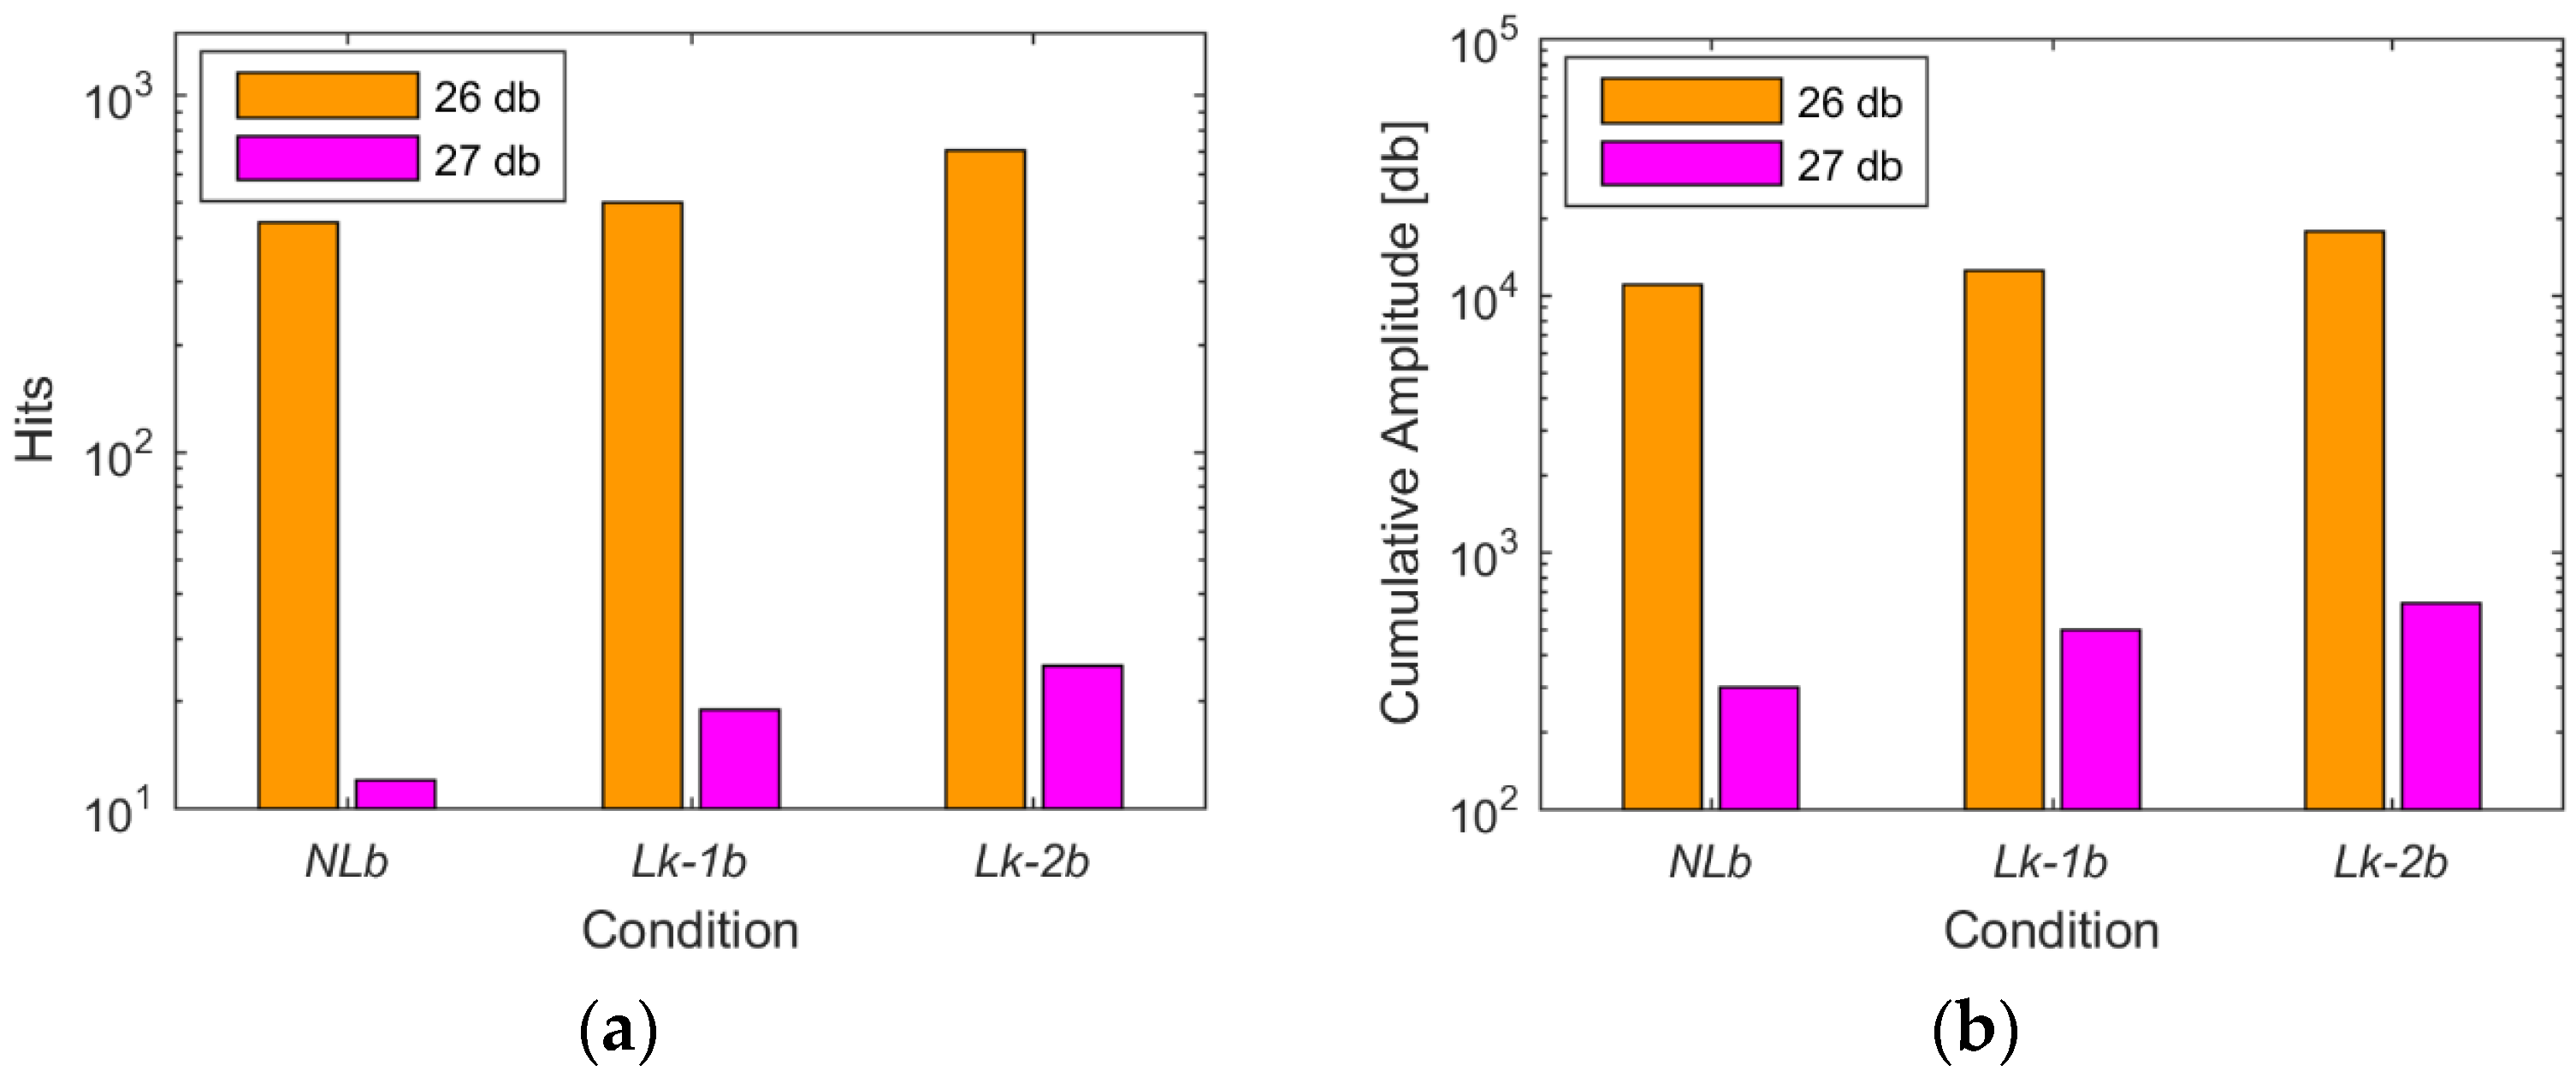
  • Total amount of Hits per acquisition, which coincide with the number of AE events for the adopted setup, where only one sensor is installed for measurements;
  • Cumulative Counts, computed by summing the Counts of all Hits related to one acquisition;
  • Cumulative Amplitude, computed by adding together the Amplitude values of all Hits related to one acquisition.
These quantities were computed for each test condition, by averaging (with arithmetic mean) the values provided by the three corresponding acquisitions (in order to achieve a better accuracy).
The analysis also examined the distribution of the Average Frequency values (ratio of the Counts of an AE event to the duration of the event, referred to as AF hereafter) over the RA values (ratio of the rise time of an AE event to the event Amplitude). The pattern of AF over RA values was proposed in [17] as a possible tool to detect leaks. In particular, AE events related to active leaks are expected to exhibit higher values of the AF to RA ratio. Such AE events are referred to as tensile-type emissions, since a similar behavior is observed for AE signals associated with the tensile mode of crack propagation. Conversely, AE detected in a non-leaking state (possibly due to a non-zero water flow inside the pipe) should feature lower ratios, hence being referred to as shear-type emissions (consistently with AE signals characterizing shear crack growth). This peculiar pattern (i.e., a larger percentage of tensile-type AE events) should permit leak detection. Differing from the previous one, this analysis considered all the detected AE events, without averaging the acquisitions.

2.2. Results and Discussion

The averaged AE parameters taken into account for this analysis, namely Hits, Cumulative Counts, and Cumulative Amplitude, are reported in Figure 4 for all the tested conditions. The measurements exhibited an acceptable repeatability, with standard deviation generally remaining below 15% of the mean value.
Some AE events can be observed for the non-leaking state. Since for this condition the flow in the test bed is null, such events are due to external disturbances.
Data concerning the conditions Lk-2 and Lk-3 (i.e., the most distant leaks) exhibit low signal levels, reasonably due to significant attenuation of the high frequencies in the plastic pipe. Consequently, the corresponding acquisitions appear characterized by burst signals rather than continuous ones.
As for the leak detection performance, all the leaking conditions are clearly revealed by an increment in all the monitored AE parameters. As expected, the increment is notable when the nearest leak is active (conditions Lk-1 and Lk-123), whereas it rapidly decreases as the leak distance grows. The trend of the Cumulative Counts is also consistent with the variation of the leaking flow rate. Indeed, more Counts are detected when all the leaks are active. Conversely, the condition Lk-123 shows less Hits than Lk-1. This anomaly is reasonably ascribable to the higher average signal level characterizing the former condition (26 db instead of 24 db), which affects the identification of AE events in the continuous signals (since the timing parameters are kept unaltered). The same behavior characterizes the Cumulative Amplitude as well, since it partially depends on the number of Hits.
The percentage variation of the parameters in the leaking conditions, with respect to the non-leaking state, was computed to better compare their sensitivity to leaks (Figure 5). The values related to the Cumulative Counts are the highest for all the leaking conditions, and in particular for the most distant leak (Lk-3). Hence, the Cumulative Counts seem potentially more suitable to assess the presence of active leaks.
The distribution of the AF over the RA values is also computed for all the tested conditions. Figure 6 reports the comparison between conditions NL and Lk-3, shown as an example. Apparently, the leaking condition exhibits a larger percentage of tensile-type AE events; i.e., it is characterized by higher values of the AF to RA ratio (as opposed to shear-type AE events, which feature lower ratios). This behavior is consistent with the result obtained in [17], and permits the detection of the leak.
Hence, these preliminary tests showed that both the monitoring of Cumulative Counts and the analysis of the AF vs. RA pattern may be suitable for detecting leaks by means of AE measurements. Nonetheless, further data and analyses are required to confirm the effectiveness and the convenience of these tools for leak detection purpose, as well as to achieve a satisfactory degree of confidence in the detection, in particular, for distant leaks.

3. Buried Pipe Tests

The test bed was modified to perform new measurements on a buried pipeline and with a larger set of active leaks.

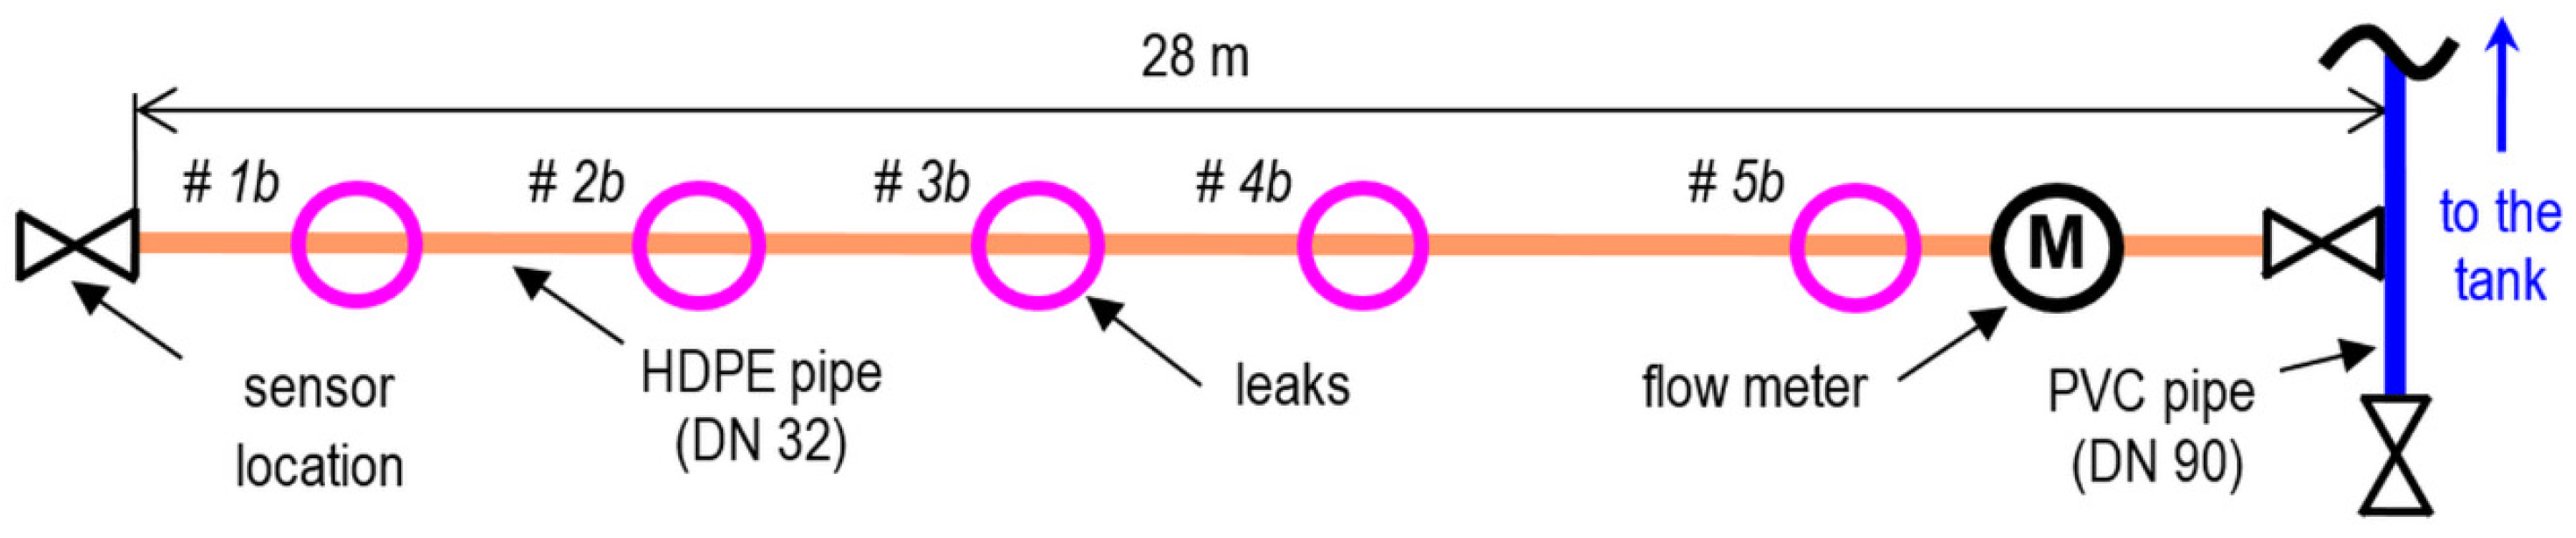
3.1. Experimental Setup and Tests

Other artificially induced leaks (further 20 mm longitudinal cuts) were generated and examined. The new tests considered five leaks at different locations along the pipe (Figure 7). The distance of each leak from the terminal valve is reported in Table 1.
A static electromagnetic flow meter, namely a SENSUS iPERL with low starting flow rate (about 4 L/h) was installed at the pipe T-joint to monitor the leaking flow (Figure 7). This kind of flow meter was not expected to affect measurements with additional noise, since it does not include mechanical moving parts. The flow rate measured for each active leak is shown in Table 1. Leak # 5b, larger than the other ones, had been generated for other experiments and its flow rate was notably higher. Nonetheless, Leak # 5b was taken into account as well to assess the effects of a large leak located relatively distant from the transducer.
All the pipelines were buried under about 0.5 m of backfill soil (Figure 8a). Manholes were installed to allow access to the leak locations and to the valves (Figure 8b).
The same sensor setup and acquisition parameter of the previous tests were adopted to better compare the results, except for the threshold level. Indeed, it was necessary to reduce this parameter, as the first trial acquisitions revealed extremely low signal levels. In particular, two different sets of measurements were carried out with threshold levels of 26 and 27 db, respectively. It is worth noting that a further tuning of all the acquisition parameters may be required for measurements on the real network, due to a certain variability of the boundary conditions. Nonetheless, the refined values would not be expected to differ significantly from the ones adopted in the experiments, since the test bed replicates the main features of actual HDPE service pipes.
Consistent with previous tests, the following measurements were performed, where the letter ‘b’ designates the buried condition:
  • acquisitions in non-leaking state (referred to as NLb hereafter), set by deactivating all the leaks with the repair clamps, to assess the environmental noise;
  • water leaking against backfill soil from the j-th active leak (Lk-jb), a condition set by temporarily removing the corresponding repair clamp (Figure 8b).
As for the second condition, the presence of soil over the leaking flow was simulated by covering the section of pipe inside the manhole with a plastic sack filled with soil, which could be easily installed and removed, thus permitting rapid operation of the repair clamps. The sack was arranged to match a large portion of the pipe’s external surface near the leak, so that it was expected to stay basically in contact with the pipe during tests. This setup was meant to replicate the conditions characterizing leaks at an early stage (i.e., without cavities being yet generated by the leaking flow).
The other test procedures were not modified. In particular, it is worth recalling that the terminal valve remained closed in all tests, hence ensuring that the flow rate inside the pipe was entirely ascribable to the leaking flow of an active leak and that the water flow at the sensor location was null. Moreover, repeatability was achieved by repeating measurements three times for each condition.
Experimental data were examined consistently with the protocols defined in the preliminary tests (cf. Section 2.1). Hence, the following analyses were performed on the AE measurements:
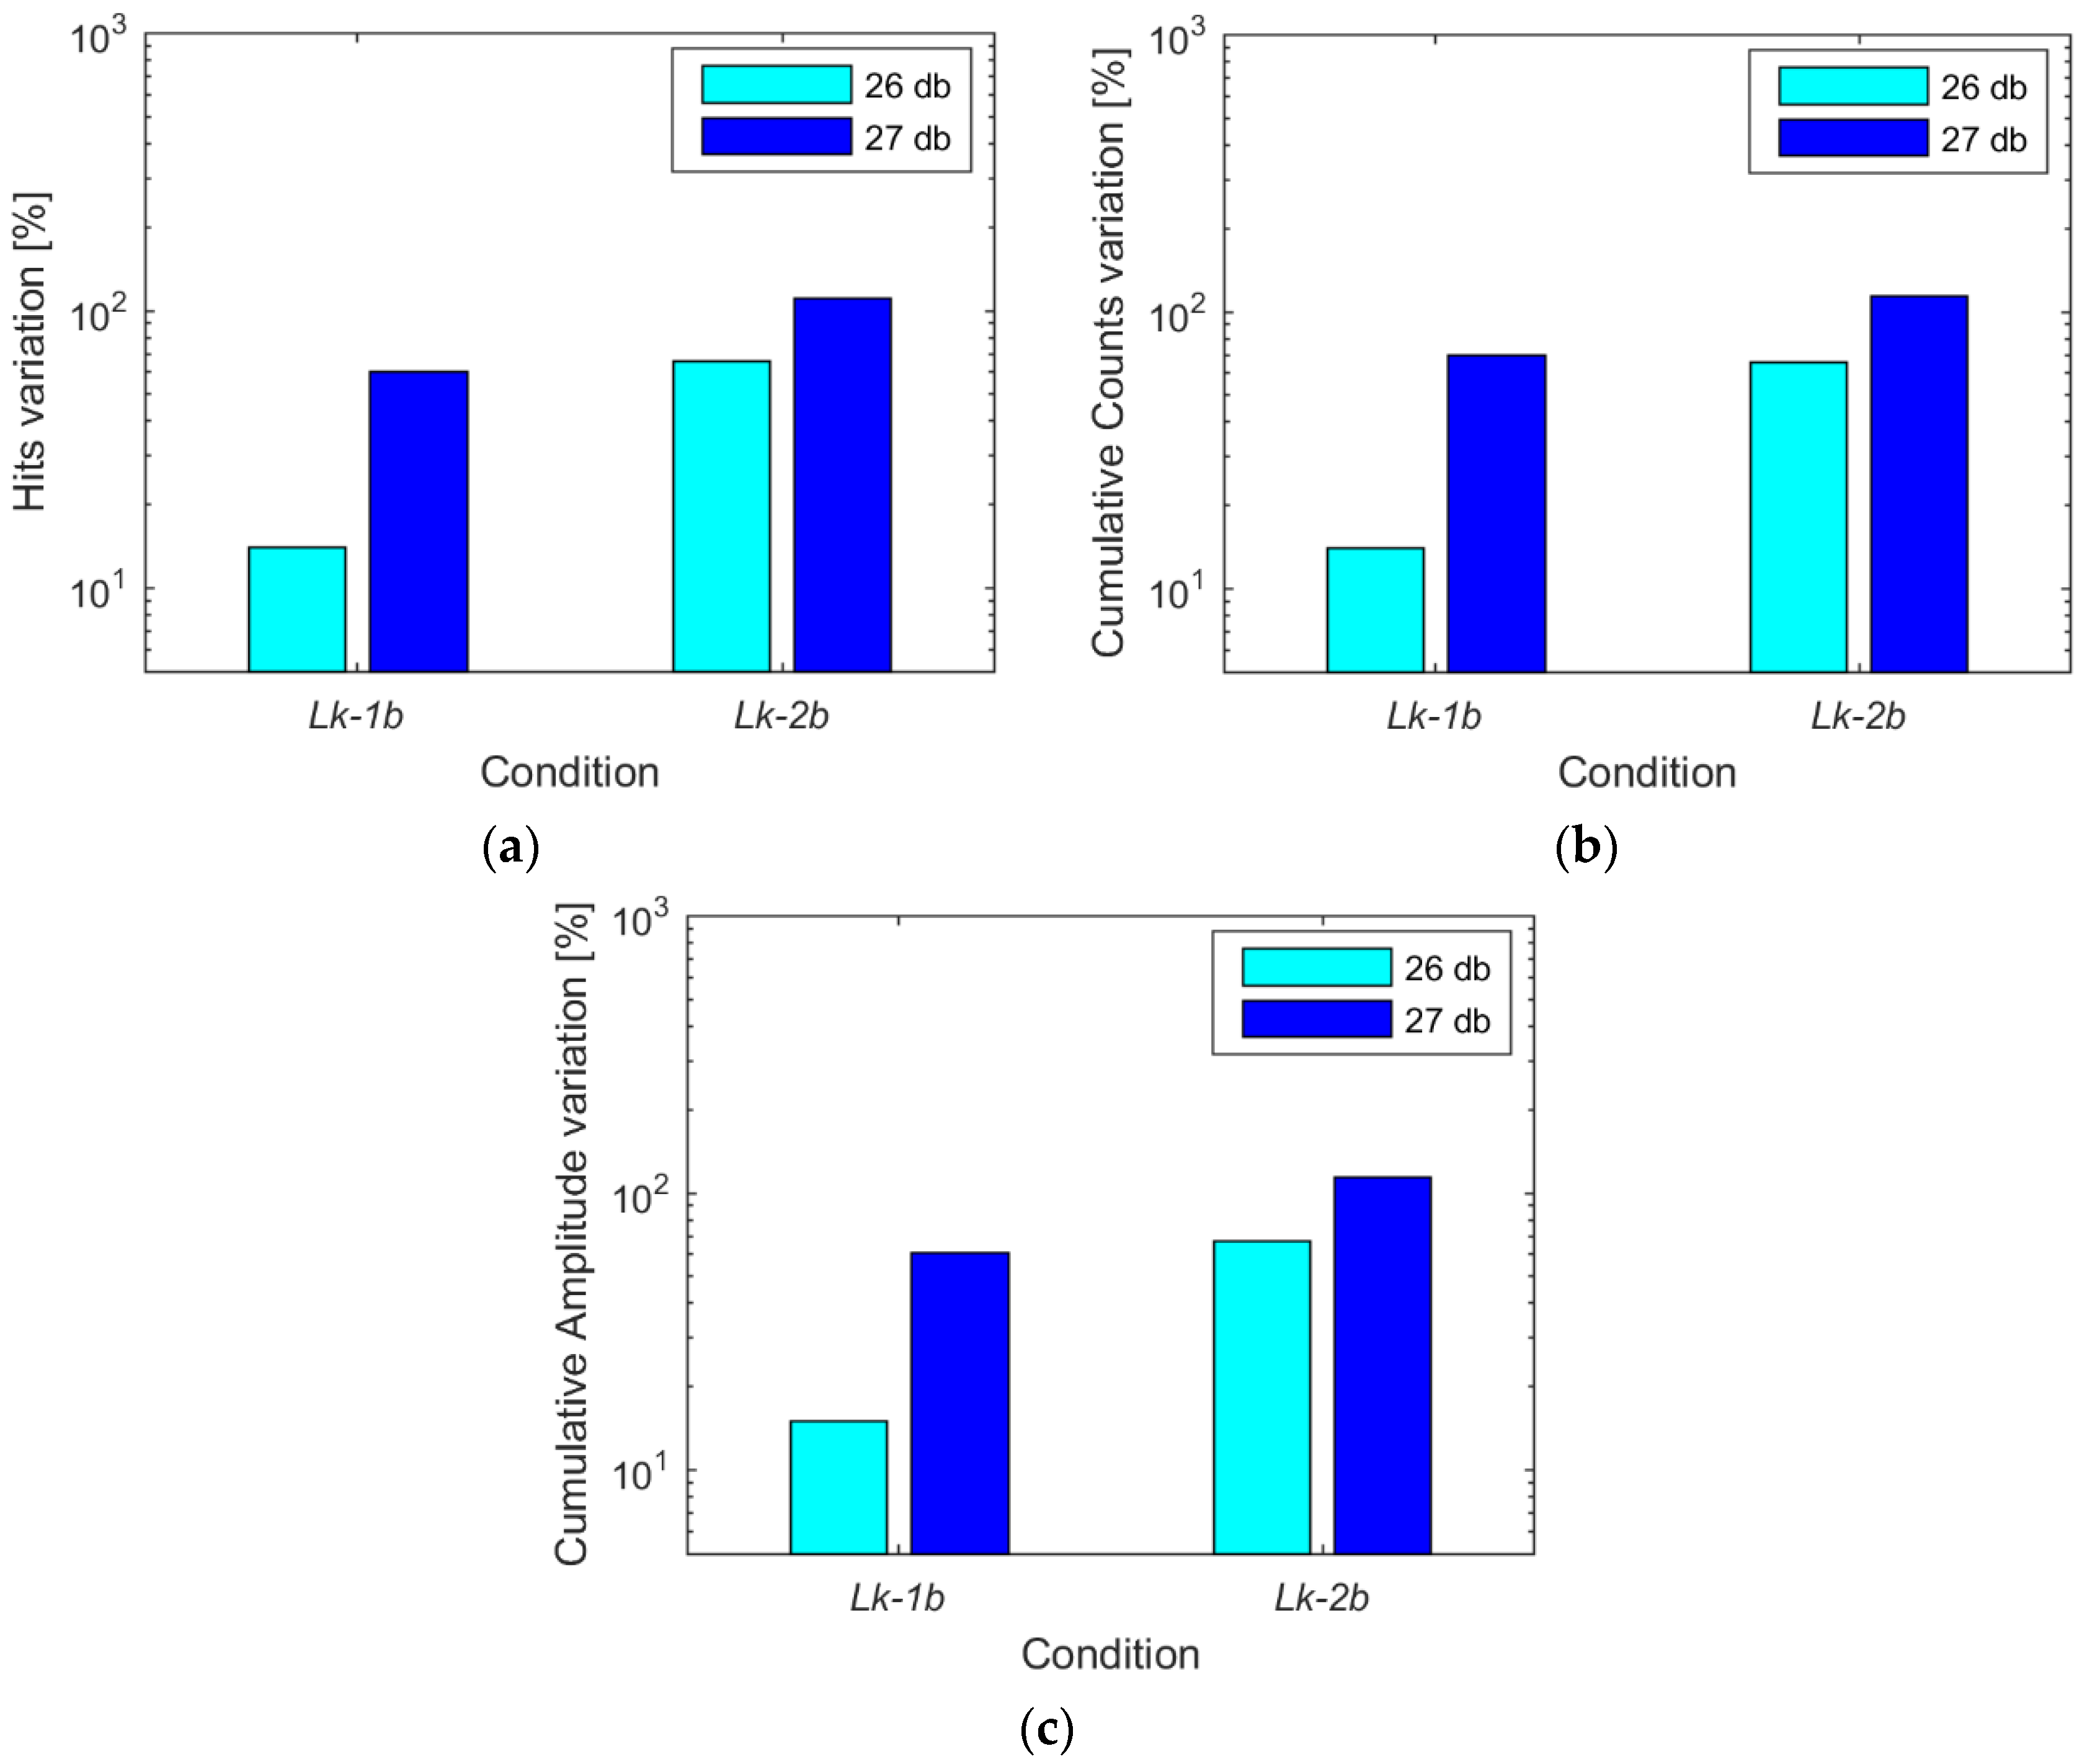
  • trend of three AE parameters, namely Hits, Cumulative Counts, and Cumulative Amplitude;
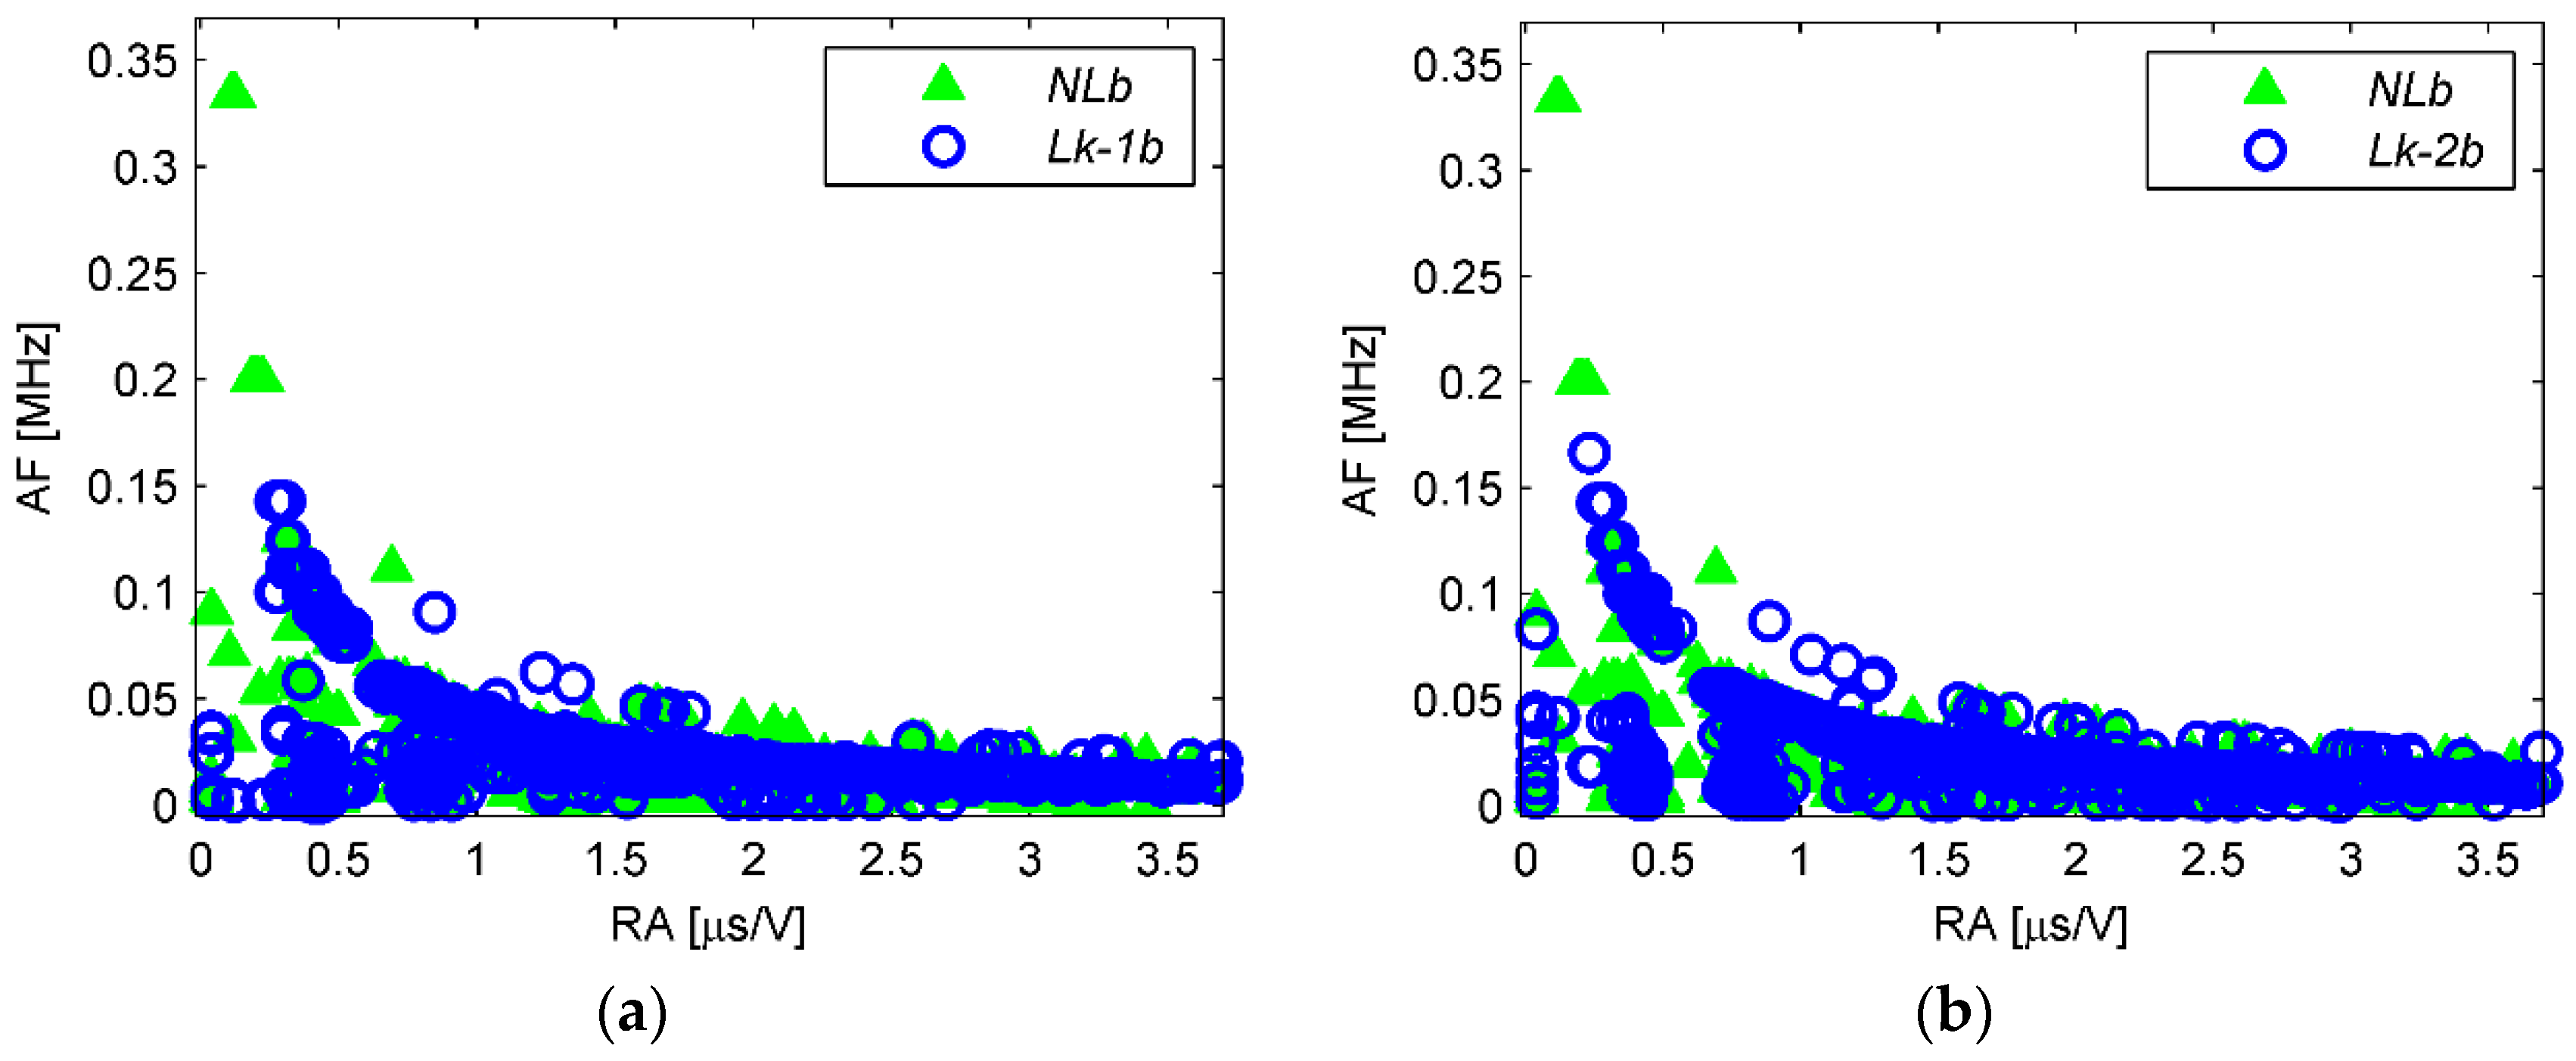
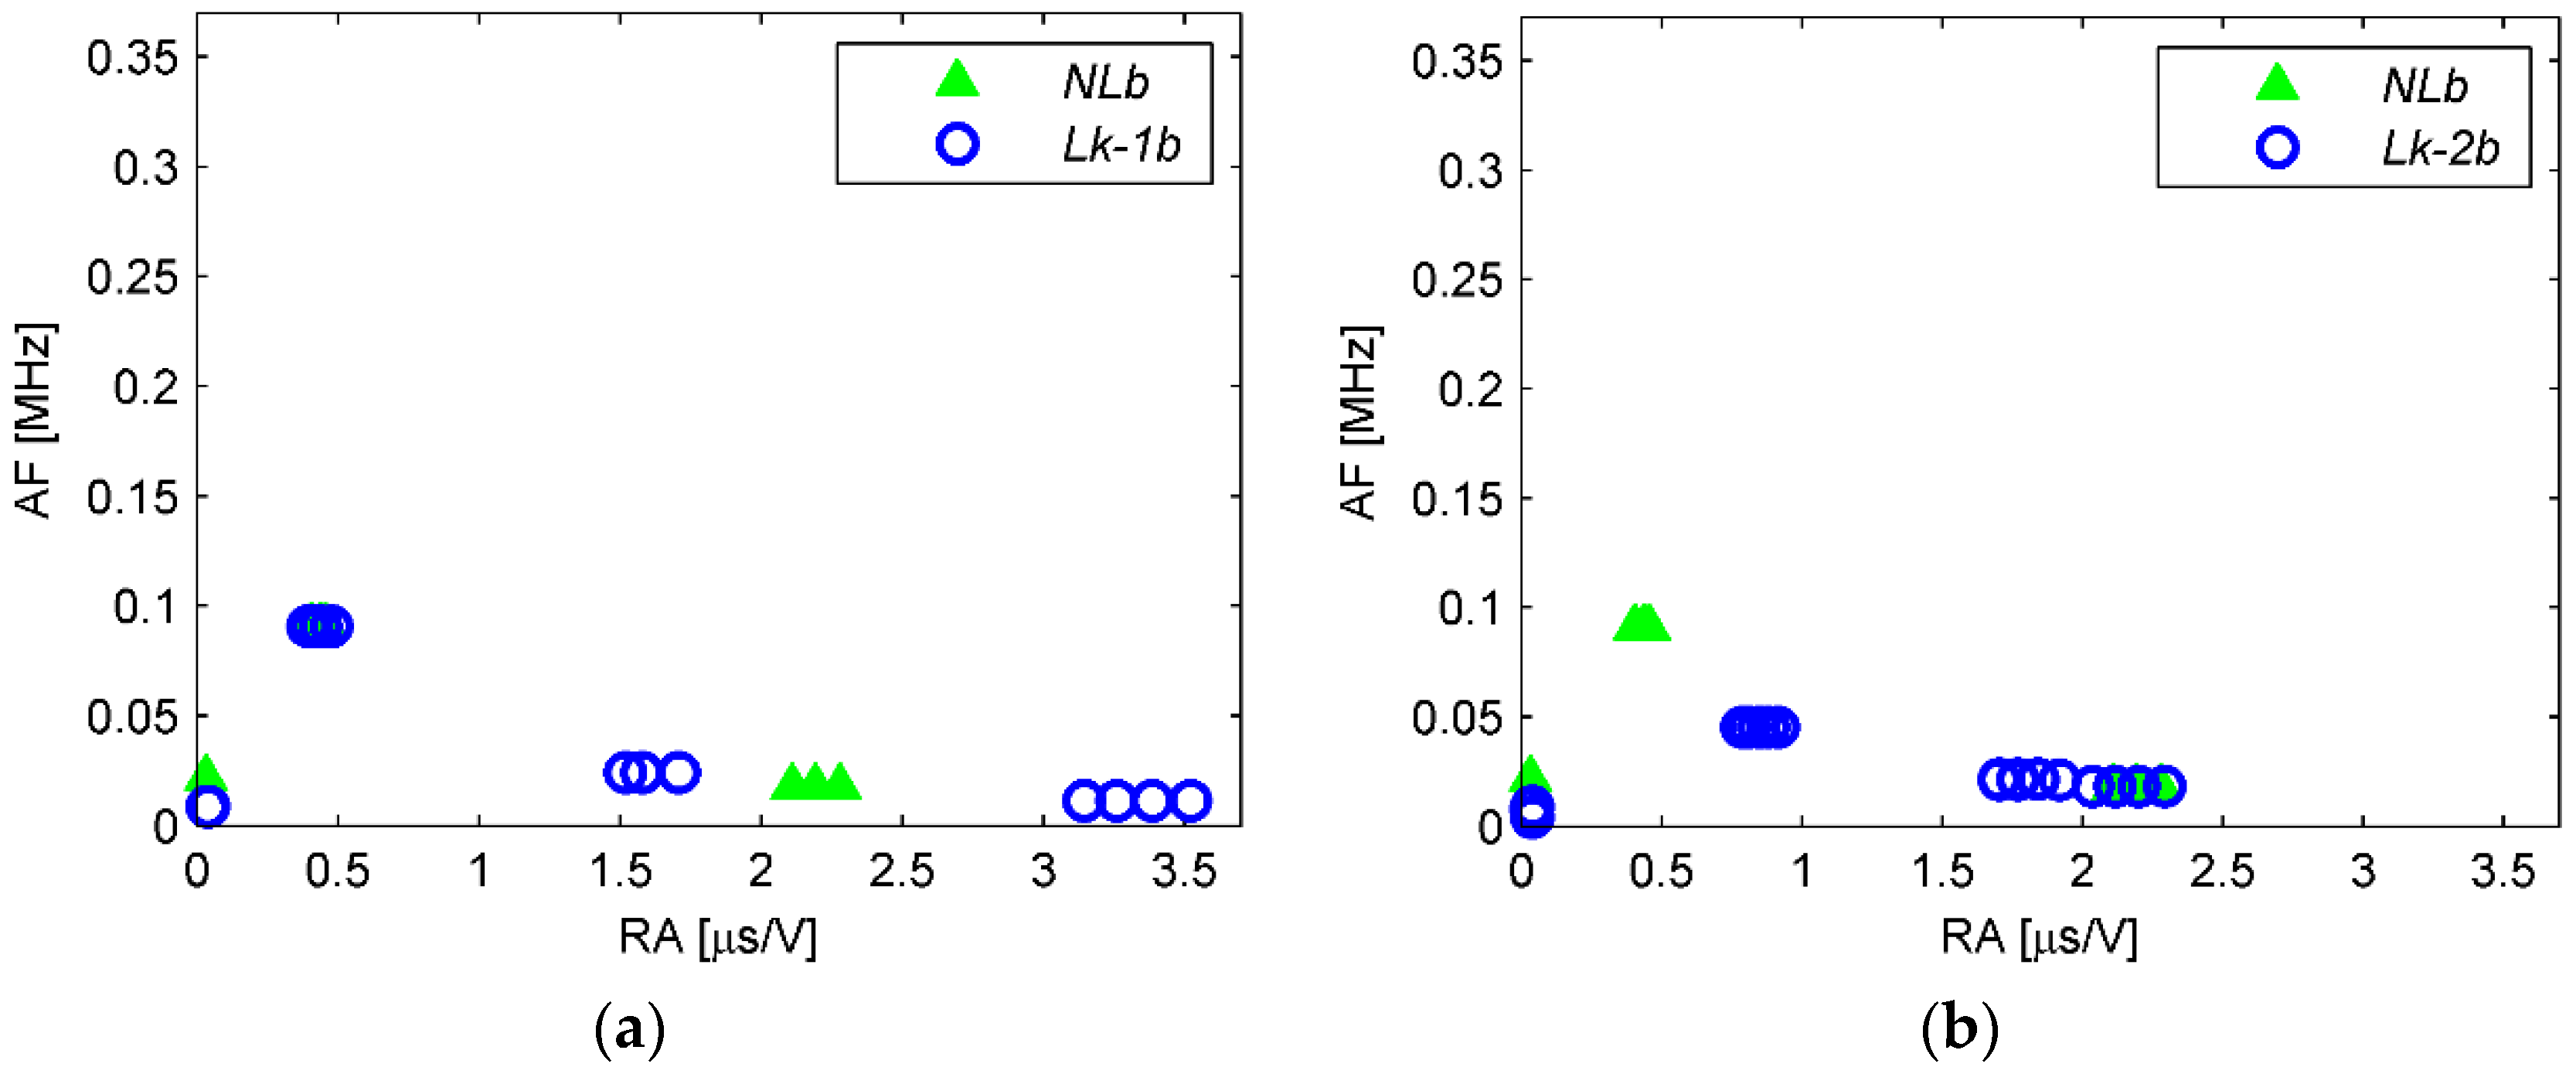
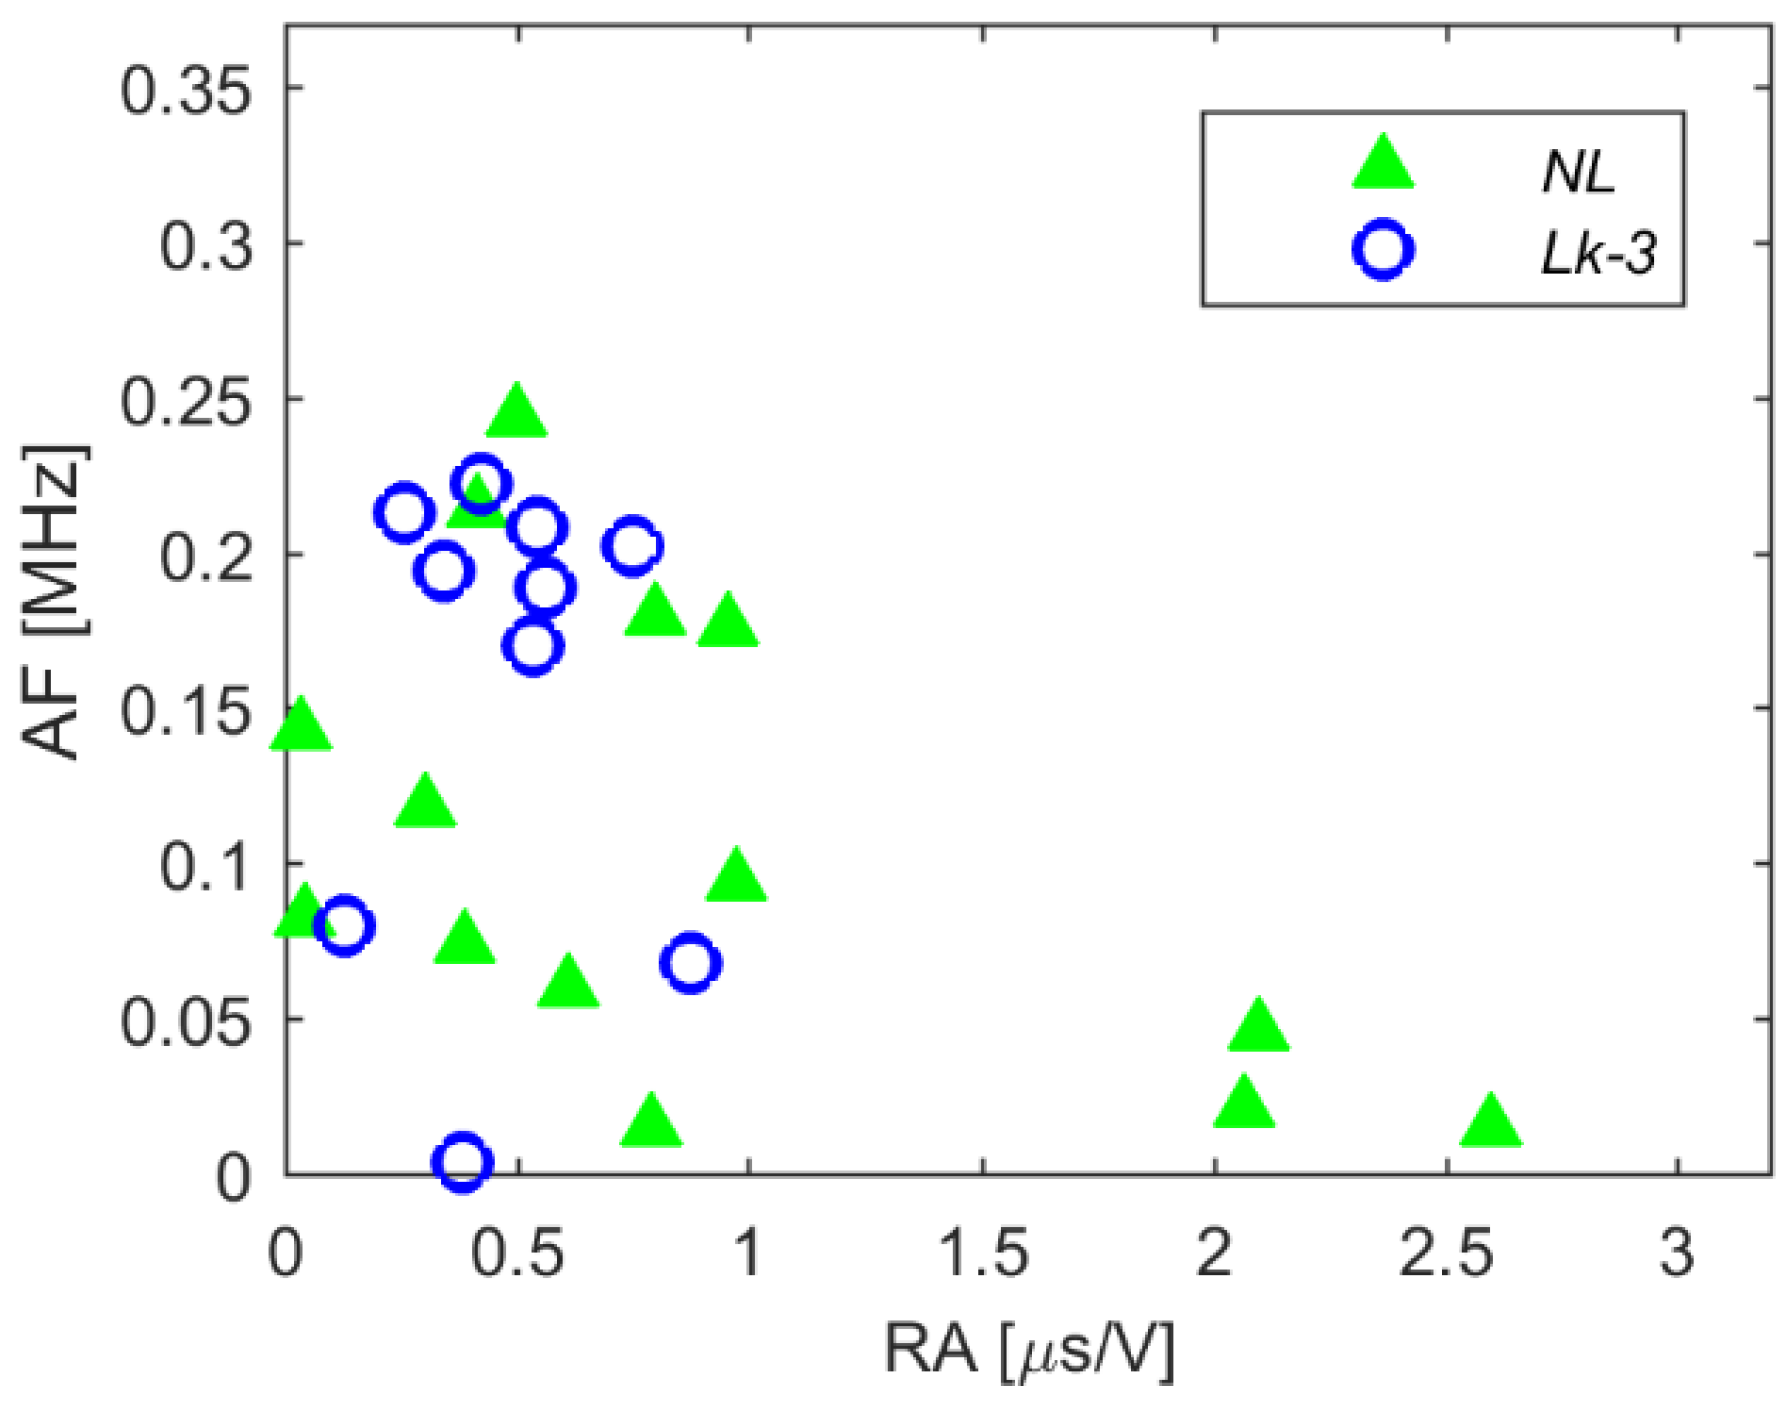
  • distribution of AE events in an AF versus RA value diagram.

3.2. Results and Discussion

The acquisitions related to the test conditions Lk-3b, Lk-4b, and Lk-5b did not show any significant difference with respect to those concerning the non-leaking state, thus leak detection was not achievable for the most distant leaks. Consequently, data concerning such leaks are not reported and not considered hereafter.
Figure 9 shows the values of two AE parameters, namely Hits and Cumulative Amplitude, measured for the non-leaking state and for the leaking conditions Lk-1b and Lk-2b, with both threshold settings. Most of the AE events detected in all the tests were characterized by signal levels notably lower than those measured in the previous unburied pipe tests. Many recorded waveforms exhibited notable distortion due to quantization. This behavior is reasonably ascribable to a higher signal attenuation caused by the surrounding medium, since the presence of soil is the only variation in the tested boundary conditions. The measurements show an acceptable repeatability, with the standard deviation being lower than 10% of the mean value for the conditions Lk-1b and Lk-2b, and about 20% for the non-leaking state.
The acquisitions with a threshold at 26 db include numerous AE events that are ascribable to external perturbations unrelated to the leaks, since they are detected even in the non-leaking state. Conversely, the higher threshold can filter out most of these spurious AE. Leak detection is still possible with both thresholds, as shown by the percentage variation of the AE parameters (Figure 10). The trend of all parameters, indeed, shows a clear increment related to the presence of active leaks. Differing from the results of unburied pipe tests, none of the parameters revealed a superior sensitivity to the leaks. The increment in the parameter trends is more evident for the threshold of 27 db, which therefore appears more suitable for leak detection purposes.
Unlike previous tests on the unburied pipe, the trends of the AE parameters do not exhibit a close correlation with the leak distance, as the percentage variation of all parameters is greater for condition Lk-2b. This unexpected behavior may be associated with the actual flow rate characterizing this condition, which is about 50% higher than for condition Lk-1b.
The experiments confirmed that leak detection can be achieved within a range of about 8 m by means of AE monitoring. However, the detection performance does not appear completely satisfactory, in particular, for the nearest leak. Improving the method reliability (i.e., incrementing the percentage variation of AE parameters related to leaks) would be required for practical applications, in order to limit as much as possible the rate of false positive detections.
The distribution of the AE events in the AF vs RA diagram for the leaking conditions Lk-1b and Lk-2b, with both threshold settings, is reported in Figure 11 and Figure 12, respectively. Data related to the non-leaking state are also plotted. The effects of signal quantization are evident for all conditions, since several points have one or both coordinates that are identically repeated. The comparisons do not reveal any specific correlation between the pattern of the AE events and the presence of active leaks. Indeed the patterns of AE events in both leaking and non-leaking conditions basically overlap for all conditions. Hence the effectiveness of this kind of analysis, that was apparently proven for the unburied pipe tests, was not confirmed for the buried condition.
Since the test bed replicates the main features of buried service pipes of the network, the results provided by the buried pipe experiments are considered applicable to actual pipelines.
The above results prove that the detection capabilities are potentially sufficient to cover the range of interest, which is about 10 m for the service pipes in the water supply network managed by the local utility. However, leak detection with an acceptable level of confidence cannot be achieved for the nearest leak, which is at only 3 m from the sensor. In addition, an adequate enhancement of the detection performance seems to represent an extreme challenge to achieve in practice, due to the high signal attenuation caused by both the pipe material and the surrounding medium, as shown by the experiments. Hence, the monitoring of AE signals (in the tested frequency band) hardly proves to be an optimal tool for detecting leaks occurring in the system of interest, namely small-diameter polyethylene service pipes buried under soil, in spite of great expectations associated with medium-large size pipelines [16,17,18,19].

4. Conclusions

This study investigated leak detection in water-filled small-diameter plastic pipes with AE methods. Experiments were carried out in a test bed that simulated the water leaks typically occurring in service pipes of the water supply network. In particular, the possibility of detecting leaks without altering the typical operational conditions of the network was assessed.
The tests provided moderately satisfactory results. The AE technique showed an acceptable sensitivity to the presence of active leaks in the unburied pipe. The trend of at least one AE parameter, namely the Cumulative Counts parameter, exhibited a direct correlation with both the leak distance and the leaking flow rate.
Tests performed on the buried pipe confirmed the possibility of detecting leaks within a range of 8 m, which is basically sufficient for the application of interest. However, leak detection could not be achieved with a satisfactory reliability. In particular, the experiments showed that the pipe material and the presence of soil as surrounding medium caused a significant attenuation of the AE signal, which hampered the detection even for leaks that were rather close to the sensor location. It is worth noting that the investigation of more advanced signal processing methods (e.g., analysis of the AE waveforms in the frequency domain or even pattern recognition techniques) may be worthy of interest to possibly enhance the results. However, advanced techniques would be more computationally demanding. This would result in higher costs of the hardware components, thus being potentially incompatible with the requirements of the desired leak detection system.
Based on the results provided by the experimental campaign, the authors suggest that monitoring of AE with basic signal processing techniques in the tested frequency range does not appear to be a suitable tool to detect the target leaking flow in buried polyethylene service pipes with small diameter.

Author Contributions

Alberto Martini and Marco Troncossi conceived, designed, and performed the experiments; Alberto Martini analyzed the data and wrote the paper; Marco Troncossi and Alessandro Rivola supervised the research and revised the manuscript.

Conflicts of Interest

The authors declare no conflict of interest.

References

  1. United States Environmental Protection Agency. Control and Mitigation of Drinking Water Losses in Distribution Systems; EPA 816-R-10-019 Report; United States Environmental Protection Agency: Washington, DC, USA, 2010.
  2. BDEW—German Association of Energy and Water Industries. VEWA Survey: Comparison of European Water and Waste Water Prices. 2010. Available online: www.bdew.de (accessed on 23 November 2016).
  3. Mutikanga, H.E.; Sharma, S.K.; Vairavamoorthy, K. Methods and tools for managing losses in water distribution systems. J. Water Resour. Plan. Manag. 2012, 139, 166–174. [Google Scholar] [CrossRef]
  4. Hunaidi, O.; Chu, W.; Wang, A.; Guan, W. Detecting leaks in plastic pipes. J. Am. Water Works Assoc. 2000, 92, 82–94. [Google Scholar]
  5. Gao, Y.; Brennan, M.J.; Joseph, P.F.; Muggleton, J.M.; Hunaidi, O. On the selection of acoustic/vibration sensors for leak detection in plastic water pipes. J. Sound Vib. 2005, 283, 927–941. [Google Scholar] [CrossRef]
  6. Metje, N.; Atkins, P.R.; Brennan, M.J.; Chapman, D.N.; Lim, H.M.; Machell, J.; Muggleton, J.M.; Pennock, S.; Ratcliffe, J.; Redfern, M.; et al. Mapping the Underworld—State-of-the-art review. Tunn. Undergr. Space Technol. 2007, 22, 568–586. [Google Scholar] [CrossRef]
  7. Fahmy, M.; Moselhi, O. Detecting and locating leaks in Underground Water Mains Using Thermography. In Proceedings of the 26th International Symposium on Automation and Robotics in Construction (ISARC 2009), Austin, TX, USA, 24–27 June 2009.
  8. Bimpas, M.; Amditis, A.; Uzunoglu, N. Detection of water leaks in supply pipes using continuous wave sensor operating at 2.45 GHz. J. Appl. Geophys. 2010, 70, 226–236. [Google Scholar] [CrossRef]
  9. Ghazali, M.F.; Beck, S.B.M.; Shucksmith, J.D.; Boxall, J.B.; Staszewski, W.J. Comparative study of instantaneous frequency based methods for leak detection in pipeline networks. Mech. Syst. Signal Proc. 2012, 29, 187–200. [Google Scholar] [CrossRef]
  10. Cataldo, A.; Persico, R.; Leucci, G.; De Benedetto, E.; Cannazza, G.; Matera, L.; De Giorgi, L. Time domain reflectometry, ground penetrating radar and electrical resistivity tomography: A comparative analysis of alternative approaches for leak detection in underground pipes. NDT&E Int. 2014, 62, 14–28. [Google Scholar]
  11. Martini, A.; Troncossi, M.; Rivola, A.; Nascetti, D. Preliminary investigations on automatic detection of leaks in water distribution networks by means of vibration monitoring. In Advances in Condition Monitoring of Machinery in Non-Stationary Operations (Lecture Notes in Mechanical Engineering); Springer: Heidelberg, Germany, 2014; Volume 5, pp. 535–544. [Google Scholar]
  12. Martini, A.; Troncossi, M.; Rivola, A. Automatic Leak Detection in Buried Plastic Pipes of Water Supply Networks by Means of Vibration Measurements. Shock Vib. 2015, 2015. [Google Scholar] [CrossRef]
  13. Yazdekhasti, S.; Piratla, K.R.; Atamturktur, S.; Khan, A. Novel vibration-based technique for detection of water pipeline leakage. Struct. Infrastruct. Eng. 2016, in press. [Google Scholar] [CrossRef]
  14. Miller, R.K.; Pollock, A.A.; Watts, D.J.; Carlyle, J.M.; Tafuri, A.N.; Yezzi, J.J., Jr. A reference standard for the development of acoustic emission pipeline leak detection techniques. NDT&E Int. 1999, 32, 1–8. [Google Scholar]
  15. ASTM E1316-16a. Standard Terminology for Nondestructive Examinations; ASTM International: West Conshohocken, PA, USA, 2016. [Google Scholar]
  16. Vahaviolos, S.J.; Miller, R.K.; Watts, D.J.; Shemyakin, V.V.; Strizkov, S.A. Detection and Location of Cracks and Leaks in Buried Pipelines Using Acoustic Emission. J. Acoust. Emiss. 2001, 19, 172–183. [Google Scholar]
  17. Suzuki, T.; Ikeda, Y.; Tomoda, Y.; Ohtsu, M. Water-Leak Evaluation of Existing Pipeline by Acoustic Emission. J. Acoust. Emiss. 2005, 23, 272–276. [Google Scholar]
  18. Anastasopoulos, A.; Kourousis, D.; Bollas, K. Acoustic Emission leak detection of liquid filled buried pipeline. J. Acoust. Emiss. 2009, 27, 27–39. [Google Scholar]
  19. Ahadi, M.; Bakhtiar, M.S. Leak detection in water-filled plastic pipes through the application of tuned wavelet transforms to Acoustic Emission signals. Appl. Acoust. 2010, 71, 634–639. [Google Scholar] [CrossRef]
  20. Brunner, A.J.; Barbezat, M. Acoustic Emission Monitoring of Leaks in Pipes for Transport of Liquid and Gaseous Media: A Model Experiment. Adv. Mater. Res. 2006, 13–14, 351–356. [Google Scholar] [CrossRef]
  21. Leoni, G.; Anzalone, C.; Giunchi, D.; Nascetti, D. Method for Detecting the Presence of Leaks in a Water Distribution Network and Kit for Applying the Method. Patent EP2107357A1, 7 October 2009. [Google Scholar]
  22. MISTRAS Group Inc.—Products & Systems Division. USB-AE Node & AEwin for USB Software User’s Manual; MISTRAS Group Inc.: Princeton Junction, NJ, USA, 2010. [Google Scholar]
Figure 1. Schematics and characteristics of the test bed with unburied pipe. PVC, polyvinyl chloride; HDPE, high-density polyethylene; DN, outer diameter.
Applsci 07 00002 g001
Figure 2. Artificially induced leak: (a) active leak; (b) leak deactivated using the repair clamp.
Applsci 07 00002 g002
Figure 3. Acoustic Emission (AE) sensor close up.
Applsci 07 00002 g003
Figure 4. AE parameters: (a) total Hits; (b) Cumulative Counts; (c) Cumulative Amplitude. NL, no leak; Lk-1, first leak (1 m); Lk-2, second leak (3 m); Lk-3, third leak (8 m); Lk-123, all leaks.
Applsci 07 00002 g004
Figure 5. Percentage variation of AE parameters: (a) total Hits; (b) Cumulative Counts; (c) Cumulative Amplitude.
Applsci 07 00002 g005
Figure 6. Diagram of AF vs. RA, comparison between conditions NL and Lk-3.
Applsci 07 00002 g006
Figure 7. Schematics of the test bed with buried pipe.
Applsci 07 00002 g007
Figure 8. New setup: (a) buried pipeline with manholes installed; (b) active leak accessed through a manhole (plastic sack with soil temporarily removed to observe the leaking flow).
Applsci 07 00002 g008
Figure 9. Buried pipe tests (both threshold levels): (a) total Hits; (b) Cumulative Amplitude. NLb, no leak; Lk-1b, first leak (3 m); Lk-2b, second leak (8 m).
Applsci 07 00002 g009
Figure 10. Percentage variation of AE parameters for buried pipe tests, with both threshold levels: (a) total Hits; (b) Cumulative Counts; (c) Cumulative Amplitude.
Applsci 07 00002 g010
Figure 11. AF vs. RA, at the 26 db threshold level, comparison between conditions NLb and: (a) Lk-1b; (b) Lk-2b.
Applsci 07 00002 g011
Figure 12. AF vs. RA, at the 27 db threshold level, comparison between conditions NLb and: (a) Lk-1b; (b) Lk-2b.
Applsci 07 00002 g012
Table 1. Main features of the induced leaks for the buried pipe tests.
Leak (Buried Pipe)Distance (m)Flow Rate (L/h)
# 1b3200
# 2b8295
# 3b13200
# 4b18180
# 5b264000

