
Automated Cart with VIS/NIR Hyperspectral Reflectance and Fluorescence Imaging Capabilities

Abstract
:1. Introduction
2. Materials and Methods
2.1. Imaging
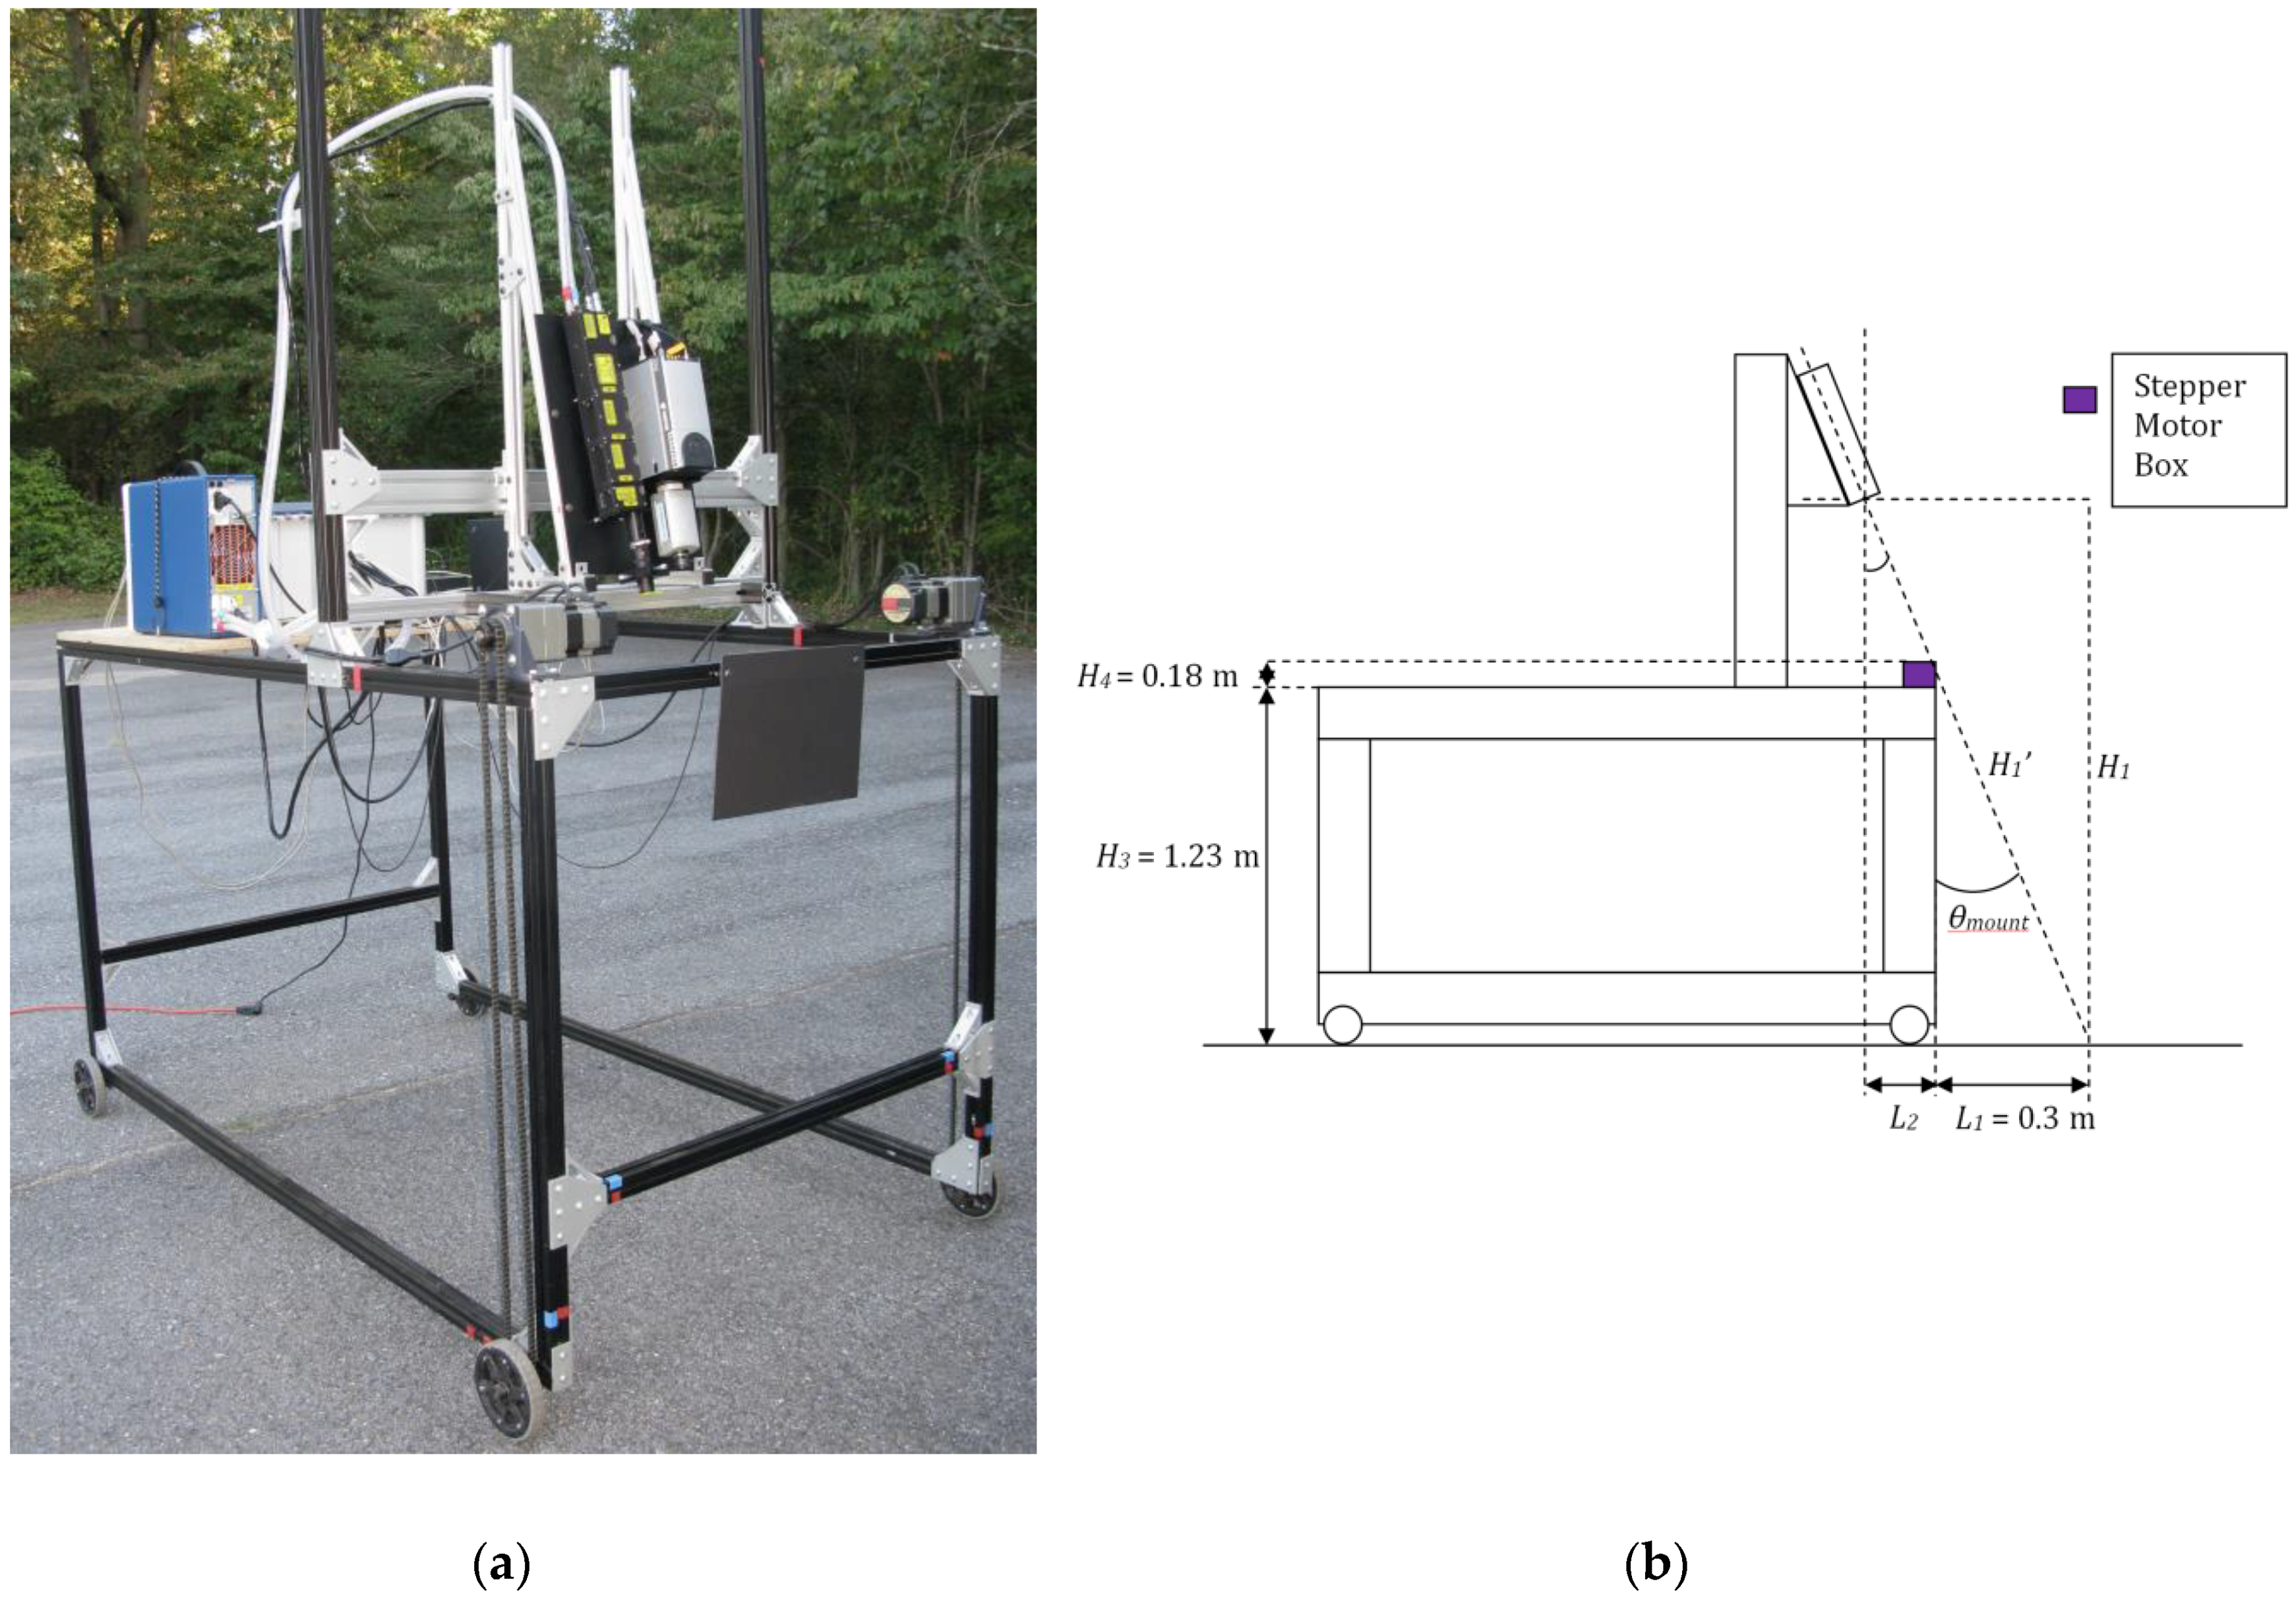
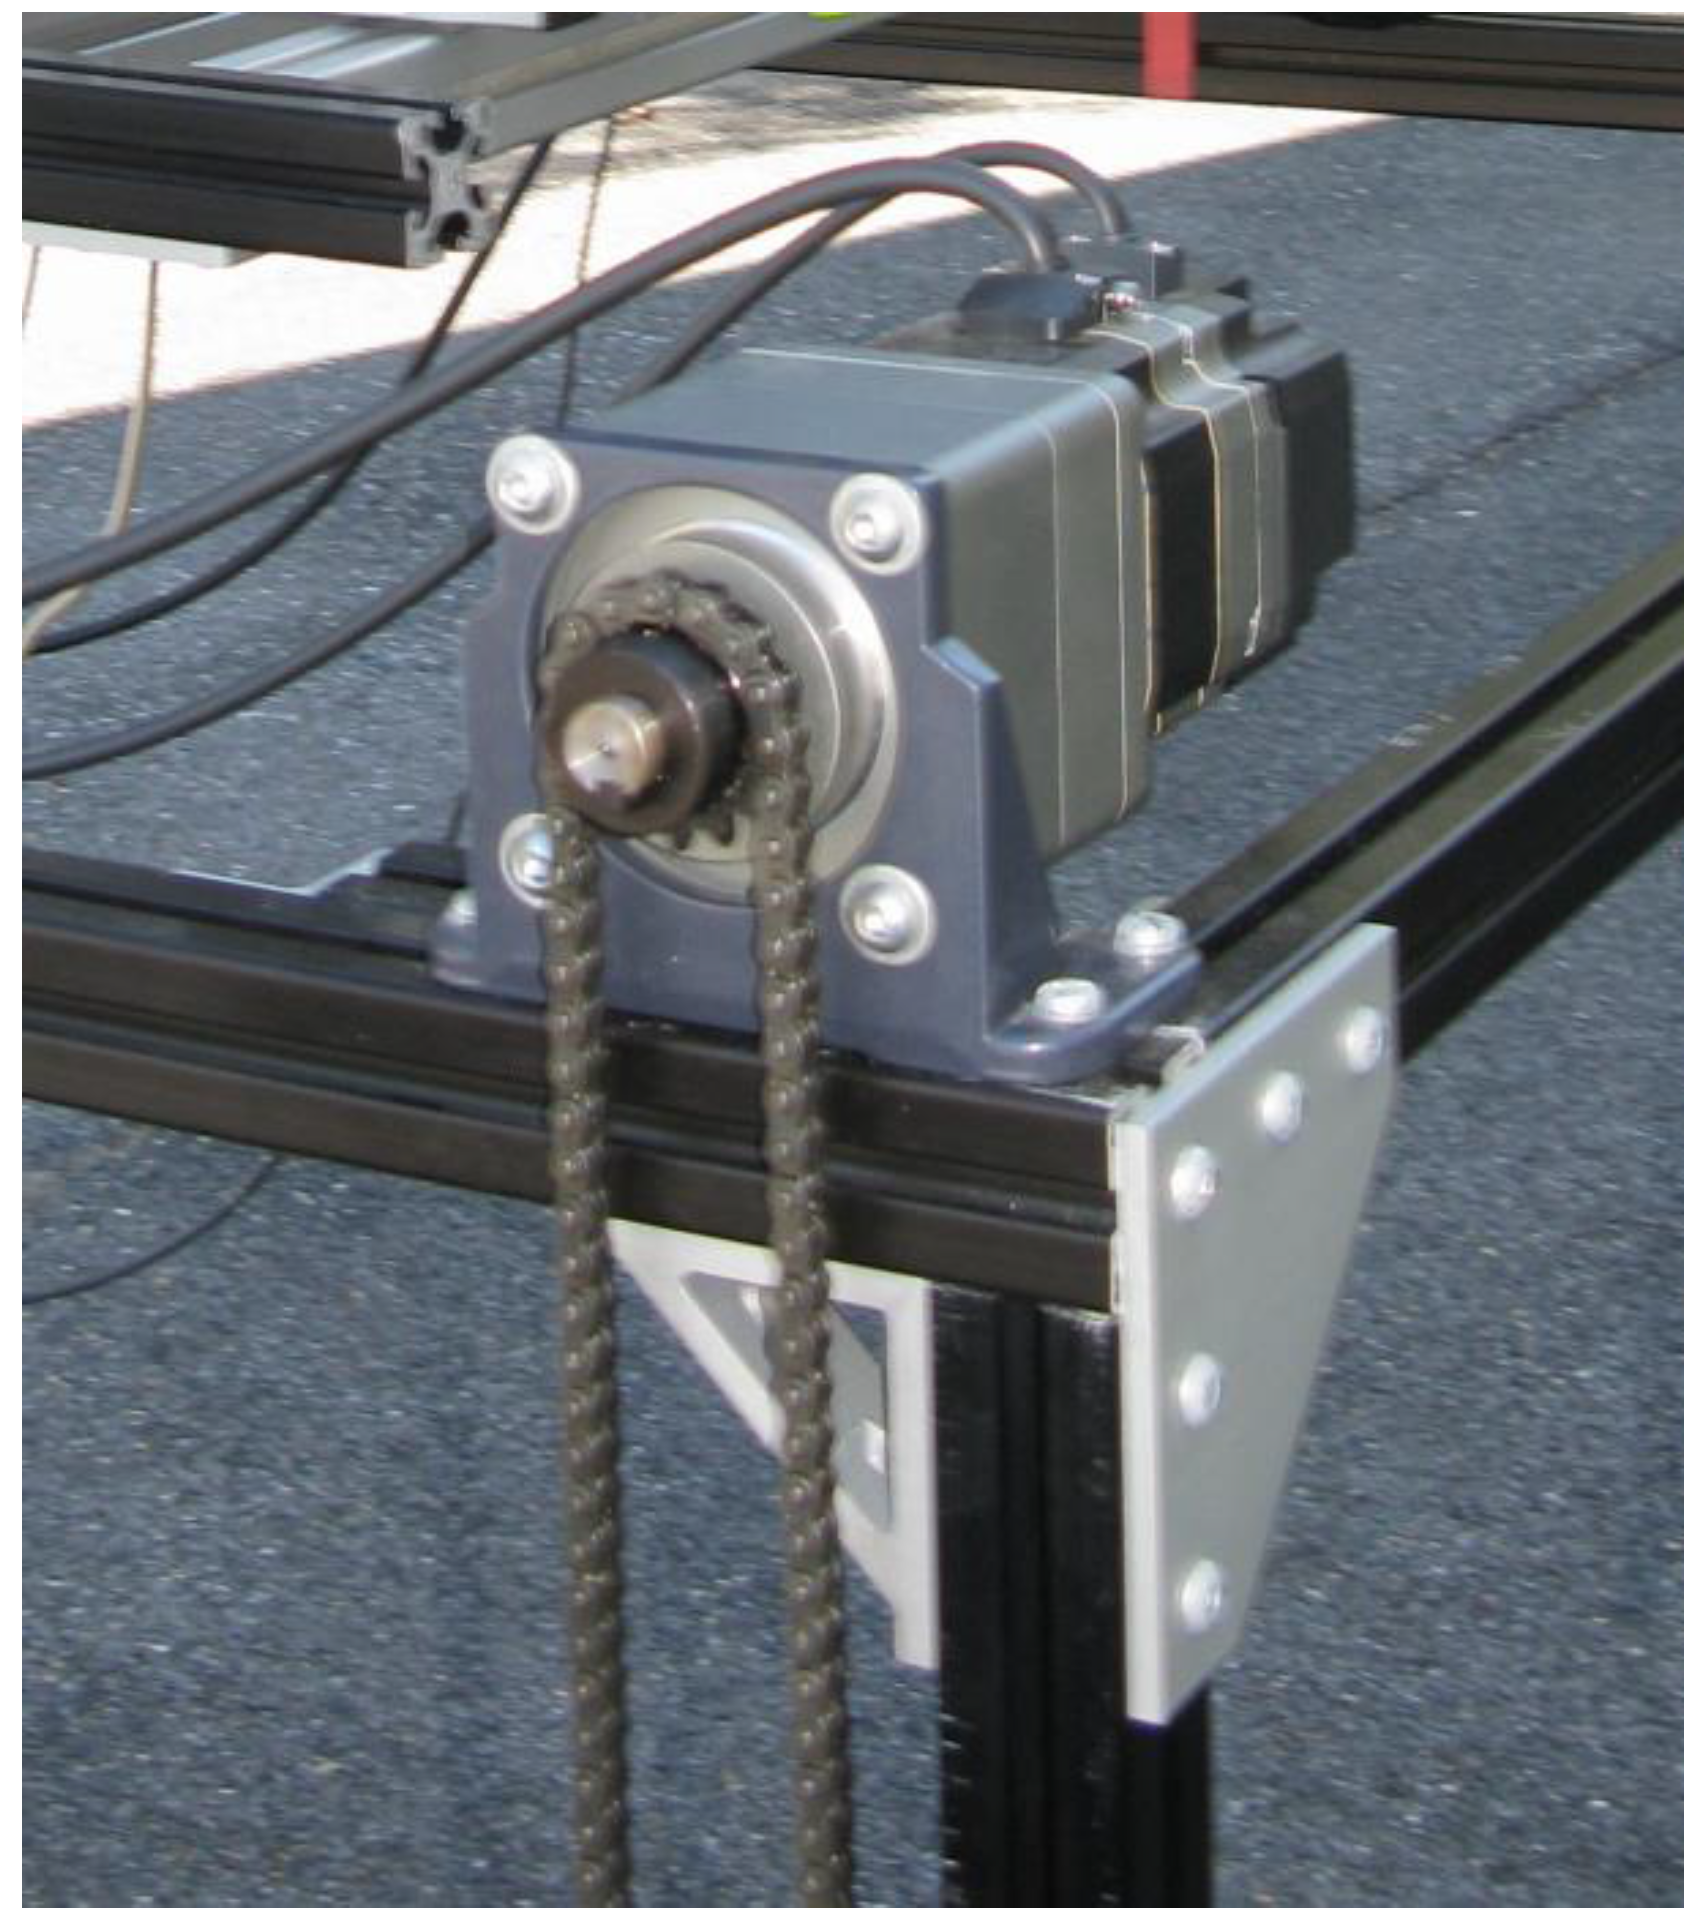
2.2. Cart
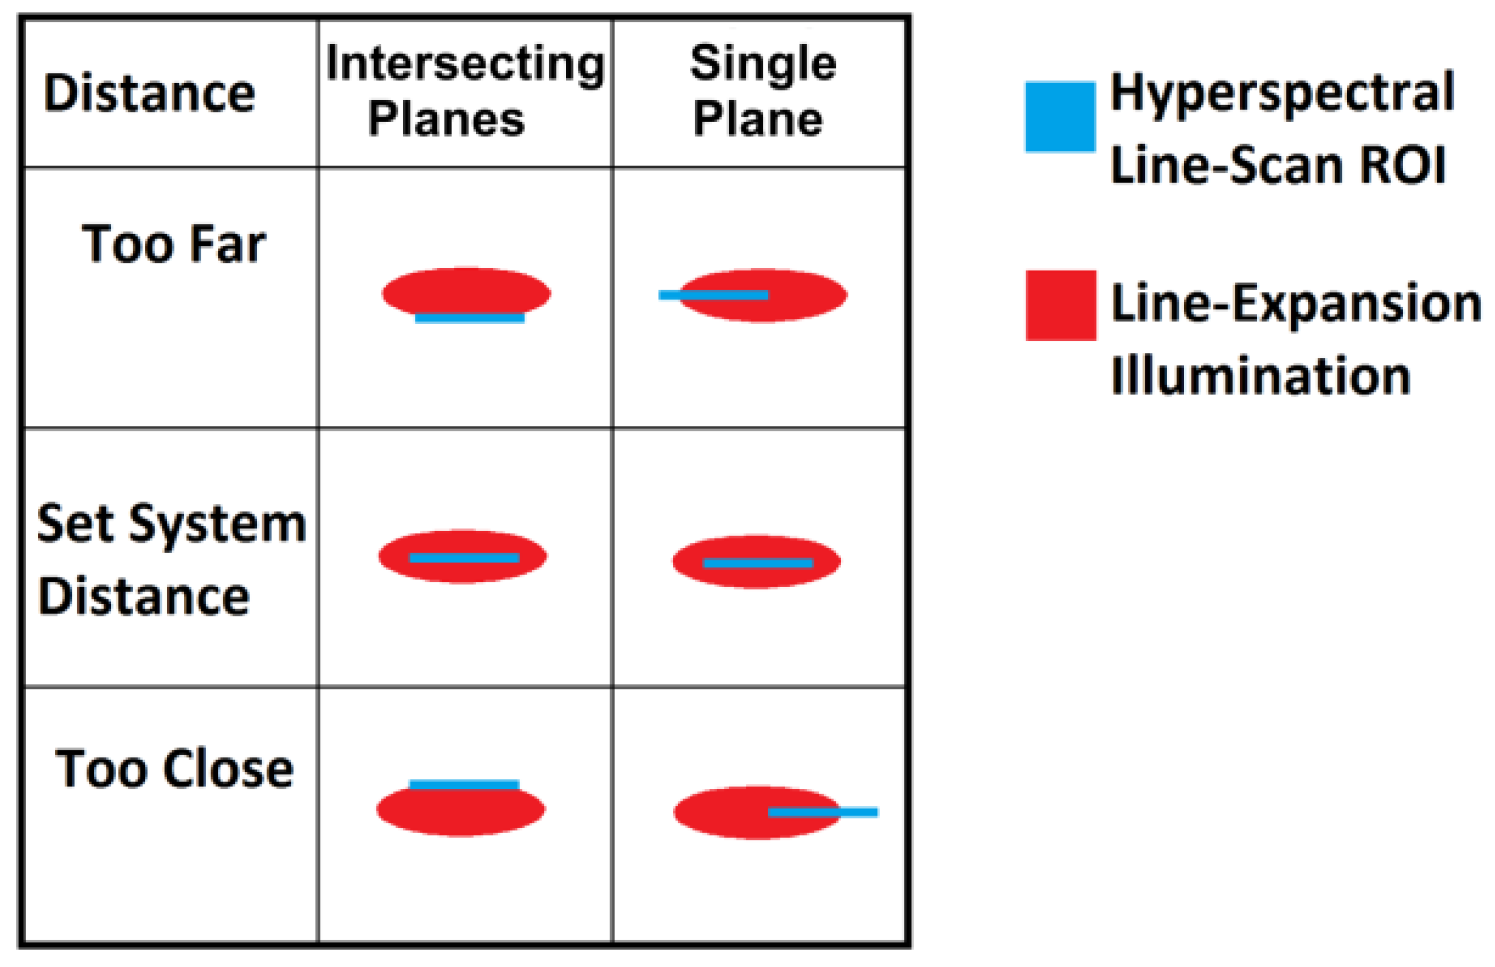
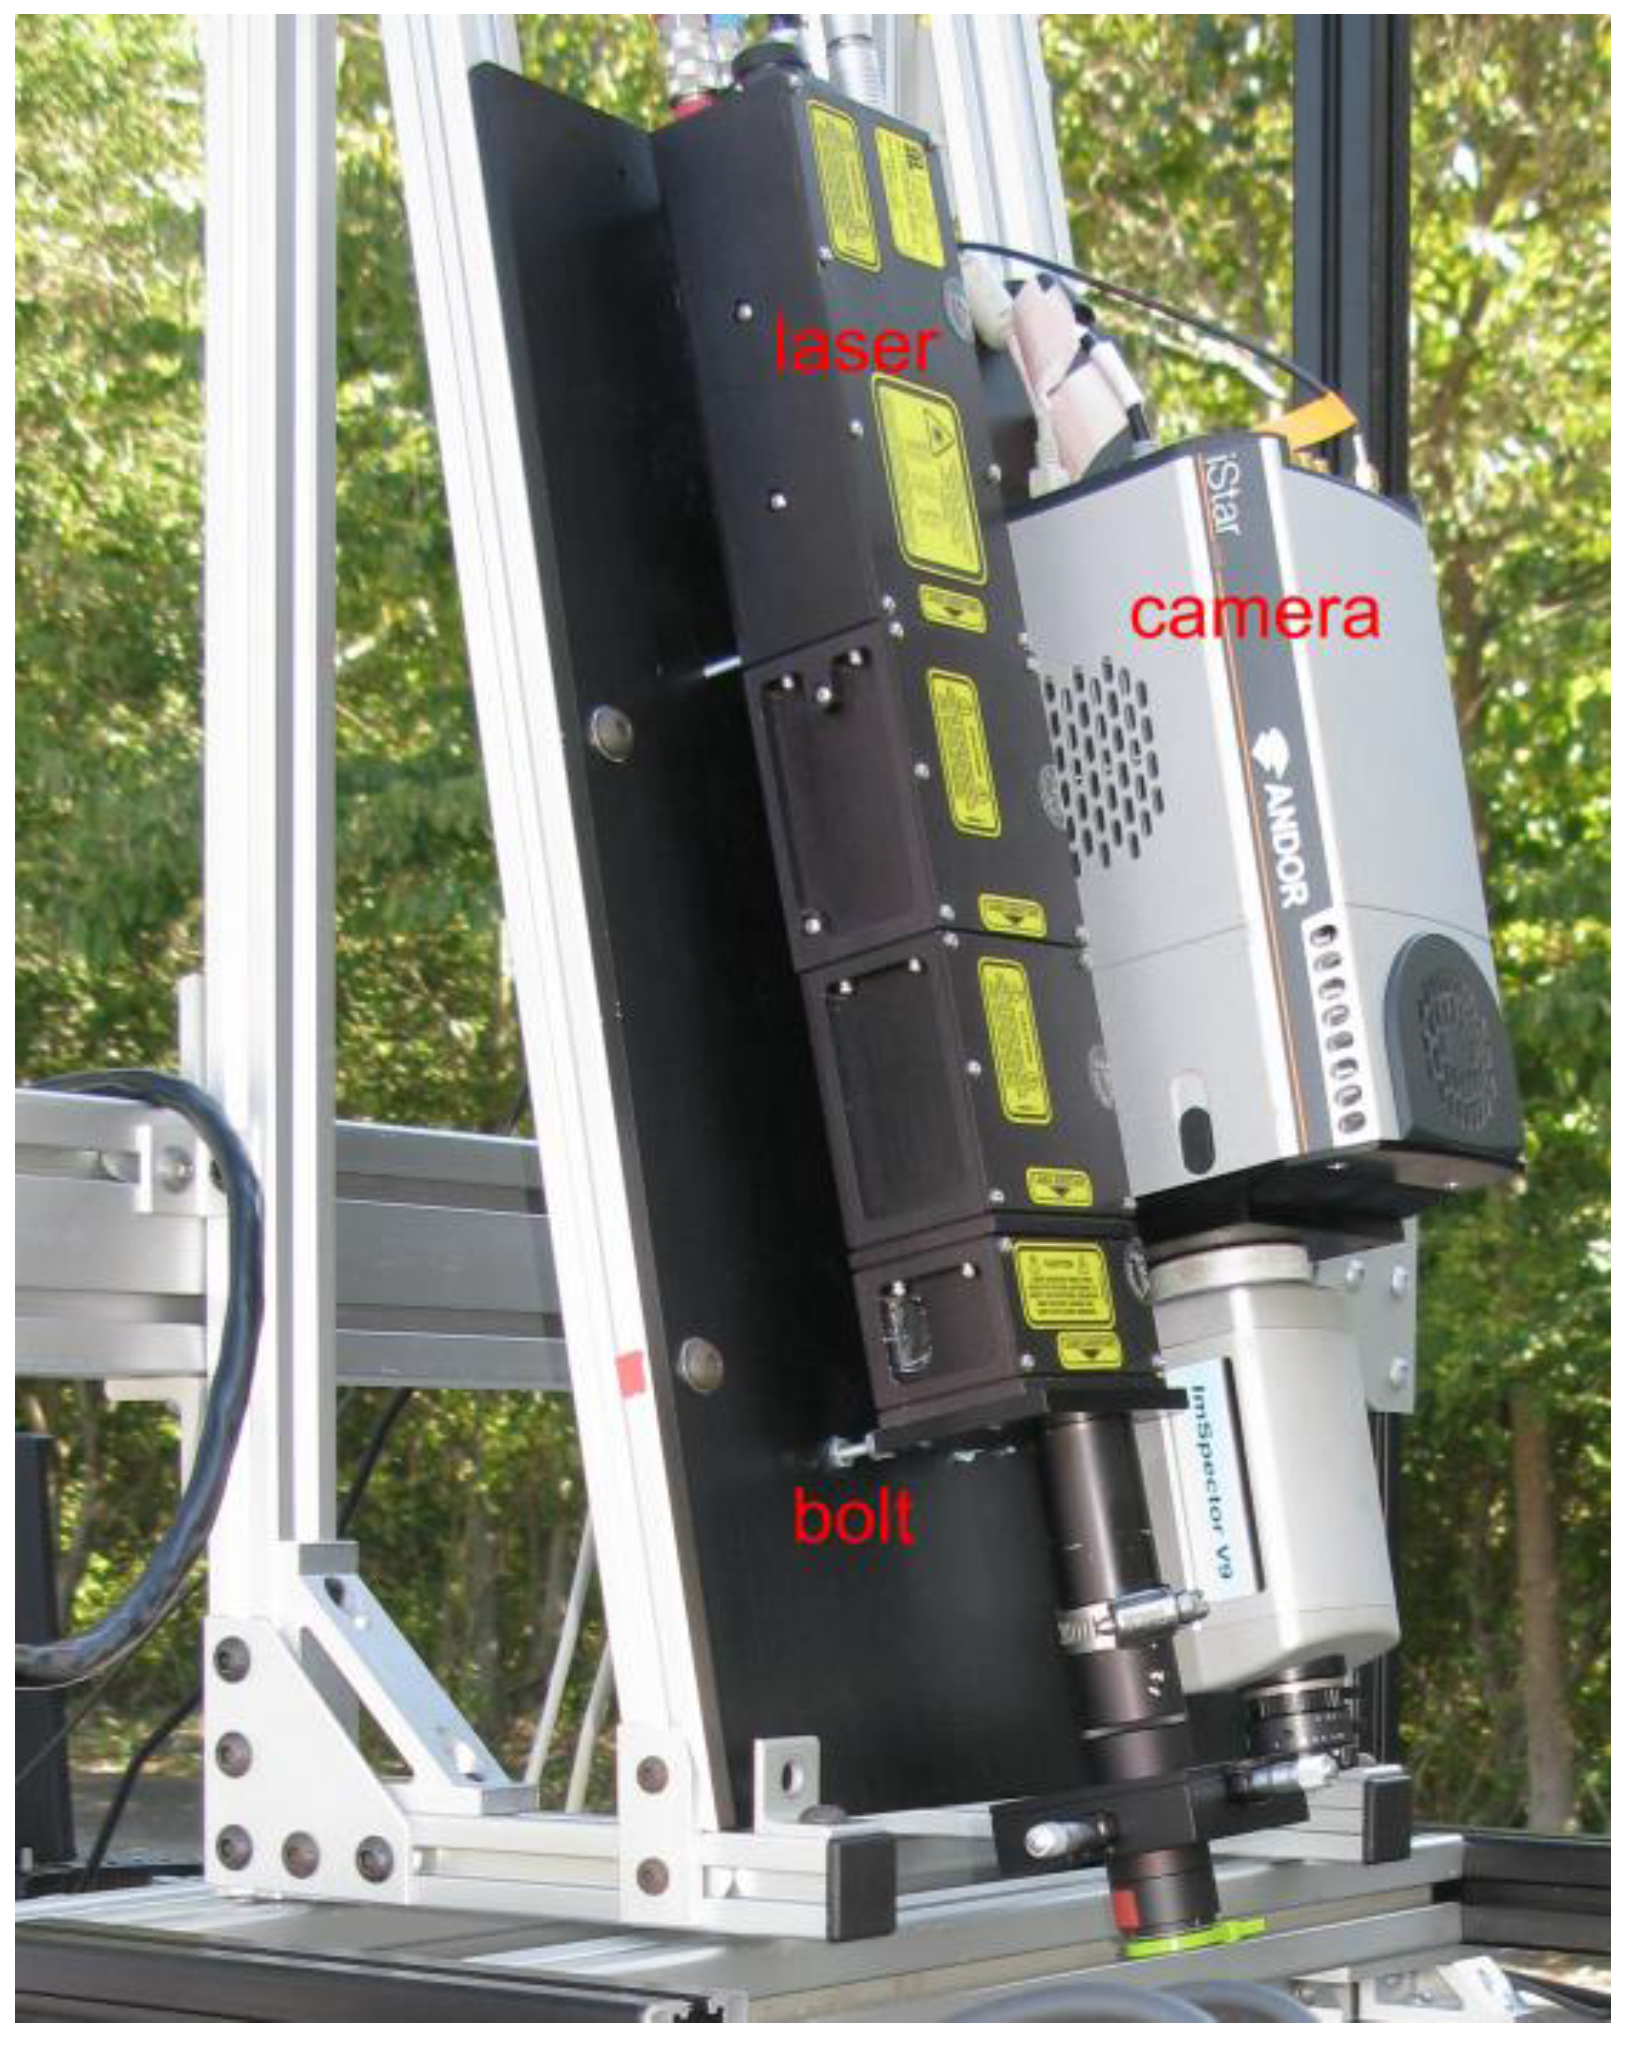
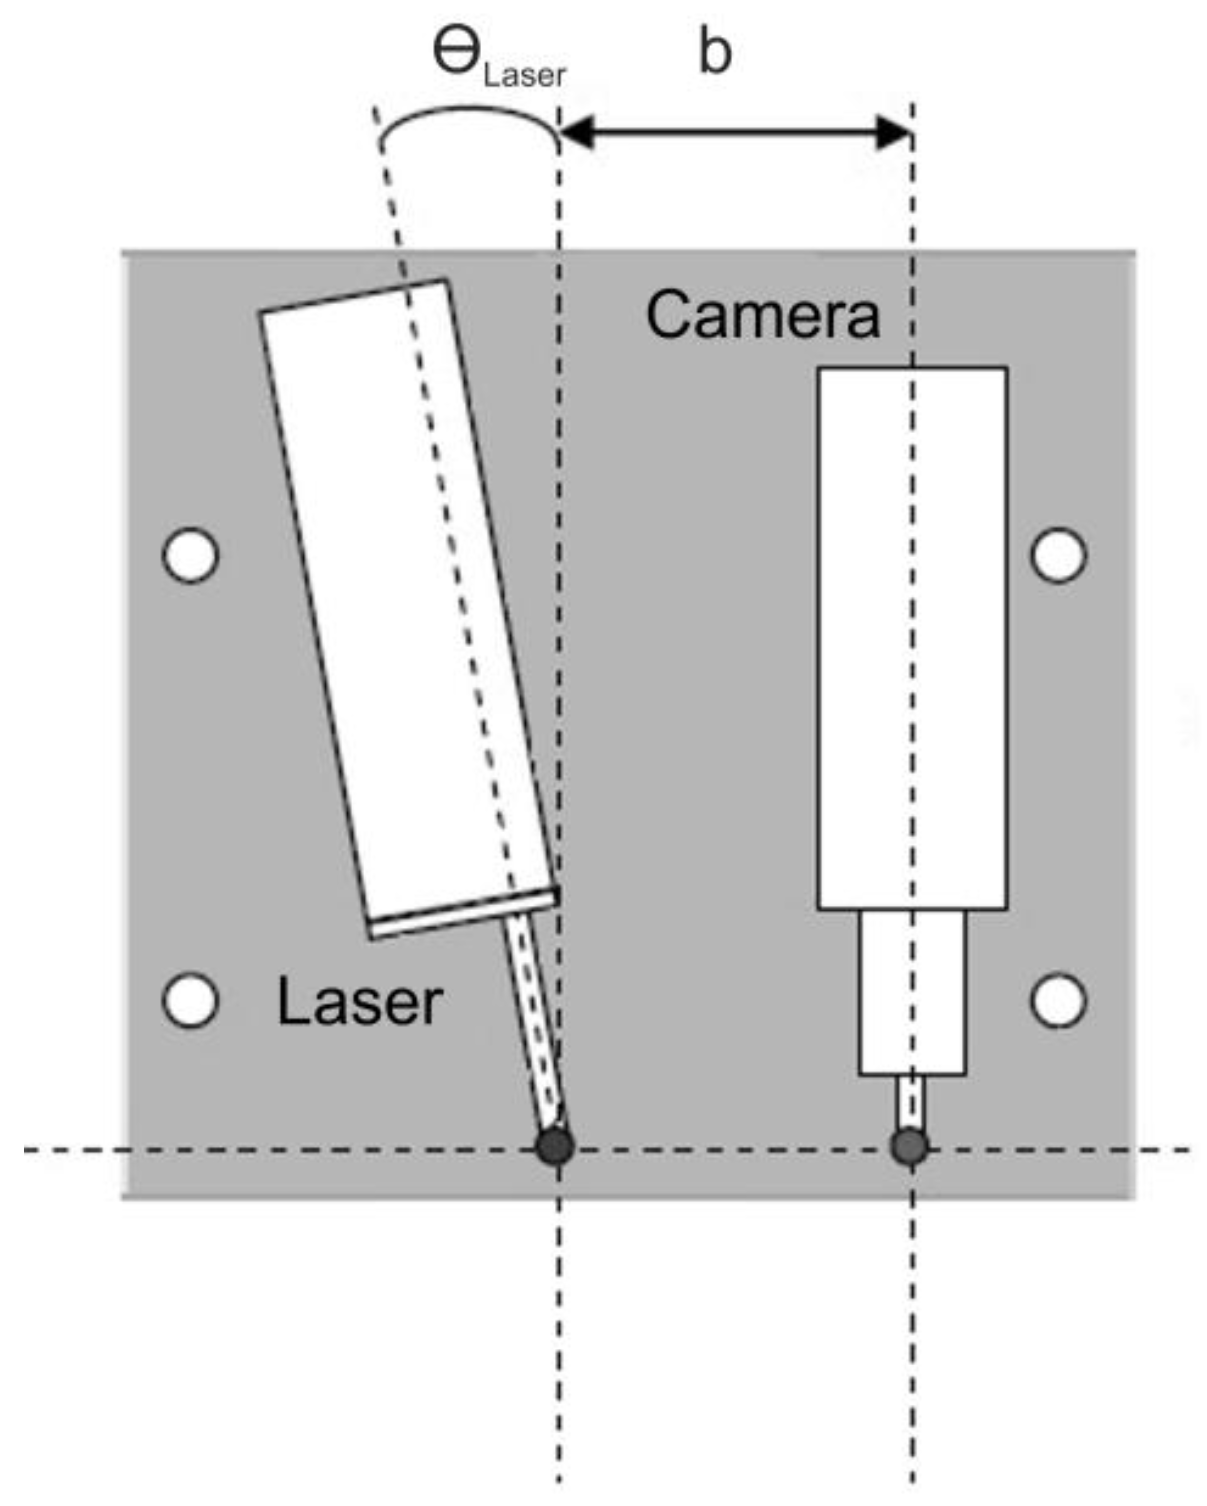
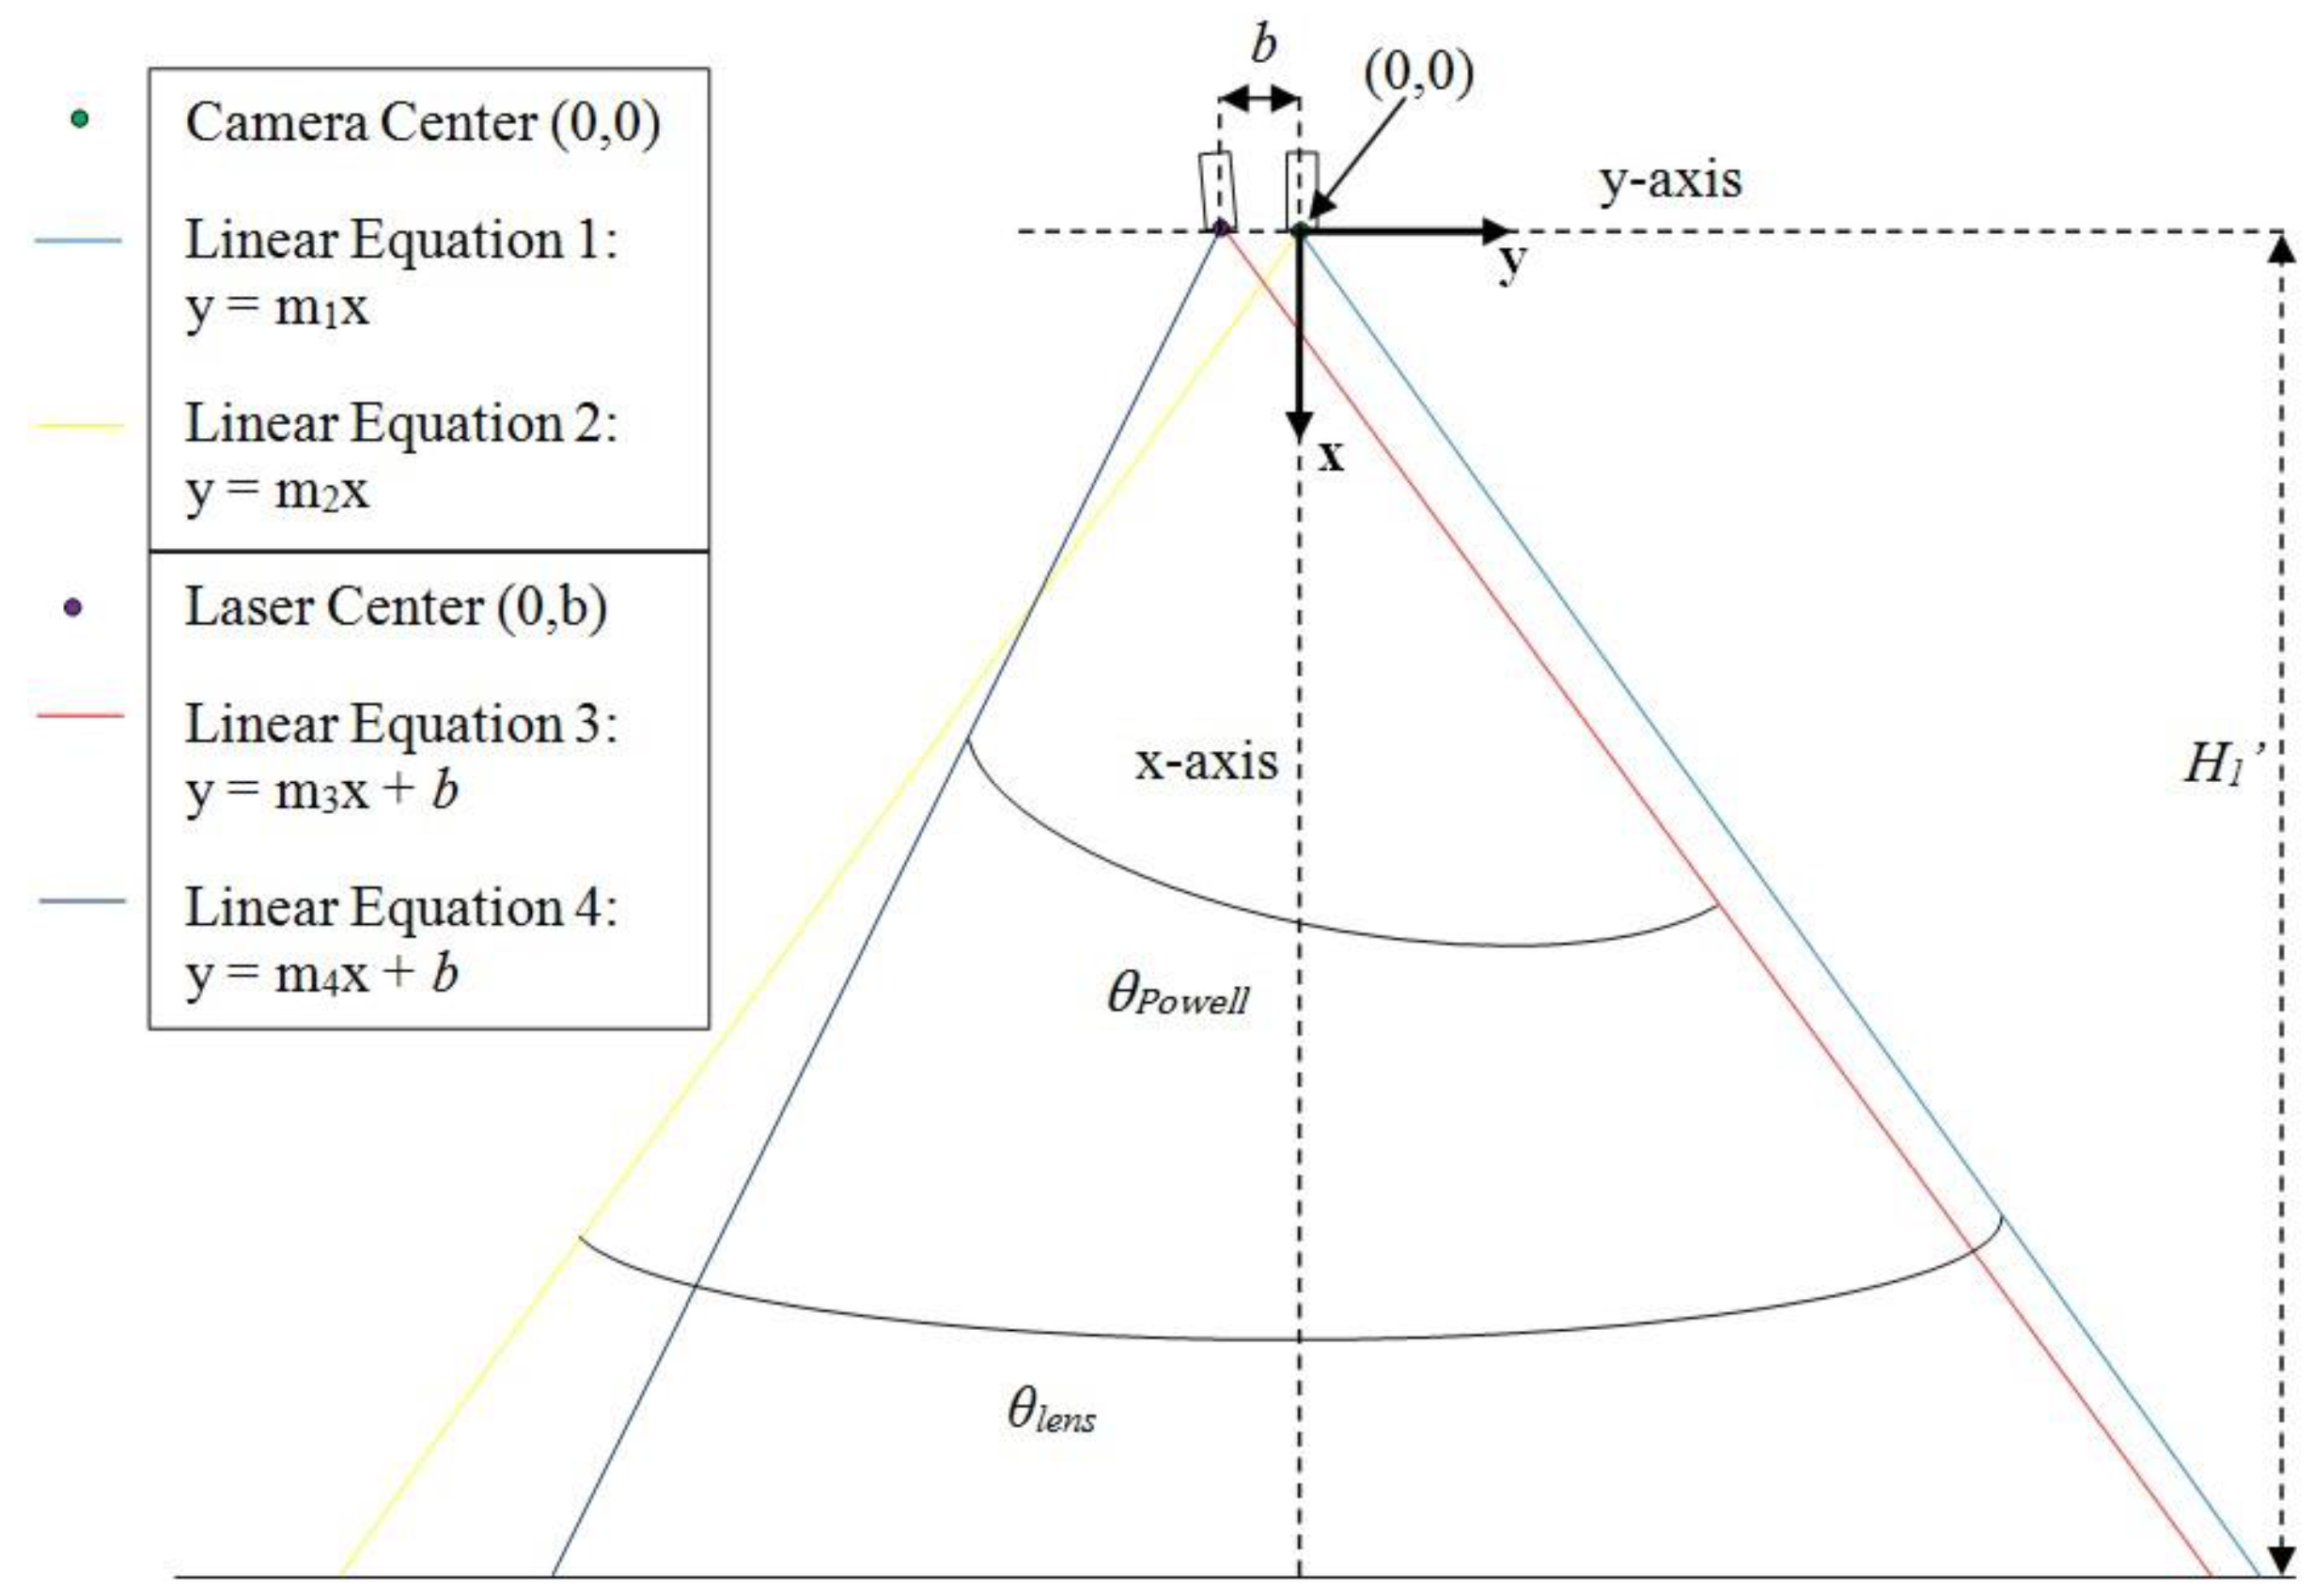
2.3. Camera and Laser Mount
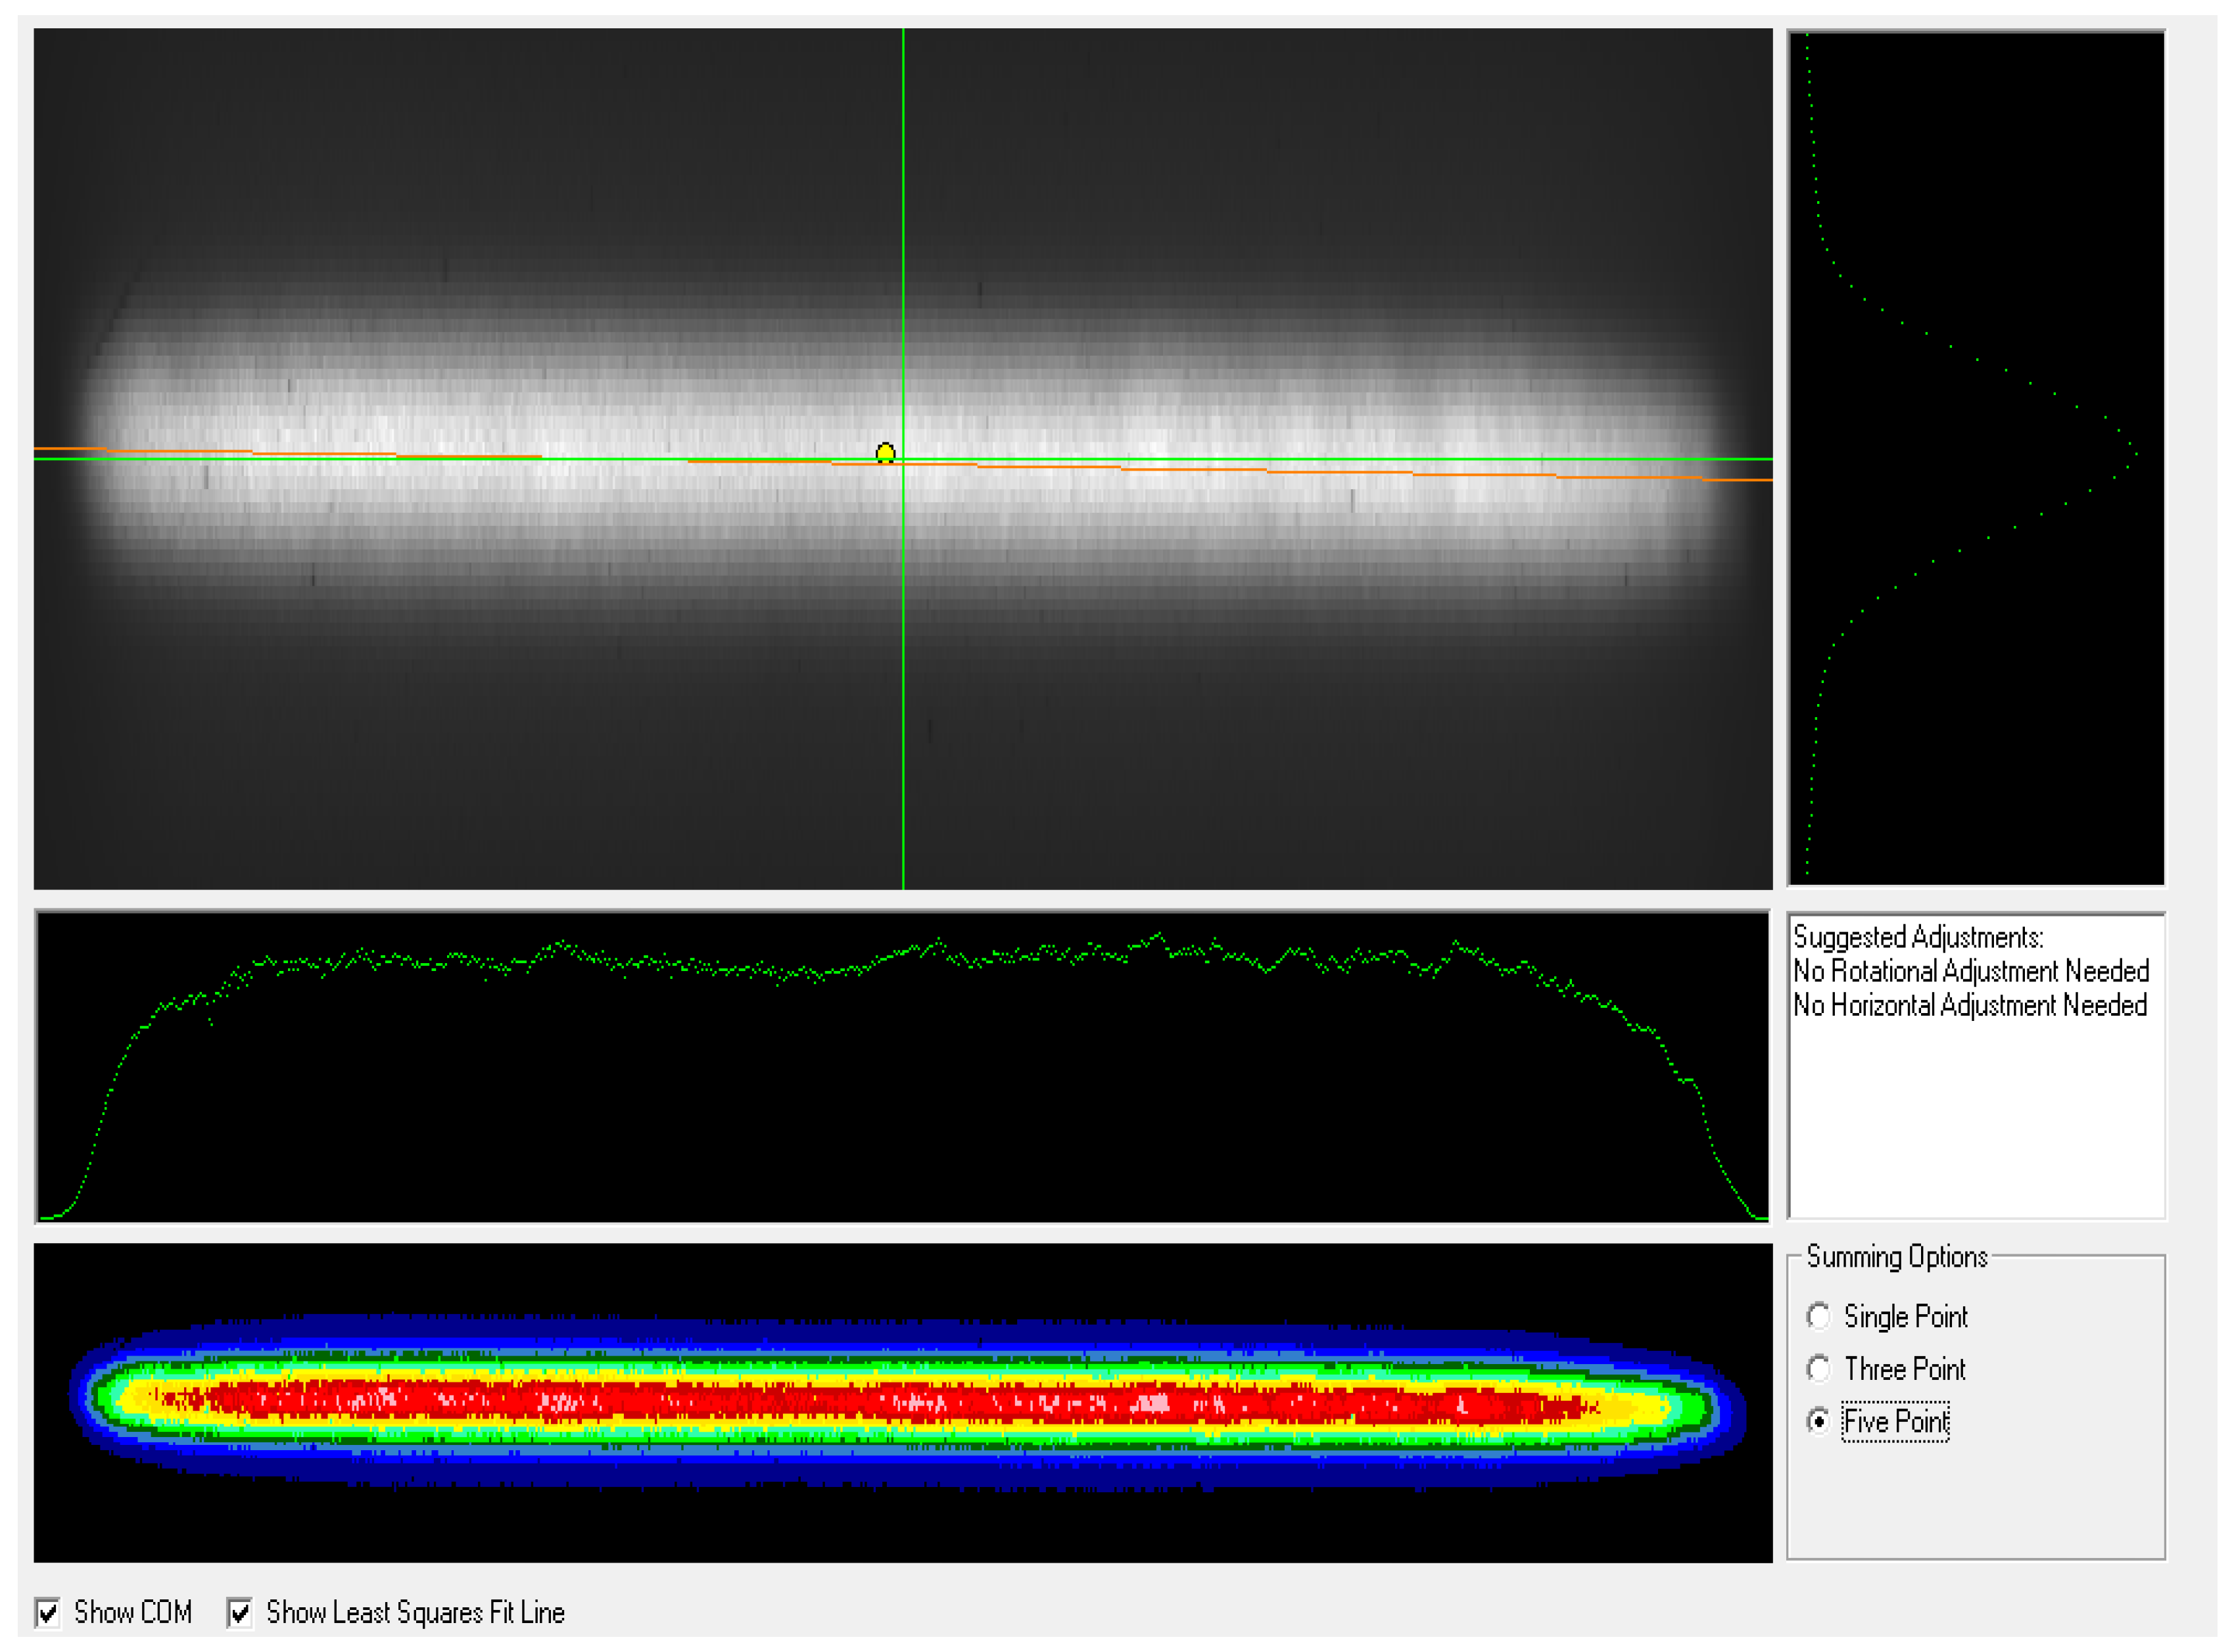
2.4. Control Program
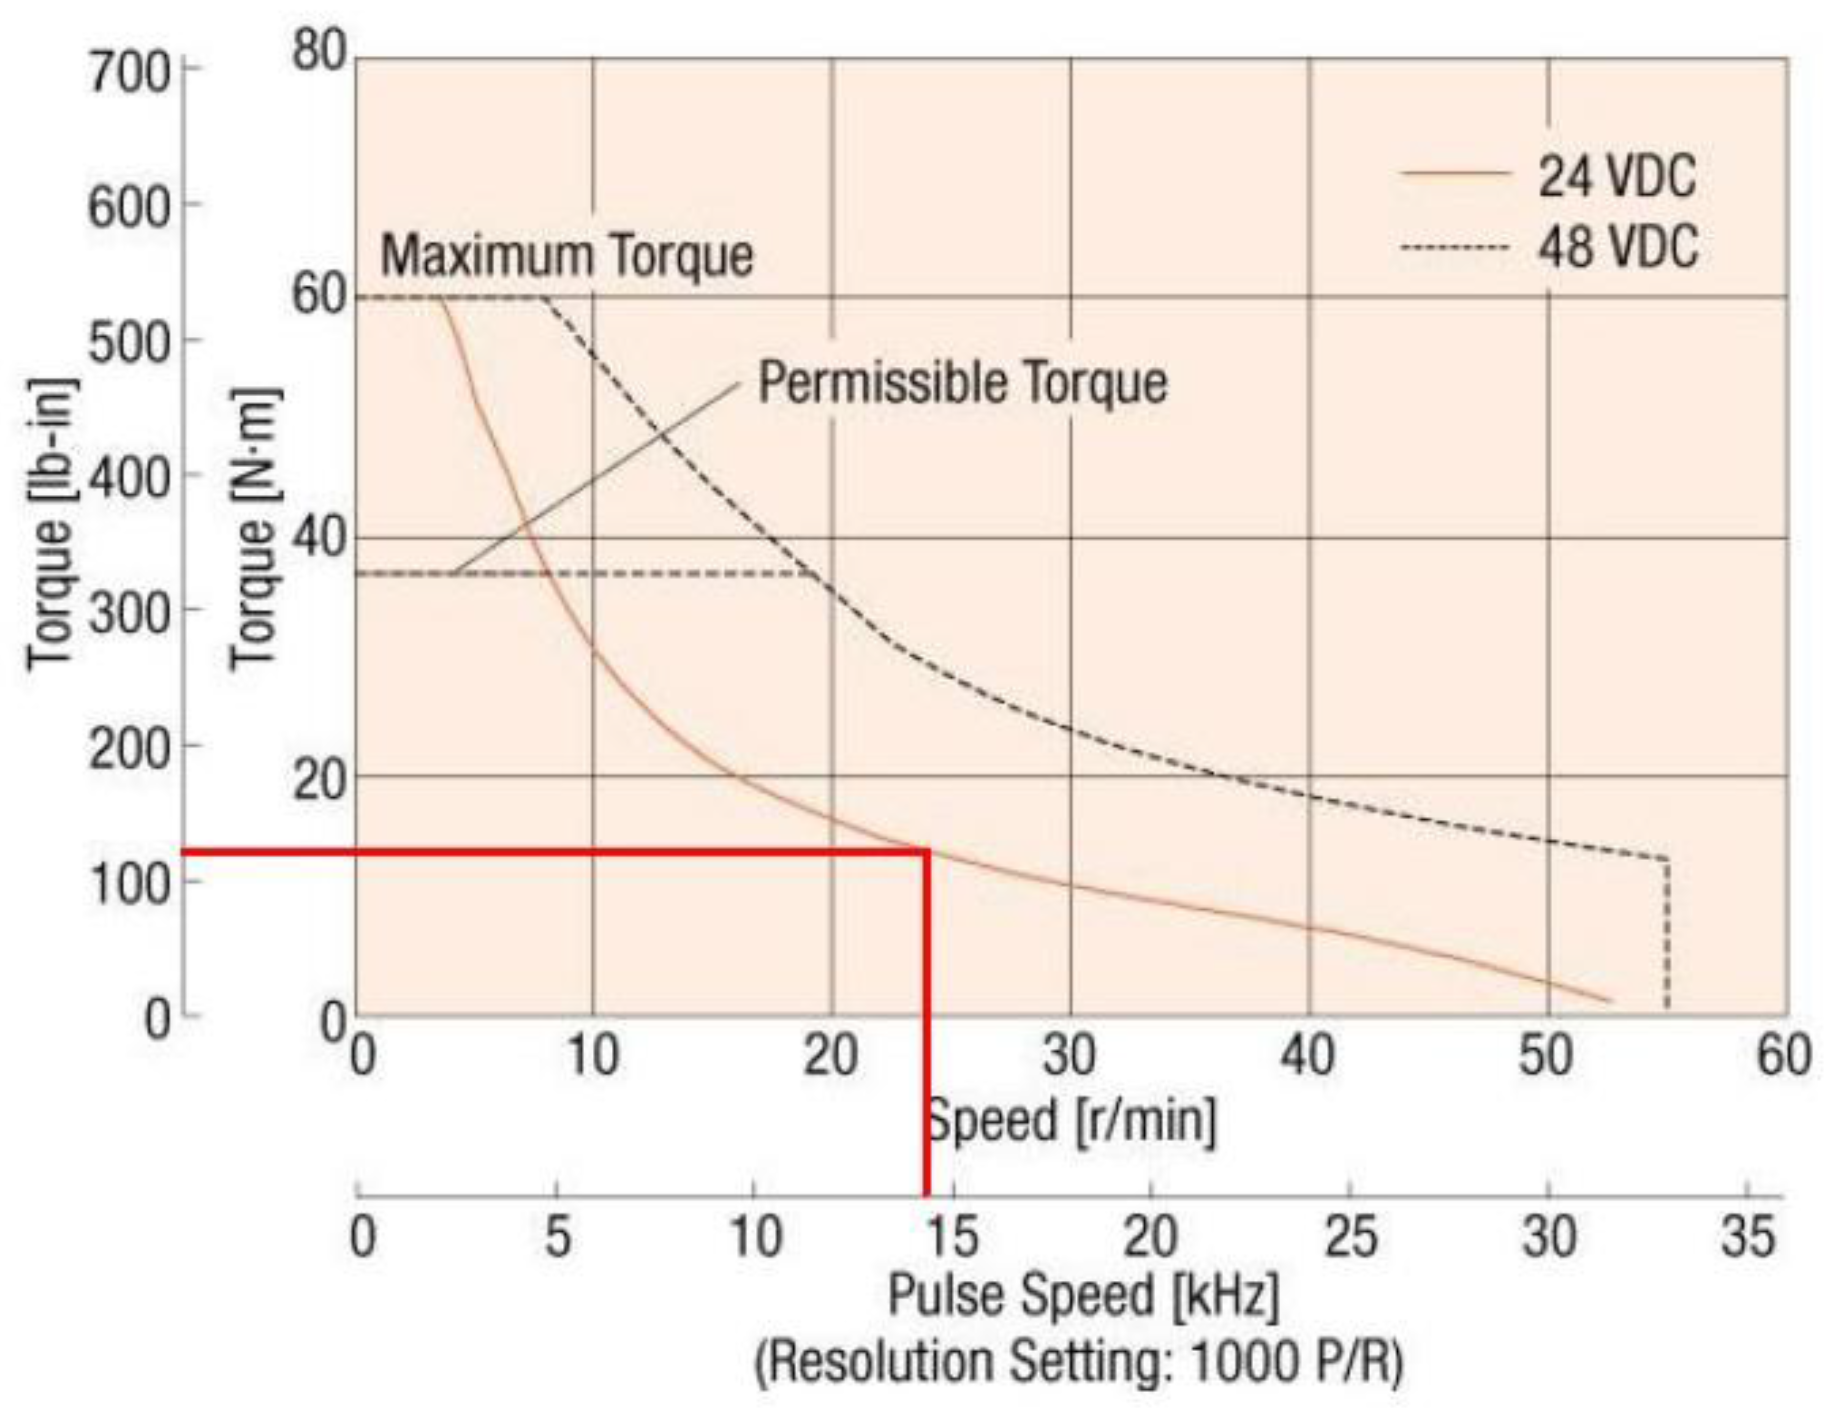
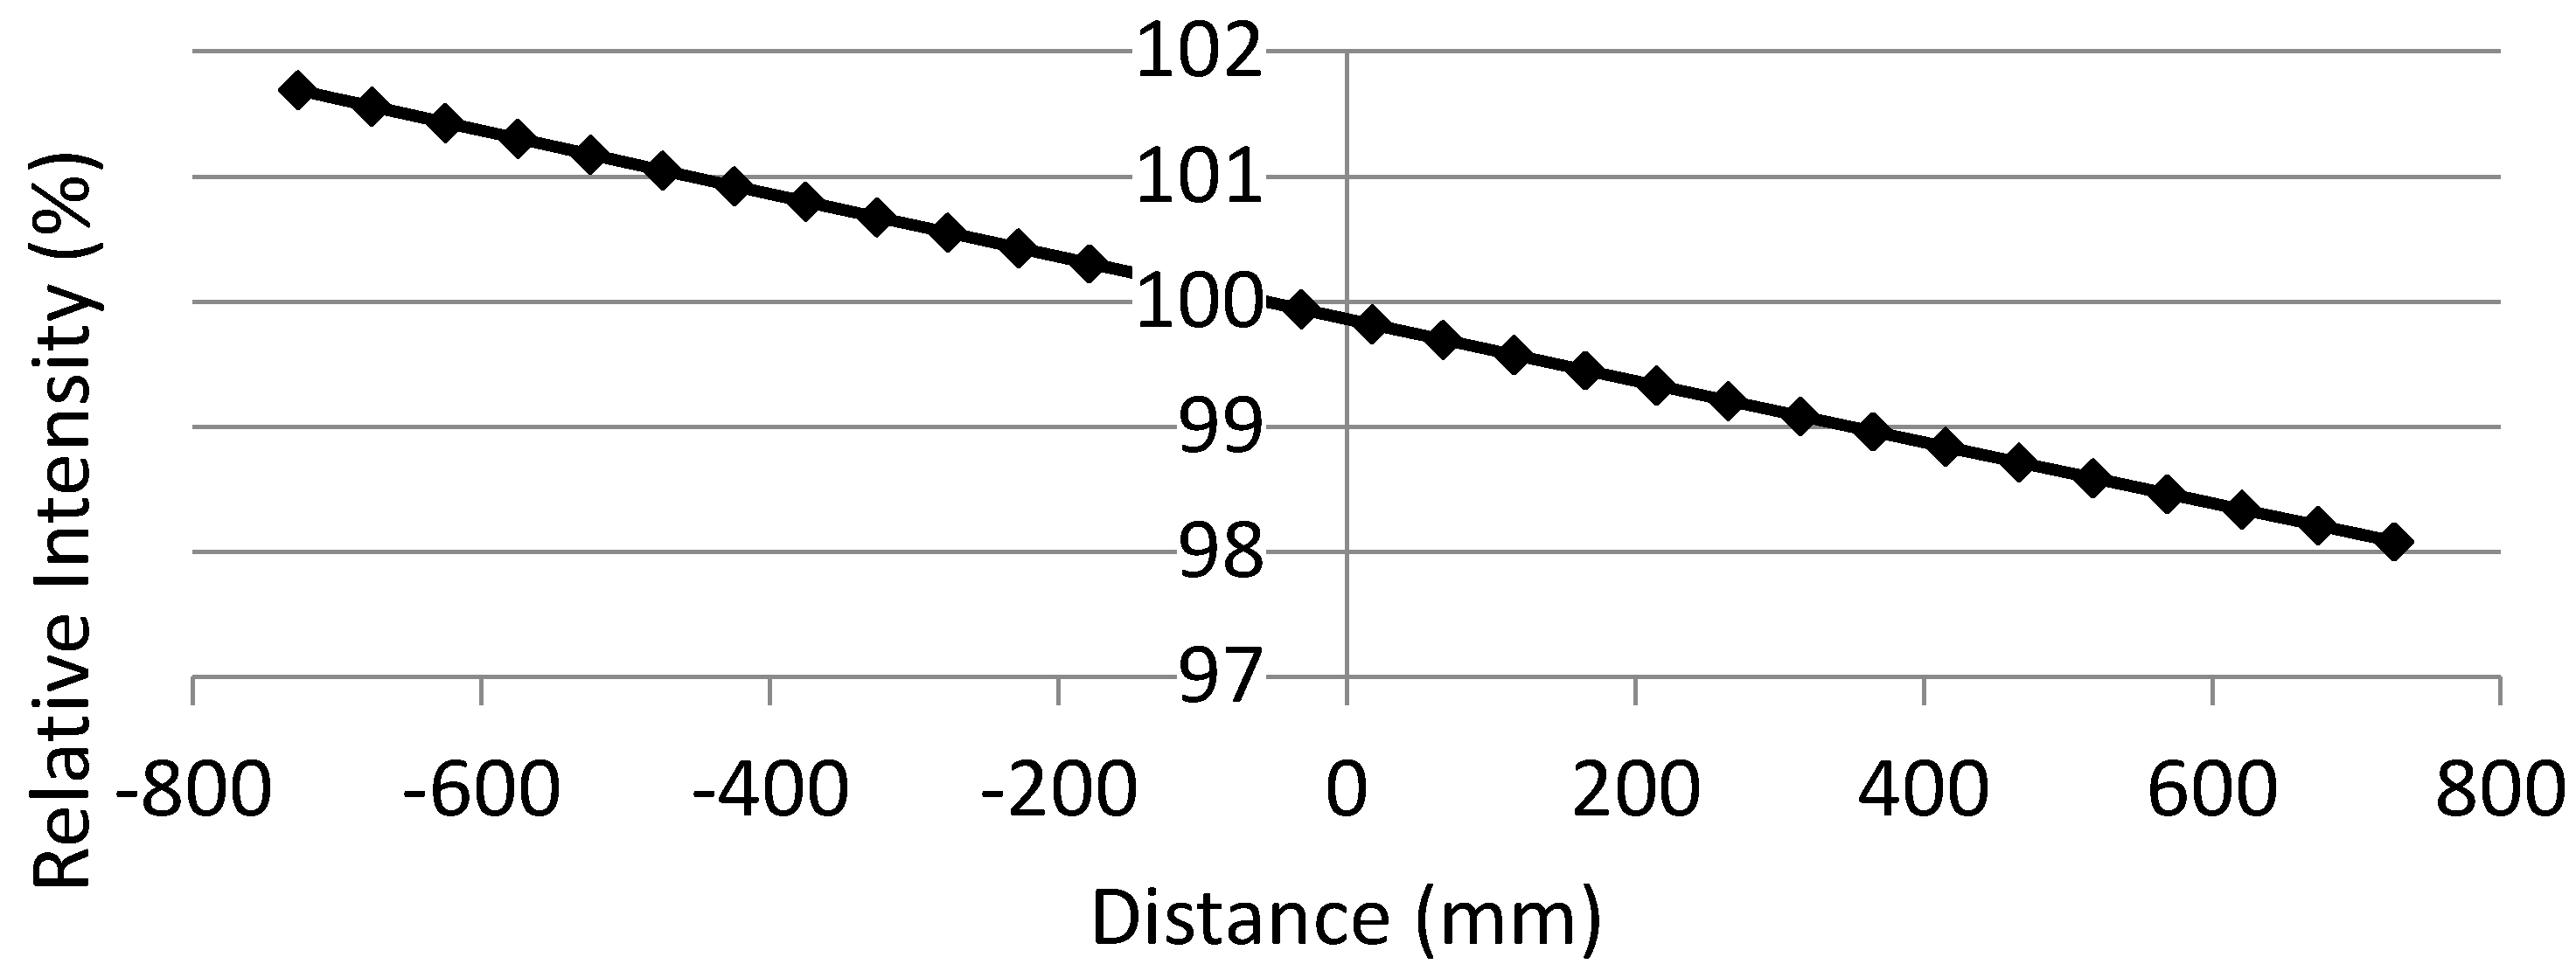
2.5. Cart Performance Testing
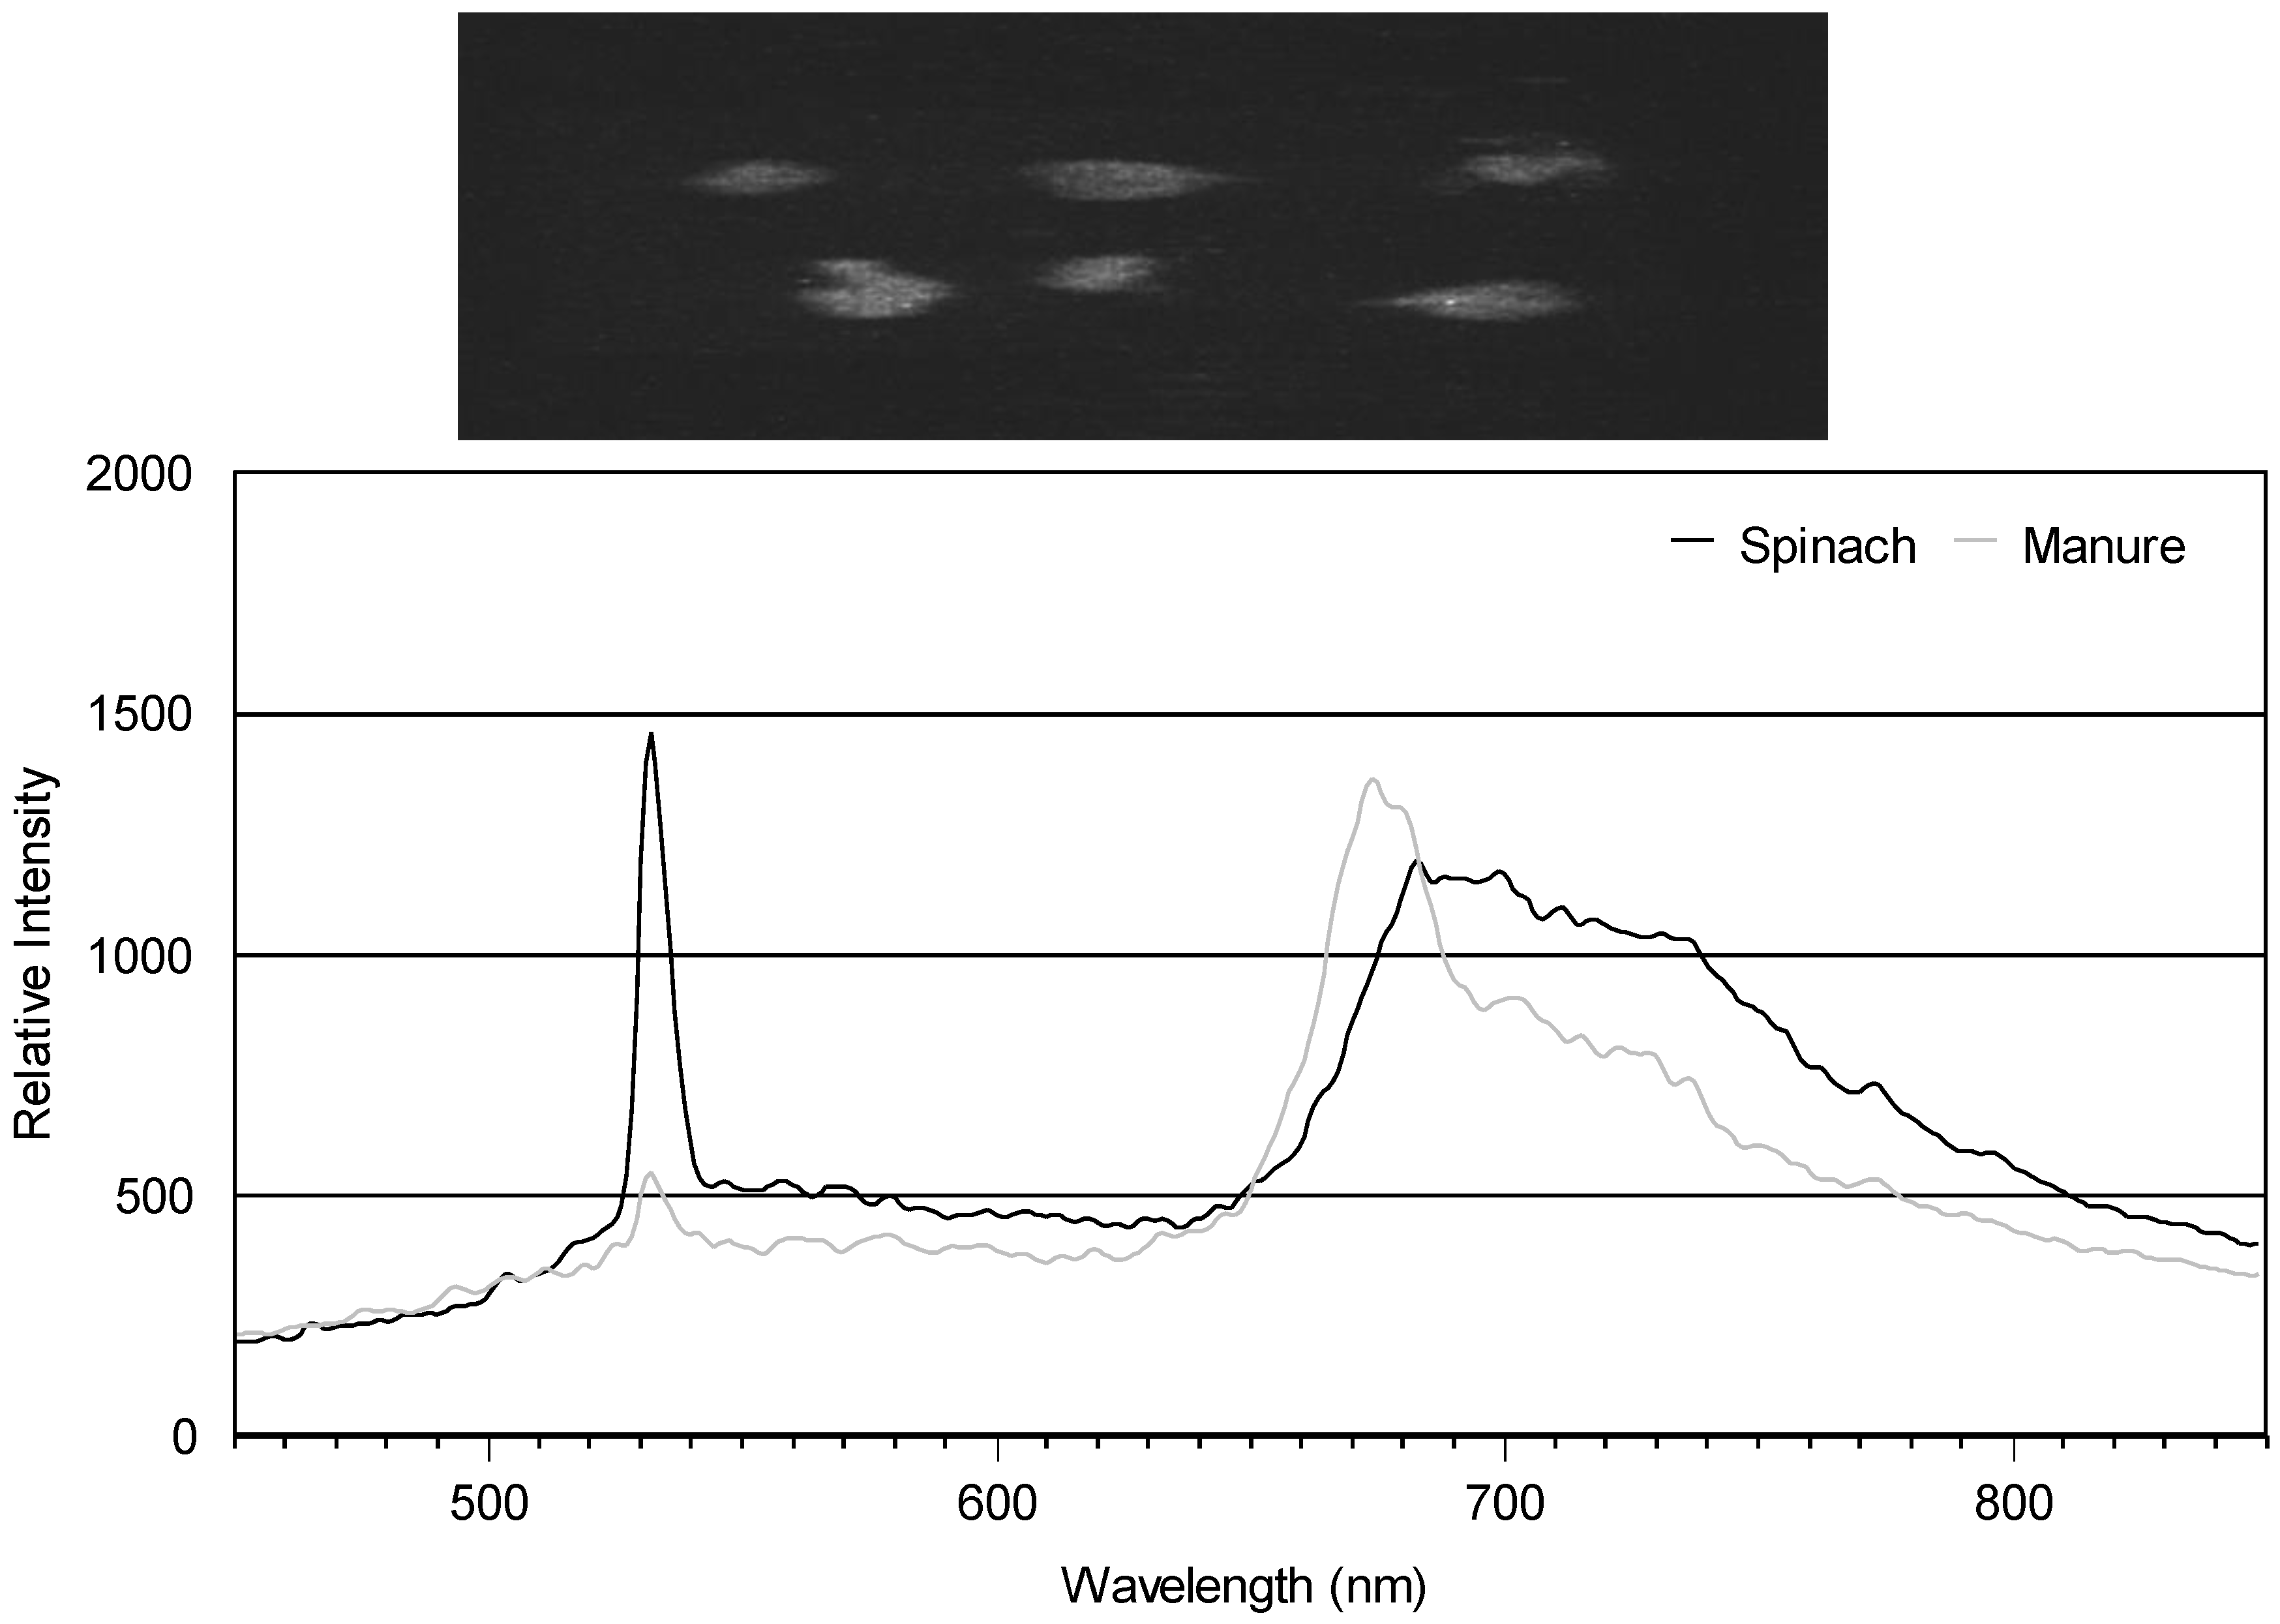
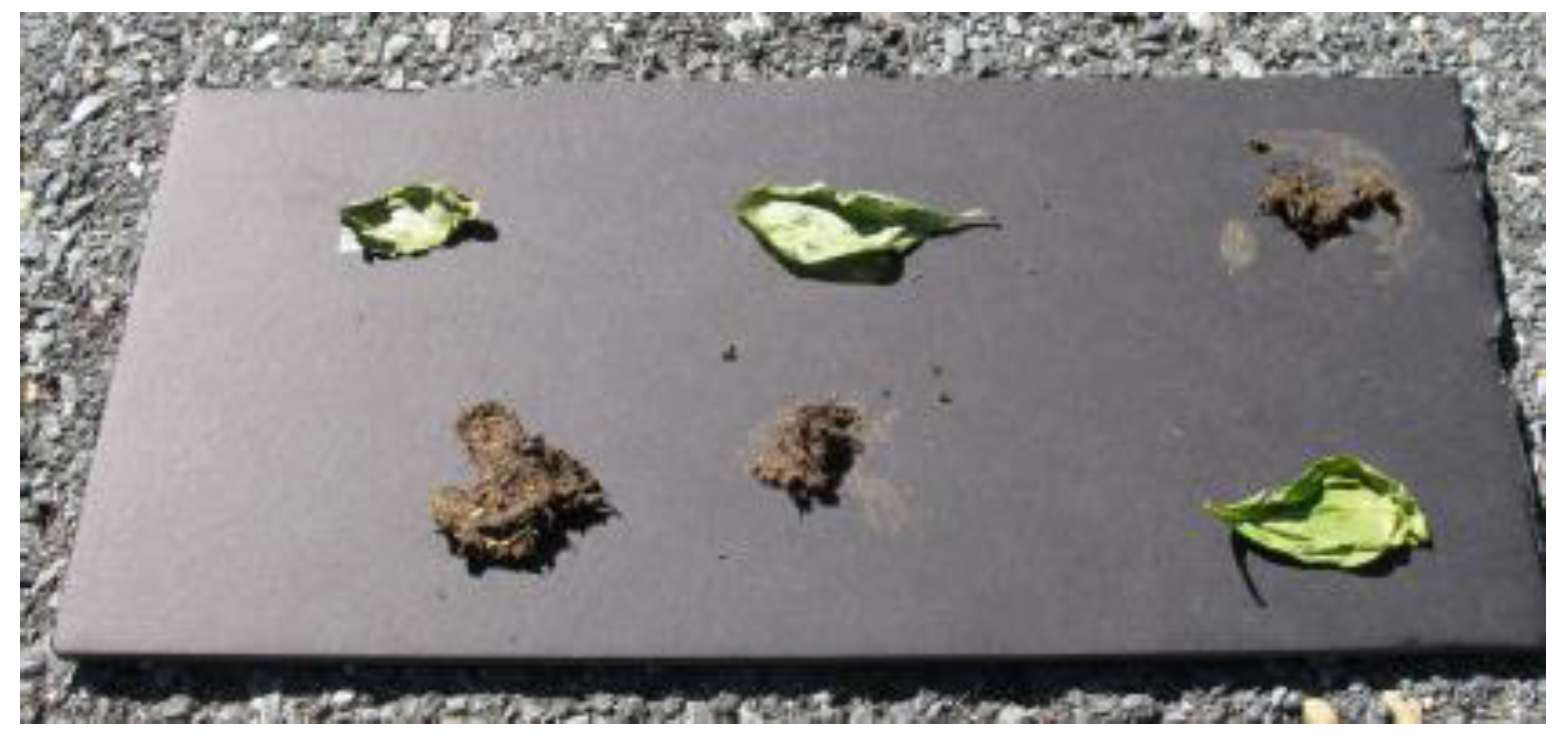
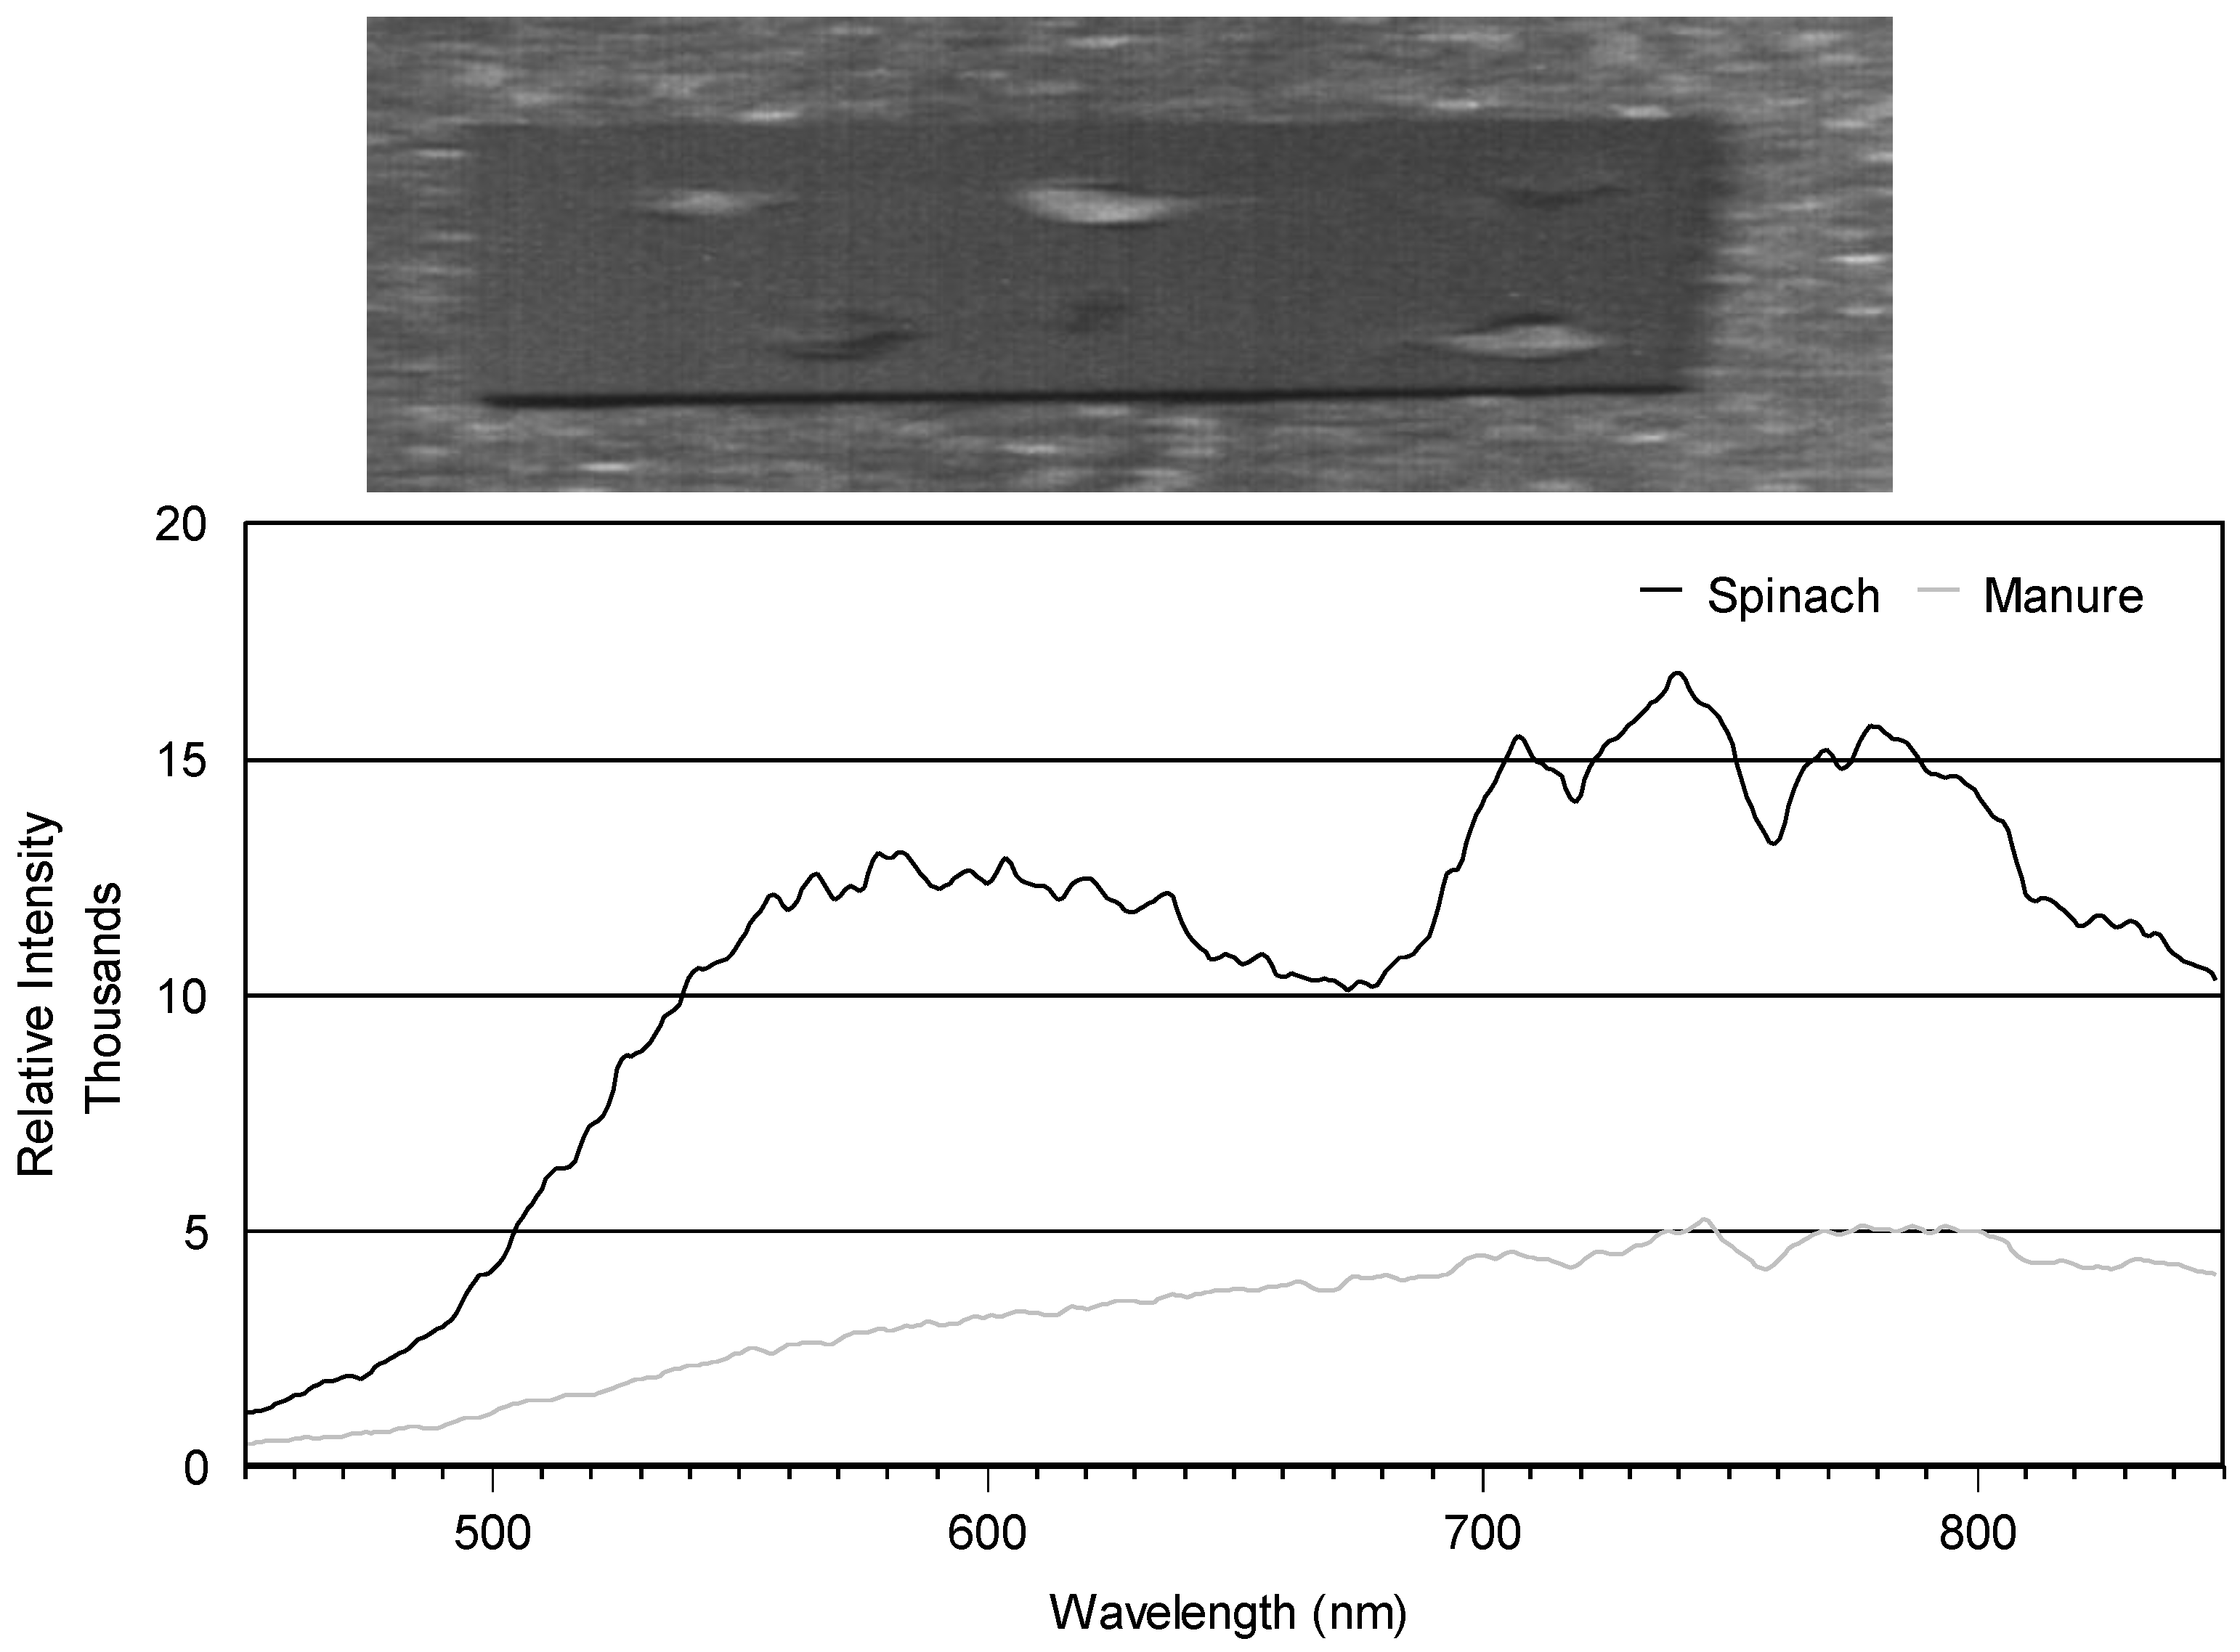
2.6. System Validation
3. Results and Discussion
3.1. Cart Design
3.2. Camera and Laser Mount Design
3.3. Validation
4. Conclusions
Acknowledgments
Author Contributions
Conflicts of Interest
References
- Goetz, A.F. Three decades of hyperspectral remote sensing of the Earth: A personal view. Remote Sens. Environ. 2009, 113, S5–S16. [Google Scholar] [CrossRef]
- Geladi, P.; Burger, J.; Lestander, T. Hyperspectral imaging: Calibration problems and solutions. Chemom. Intell. Lab. Syst. 2004, 72, 209–217. [Google Scholar] [CrossRef]
- Kim, M.S.; Chen, Y.R.; Mehl, P.M. Hyperspectral reflectance and fluorescence imaging system for food quality and safety. Trans ASAE 2001, 44, 721–730. [Google Scholar]
- Kim, M.S.; Lefcourt, A.M.; Chen, Y.R. Multispectral laser-induced fluorescence imaging system for large biological samples. Appl. Opt. 2003, 42, 3927–3933. [Google Scholar] [CrossRef] [PubMed]
- Kistler, R.R. Designing and Building an Automated Cart and a Hyperspectral Laser-Induced Fluorescence Imaging System for Detection of Fecal Material in Produce Fields. Master’s Thesis, University of Maryland, Baltimore County, Baltimore, MD, USA, 2015. [Google Scholar]
- Lefcourt, A.M.; Kim, M.S.; Chen, Y.R. Automated detection of fecal contamination of apples by multispectral laser-induced fluorescence imaging. Appl. Opt. 2003, 42, 3935–3943. [Google Scholar] [CrossRef] [PubMed]
- Lefcourt, A.M.; Kim, M.S.; Chen, Y.R. Detection of fecal contamination in apples calyx by multispectral laser-induced fluorescence. Trans. ASAE 2005, 48, 1587–1593. [Google Scholar] [CrossRef]
- Lefcourt, A.M.; Kim, M.S.; Chen, Y.R. Detection of fecal contamination on apples with nanosecond-scale time-resolved imaging of laser-induced fluorescence. Appl. Opt. 2005, 44, 1160–1170. [Google Scholar] [CrossRef] [PubMed]
- Lefcourt, A.M.; Kim, M.S.; Chen, Y.R. Use of Nanosecond Scale, Time-Resolved, Imaging to Differentiate Contemporaneous Responses from Multiple Substances. U.S. Patent 7,547,508 B1, 16 June 2009. [Google Scholar]
- Tewey, K.J. Time-Resolved Hyperspectral Line-Scan Imaging of Pulsed-Laser Induced Fluorescence: Food Safety Inspection. Master’s Thesis, University of Maryland, Baltimore County, Baltimore, MD, USA, 2013. [Google Scholar]
- Centers for Disease Control and Prevention (CDC). CDC Estimates of Foodborne Illness in the United States: Findings. 2011. Available online: https://www.cdc.gov/foodborneburden/pdfs/factsheet_a_findings_updated4-13.pdf (accessed on 19 September 2016). [Google Scholar]
- Painter, J.A.; Hoekstra, R.M.; Ayers, T.; Tauxe, R.V.; Braden, C.R.; Angulo, F.J. Attribution of foodborne illnesses, hospitalizations, and deaths to food commodities by using outbreaks data, United States, 1998–2008. Emerg. Infect. Dis. 2013, 19, 407–415. [Google Scholar] [CrossRef] [PubMed]
- Food and Drug Administration (FDA). Guidance for Industry: Guide to Minimize Microbial Food Safety Hazards for Fresh Fruits and Vegetables. 2008. Available online: http://www.fda.gov/Food/GuidanceRegulation/GuidanceDocumentsRegulatoryInformation/ProducePlantProducts/ucm064458.htm (accessed on 19 September 2016). [Google Scholar]
- The California Leafy Green Products Handler Marketing Agreement (LGMA). Commodity Specific Food Safety Guidelines for the Production and Harvest of Lettuce and Leafy Greens. 2013. Available online: http://www.lgma.ca.gov/wp-content/uploads/2014/09/California-LGMA-metrics-08-26-13-Final.pdf (accessed on 19 September 2016). [Google Scholar]


© 2016 by the authors; licensee MDPI, Basel, Switzerland. This article is an open access article distributed under the terms and conditions of the Creative Commons Attribution (CC-BY) license (http://creativecommons.org/licenses/by/4.0/).
Share and Cite
Lefcourt, A.M.; Kistler, R.; Gadsden, S.A.; Kim, M.S. Automated Cart with VIS/NIR Hyperspectral Reflectance and Fluorescence Imaging Capabilities. Appl. Sci. 2017, 7, 3. https://doi.org/10.3390/app7010003
Lefcourt AM, Kistler R, Gadsden SA, Kim MS. Automated Cart with VIS/NIR Hyperspectral Reflectance and Fluorescence Imaging Capabilities. Applied Sciences. 2017; 7(1):3. https://doi.org/10.3390/app7010003
Chicago/Turabian StyleLefcourt, Alan M., Ross Kistler, S. Andrew Gadsden, and Moon S. Kim. 2017. "Automated Cart with VIS/NIR Hyperspectral Reflectance and Fluorescence Imaging Capabilities" Applied Sciences 7, no. 1: 3. https://doi.org/10.3390/app7010003